The E.W. Scripps Company (NASDAQ: SSP) is a diversified media company focused on creating a better-informed world. As one of the nation’s largest local TV broadcasters, Scripps serves communities with quality, objective local journalism and operates a portfolio of 61 stations in 41 markets. The Scripps Networks reach nearly every American through the national news outlets Court TV and Newsy and popular entertainment brands ION, Bounce, Defy TV, Grit, ION Mystery, Laff and TrueReal. Scripps is the nation’s largest holder of broadcast spectrum. Scripps runs an award-winning investigative reporting newsroom in Washington, D.C., and is the longtime steward of the Scripps National Spelling Bee. Founded in 1878, Scripps has held for decades to the motto, “Give light and the people will find their own way.”
Michael Kupinski, Director of Research, Equity Research Analyst, Digital, Media & Technology , Noble Capital Markets, Inc.
Jacob Mutchler, Research Associate, Noble Capital Markets, Inc.
Refer to the full report for the price target, fundamental analysis, and rating.
Q3 Core outperforms peers. Core advertising increased 2%, outperforming its peers, which on average declined 2% in the quarter. In addition, the company overachieved adj. EBITDA on better than expected expense savings on employee costs across both operating segments.
Q4 core outlook outperforms peers as well. Management guided core advertising to increase 10% in Q4, significantly better than its peers, with most guiding flat to down as much as 5%. The biggest disappointment is in its Scripps Networks division, with Q4 revenues guided down low double-digits, impacted by the absence of Political and Medicare enrollment advertising due to the government shutdown.
Equity Research is available at no cost to Registered users of Channelchek. Not a Member? Click ‘Join’ to join the Channelchek Community. There is no cost to register, and we never collect credit card information.
This Research is provided by Noble Capital Markets, Inc., a FINRA and S.E.C. registered broker-dealer (B/D).
*Analyst certification and important disclosures included in the full report. NOTE: investment decisions should not be based upon the content of this research summary. Proper due diligence is required before making any investment decision.
CoreCivic is a diversified, government-solutions company with the scale and experience needed to solve tough government challenges in flexible, cost-effective ways. We provide a broad range of solutions to government partners that serve the public good through high-quality corrections and detention management, a network of residential and non-residential alternatives to incarceration to help address America’s recidivism crisis, and government real estate solutions. We are the nation’s largest owner of partnership correctional, detention and residential reentry facilities, and believe we are the largest private owner of real estate used by government agencies in the United States. We have been a flexible and dependable partner for government for nearly 40 years. Our employees are driven by a deep sense of service, high standards of professionalism and a responsibility to help government better the public good. Learn more at www.corecivic.com.
Joe Gomes, CFA, Managing Director, Equity Research Analyst, Generalist , Noble Capital Markets, Inc.
Refer to the full report for the price target, fundamental analysis, and rating.
Overview. With four new contracts during the quarter, CoreCivic made substantial progress in contracting to use a significant portion of its idle facility capacity in the quarter. The four new contracts effective in the third quarter are expected to generate approximately $320 million of annual revenue once the facilities achieve stabilized occupancy. Notably, CoreCivic’s detention populations and revenues have been unaffected by the government shutdown.
3Q25 Results. Revenue of $580.4 million rose 18.1% y-o-y, driven by increased populations. We were at $550 million. CoreCivic recorded adjusted EBITDA of $88.8 million, up 6.6% y-o-y, but slightly below our $91.8 million estimate. Adjusted EPS was $0.24, up 26.3% y-o-y and in-line with our $0.27 estimate. Normalized FFO was $0.48, up 11.6% y-o-y and in-line with our $0.48 estimate.
Equity Research is available at no cost to Registered users of Channelchek. Not a Member? Click ‘Join’ to join the Channelchek Community. There is no cost to register, and we never collect credit card information.
This Company Sponsored Research is provided by Noble Capital Markets, Inc., a FINRA and S.E.C. registered broker-dealer (B/D).
*Analyst certification and important disclosures included in the full report. NOTE: investment decisions should not be based upon the content of this research summary. Proper due diligence is required before making any investment decision.
Joe Gomes, CFA, Managing Director, Equity Research Analyst, Generalist , Noble Capital Markets, Inc.
Refer to the full report for the price target, fundamental analysis, and rating.
Data. Bit Digital reported its monthly Ethereum (“ETH”) treasury and staking metrics for the month of October 2025. As of October 31, 2025, the Company held approximately 153,547 ETH, versus 121,187 ETH at the end of September. Included in the ETH holdings were approximately 15,139 ETH and ETH-equivalents held in an externally managed fund, and approximately 5,132 ETH presented on an as-converted basis from LsETH using the Coinbase conversion rate as of 10/31/25. The Company’s total staked ETH was approximately 132,480 as of October 31st.
Yield and Value. Staking operations generated approximately 249 ETH in rewards during October, representing an annualized yield of approximately 2.93%. Based on a closing ETH price of $3,845.79, as of October 31, 2025, the market value of the Company’s ETH holdings was approximately $590.5 million.
Equity Research is available at no cost to Registered users of Channelchek. Not a Member? Click ‘Join’ to join the Channelchek Community. There is no cost to register, and we never collect credit card information.
This Company Sponsored Research is provided by Noble Capital Markets, Inc., a FINRA and S.E.C. registered broker-dealer (B/D).
*Analyst certification and important disclosures included in the full report. NOTE: investment decisions should not be based upon the content of this research summary. Proper due diligence is required before making any investment decision.
Rumble Inc. announced plans to acquire Northern Data AG, a European leader in artificial intelligence and high-performance computing infrastructure, marking a transformative moment for the company’s growing cloud division. The agreement represents a bold step in Rumble’s “Freedom-First” vision—an initiative centered on building technology that prioritizes privacy, independence, and resilience over centralized control.
Under the terms of the deal, Rumble will launch a voluntary public exchange offer to Northern Data shareholders, granting them newly issued Rumble shares in return. Once completed, the transaction will give Rumble access to one of Europe’s largest GPU fleets—approximately 22,000 Nvidia units, including the latest H100 and H200 chips—and a globally distributed network of data centers. This infusion of infrastructure will allow Rumble to expand its cloud services dramatically while strengthening its foothold in the global AI ecosystem.
The acquisition also accelerates Rumble’s international growth strategy, extending its reach beyond North America into major European markets such as Germany, Sweden, Norway, Portugal, the Netherlands, and the United Kingdom. Northern Data’s energy-efficient data centers and liquid-cooled GPU technology will provide Rumble with a strong foundation to compete in high-performance computing and AI training at scale.
A major backer of the deal is Tether, which made a $775 million strategic investment in Rumble earlier this year. Tether’s continued involvement underscores the growing alignment between decentralized finance and digital infrastructure, and the company is expected to serve as a key customer following the transaction’s completion. Together, Rumble, Northern Data, and Tether aim to form a vertically integrated AI ecosystem designed to challenge the dominance of established technology giants.
In addition to its infrastructure assets, Northern Data brings expertise in managing complex compute operations and optimizing power efficiency—critical advantages as demand for GPU-based AI processing surges worldwide. The company’s Maysville, Georgia facility alone is expected to deliver up to 180 megawatts of capacity once complete, contributing significantly to Rumble’s total data center output.
Beyond scaling capacity, Rumble expects the acquisition to fuel innovation across its video, creator, and advertising businesses. Access to advanced AI hardware will accelerate the company’s efforts to integrate machine learning into content delivery, recommendation systems, and advertising solutions. The move also supports Rumble’s broader ambition to develop complementary services such as AI chatbots, cloud productivity tools, and financial applications under the Rumble Wallet brand.
The exchange offer is expected to close in the second quarter of 2026, pending regulatory approvals. Northern Data shareholders will own roughly 30% of the combined company after the transaction, reflecting the strategic significance of the merger. Once finalized, Northern Data plans to delist its shares, with no separate offer required since it is not traded on a regulated market.
For Rumble, the acquisition represents far more than an infrastructure upgrade—it signals an intent to redefine how technology infrastructure is built and governed. By merging AI computing power, distributed data networks, and financial independence, the company aims to create a sustainable foundation for a new era of digital freedom.
Bitcoin prices are facing their sharpest correction in months, with the cryptocurrency falling nearly 20% from its record high above $126,000 in early October. After briefly slipping below the key $100,000 threshold, Bitcoin is now trading near its lowest level in six months, leaving investors wondering whether the current downturn signals a temporary pullback or the start of a longer bear phase.
Analysts point to a combination of factors driving the decline, including profit-taking by early adopters and large-scale liquidations of leveraged positions. Data from Compass Point shows that long-term holders have sold more than 1 million Bitcoin since late June, marking one of the most significant waves of distribution in recent history. The selloff has weakened key support levels around $117,000 and $112,000, triggering stop-loss cascades and forcing many leveraged traders to unwind positions.
Market strategists caution that sentiment remains fragile. Markus Thielen of 10X Research noted that Bitcoin has failed to reclaim previous support zones, suggesting that the market may still have room to correct further before finding stability. According to Thielen, the next few weeks could be pivotal as investors reassess risk amid tightening liquidity and shifting macroeconomic dynamics. His firm warns that a drop below $93,000 could open the door to deeper losses, potentially testing the $70,000 level if liquidation pressures intensify.
The broader macro backdrop has also turned less favorable. The U.S. dollar has staged a rebound in recent weeks, exerting downward pressure on risk assets, including cryptocurrencies. Historically, Bitcoin tends to struggle when the dollar strengthens, as it reduces international purchasing power and dampens speculative demand. Additionally, the ongoing U.S. government shutdown has tightened liquidity conditions across financial markets, further weighing on investor sentiment.
Still, not all analysts are pessimistic. Some see this correction as a healthy reset in a long-term uptrend that remains intact. JPMorgan recently suggested that much of the forced deleveraging that triggered October’s decline has already played out. The bank’s analysts argue that rising volatility in gold has made Bitcoin relatively more attractive to investors seeking alternative stores of value. Their projections suggest Bitcoin could rebound to as high as $170,000 over the next 6 to 12 months, especially if market confidence stabilizes and macro conditions improve.
Potential catalysts could come from the policy side. A possible Federal Reserve rate cut in December and speculation about a more dovish leadership change when Chair Jerome Powell’s term expires in May could inject new optimism into markets. Similarly, the eventual resolution of the government shutdown may bring renewed liquidity into the system, which some believe could spill over into digital assets.
For now, the crypto market remains caught between optimism about long-term adoption and the short-term realities of profit-taking and tightening liquidity. While Bitcoin’s resilience near the $100,000 mark shows that investor interest remains strong, the coming weeks will likely determine whether this pullback marks a buying opportunity or the start of a more prolonged consolidation phase.
Consumer confidence in the United States has dropped to its lowest level in three years as the ongoing government shutdown weighs heavily on Americans’ views of the economy and their own financial situations. The University of Michigan’s preliminary consumer sentiment index for November fell to 50.3, marking a six percent decline from October and nearly a 30 percent decrease compared to the same month last year.
The latest reading reflects widespread unease among households. Many are increasingly worried about the effects of the prolonged government shutdown, which has now stretched past a month and become the longest in U.S. history. The shutdown has disrupted access to key government data on inflation, employment, and growth, leaving businesses and consumers uncertain about the true state of the economy.
Without fresh official data, Americans are relying on private reports that paint a concerning picture. Job cuts have surged, and labor market conditions appear to be softening. A report from Challenger, Gray & Christmas indicated that October saw the highest number of announced layoffs in more than two decades. Job openings have slowed, and many unemployed workers are finding it harder to secure new positions. Together, these trends suggest that confidence in the labor market is fading.
The decline in sentiment is not evenly spread across the population. Wealthier households, particularly those with large stock portfolios, remain more optimistic thanks to record highs in the equity markets. This contrast highlights the widening gap between those benefiting from strong financial markets and those struggling with everyday costs. The result is a divided economic landscape where prosperity is unevenly distributed, reinforcing the perception of a two-speed economy.
For most Americans, persistent inflation, higher interest rates, and the uncertainty caused by the shutdown are combining to erode financial stability. Even though inflation has eased from last year’s highs, the prices of essential goods and services remain well above pre-pandemic levels. Meanwhile, delays in government services such as Social Security payments and student loan processing are adding frustration and stress to households already under pressure.
The timing of this drop in confidence is particularly concerning as the country heads into the holiday shopping season. Consumer spending drives much of the U.S. economy, and a downturn in sentiment could translate into weaker retail sales. Businesses that rely on end-of-year spending may face slower demand if consumers choose to save rather than spend amid the growing uncertainty.
Economists warn that if the shutdown continues and confidence remains weak, growth could slow in the early months of 2026. The longer the political stalemate drags on, the greater the risk of long-term damage to household finances and business activity.
Overall, the latest sentiment data suggests that Americans are growing increasingly uneasy about both their personal finances and the broader economy. Until the government resolves the shutdown and restores a sense of stability, confidence is likely to remain depressed and the economic recovery may continue to lose momentum.
FLORHAM PARK, N.J., Nov. 07, 2025 — Conduent Incorporated (Nasdaq: CNDT), a global technology driven business process solutions and services company, today announced its third quarter 2025 financial results.
Cliff Skelton, Conduent President and Chief Executive Officer, stated, “Q3 represents not only a quarter where we met guidance on Adjusted Revenue and Adjusted EBITDA Margin, but also the continuation of our drive toward year-over-year revenue growth. New business signings were consistent year over year and our Public Sector businesses had a particularly strong quarter, despite the cyclical nature of government funding and the Federal government shutdown. As mentioned in Q2 earnings, we continue to be pleased with ongoing Transportation opportunities and momentum. Additionally, as a result of our operational efficiency efforts, Adjusted EBITDA and Adjusted EBITDA Margin improved both year over year and sequentially, in line with guidance. We also deployed AI enhancements with Conduent’s proprietary technology and platforms across document processing, customer experience, and fraud prevention—delivering greater efficiency for clients and further streamlining our internal operations.”
Skelton continued, “Regarding our portfolio rationalization efforts, 87% of our $1B capital allocation target has been achieved to date, and we remain on track to exceed that goal. We continue to be focused on cash generation, sales, and expanding our pipeline opportunities especially within our current client base, while maintaining more than ample liquidity through cash reserves and a recently renewed credit facility. As always, we remain confident in our team and our strategy as we continue to deliver the best value possible to our shareholders and to our clients and their end users.”
Key Financial Q3 2025 Results
($ in millions, except margin and per share data)
Q3 2025
Q3 2024
Current Quarter Y/Y B/(W)
Revenue
$767
$807
(5.0)%
Adjusted Revenue(1)
$767
$781
(1.8)%
GAAP Net Income (Loss)
$(46)
$123
n/m
Adjusted EBITDA(1)
$40
$32
25.0%
Adjusted EBITDA Margin(1)
5.2%
4.1%
110 bps
GAAP Income (Loss) Before Income Tax
$(38)
$159
n/m
GAAP Diluted EPS
$(0.30)
$0.72
n/m
Adjusted Diluted EPS(1)
$(0.09)
$(0.14)
35.7%
Cash Flow from Operating Activities
$(39)
$(13)
(200.0)%
Adjusted Free Cash Flow(1)
$(54)
$(6)
(800.0)%
Performance Commentary At the end of the quarter, Conduent maintained a cash balance of $264 million along with $198 million unused capacity under its recently renewed credit facility. During the quarter, Conduent repurchased approximately 4.7 million shares of common stock.
Pre-tax income (loss) for the third quarter of 2025 was $(38) million versus $159 million in the prior year period. This decrease is primarily caused by the divestiture-driven gain on the transfer of the Casualty Claims Solutions business.
Q3 2025 Adjusted EBITDA of $40 million and Adjusted EBITDA margin of 5.2% both increased versus the prior year period and were in line with guidance showing continued momentum toward our target margin.
Additional Q3 2025 Performance Highlights Conduent achieved several milestones related to its technology-led solutions, contract awards, financial foundation, and client support capabilities, including:
Announced the integration of generative AI (GenAI) and other advanced AI technologies into the Company’s government solutions to improve the disbursement of critical government benefits, enhance the citizen experience, and combat fraud in government benefit programs.
Successfully completed the refinancing of the Company’s revolving credit facility, extending the maturity, and paying off the Term Loan A.
Awarded a contract by the Richmond Metropolitan Transportation Authority to implement a Pay-by-Plate toll collection system supporting the transition to all-electronic tolling designed to streamline traffic for a faster, safer, and more enjoyable driving experience.
Announced an expansion of the Company’s Philippines operations with a new facility in Lipa-Malvar to support customer experience management solutions (CXM) for a leading U.S. healthcare company.
Expanded its FastCap® Finance Analytics solution by integrating GenAI-powered contract and spend analytics capability that enables expedited contract intake, verification of contract compliance, and identification of procurement savings and tariff-related financial exposures more efficiently and more accurately.
Implemented Conduent’s Maven® Disease Surveillance & Outbreak Management System for the State of Delaware, helping to monitor, report, and better understand public health threats and infectious disease outbreaks.
FY 2025 Outlook(2)
FY 2024 Actuals
FY 2025 Outlook(2)
Adj. Revenue(1)
$3,176M
$3,050 – $3,100
Adj. EBITDA(1) / Adj. EBITDA Margin(1)
$124M / 3.9%
5.0% – 5.5%
(1) Refer to Appendix for definition and complete non-GAAP reconciliations of Adjusted Revenue, Adjusted EBITDA, Adjusted EBITDA Margin, Adjusted Diluted EPS and Adjusted Free Cash Flow. (2) Refer to Appendix for additional information regarding non-GAAP outlook.
Conference Call Management will present the results during a conference call and webcast on November 7, 2025 at 9:00 a.m. ET.
The call will be available by live audio webcast along with the news release and online presentation slides at https://investor.conduent.com/
The conference call will also be available by calling 877-407-4019 toll-free. If requested, the conference ID for this call is 13755924.
The international dial-in is 1-201-689-8337. The international conference ID is also 13755924.
A recording of the conference call will be available by calling 1-877-660-6853 three hours after the conference call concludes. The replay ID is 13755924.
The telephone recording will be available until Nov 21, 2025.
About Conduent Conduent delivers digital business solutions and services spanning the commercial, government and transportation spectrum – creating valuable outcomes for its clients and the millions of people who count on them. The Company leverages cloud computing, artificial intelligence, machine learning, automation and advanced analytics to deliver mission-critical solutions. Through a dedicated global team of approximately 53,000 associates, process expertise and advanced technologies, Conduent’s solutions and services digitally transform its clients’ operations to enhance customer experiences, improve performance, increase efficiencies and reduce costs. Conduent adds momentum to its clients’ missions in many ways including disbursing approximately $85 billion in government payments annually, enabling approximately 2.3 billion customer service interactions annually, empowering millions of employees through HR services every year and processing over 13 million tolling transactions every day. Learn more at www.conduent.com.
Non-GAAP Financial Measures We have reported our financial results in accordance with accounting principles generally accepted in the U.S. (U.S. GAAP). In addition, we have discussed our financial results using non-GAAP measures. We believe these non-GAAP measures allow investors to better understand the trends in our business and to better understand and compare our results. Accordingly, we believe it is necessary to adjust several reported amounts, determined in accordance with U.S. GAAP, to exclude the effects of certain items as well as their related tax effects. Management believes that these non-GAAP financial measures provide an additional means of analyzing the results of the current period against the corresponding prior period. However, these non-GAAP financial measures should be viewed in addition to, and not as a substitute for, our reported results prepared in accordance with U.S. GAAP. Our non-GAAP financial measures are not meant to be considered in isolation or as a substitute for comparable U.S. GAAP measures and should be read only in conjunction with our Consolidated Financial Statements prepared in accordance with U.S. GAAP. Our management regularly uses our non-GAAP financial measures internally to understand, manage and evaluate our business and make operating decisions. Providing such non-GAAP financial measures to investors allows for a further level of transparency as to how management reviews and evaluates our business results and trends. These non-GAAP measures are among the primary factors management uses in planning for and forecasting future periods. Compensation of our executives is based in part on the performance of our business based on certain of these non-GAAP measures. Refer to the “Non-GAAP Financial Measures” section attached to this release for a discussion of these non-GAAP measures and their reconciliation to the reported U.S. GAAP measures.
Forward-Looking Statements
This press release, any exhibits or attachments to this release, and other public statements we make may contain “forward-looking statements” as defined in the Private Securities Litigation Reform Act of 1995. The words “anticipate,” “believe,” “estimate,” “expect,” “expectations,” “in front of us,” “plan,” “intend,” “will,” “aim,” “should,” “could,” “forecast,” “target,” “may,” “continue to,” “looking to continue,” “endeavor,” “if,” “growing,” “projected,” “potential,” “likely,” “see,” “ahead,” “further,” “going forward,” “on the horizon,” “as we progress,” “going to,” “path from here forward,” “think,” “path to deliver,” “from here,” “on track,” “remain” and similar expressions (including the negative and plural forms of such words and phrases), as they relate to us, are intended to identify forward-looking statements, but the absence of these words does not mean that a statement is not forward-looking. All statements other than statements of historical fact included in this press release or any attachment to this press release are forward-looking statements, including, but not limited to, statements regarding our financial results, condition and outlook; changes in our operating results; general market and economic conditions; and our projected financial performance, including all statements made under the section captioned “FY 2025 Outlook” within this release. These statements reflect our current views with respect to future events and are subject to certain risks, uncertainties and assumptions, many of which are outside of our control, that could cause actual results to differ materially from those expected or implied by such forward-looking statements contained in this press release, any exhibits to this press release and other public statements we make.
Important factors and uncertainties that could cause our actual results to differ materially from those in our forward-looking statements include, but are not limited to: government appropriations and termination rights contained in our government contracts, the competitiveness of the markets in which we operate and our ability to renew commercial and government contracts, including contracts awarded through competitive bidding processes; our ability to recover capital and other investments in connection with our contracts; our reliance on third-party providers; risk and impact of geopolitical events and increasing geopolitical tensions (such as the war in the Ukraine and conflict in the Middle East), macroeconomic conditions, natural disasters and other factors in a particular country or region on our workforce, customers and vendors; our ability to deliver on our contractual obligations properly and on time; changes in interest in outsourced business process services; claims of infringement of third-party intellectual property rights; our ability to estimate the scope of work or the costs of performance in our contracts; the loss of key senior management and our ability to attract and retain necessary technical personnel and qualified subcontractors; our failure to develop new service offerings and protect our intellectual property rights; our ability to modernize our information technology infrastructure and consolidate data centers; expectations relating to environmental, social and governance considerations; utilization of our stock repurchase program; risks related to our use of artificial intelligence; the failure to comply with laws relating to individually identifiable information and personal health information; the failure to comply with laws relating to processing certain financial transactions, including payment card transactions and debit or credit card transactions; breaches of our information systems or security systems or any service interruptions; risks related to hacking or other cybersecurity threats to our data systems, information systems and network infrastructure and other service interruptions, including relating to the previously disclosed cyber event that took place in January 2025, including Conduent’s investigation of such incident and mitigation and remediation efforts, the nature and extent of such incident, the potential disruption to our business or operations, the potential impact on Conduent’s reputation, and Conduent’s assessments of the likely financial and operational impacts of such incident; our ability to comply with data security standards; developments in various contingent liabilities that are not reflected on our balance sheet, including those arising as a result of being involved in a variety of claims, lawsuits, investigations and proceedings; risks related to recently completed divestitures including (i) the transfer of the Company’s BenefitWallet’s health savings account, medical savings account and flexible spending account portfolio, (ii) the sale of the Company’s Curbside Management and Public Safety Solutions businesses and (iii) the sale of the Company’s Casualty Claims Solutions business, including but not limited to the Company’s ability to realize the benefits anticipated from such transactions, unexpected costs, liabilities or delays in connection with such transactions, and the significant transaction costs associated with such transactions; risk and impact of potential goodwill and other asset impairments; our significant indebtedness and the terms of such indebtedness; our failure to obtain or maintain a satisfactory credit rating and financial performance; our ability to obtain adequate pricing for our services and to improve our cost structure; our ability to collect our receivables, including those for unbilled services; a decline in revenues from, or a loss of, or a reduction in business from or failure of significant clients; fluctuations in our non-recurring revenue; increases in the cost of voice and data services or significant interruptions in such services; our ability to receive dividends or other payments from our subsidiaries; and other factors that are set forth in the “Risk Factors” section, the “Legal Proceedings” section, the “Management’s Discussion and Analysis of Financial Condition and Results of Operations” section and other sections in our 2024 Annual Report on Form 10-K, as well as in our Quarterly Reports on Form 10-Q and Current Reports on Form 8-K filed with or furnished to the Securities and Exchange Commission. Any forward-looking statements made by us in this release speak only as of the date on which they are made. We are under no obligation to, and expressly disclaim any obligation to, update or alter our forward-looking statements, whether because of new information, subsequent events or otherwise, except as required by law.
NEW YORK, November 7, 2025 /PRNewswire/ — Bit Digital, Inc. (Nasdaq: BTBT) (“Bit Digital” or the “Company”) today announced its monthly Ethereum (“ETH”) treasury and staking metrics for the month of October 2025:
Key Highlights for October 2025
As of October 31, 2025, the Company held approximately 153,546.9[1] ETH.
Based on a closing ETH price of $3,845.79, as of October 31, 2025, the market value of the Company’s ETH holdings was approximately $590.5 million.
During the month of October 2025, the Company acquired 31,057.3 ETH.
The Company’s total average ETH acquisition price for all holdings was $3,045.14 as of October 31, 2025.
The Company staked an additional 32,544 ETH during the month. The Company’s total staked ETH was ~132,480, or ~86.3% of its total holdings, as of October 31, 2025.
Staking operations generated approximately 249 ETH in rewards during the period, representing an annualized yield of approximately 2.93%.
Bit Digital shares outstanding were 322,140,256 as of October 31, 2025.
The Company maintains ownership of approximately 27.0 million WhiteFiber (WYFI) shares with a market value of approximately $917.7 million as of October 31, 2025.
About Bit Digital Bit Digital is a publicly traded digital asset platform focused on Ethereum-native treasury and staking strategies. The Company began accumulating and staking ETH in 2022 and now operates one of the largest institutional Ethereum staking infrastructures globally. Bit Digital’s platform includes advanced validator operations, institutional-grade custody, active protocol governance, and yield optimization. Through strategic partnerships across the Ethereum ecosystem, Bit Digital aims to deliver exposure to secure, scalable, and compliant access to onchain yield. For additional information, please contact ir@bit-digital.com or follow us on LinkedIn or X.
Investor Notice Investing in our securities involves a high degree of risk. Before making an investment decision, you should carefully consider the risks, uncertainties and forward-looking statements described under “Risk Factors” in Item 1A of our Annual Report on Form 10-K for the year ended December 31, 2024 (Annual Report) and any subsequently filed quarterly reports on Form 10-Q and any Current Reports on Form 8-K. If any material risk was to occur, our business, financial condition or results of operations would likely suffer. In that event, the value of our securities could decline and you could lose part or all of your investment. The risks and uncertainties we describe are not the only ones facing us. Additional risks not presently known to us or that we currently deem immaterial may also impair our business operations. In addition, our past financial performance may not be a reliable indicator of future performance, and historical trends should not be used to anticipate results in the future. See “Safe Harbor Statement” below.
Safe Harbor Statement This press release may contain certain “forward-looking statements” relating to the business of Bit Digital, Inc., and its subsidiary companies. All statements, other than statements of historical fact included herein are “forward-looking statements.” These forward-looking statements are often identified by the use of forward-looking terminology such as “believes,” “expects,” or similar expressions, involving known and unknown risks and uncertainties. Although the Company believes that the expectations reflected in these forward-looking statements are reasonable, they do involve assumptions, risks and uncertainties, and these expectations may prove to be incorrect. Investors should not place undue reliance on these forward-looking statements, which speak only as of the date of this press release. The Company’s actual results could differ materially from those anticipated in these forward-looking statements as a result of a variety of factors, including those discussed in the Company’s periodic reports that are filed with the Securities and Exchange Commission and available on its website at http://www.sec.gov. All forward-looking statements attributable to the Company or persons acting on its behalf are expressly qualified in their entirety by these factors. Other than as required under the securities laws, the Company does not assume a duty to update these forward-looking statements.
[1] Includes approximately 15,139.6 ETH and ETH-equivalents held in an externally managed fund, and approximately 5,131.6 ETH presented on as-converted basis from LsETH using the Coinbase conversion rate as of 10/31/25.
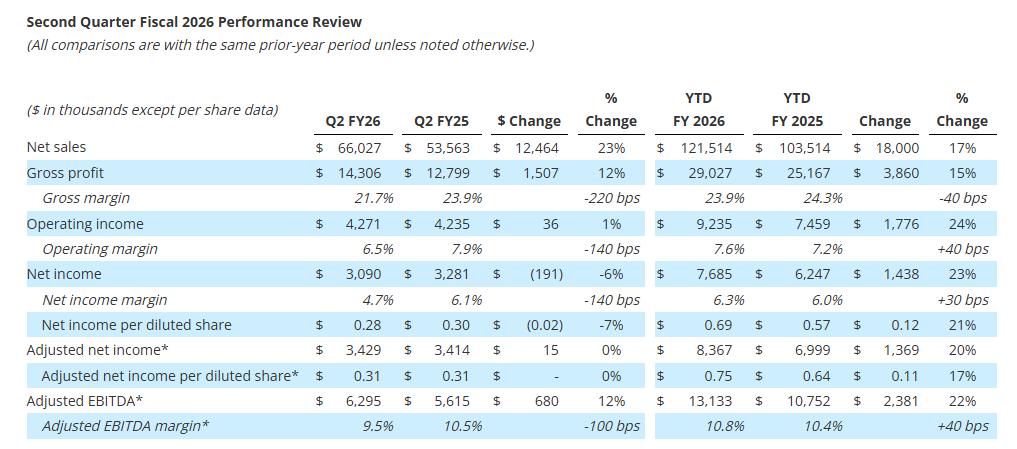
Gross profit increased 12% to $14.3 million; Gross profit margin was 21.7%
Net income per diluted share was $0.28; adjusted net income per diluted share1 was $0.31
Adjusted EBITDA1 increased 12% to $6.3 million; Adjusted EBITDA margin1 was 9.5%
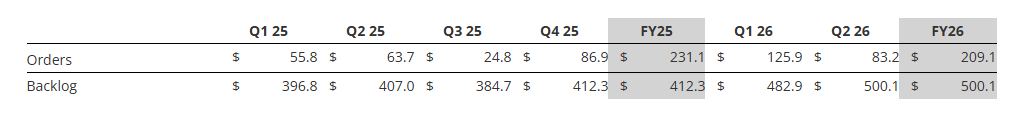
Orders2 were $83.2 million; Book-to-Bill ratio2 of 1.3x and record backlog2 of $500.1 million
Strong balance sheet with no debt, $20.6 million in cash, and access to $44.7 million under its revolving credit facility at quarter end to support growth initiatives
Reiterating full year fiscal 2026 revenue and adjusted EBITDA guidance; Remain on track to reach strategic goal of 8% to 10% annual organic revenue growth and low to mid-teen Adjusted EBITDA margins1 by fiscal 2027
BATAVIA, N.Y.–(BUSINESS WIRE)– Graham Corporation (NYSE: GHM) (“GHM” or the “Company”), a global leader in the design and manufacture of mission critical fluid, power, heat transfer and vacuum technologies for the Defense, Energy & Process, and Space industries, today reported financial results for its second quarter for the fiscal year ending March 31, 2026 (“fiscal 2026”).
Graham’s President and Chief Executive Officer, Matthew J. Malone stated, “I am pleased with our performance through the first half of the fiscal year. Our team continues to execute well across all business lines, driving broad-based growth supported by a record $500.1 million backlog. Demand across our end markets remains healthy as our Defense and Space markets continue to experience robust activity, and the Energy & Process market remains resilient. These trends are underscored by approximately $14.8 million of new Space orders secured and a $25.5 million follow-on order for the MK48 Torpedo program during the quarter, reinforcing our position as a trusted partner on critical platforms.”
Mr. Malone continued, “As we look to the second half of the year, we remain focused on advancing high-return initiatives that strengthen Graham’s competitive position and drive sustainable value creation. Across our operations, we are investing in automation, advanced testing, and new technical capabilities designed to enhance productivity, efficiency, and profitability. These include automated welding systems, advanced radiographic testing technologies, our NextGenTM steam ejector Nozzle, and our new cryogenic testing facility in Florida. Each of these projects is expected to deliver returns above 20%, improve margins, and create meaningful opportunities for growth in both defense and commercial markets.”
1Adjusted net income per diluted share, Adjusted EBITDA and Adjusted EBITDA margin are non-GAAP measures. See attached tables and other information for important disclosures regarding Graham’s use of these non-GAAP measures. 2Orders, backlog and book-to-bill ratio are key performance metrics. See “Key Performance Indicators” below for important disclosures regarding Graham’s use of these metrics.
*Graham believes that, when used in conjunction with measures prepared in accordance with U.S. generally accepted accounting principles (“GAAP”), adjusted net income, adjusted net income per diluted share, adjusted EBITDA and adjusted EBITDA margin, which are non-GAAP measures, help in the understanding of its operating performance. See attached tables and other information provided at the end of this press release for important disclosures regarding Graham’s use of these non-GAAP measures.
Quarterly net sales of $66.0 million increased 23%, or $12.5 million. Sales in the Defense market contributed $9.9 million to growth primarily due to the timing of project milestones (primarily material receipts), new programs and growth in existing programs. Sales for the Energy & Process market increased $2.0 million or 11% driven by increased sales in China and timing of larger capital projects, partially offset by decreased sales in India due to project timing. Aftermarket sales in the Energy & Process and Defense markets of $9.8 million remained strong and were slightly higher than the prior year. See supplemental data for a further breakdown of sales by market and region.
Gross profit for the quarter increased $1.5 million, or 12%, to $14.3 million compared to the prior-year period of $12.8 million. As a percentage of sales, gross profit margin decreased 220 basis points to 21.7%, compared to the second quarter of fiscal 2025. This decrease in gross profit margin reflects the mix of sales during the second quarter of fiscal 2026, and particularly, an extraordinarily high level of material receipts which carry a lower profit margin. Additionally, the second quarter and the first six months of fiscal 2025 gross profit benefited $0.4 million and $0.9 million, respectively, from a grant received in the prior year from the BlueForge Alliance to reimburse the Company for the cost of its defense welder training programs in Batavia which did not repeat in fiscal year 2026. For the first six months of fiscal 2026, we estimate the impact of tariffs on our consolidated financial statements to be approximately $1.0 million compared to the prior year.
Selling, general and administrative expense (“SG&A”), including intangible amortization, totaled $10.2 million, an increase of $1.1 million compared with the prior year due to the investments being made in operations, employees, and technology, as well as higher performance-based compensation due to Graham’s increased profitability. As a percentage of sales, SG&A, including amortization of 15.5%, decreased 160 basis points compared to the prior year period, reflecting the higher level of sales during the quarter as well as our continued financial discipline.
Cash Management and Balance Sheet
Cash provided by operating activities totaled $13.6 million for the quarter-ending September 30, 2025. As of September 30, 2025, cash and cash equivalents were $20.6 million, compared with $32.3 million as of September 30, 2024.
Capital expenditures for the second quarter fiscal 2025 were $4.1 million, focused on capacity expansion, increasing capabilities, and productivity improvements.
The Company had no debt outstanding as of September 30, 2025, with $44.7 million available on its revolving credit facility after taking into account outstanding letters of credit.
Orders, Backlog, and Book-to-Bill Ratio
See supplemental data filed with the Securities and Exchange Commission on Form 8-K and provided on the Company’s website for a further breakdown of orders and backlog by market. See “Key Performance Indicators” below for important disclosures regarding Graham’s use of these metrics ($ in millions).
Orders for the second quarter of fiscal 2026 were $83.2 million. The increase in orders was across all our principle markets and included a $25.5 million follow-on order to provide mission-critical hardware for the MK48 Mod 7 Heavyweight Torpedo, as well as orders from leading Space/Aerospace customers. After-market orders for the Energy & Process and Defense markets for the second quarter of fiscal 2026 decreased $3.2 million to $9.6 million from the record levels of the prior year, but still remain strong.
Note that our orders tend to be lumpy given the nature of our business (i.e. large capital projects) and in particular, orders to the Defense industry, which span multiple years and can be significantly larger in size.
Backlog at quarter end was a record $500.1 million, a 23% increase over the prior-year period. Approximately 35% to 40% of orders currently in backlog are expected to be converted to sales in the next twelve months, another 25% to 30% are expected to convert to sales within one to two years, and the remaining beyond two years. Approximately 85% of our backlog as of September 30, 2025, was to the Defense industry, which we believe provides stability and visibility to our business.
Fiscal 2026 Outlook
Based upon the results for the first half of fiscal 2026, as well as our expectations for the remainder of the fiscal year, Graham is reiterating its full year fiscal 2026 guidance for all metrics.
The Company has reduced the high end of its previously announced fiscal 2026 tariff impact by $1.0 million. Graham now expects tariffs to have an estimated impact of approximately $2.0 million to $4.0 million on its consolidated financial results. The Xdot Bearing Technologies (“Xdot”) Acquisition announced in October 2025 does not materially impact this guidance.
Graham’s Chief Financial Officer, Christopher J. Thome, said, “Given the continued strength in demand, we are reaffirming our full-year guidance. As a reminder, our third quarter typically represents our seasonally lowest revenue period, reflecting normal holiday impacts on production schedules.”
Mr. Thome continued, “Additionally, we are narrowing our full-year estimated tariff impact range to $2.0 million to $4.0 million, down from the prior $2.0 million to $5.0 million. With a record backlog and solid order momentum, we remain confident in our full-year outlook and our ability to deliver consistent performance throughout the fiscal year.”
Expectations for sales and profitability assume that the Company will operate its production facilities at planned capacity, maintain access to its global supply chain and subcontractors, avoid significant global disruptions, and not be materially affected by unforeseen events.
Webcast and Conference Call
GHM’s management will host a conference call and live webcast on November 7, 2025 at 11:00 a.m. Eastern Time (“ET”) to review its financial results as well as its strategy and outlook. The review will be accompanied by a slide presentation, which will be made available immediately prior to the conference call on GHM’s investor relations website.
A question-and-answer session will follow the formal presentation. GHM’s conference call can be accessed by calling (201)-689-8560. Alternatively, the webcast can be monitored from the events section of GHM’s investor relations website.
A telephonic replay will be available from 3:00 p.m. ET today through Friday, November 14, 2025. To listen to the archived call, dial (412) 317-6671 and enter conference ID number 13756267 or access the webcast replay via the Company’s website at ir.grahamcorp.com, where a transcript will also be posted once available.
About Graham Corporation
Graham is a global leader in the design and manufacture of mission critical fluid, power, heat transfer and vacuum technologies for the Defense, Energy & Process, and Space industries. Graham Corporation and its family of global brands are built upon world-renowned engineering expertise in vacuum and heat transfer, cryogenic pumps, and turbomachinery technologies, as well as its responsive and flexible service and the unsurpassed quality customers have come to expect from the Company’s products and systems. Graham Corporation routinely posts news and other important information on its website, grahamcorp.com, where additional information on Graham Corporation and its businesses can be found.
Safe Harbor Regarding Forward Looking Statements
This news release contains forward-looking statements within the meaning of Section 27A of the Securities Act of 1933, as amended, and Section 21E of the Securities Exchange Act of 1934, as amended.
Forward-looking statements are subject to risks, uncertainties and assumptions and are identified by words such as “continue,” “estimate,” “expects,” “future,” “outlook,” “believes,” “could,” “guidance,” “may”, “will,” “plan” and other similar words. All statements addressing operating performance, events, or developments that Graham Corporation expects or anticipates will occur in the future, including but not limited to, profitability of future projects and the business, its ability to deliver to plan, its ability to continue to strengthen relationships with customers in the Defense industry, its ability to secure future projects and applications, expected expansion and growth opportunities, anticipated sales, revenues, adjusted EBITDA, adjusted EBITDA margins, capital expenditures and SG&A expenses, the timing of conversion of backlog to sales, orders, market presence, profit margins, tax rates, foreign sales operations, customer preferences, changes in market conditions in the industries in which it operates, changes in general economic conditions and customer behavior, forecasts regarding the timing and scope of the economic recovery in its markets, and its acquisition and growth strategy, are forward-looking statements. Because they are forward-looking, they should be evaluated in light of important risk factors and uncertainties. These risk factors and uncertainties are more fully described in Graham Corporation’s most recent Annual Report filed with the Securities and Exchange Commission (the “SEC”), included under the heading entitled “Risk Factors”, and in other reports filed with the SEC.
Should one or more of these risks or uncertainties materialize or should any of Graham Corporation’s underlying assumptions prove incorrect, actual results may vary materially from those currently anticipated. In addition, undue reliance should not be placed on Graham Corporation’s forward-looking statements. Except as required by law, Graham Corporation disclaims any obligation to update or publicly announce any revisions to any of the forward-looking statements contained in this news release.
Non-GAAP Financial Measures
Adjusted EBITDA is defined as consolidated net income (loss) before net interest expense, income taxes, depreciation, amortization, other acquisition related expenses, equity-based compensation, ERP implementation costs, and other unusual/nonrecurring expenses. Adjusted EBITDA margin is defined as Adjusted EBITDA as a percentage of sales. Adjusted EBITDA and Adjusted EBITDA margin are not measures determined in accordance with generally accepted accounting principles in the United States, commonly known as GAAP. Nevertheless, Graham believes that providing non-GAAP information, such as Adjusted EBITDA and Adjusted EBITDA margin, is important for investors and other readers of Graham’s financial statements, as it is used as an analytical indicator by Graham’s management to better understand operating performance. Moreover, Graham’s credit facility also contains ratios based on Adjusted EBITDA. Because Adjusted EBITDA and Adjusted EBITDA margin are non-GAAP measures and are thus susceptible to varying calculations, Adjusted EBITDA, and Adjusted EBITDA margin, as presented, may not be directly comparable to other similarly titled measures used by other companies.
Adjusted net income and adjusted net income per diluted share are defined as net income and net income per diluted share as reported, adjusted for certain items and at a normalized tax rate. Adjusted net income and adjusted net income per diluted share are not measures determined in accordance with GAAP, and may not be comparable to the measures as used by other companies. Nevertheless, Graham believes that providing non-GAAP information, such as adjusted net income and adjusted net income per diluted share, is important for investors and other readers of the Company’s financial statements and assists in understanding the comparison of the current quarter’s and current fiscal year’s net income and net income per diluted share to the historical periods’ net income and net income per diluted share. Graham also believes that adjusted net income per share, which adds back intangible amortization expense related to acquisitions, provides a better representation of the cash earnings of the Company.
Forward-Looking Non-GAAP Measures
Adjusted EBITDA and adjusted EBITDA margin are non-GAAP measures. The Company is unable to present a quantitative reconciliation of these forward-looking non-GAAP financial measures to their most directly comparable forward-looking GAAP financial measures because such information is not available, and management cannot reliably predict the necessary components of such GAAP measures without unreasonable effort largely because forecasting or predicting our future operating results is subject to many factors out of our control or not readily predictable. In addition, the Company believes that such reconciliations would imply a degree of precision that would be confusing or misleading to investors. The unavailable information could have a significant impact on the Company’s fiscal 2025 financial results. These non-GAAP financial measures are preliminary estimates and are subject to risks and uncertainties, including, among others, changes in connection with purchase accounting, quarter-end, and year-end adjustments. Any variation between the Company’s actual results and preliminary financial estimates set forth above may be material.
Key Performance Indicators
In addition to the foregoing non-GAAP measures, management uses the following key performance metrics to analyze and measure the Company’s financial performance and results of operations: orders, backlog, and book-to-bill ratio. Management uses orders and backlog as measures of current and future business and financial performance, and these may not be comparable with measures provided by other companies. Orders represent definitive agreements with customers to provide products and/or services. Backlog is defined as the total dollar value of net orders received for which revenue has not yet been recognized. Total backlog can include both funded and unfunded orders under government contracts. Management believes tracking orders and backlog are useful as they often times are leading indicators of future performance. In accordance with industry practice, contracts may include provisions for cancellation, termination, or suspension at the discretion of the customer.
The book-to-bill ratio is an operational measure that management uses to track the growth prospects of the Company. The Company calculates the book-to-bill ratio for a given period as net orders divided by net sales.
Given that each of orders, backlog, and book-to-bill ratio are operational measures and that the Company’s methodology for calculating orders, backlog and book-to-bill ratio does not meet the definition of a non-GAAP measure, as that term is defined by the U.S. Securities and Exchange Commission, a quantitative reconciliation for each is not required or provided.
BATAVIA, N.Y.–(BUSINESS WIRE)– Graham Corporation (NYSE: GHM) (“GHM” or “the Company”), a global leader in the design and manufacture of mission-critical fluid, power, heat transfer and vacuum technologies for the Defense, Energy & Process, and Space markets, today announced growing momentum in its commercial space business, supported by a series of recent orders from leading Space/Aerospace customers in aggregate value of approximately $22 million.
During its fiscal second and third quarters, Graham’s wholly owned subsidiary, Barber-Nichols LLC (“BN”), booked multiple new orders for advanced turbomachinery and precision-engineered components from six industry leading players in the commercial space launch market. These orders, which are expected to convert into revenue over the next 12 to 24 months, underscores the Company’s expanding role as being a critical supplier for next-generation space systems.
To support this continued demand, Graham is investing in production capacity and capabilities at its Colorado-based Barber-Nichols facility, including the addition of new CNC machining centers, a liquid nitrogen test stand, and supporting infrastructure to increase throughput and meet accelerating customer schedules. These investments are in addition to the previously announced cryogenic test facility the company is constructing near its P3 Technologies subsidiary in Jupiter, Florida expected to be opened later this year.
“We are seeing strong and sustained momentum from both new and existing customers in the space sector,” said Mike Dixon, General Manager of Barber-Nichols. “These orders reflect Barber-Nichols long commitment to the space industry and key development programs that support the commercial launch sector that are now beginning to transition to higher rate production. Our team’s expertise in high-speed rotating equipment and precision manufacturing continues to position us as a trusted supplier for complex, high-performance systems. With additional machining capacity and test capabilities coming online, we are well positioned to deliver on these programs and continue supporting our customers’ missions.”
Graham’s growing presence in the space market complements its established leadership across defense and energy end markets and reinforces the Company’s strategy to diversify its portfolio across high-growth, technology-driven applications.
About Graham Corporation
Graham is a global leader in the design and manufacture of mission critical fluid, power, heat transfer and vacuum technologies for the Defense, Energy & Process, and Space industries. Graham Corporation and its family of global brands are built upon world-renowned engineering expertise in vacuum and heat transfer, cryogenic pumps, and turbomachinery technologies, as well as its responsive and flexible service and the unsurpassed quality customers have come to expect from the Company’s products and systems. Graham Corporation routinely posts news and other important information on its website, grahamcorp.com, where additional information on Graham Corporation and its businesses can be found.
Safe Harbor Regarding Forward Looking Statements
This news release contains forward-looking statements within the meaning of Section 27A of the Securities Act of 1933, as amended, and Section 21E of the Securities Exchange Act of 1934, as amended.
Forward-looking statements are subject to risks, uncertainties and assumptions and are identified by words such as “continue,” “expected,” “positions,” “will,” and other similar words. All statements addressing operating performance, events, or developments that Graham Corporation expects or anticipates will occur in the future, including but not limited to, completion and profitability of future projects and the business, its ability to deliver to plan, potential revenues and timing of such revenues, capacity, demand growth, and delivering timely or otherwise on schedule are forward-looking statements. Because they are forward-looking, they should be evaluated in light of important risk factors and uncertainties. These risk factors and uncertainties are more fully described in Graham Corporation’s most recent Annual Report filed with the Securities and Exchange Commission (the “SEC”), included under the heading entitled “Risk Factors”, and in other reports filed with the SEC.
Should one or more of these risks or uncertainties materialize or should any of Graham Corporation’s underlying assumptions prove incorrect, actual results may vary materially from those currently anticipated. In addition, undue reliance should not be placed on Graham Corporation’s forward-looking statements. Except as required by law, Graham Corporation disclaims any obligation to update or publicly announce any revisions to any of the forward-looking statements contained in this news release.
Net income of $5.9 million and $11.2 million for the three and nine months ended September 30, 2025, respectively
Full-year revenue guidance revised to $115-118 million (from $118 – $128 million previously) due to delayed Etorel® (Nintedanib) rollout and government procurement-related uncertainty
Q3 2025 vs Q3 2024 Highlights
Quarterly revenue of $30.6 million, up 20% year-over-year, driven by ETUARY® growth and contributions from sales of Etorel® and Contiva®.
GAAP net income doubled to $5.9 million and adjusted net income rose to $8.8 million, reflecting commercial execution and disciplined cost control.
Operating income increased 64% to $6.9 million, as operating expenses grew at a slower pace than revenue.
Basic EPS improved to $0.04, compared to $0.01 year-over-year.
Nine-Month 2025 Highlights
Revenue of $79.4 million, moderately above the prior-year period, supported by steady Q3 growth of Etorel® and Contiva®, after earlier supply chain and distribution delays related to new product launches.
Basic EPS down from $0.14 to $0.08, reflecting higher operating expenses related to the dual product launches in the first half of 2025, partially offset by the strong Q3 profit recovery.
$80.3 million in cash, cash equivalents, and short and long-term deposits, up 57% year-to-date, as of Sept 30, 2025.
Business Update
Hydronidone New Drug Application (NDA) progressing in China, with Priority Review discussions ongoing and targeted submission following completion of regulatory interactions.
Completed patient enrollment in the 52-week Phase 3 pirfenidone pneumoconiosis (PD) trial (272 patients, 18 sites).
Plan to initiate an adaptive Phase 2/3 trial of pirfenidone in oncology-related pulmonary complications (RILI/immune-related pneumonitis) in Q4 2025.
U.S. MASH IND anticipated timeline adjusted to 2026 to allow for (i) the incorporation of the complete Phase 2 and 3 CHB-associated liver fibrosis clinical data from China; and (ii) planning and expected initiation of a hepatic impairment study under the existing U.S. IND to further inform safety, dose optimization, and regulatory discussions.
SAN DIEGO, Nov. 07, 2025 (GLOBE NEWSWIRE) — Gyre Therapeutics (“Gyre”) (Nasdaq: GYRE), an innovative, commercial-stage biopharmaceutical company dedicated to advancing fibrosis-first therapies across organ systems affected by chronic disease, today announced financial results for the third quarter ended September 30, 2025 and provided a business update.
“Following the positive results from our pivotal Phase 3 trial in the PRC evaluating Hydronidone for the treatment of CHB-associated liver fibrosis, we are working diligently toward our NDA submission and are leveraging Hydronidone’s Breakthrough Therapy designation to bring this much-needed therapy to patients in China,” said Ping Zhang, Executive Chairman and Interim Chief Executive Officer of Gyre Therapeutics. “With enrollment now completed in our 52-week Phase 3 trial of pirfenidone for the treatment of pneumoconiosis, we continue to advance our pipeline in China. We are also preparing for U.S. clinical activities and expect to file the U.S. IND for Hydronidone for the treatment of MASH-associated liver fibrosis in 2026, supported by the translation and regulatory-quality review of our China Phase 2 and Phase 3 trial data and an upcoming hepatic impairment study.”
Third Quarter Business Highlights and Upcoming Milestones
Commercial Portfolio
ETUARY® (pirfenidone): Generated $27.7 million in sales of ETUARY® for the quarter ended September 30, 2025, compared to $25.3 million for the same period in 2024.
Etorel® (nintedanib ethanesulfonate soft capsules): Generated $1.5 million in sales of Etorel® for the quarter ended September 30, 2025, the first full quarter of launch.
Contiva® (avatrombopag maleate tablets): Generated $1.2 million in sales of Contiva® for the quarter ended September 30, 2025.
Pipeline Development Updates
Hydronidone:
New Drug Application (NDA) in China:
Building on the positive Phase 3 trial results, Gyre Pharmaceuticals is actively engaging with China’s National Medical Products Administration (NMPA) to confirm Priority Review eligibility for Hydronidone’s New Drug Application (NDA).
The Company remains on track to advance regulatory filing activities and intends to proceed with the NDA submission for Hydronidone in China upon completion of ongoing regulatory interactions and resolution of any outstanding requirements.
Hydronidone U.S. IND Timing Update:
The anticipated timeline for submitting the U.S. IND for Hydronidone for the treatment of MASH-associated liver fibrosis has been adjusted due to the delayed availability of the full Phase 3 trial data set from the completed trial of Hydronidone for the treatment of CHB-associated liver fibrosis in China. The Phase 2 and Phase 3 trial data form the core clinical safety package supporting the U.S. program, and the translation and regulatory-quality review of the Clinical Study Reports are currently in progress.
In parallel, Gyre plans to conduct a hepatic impairment study in U.S. subjects under its active U.S. IND. In light of the shifting market dynamics in the MASH landscape, this study is expected to help determine dose selection and appropriate enrollment criteria in populations with reduced hepatic function, thereby supporting a more robust Phase 2 development strategy.
With these activities underway, Gyre expects to file the U.S. IND for Hydronidone for the treatment of MASH-associated liver fibrosis in 2026, and, subject to U.S. IND clearance, initiate a Phase 2 trial.
Pirfenidone Development and Indication Expansion:
In the third quarter of 2025, Gyre Pharmaceuticals completed patient enrollment in the 52-week Phase 3 clinical trial evaluating pirfenidone for the treatment of pneumoconiosis. The multicenter, randomized, double-blind, placebo-controlled trial enrolled 272 patients across 18 clinical research centers in China. The trial is designed to evaluate the efficacy and safety of 52 weeks of pirfenidone treatment in patients with pneumoconiosis, a chronic occupational lung disease characterized by progressive pulmonary fibrosis.
Following the NMPA’s approval in March 2025 of Gyre Pharmaceuticals’ clinical trial application for pirfenidone in oncology-related pulmonary complications, Gyre Pharmaceuticals plans to initiate an adaptive Phase 2/3 trial in the fourth quarter of 2025 in the PRC, targeting radiation-induced lung injury (RILI) including cases complicated by immune-related pneumonitis across leading oncology centers.
Financial Results
Cash Position
As of September 30, 2025, Gyre held $40.4 million in cash and cash equivalents, $19.6 million in short-term bank deposits, and $20.3 million in long-term certificates of deposit, totaling $80.3 million.
Financial Results for the Three Months Ended September 30, 2025
Revenues: Revenues for the three months ended September 30, 2025 were $30.6 million, compared to $25.5 million for the same period in 2024. The $5.1 million increase was primarily due to $1.5 million from Etorel® sales, $1.2 million from Contiva® sales and a $2.4 million increase in revenue from ETUARY® sales. The increase in ETUARY® sales was mainly driven by a shift in marketing focus in the third quarter. We continue to anticipate revenue growth over the remainder of the year, driven by the growth of ETUARY® sales and supplemented by the commercialization of Etorel® and Contiva® in 2025.
Cost of Revenues: For the three months ended September 30, 2025, cost of revenues was $1.6 million, compared to $1.0 million for the same period in 2024. The $0.6 million increase was primarily attributable to a $0.2 million increase in the costs associated with Contiva® and Etorel®, in line with the corresponding increase in their sales, and a $0.5 million increase in costs associated with ETUARY® due to the higher sales and increased production costs for the product batch related to such sales, partially offset by a $0.1 million decrease in costs associated with generic drugs due to the decrease of sales.
Selling and Marketing Expense: For the three months ended September 30, 2025, selling and marketing expense was $15.3 million, compared to $13.7 million for the same period in 2024. The $1.6 million increase was primarily attributable to a $0.5 million increase in payroll costs, driven by higher headcount and an increase of sales in the three months ended September 30, 2025 and a $1.1 million increase in promotion and conference expenses.
Research and Development Expense: For the three months ended September 30, 2025, research and development expense was $2.4 million, compared to $2.8 million for the same period in 2024. The decrease was primarily attributable to a $0.4 million decrease in clinical trial costs resulting from the completion of the Phase 3 trial of Hydronidone in the second quarter of 2025, and a $0.2 million decrease in pre-clinical research expenses, partially offset by $0.2 million increase in staff costs.
General and Administrative Expense: For the three months ended September 30, 2025, general and administrative expense was $4.3 million, compared to $3.8 million for the same period in 2024. The $0.5 million increase was primarily driven by a $1.1 million increase in functional and administrative department’s personnel and stock compensation costs and a $0.2 million increase in miscellaneous expenses, partially offset by a $0.8 million decrease in professional fees.
Income from Operations: For the three months ended September 30, 2025, income from operations was $6.9 million, compared to $4.2 million for the same period in 2024. The $2.7 million increase was primarily driven by a $5.1 million increase in revenue, partially offset by a $2.4 million increase in total operating expenses.
Net Income: For the three months ended September 30, 2025, net income was $5.9 million, compared to $2.9 million for the same period in 2024. The increase was primarily driven by an increase in revenue of $5.1 million and an increase in other income of $0.8 million, partially offset by an increase in operating expenses of $2.4 million and an increase in income tax expense of $0.6 million.
Non-GAAP Adjusted Net Income: For the three months ended September 30, 2025, non-GAAP adjusted net income was $8.8 million, compared to $4.4 million for the same period in 2024. The increase was primarily driven by an increase in revenue of $5.1 million and an increase in other income of $0.8 million, partially offset by an increase in operating expenses of $1.5 million.
Financial Results for the Nine Months Ended September 30, 2025
Revenues: Revenues for the nine months ended September 30, 2025 were $79.4 million, compared to $77.9 million for the same period in 2024. The $1.5 million increase was primarily driven by the increase in new product sales of Contiva® by $3.0 million and Etorel® by $3.1 million, partially offset by a $4.4 million decline in ETUARY® sales and a $0.2 million decrease in generic drug revenue. The decrease in ETUARY® sales was primarily due to the allocation of marketing resources towards the launches of two new products during the first half of the year. In the third quarter, Gyre refocused marketing efforts on ETUARY® in response to market uncertainties related to Etorel® and Contiva®, both of which were included in the latest national volume-based procurement catalog. For the three months ended September 30, 2025, Gyre recorded an increase in ETUARY® sales compared to the same period in 2024, and Gyre expects ETUARY® sales will continue to grow in the three months ended December 31, 2025 compared to the same period in 2024.
We revised our full-year revenue guidance (see “Revised Full Year 2025 Financial Guidance” section below) primarily due to lower-than-expected sales of Contiva® and Etorel® relative to internal budget expectations. While both products continue to expand their commercial presence, initial rollout challenges and external market dynamics have resulted in lower than-expected sales.
For Etorel®, early-year supply chain and distribution delays moderated launch uptake, and uncertainty related to government volume-based procurement led customers to cautious purchasing behavior. While the underlying demand has started to improve, current performance remains below our original expectations for the year.
Cost of Revenues: For the nine months ended September 30, 2025, cost of revenues was $3.7 million, compared to $2.7 million for the same period in 2024. The $1.0 million increase was primarily driven by a $0.1 million increase in stock-based compensation and a $0.4 million increase in the costs of Etorel® and Contiva®, in line with the corresponding increase in their sales, as well as a $0.8 million increase in ETUARY®’s cost due to the higher plant, property and equipment depreciation from a plant renovation in 2025, partially offset by a $0.3 million decrease in costs related to generic drugs due to the decrease of sales.
Selling and Marketing Expense: For the nine months ended September 30, 2025, selling and marketing expense was $41.4 million, compared to $40.7 million for the same period in 2024. The $0.7 million increase was primarily driven by a $0.9 million increase in conference expenses and a $0.1 million increase in stock compensation costs, partially offset by a $0.3 million reduction in staff costs.
Research and Development Expense: For the nine months ended September 30, 2025, research and development expense was $8.9 million, compared to $8.3 million for the same period in 2024. The $0.6 million increase was primarily attributable to a $1.0 million increase in clinical trial costs, primarily as a result of data analysis costs for Hydronidone in the first half of 2025. This increase was offset by a $0.2 million decrease in materials and utilities expenses and a $0.2 million decrease in pre-clinical research expenses.
General and Administrative Expense: For the nine months ended September 30, 2025, general and administrative expense was $14.1 million, compared to $10.6 million for the same period in 2024. The $3.5 million increase was primarily driven by a $2.8 million increase in functional and administrative department’s personnel and stock compensation costs and a $0.9 million increase in miscellaneous expense, mainly due to the increase in expenses related to Gyre Pharmaceuticals’ annual employee appreciation event, partially offset by a $0.2 million decrease in professional fees.
Income from Operations: For the nine months ended September 30, 2025, income from operations was $11.4 million, compared to $15.5 million for the same period in 2024. The $4.1 million decrease was primarily driven by a $5.6 million increase in total operating expenses, partially offset by a $1.5 million increase in revenue.
Net Income: For the nine months ended September 30, 2025, net income was $11.2 million, compared to $17.3 million for the same period in 2024. The decrease was primarily driven by the increase in operating expenses of $5.6 million and decrease in change in fair value of warrant liability of $4.5 million, partially offset by an increase in revenue of $1.5 million, an increase in other income of $0.7 million, and a decrease of income tax expense of $1.9 million.
Non-GAAP Adjusted Net Income: For the nine months ended September 30, 2025, non-GAAP adjusted net income was $14.6 million, compared to $15.7 million for the same period in 2024. The decrease was primarily driven by the increase in operating expenses of $3.3 million, partially offset by an increase in revenue of $1.5 million and an increase in other income of $0.7 million.
Revised Full Year 2025 Financial Guidance
Full-year revenue guidance revised from $118–128 million to $115–118 million, reflecting slower-than-expected commercialization of Etorel® (nintedanib) due to early supply chain and distribution challenges, as well as increased market uncertainty related to China’s centralized procurement policy leading to more cautious purchasing behavior in the second half of the year, partially offset by stronger-than-expected ETUARY® sales.
Please note that the revenue guidance assumes a constant foreign currency rate and no significant economic disruption or downturn.
Use of Non-GAAP Financial Measures by Gyre Therapeutics, Inc.
Gyre reports financial results in accordance with accounting principles generally accepted in the United States (“GAAP”). This release presents the financial measure “adjusted net income,” which is not calculated in accordance with GAAP. The most directly comparable GAAP measure for this non-GAAP financial measure is “net income.” Adjusted net income presents Gyre’s results of operations after excluding gain from change in fair value of warrants, stock-based compensation, and provision for income taxes. This is meant to supplement, and not substitute, Gyre’s financial information presented in accordance with GAAP. Adjusted net income as defined by Gyre may not be comparable to similar non-GAAP measures presented by other companies. Management believes that presenting adjusted net income provides investors with additional useful information in evaluating the Gyre’s performance and valuation. See the reconciliation of adjusted net income to net income in the section titled “Reconciliation of GAAP to Non-GAAP Financial Measures” below.
About Gyre Pharmaceuticals
Gyre Pharmaceuticals is a commercial-stage biopharmaceutical company committed to the research, development, manufacturing and commercialization of innovative drugs for organ fibrosis. Its flagship product, ETUARY® (pirfenidone capsule), was the first approved treatment for IPF in the PRC in 2011 and has maintained a prominent market share (2024 net sales of $105.8 million). In addition, Gyre Pharmaceuticals’ pipeline includes Hydronidone, a structural analogue of pirfenidone, which demonstrated statistically significant fibrosis regression after 52 weeks of treatment in a pivotal Phase 3 clinical trial in CHB-associated liver fibrosis in the PRC. Hydronidone received Breakthrough Therapy designation by the NMPA Center for Drug Evaluation in March 2021. Gyre Pharmaceuticals is also developing treatments for PD, RILI with or without immune-related pneumonitis, COPD, PAH and ALF/ACLF. In October 2023, Gyre Therapeutics acquired an indirect majority interest of 65.2% in Gyre Pharmaceuticals. In the third quarter of 2025, this indirect interest was increased from 65.2% to 69.7% through the increased capital contribution from BJContinent Pharmaceuticals Limited to Gyre Pharmaceuticals.
About Gyre Therapeutics
Gyre Therapeutics is a biopharmaceutical company headquartered in San Diego, CA, primarily focused on the development and commercialization of Hydronidone for liver fibrosis, including MASH, in the United States Gyre’s strategy builds on its experience in mechanistic studies using MASH rodent models and clinical studies in CHB-induced liver fibrosis. In the People’s Republic of China, Gyre is advancing a broad pipeline through its indirect controlling interest in Gyre Pharmaceuticals, including therapeutic expansions of ETUARY®, and development programs for F573, F528, and F230.
Forward-Looking Statements
This press release contains “forward-looking statements” within the meaning of the “safe harbor” provisions of the Private Securities Litigation Reform Act of 1995, which statements are subject to substantial risks and uncertainties and are based on estimates and assumptions. All statements, other than statements of historical facts included in this press release, are forward-looking statements, including statements concerning: the expectations regarding Gyre’s research and development efforts, timing of expected clinical readouts, including the anticipated timing of the submission of Gyre’s U.S. IND for Hydronidone for the treatment of MASH-associated liver fibrosis, a hepatic impairment study of Hydronidone in U.S. subjects under Gyre’s active IND, the initiation of Gyre’s Phase 2/3 trial in the PRC for pirfenidone capsules for the treatment of RILI, including cases complicated by immune-related pneumonitis, the filing of an NDA with the NMPA and timing for potential commercial approval for Hydronidone for the treatment of CHB-associated liver fibrosis and trial design of Gyre’s Phase 3 clinical trial evaluating pirfenidone for the treatment of pneumoconiosis, the expectations regarding commercial revenues from the sales of Etorel® and Contiva® maleate tablets, interactions with regulators, expectations regarding future product sales, Gyre’s ability to meet its expected revenue guidance and Gyre’s financial position and cash resources. In some cases, you can identify forward-looking statements by terms such as “may,” “might,” “will,” “objective,” “intend,” “should,” “could,” “can,” “would,” “expect,” “believe,” “design,” “estimate,” “predict,” “potential,” “plan” or the negative of these terms, and similar expressions intended to identify forward-looking statements. These statements reflect our plans, estimates, and expectations, as of the date of this press release. These statements involve known and unknown risks, uncertainties and other factors that could cause our actual results to differ materially from the forward-looking statements expressed or implied in this press release. Actual results and the timing of events could differ materially from those anticipated in such forward-looking statements as a result of these risks and uncertainties, which include, without limitation: Gyre’s ability to execute on its clinical development strategies; positive results from a clinical trial may not necessarily be predictive of the results of future or ongoing clinical trials; the timing or likelihood of regulatory filings and approvals; competition from competing products; the impact of general economic, health, industrial or political conditions in the United States or internationally; the sufficiency of Gyre’s capital resources and its ability to raise additional capital; supply chain and distribution delays and challenges. Additional risks and factors are identified under “Risk Factors” in Gyre’s Annual Report on Form 10-K for the year ended December 31, 2024 filed on March 17, 2025 and in other filings with the Securities and Exchange Commission.
Gyre expressly disclaims any obligation to update any forward-looking statements whether as a result of new information, future events or otherwise, except as required by law.
For Investors: David Zhang Gyre Therapeutics david.zhang@gyretx.com
Data from patients who remained on tegoprubart for a year post transplant showed an overall mean 12-month estimated glomerular filtration rate (eGFR) of approximately 69 mL/min/1.73 m²
Tegoprubart demonstrated a favorable safety and tolerability profile, substantially reducing the metabolic, neurologic, and cardiovascular toxicities commonly associated with tacrolimus
Supports advancement into Phase 3 development as a potential new standard for the prevention of kidney transplant rejection
Conference call to be held Friday, November 7 at 8:00 a.m. ET
IRVINE, Calif., Nov. 06, 2025 (GLOBE NEWSWIRE) — Eledon Pharmaceuticals, Inc. (“Eledon”) (NASDAQ: ELDN) today announced results from its Phase 2 BESTOW trial evaluating tegoprubart for the prevention of organ rejection in patients receiving a de novo kidney transplant. Results from the Phase 2 BESTOW clinical trial were presented today as a late breaking oral presentation titled “Efficacy and Safety of Tegoprubart for the Prevention of Rejection in Kidney Transplantation: Results from the Phase 2 BESTOW Trial,” at the American Society of Nephrology’s Kidney Week 2025 Annual Meeting in Houston, TX.
“The Phase 2 BESTOW data results demonstrate tegoprubart’s potential to maintain excellent kidney function while reducing the chronic metabolic, neurologic, and cardiovascular toxicities that burden patients on tacrolimus,” said David-Alexandre C. Gros, M.D., Chief Executive Officer of Eledon. “By pairing strong immunosuppressive efficacy with a differentiated safety profile, including dramatically lower rates of new-onset diabetes, tremor, and dialysis-requiring delayed graft function, tegoprubart represents a promising next-generation option for kidney transplant immunosuppression as we advance into Phase 3.”
“There remains a significant unmet need for safer alternatives to traditional tacrolimus-based immunosuppression regimens—options that can reduce harmful side effects without compromising efficacy. The Phase 2 results presented at ASN Kidney Week highlight the potential of tegoprubart to deliver strong graft function after kidney transplantation, while avoiding the long-term toxicities often associated with current standard of care,” said Andrew Adams, M.D., Ph.D., Professor of Surgery and Chief, Division of Transplantation, John S. Najarian Surgical Chair in Clinical Transplantation, Department of Surgery, University of Minnesota. “It’s been more than a decade since we’ve seen true innovation in transplant immunosuppression. These data offer real hope that patients may soon have a transformative therapy that improves their health outcomes and overall quality of life.”
Study Design
The 12-month, randomized, head-to-head, Phase 2 study enrolled 127 kidney transplant recipients (63 receiving tegoprubart and 64 receiving tacrolimus) across 44 global sites. The study directly compared tegoprubart-based immunosuppression with a tacrolimus-based regimen. All patients also received rabbit antithymocyte globulin (rATG) induction and maintenance therapy with mycophenolate mofetil (MMF/MPA) and corticosteroids.
The study’s primary efficacy endpoint was the change in eGFR at 12 months post-transplant. Secondary endpoints included biopsy-proven acute rejection (BPAR), patient and graft survival, composite efficacy failure, iBox score, donor-specific antibodies (DSAs), delayed graft function (DGF), and new-onset diabetes after transplantation (NODAT).
Safety Results
Safety findings underscore tegoprubart’s potential to maintain effective immunosuppression while minimizing the metabolic, neurologic, and cardiovascular toxicities characteristic of tacrolimus-based therapy.
Metabolic effects: New-onset diabetes developed in approximately 1 in 6 patients receiving tacrolimus versus 1 in 47 receiving tegoprubart.
Neurologic effects: Tremor was markedly higher in the tacrolimus group (25.0% vs. 1.6%).
Cardiovascular effects: Hypertension (15.9% vs. 25.0%), hypertensive crisis (1.6% vs. 7.8%), and heart failure (0% vs. 4.7%) all favored tegoprubart.
Renal recovery: Delayed graft function occurred less often with tegoprubart and required shorter dialysis (14.3% vs. 25.0%; 4.6 days vs. 6.1 days), suggesting potential reductions of 115 days on dialysis post-transplant per 100 deceased donor kidney recipients on tegoprubart vs. tacrolimus.
Infections: Sepsis or bacteremia occurred more frequently in the tacrolimus arm (17.2% vs. 4.8%). Viral infection rates (CMV, BK, EBV, fungal) were similar across groups, with no cases of Post-Transplant Lymphoproliferative Disorder (PTLD) or Progressive Multifocal Leukoencephalopathy (PML).
Overall rates of serious adverse events were comparable between treatment arms.
Efficacy Results
eGFR on tegoprubart treatment was 69 mL/min/1.73 m² (n=51) at 12 months vs. 66 mL/min/1.73 m² for tacrolimus (n=56). Although the primary endpoint did not reach statistical significance, tegoprubart maintained strong renal function, delivering what the Company believes is the highest mean eGFR level reported to date in kidney transplant clinical trials evaluating rejection prevention.
Subgroup analyses demonstrated higher eGFRs in nearly all tegoprubart subgroups compared with tacrolimus, particularly among living-related donor recipients (~72 mL/min/1.73 m² vs. 62 mL/min/1.73 m²) and high Kidney Donor Profile Index (KDPI > 35) transplants (~62 mL/min/1.73 m² vs. 53 mL/min/1.73 m²).
In the deceased donor subgroup, tegoprubart achieved a mean eGFR of approximately 68 mL/min/1.73 m² at 12 months.
The efficacy failure composite endpoint, comprising death, graft loss and biopsy proven acute rejection, is the approval endpoint currently recognized by the U.S. Food and Drug Administration. Efficacy failure composite endpoint was 22% in the tegoprubart group vs. 17% in the tacrolimus group, demonstrating non-inferiority for tegoprubart vs. tacrolimus, using a 20% non-inferiority margin. The Company believes these results, if replicated in a Phase 3 study, would be sufficient to support tegoprubart’s approvability.
The rate of acute rejection in all biopsies was 20.6% in the tegoprubart group compared with 14.1% in the tacrolimus group.
Among patients in the tegoprubart group who experienced acute rejection and remained on treatment through month 12, mean eGFR was 73 mL/min/1.73 m², compared with 50 mL/min/1.73 m² in those who switched to tacrolimus.
There was 1 case of donor-specific antibodies (DSA) in the tegoprubart arm vs. 2 in the tacrolimus arm.
Next Steps
Based on these results, Eledon plans to advance tegoprubart into Phase 3 development following discussions with regulators on study design and data requirements. Insights from the Phase 2 BESTOW data set and the ongoing long-term extension study will be incorporated to optimize the Phase 3 protocol and strengthen the regulatory package.
Estimated cash, cash equivalents and short-term investments totaled approximately $93.4 million as of September 30, 2025. The company expects current cash, cash equivalents and short-term investments to fund operations to late 2026.
Conference Call
Eledon will hold a conference call on November 7, 2025, at 8:00 a.m. Eastern Time to discuss the Phase 2 BESTOW trial results presented at Kidney Week. The dial-in numbers are 1-800-717-1738 for domestic callers and 1-646-307-1865 for international callers. The conference ID is 92427. A live webcast of the conference call will be available on the Investor Relations section of the Company’s website at www.eledon.com. The webcast will be archived on the website following the completion of the call and a copy of the presentation for the conference call will be posted on the Company’s website at https://ir.eledon.com/investor-relations prior to the conference call.
Full details of the oral presentation are below:
Title: Efficacy and Safety of Tegoprubart for the Prevention of Rejection in Kidney Transplantation: Results from the Phase 2 BESTOW Trial Session Title: Late-Breaking Research Orals – 1 Presenter: Andrew Adams, M.D., Ph.D., Professor of Surgery and Chief Division of Transplantation, John S. Najarian Surgical Chair in Clinical Transplantation, Department of Surgery, University of Minnesota Session Date and Time: November 6, 2025, from 4:30 p.m. to 6:00 p.m. CT
Eledon is also conducting an ongoing open label Phase 1b study (NCT05027906) and a long-term safety and efficacy extension study (NCT06126380) to evaluate tegoprubart for the prevention of organ rejection in patients receiving a kidney transplant. Participants who complete 12 months of treatment in the Phase 1b and Phase 2 BESTOW trials are eligible to enroll into the long-term extension study.
About Eledon Pharmaceuticals and tegoprubart
Eledon Pharmaceuticals, Inc. is a clinical stage biotechnology company that is developing immune-modulating therapies for the management and treatment of life-threatening conditions. The Company’s lead investigational product is tegoprubart, an anti-CD40L antibody with high affinity for the CD40 Ligand, a well-validated biological target that has broad therapeutic potential. The central role of CD40L signaling in both adaptive and innate immune cell activation and function positions it as an attractive target for non-lymphocyte depleting, immunomodulatory therapeutic intervention. The Company is building upon a deep historical knowledge of anti-CD40 Ligand biology to conduct preclinical and clinical studies in kidney allograft transplantation, xenotransplantation, and amyotrophic lateral sclerosis (ALS). Eledon is headquartered in Irvine, California. For more information, please visit the Company’s website at www.eledon.com.
Follow Eledon Pharmaceuticals on social media: LinkedIn; Twitter
Statement Regarding Preliminary Financial Information
The cash, cash equivalents and short-term investments presented in this press release is unaudited and preliminary and is subject to completion of financial closing procedures, including the completion of management’s review. The preliminary financial information is based on information currently available to management, and may vary from the amounts that will be reported in Eledon’s Quarterly Report on Form 10-Q for the quarter ended September 30, 2025 that the Company will file with the U.S. Securities and Exchange Commission.
Forward-Looking Statements
This press release contains forward-looking statements that involve substantial risks and uncertainties. Any statements about the company’s future expectations, plans and prospects, including statements about ongoing, planned and future clinical trials, the development of product candidates, expected or future results of tegoprubart trials and its ability to prevent rejection in connection with kidney transplantation, submissions to regulators, our expected cash, cash equivalents and short-term investments as well as other statements containing the words “believes,” “anticipates,” “plans,” “expects,” “estimates,” “intends,” “predicts,” “projects,” “targets,” “looks forward,” “could,” “may,” and similar expressions, constitute forward-looking statements within the meaning of the Private Securities Litigation Reform Act of 1995. Forward-looking statements are inherently uncertain and are subject to numerous risks and uncertainties, including: risks relating to the safety and efficacy of our drug candidates; risks relating to clinical development timelines, including interactions with regulators and clinical sites, as well as patient enrollment; risks relating to costs of clinical trials and the sufficiency of the company’s capital resources to fund planned clinical trials; and uncertainties relating to the completion of our quarter-end closing procedures for our financial statements for the quarter ended September 30, 2025. Actual results may differ materially from those indicated by such forward-looking statements as a result of various factors. These risks and uncertainties, as well as other risks and uncertainties that could cause the company’s actual results to differ significantly from the forward-looking statements contained herein, are discussed in our quarterly 10-Q, annual 10-K, and other filings with the U.S. Securities and Exchange Commission, which can be found at www.sec.gov. Any forward-looking statements contained in this press release speak only as of the date hereof and not of any future date, and the company expressly disclaims any intent to update any forward-looking statements, whether as a result of new information, future events or otherwise.
Patrick McCann, CFA, Research Analyst, Noble Capital Markets, Inc.
Michael Kupinski, Director of Research, Equity Research Analyst, Digital, Media & Technology , Noble Capital Markets, Inc.
Refer to the full report for the price target, fundamental analysis, and rating.
Mixed Fiscal Q1 results. SelectQuote reported Q1 revenue of $328.8 million, above our estimate of $310.0 million. Adj. EBITDA loss of $32.1 million was slightly wider than expected due to temporary pharmacy reimbursement headwinds. Overall, results showed resilient topline growth despite short-term margin pressure, reflecting solid execution across Healthcare Services and Senior segments in a seasonally lighter quarter.
Healthcare Services headwind. Lower reimbursement rates from one pharmacy benefit manager impacted both revenue and margins in Healthcare Services in the quarter. The reimbursement adjustment, tied to the PBM’s calendar-year 2025 pricing update, will continue through fiscal Q2, when management expects segment adj. EBITDA to reach breakeven before normalizing in the second half.
Equity Research is available at no cost to Registered users of Channelchek. Not a Member? Click ‘Join’ to join the Channelchek Community. There is no cost to register, and we never collect credit card information.
This Company Sponsored Research is provided by Noble Capital Markets, Inc., a FINRA and S.E.C. registered broker-dealer (B/D).
*Analyst certification and important disclosures included in the full report. NOTE: investment decisions should not be based upon the content of this research summary. Proper due diligence is required before making any investment decision.