Release – DLH Reports Fiscal 2023 Third Quarter Results

Research News and Market Data on DLHC

August 2, 2023

Quarterly Revenue Over $100 Million; Active Pipeline of Opportunities to Accelerate Growth in Fiscal 2024

ATLANTA, Aug. 02, 2023 (GLOBE NEWSWIRE) — DLH Holdings Corp. (NASDAQ: DLHC) (“DLH” or the “Company”), a leading provider of research and development, systems engineering and integration, and digital transformation solutions to federal agencies, today announced financial results for its fiscal third quarter ended June 30, 2023.

Highlights

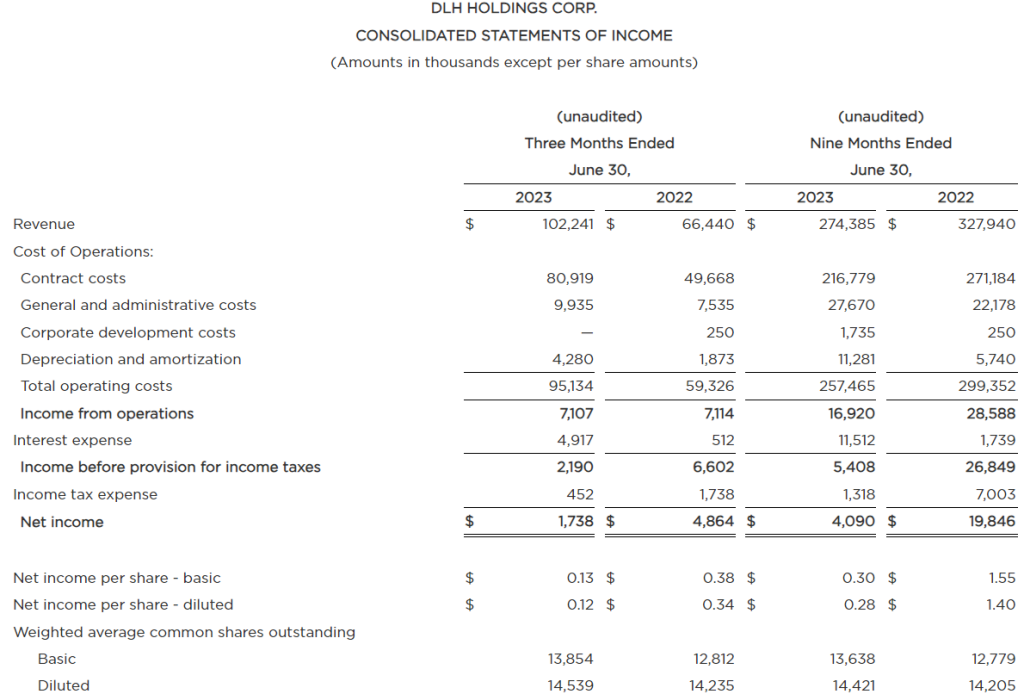
  • Third quarter revenue was $102.2 million in fiscal 2023 versus $66.4 million in fiscal 2022; the prior-year period included an adjustment of $(5.1) million related to the short-term FEMA task orders in Alaska, without which revenue was $71.6 million.
  • Operating and net income for the third quarter were $7.1 million and $1.7 million, respectively, as compared to $7.1 million and $4.9 million in the prior-year period. Operating income for the fiscal 2022 quarter included $0.6 million from the FEMA task orders.
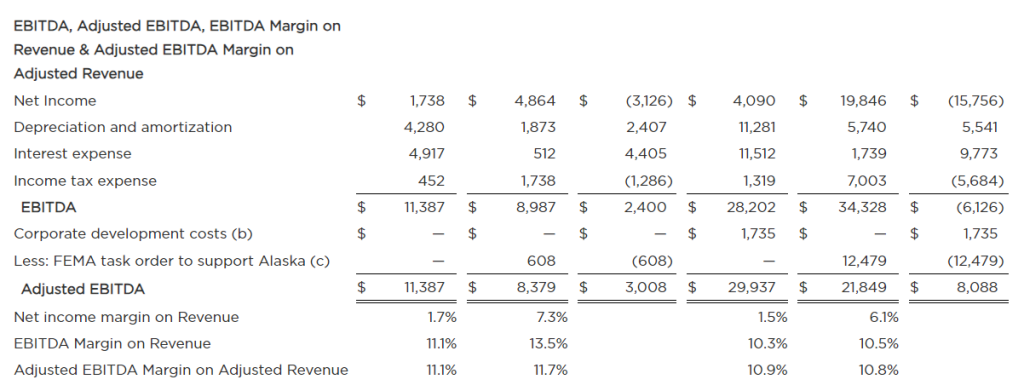
  • Earnings before interest, taxes, depreciation and amortization (“EBITDA”) was $11.4 million for the third quarter as compared to $9.0 million in fiscal 2022. The prior-year period included $0.6 million of EBITDA from the FEMA task orders.
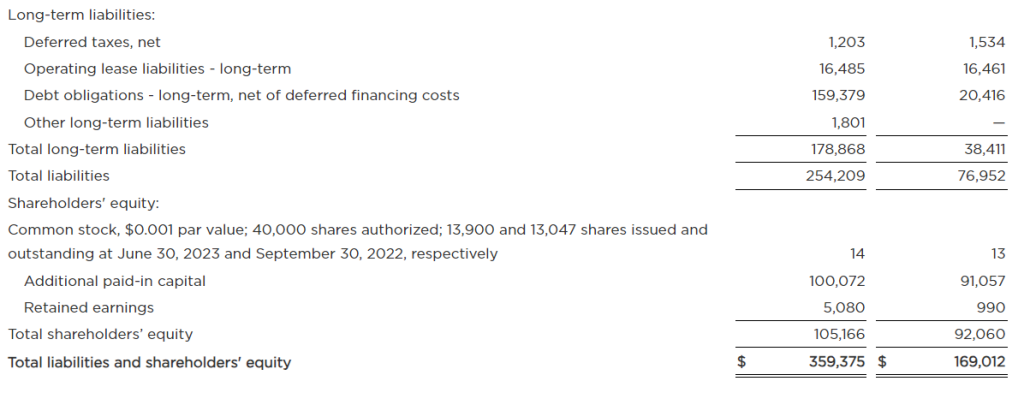
  • Total debt at the end of the third quarter was $195.8 million compared to $204.2 million as of March 31, 2023.
  • Contract backlog was $817.8 million as of June 30, 2023 versus $940.6 million at the end of the fiscal second quarter.

Management Discussion
“Third quarter performance once again highlighted the Company’s ability to produce strong underlying results,” said Zach Parker, DLH President and Chief Executive Officer. “We passed the $100 million revenue run rate, improved margins sequentially from the second quarter, used cash flow to continue paying down debt and successfully accomplished several milestones in the GRSi integration. The contract award environment continues to experience some headwinds, reflecting certain contract protests and extensive procurement cycles. The Company remains in excellent position to capitalize on current market dynamics and execute on new business development initiatives, resulting in an active bid environment. Our expanded health IT suite of solutions — leveraging unique applications and our highly-credentialed staff — provides us access to penetrate new programs within the key government agencies we serve. At the same time, with our ability to generate healthy cash from operations, we remain on track to de-lever the balance sheet in the coming quarters, which we expect will result in increased returns to our shareholders.

“In addition, we recently announced that DLH had been awarded a contract to expand our role at the National Heart, Lung and Blood Institute within the National Institutes of Health. The multiple-award contract has a total ceiling value of up to $85 million over five years, and we’ll be responsible for driving key digital transformation goals for the agency. Overall, we continue to see numerous opportunities to accelerate growth going forward, leveraging our expanded set of technology solutions, and are well prepared for further improved performance.”

Results for the Three Months Ended June 30, 2023
Revenue for the third quarter of fiscal 2023 was $102.2 million versus $66.4 million in fiscal 2022, with the prior-year period including an adjustment of $(5.1) million related to the Company’s short-term FEMA contracts in Alaska. Comparing this quarter’s revenue performance to the same period in the prior fiscal year, excluding the impact from the FEMA contracts, revenue increased $30.6 million, including contributions of $34.4 million from GRSi.

Income from operations was $7.1 million for the quarter versus $7.1 million in the prior-year period, which included $0.6 million from the FEMA task orders. Comparing this quarter’s operating income performance to the same period in the prior fiscal year, excluding the impact from the FEMA contracts, operating income increased $0.6 million. As a percentage of revenue, the Company reported an operating margin of 7.0% in the fiscal 2023 third quarter versus 10.7% in fiscal 2022, with the year-over-year decline primarily due to higher non-cash amortization expense as a result of the GRSi acquisition.

Interest expense was $4.9 million in the fiscal third quarter of 2023 versus $0.5 million in the prior-year period, reflecting higher debt outstanding due to the acquisition of GRSi and increased interest rates. Income before income taxes was $2.2 million this year versus $6.6 million in fiscal 2022, representing 2.1% and 9.9% of revenue, respectively, for each period.

For the three months ended June 30, 2023 and 2022, respectively, DLH recorded a $0.5 million and $1.7 million of income tax expense. The Company reported net income of approximately $1.7 million, or $0.12 per diluted share, for the third quarter of fiscal 2023 versus $4.9 million or $0.34 per diluted share, for the third quarter of fiscal 2022. As a percentage of revenue, net income was 1.7% for the third quarter of fiscal 2023 versus 7.3% for the prior-year period.

On a non-GAAP basis, EBITDA for the three months ended June 30, 2023 was approximately $11.4 million versus $9.0 million in the prior-year period, or 11.1% and 13.5% of revenue, respectively. Adjusted EBITDA1 was $11.4 million versus $8.4 million for the prior-year period, or 11.1% and 11.7% of adjusted revenue, respectively.

Key Financial Indicators
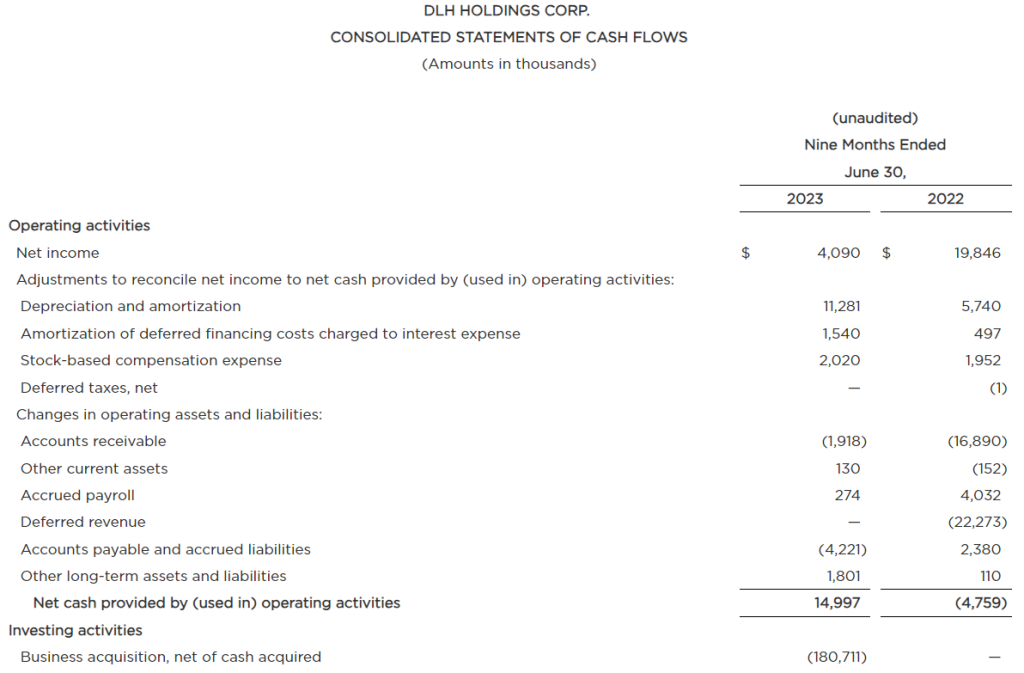
For fiscal 2023, DLH has produced $15.0 million in operating cash. As of June 30, 2023, the Company had cash of $0.5 million and debt outstanding under its credit facilities of $195.8 million versus cash of $1.1 million and debt outstanding of $22.0 million as of September 30, 2022. The Company is on pace to reduce its total debt balance to between $185.0 million and $187.0 million by the end of this fiscal year.

At June 30, 2023, total backlog was approximately $817.8 million, including funded backlog of approximately $147.3 million and unfunded backlog of $670.5 million.

Conference Call and Webcast Details
DLH management will discuss third quarter results and provide a general business update, including current competitive conditions and strategies, during a conference call beginning at 10:00 AM Eastern Time tomorrow, August 3, 2023. Interested parties may listen to the conference call by dialing 888-347-5290 or 412-317-5256.   Presentation materials will also be posted on the Investor Relations section of the DLH website prior to the commencement of the conference call.     

A digital recording of the conference call will be available for replay two hours after the completion of the call and can be accessed on the DLH Investor Relations website or by dialing 877-344-7529 and entering the conference ID 5343381.

About DLH
DLH (NASDAQ:DLHC) enhances public health and national security readiness missions through science, technology, cyber, and engineering solutions and services. Our experts solve some of the most complex and critical missions faced by federal customers, leveraging digital transformation, artificial intelligence, advanced analytics, cloud-based applications, telehealth systems, and more. With over 3,200 employees dedicated to the idea that “Your Mission is Our Passion,” DLH brings a unique combination of government sector experience, proven methodology, and unwavering commitment to innovative solutions to improve the lives of millions. For more information, visit www.DLHcorp.com.

Safe Harbor Statement under the Private Securities Litigation Reform Act of 1995:
This press release may contain forward-looking statements within the meaning of the Private Securities Litigation Reform Act of 1995. These statements relate to future events or DLH`s future financial performance. Any statements that refer to expectations, projections or other characterizations of future events or circumstances or that are not statements of historical fact (including without limitation statements to the effect that the Company or its management “believes”, “expects”, “anticipates”, “plans”, “intends” and similar expressions) should be considered forward looking statements that involve risks and uncertainties which could cause actual events or DLH’s actual results to differ materially from those indicated by the forward-looking statements. Forward-looking statements in this release include, among others, statements regarding estimates of future revenues, operating income, earnings and cash flow. These statements reflect our belief and assumptions as to future events that may not prove to be accurate. Our actual results may differ materially from such forward-looking statements made in this release due to a variety of factors, including: the risk that we will not realize the anticipated benefits of our acquisition of GRSi or any other acquisitions (including anticipated future financial performance and results); the diversion of management’s attention from normal daily operations of the business and the challenges of managing larger and more widespread operations resulting from our recent acquisition; the inability to retain employees and customers; contract awards in connection with re-competes for present business and/or competition for new business; our ability to manage our increased debt obligations; compliance with bank financial and other covenants; changes in client budgetary priorities; government contract procurement (such as bid and award protests, small business set asides, loss of work due to organizational conflicts of interest, etc.) and termination risks; the ability to successfully integrate the operations of GRSi or any future acquisitions; the impact of inflation and higher interest rates; and other risks described in our SEC filings. For a discussion of such risks and uncertainties which could cause actual results to differ from those contained in the forward-looking statements, see “Risk Factors” in the Company’s periodic reports filed with the SEC, including our Annual Report on Form 10-K for the fiscal year ended September 30, 2022, as well as subsequent reports filed thereafter. The forward-looking statements contained herein are not historical facts, but rather are based on current expectations, estimates, assumptions and projections about our industry and business.

Such forward-looking statements are made as of the date hereof and may become outdated over time. The Company does not assume any responsibility for updating forward-looking statements, except as may be required by law.

CONTACTS:

INVESTOR RELATIONS
Contact: Chris Witty
Phone: 646-438-9385
Email: cwitty@darrowir.com

Non-GAAP Financial Measures
The Company uses EBITDA and EBITDA Margin on Revenue as supplemental non-GAAP measures of performance. We define EBITDA as net income excluding (i) interest expense, (ii) provision for or benefit from income taxes and (iii) depreciation and amortization. EBITDA Margin on Revenue is EBITDA for the measurement period divided by revenue for the same period.

The Company is presenting additional non-GAAP measures regarding its financial performance for the three and nine months ended June 30, 2023. The measures presented are Adjusted Revenue, Adjusted Operating Income, Adjusted EBITDA, and Adjusted EBITDA Margin on Adjusted Revenue. In calculating these measures, we have added the corporate development costs associated with completing the GRSi acquisition to our results for fiscal year 2023 and we have removed the contribution from the FEMA task orders from the results for fiscal year 2022. These resulting measures present the quarterly financial performance compared to results delivered in the prior year period. Definitions of these additional non-GAAP measures are set forth below.

We have prepared these additional non-GAAP measures to eliminate the impact of items that we do not consider indicative of ongoing operating performance due to their inherent unusual or extraordinary nature. These non-GAAP measures of performance are used by management to conduct and evaluate its business during its review of operating results for the periods presented. Management and the Company’s Board utilize these non-GAAP measures to make decisions about the use of the Company’s resources, analyze performance between periods, develop internal projections and measure management performance. We believe that these non-GAAP measures are useful to investors in evaluating the Company’s ongoing operating and financial results and understanding how such results compare with the Company’s historical performance.

These supplemental performance measurements may vary from and may not be comparable to similarly titled measures by other companies in our industry. Adjusted Revenue, Adjusted Operating Income, EBITDA, Adjusted EBITDA, EBITDA Margin on Revenue, and Adjusted EBITDA Margin on Adjusted Revenue are not recognized measurements under accounting principles generally accepted in the United States, or GAAP, and when analyzing our performance investors should (i) evaluate each adjustment in our reconciliation to the nearest GAAP financial measures and (ii) use the aforementioned non-GAAP measures in addition to, and not as an alternative to, revenue, operating income, net income or diluted EPS, as measures of operating results, each as defined under GAAP. We have defined these non-GAAP measures as follows:

“Adjusted Revenue” represents revenue less the contribution to revenue from the short-term FEMA task orders

“Adjusted Operating Income” represents operating income plus the corporate development costs associated with completing the GRSi acquisition incurred in fiscal 2023 less the contribution from the FEMA task orders, which occurred in fiscal 2022.

“Adjusted EBITDA” represents net income before income taxes, interest, depreciation and amortization and the corporate costs associated with completing the acquisition, less the contribution from FEMA task orders. “Adjusted EBITDA Margin on Adjusted Revenue” is calculated as Adjusted EBITDA divided by Adjusted Revenue.

Below is a reconciliation of Adjusted Revenue, Adjusted Operating Income, EBITDA, Adjusted EBITDA, EBITDA Margin on Revenue and Adjusted EBITDA Margin on Adjusted Revenue reported for the three and six months ended June 30, 2023 and 2022 compared to the most directly comparable financial measure calculated and presented in accordance with GAAP (in thousands except for per share amounts):

(a): Represents revenue adjusted to exclude revenue from the short-term FEMA task orders during the three and nine months ended June 30, 2022.

(b): Represents corporate development costs we incurred to complete the GRSi transaction. These costs primarily include legal counsel, financial due diligence, customer market analysis and representation and warranty insurance premiums.

(c): Adjusted operating income represents the Company’s consolidated operating income, determined in accordance with GAAP, adjusted to add the corporate development costs associated with the GRSi acquisition for fiscal year 2023 and adjusted to exclude the operating income derived from the FEMA task orders. Operating income for the FEMA task orders is derived by subtracting contract costs of ($5.7) million from the revenue attributable to such task orders during the three months ended June 30, 2022 of ($5.1) million. Similarly, for the nine months ended June 30, 2022 operating income for the FEMA task orders is derived by subtracting from the revenue attributable to the tasks orders of $125.8 million the following amounts associated with such task orders: contract costs $112.1 million and general & administrative costs of $1.2 million.

_______________________________
1 Adjusted Operating Income,   EBITDA, Adjusted EBITDA, EBITDA Margin on Revenue, and Adjusted EBITDA Margin on Adjusted Revenue are non-GAAP financial measures. See “Non-GAAP Financial Measures” below for additional detail.

Seanergy Maritime (SHIP) – Results better than expected and should improve in upcoming quarters


Thursday, August 03, 2023

Seanergy Maritime Holdings Corp. is the only pure-play Capesize ship-owner publicly listed in the US. Seanergy provides marine dry bulk transportation services through a modern fleet of Capesize vessels. The Company’s operating fleet consists of 17 Capesize vessels with an average age of approximately 12 years and aggregate cargo carrying capacity of approximately 3,011,083 dwt. The Company is incorporated in the Marshall Islands and has executive offices in Glyfada, Greece. The Company’s common shares trade on the Nasdaq Capital Market under the symbol “SHIP” and its Class B warrants under “SHIPZ”.

Michael Heim, Senior Vice President, Equity Research Analyst, Energy & Transportation, Noble Capital Markets, Inc.

Refer to the full report for the price target, fundamental analysis, and rating.

Seanergy reported 2023-2Q results slightly above our expectations. Seanergy reported net revenues of $28.3 million on an average TCE rate of $18,708/day versus our estimate of $26.4 million and $18,000/day, respectively. Adjusted EBITDA and EPS were $12.7 million and $0.18 versus our estimate of $10.6 million and $0.12. Higher-than-expected results reflect strong utilization rates, high interest income, and the positive effect of debt restructuring. 

The company is setting up for a strong 4Q and 2024. The company has locked in 53% of 2023-3Q shipping days at a rate of $16,710/day, slightly below 3Q rates. However, it has locked in 21% of 2023-2H days at rates above $20,000/day, implying that locked in rates will be improving in 4Q. In addition, Seanergy will take possession of a new ship in 4Q (with option to buy in a year) which management estimates will receive a 20% premium to Baltic Capesize Index prices. 


Get the Full Report

Equity Research is available at no cost to Registered users of Channelchek. Not a Member? Click ‘Join’ to join the Channelchek Community. There is no cost to register, and we never collect credit card information.

This Research is provided by Noble Capital Markets, Inc., a FINRA and S.E.C. registered broker-dealer (B/D).

*Analyst certification and important disclosures included in the full report. NOTE: investment decisions should not be based upon the content of this research summary. Proper due diligence is required before making any investment decision. 

DLH Holdings (DLHC) – Better Than Expected Third Quarter Results


Thursday, August 03, 2023

DLH delivers improved health and readiness solutions for federal programs through research, development, and innovative care processes. The Company’s experts in public health, performance evaluation, and health operations solve the complex problems faced by civilian and military customers alike, leveraging digital transformation, artificial intelligence, advanced analytics, cloud-based applications, telehealth systems, and more. With over 2,300 employees dedicated to the idea that “Your Mission is Our Passion,” DLH brings a unique combination of government sector experience, proven methodology, and unwavering commitment to public health to improve the lives of millions. For more information, visit www.DLHcorp.com.

Joe Gomes, Managing Director, Equity Research Analyst, Generalist , Noble Capital Markets, Inc.

Joshua Zoepfel, Research Associate, Noble Capital Markets, Inc.

Refer to the full report for the price target, fundamental analysis, and rating.

3Q Results. DLH posted revenue of $102.2 million from $66.4 million last year. Excluding FEMA (negative $5.1 million impact), revenue last year was $71.6 million. GRSi contributed $34.4 million towards revenue which indicates core business decreasing $3.8 million y-o-y. Net income for DLH was $1.7 million, or $0.12 per diluted share, compared to $4.9 million, or $0.34 per share, last year. EBITDA was at $11.4 million versus $9.0 million in the prior year. We had estimated revenue of $102 million, adjusted EBITDA of $11 million, and EPS of $0.10.

Other Key Indicators. DLH produced $15.0 million in operating cash in the quarter and had cash of $0.5 million and debt outstanding under its credit facilities of $195.8 million as of June 30, 2023. The Company paid off $8.4 million of debt from the previous quarter, and the Company lowered the range on its pace to reduce its total debt balance to between $185.0-$187 million from $185.0-$190 million by the end of this fiscal year.


Get the Full Report

Equity Research is available at no cost to Registered users of Channelchek. Not a Member? Click ‘Join’ to join the Channelchek Community. There is no cost to register, and we never collect credit card information.

This Company Sponsored Research is provided by Noble Capital Markets, Inc., a FINRA and S.E.C. registered broker-dealer (B/D).

*Analyst certification and important disclosures included in the full report. NOTE: investment decisions should not be based upon the content of this research summary. Proper due diligence is required before making any investment decision. 

Direct Digital Holdings (DRCT) – Quarterly Preview: Expect A Noisy Quarter


Thursday, August 03, 2023

Michael Kupinski, Director of Research, Equity Research Analyst, Digital, Media & Technology , Noble Capital Markets, Inc.

Patrick McCann, CFA, Research Analyst, Noble Capital Markets, Inc.

Refer to the full report for the price target, fundamental analysis, and rating.

Upcoming quarterly results. The company is expected to report second quarter results on Thursday, August 10th with an investor call scheduled for 5pm ET. The dial in number is (888) 350-2056. 

Mixed results. We believe that the company will be in line with our revenue estimate of $29.65 million, up 39.5%, reflecting modest Buy-side advertising growth of 3.5% and strong Sell-side advertising growth of roughly 67%. Sell-side margins are expected to decline to roughly 12.5%, due to a step up in costs for additional servers. We do not believe that the increase costs will be ongoing and that Sell-side margins should rebound to the near 14% range for the balance of the year.  


Get the Full Report

Equity Research is available at no cost to Registered users of Channelchek. Not a Member? Click ‘Join’ to join the Channelchek Community. There is no cost to register, and we never collect credit card information.

This Company Sponsored Research is provided by Noble Capital Markets, Inc., a FINRA and S.E.C. registered broker-dealer (B/D).

*Analyst certification and important disclosures included in the full report. NOTE: investment decisions should not be based upon the content of this research summary. Proper due diligence is required before making any investment decision. 

Commercial Vehicle Group, Inc. (CVGI) – Post Call Commentary – Continuing to Implement the Strategy


Thursday, August 03, 2023

Joe Gomes, Managing Director, Equity Research Analyst, Generalist , Noble Capital Markets, Inc.

Joshua Zoepfel, Research Associate, Noble Capital Markets, Inc.

Refer to the full report for the price target, fundamental analysis, and rating.

The Strategy is Working. We would reiterate what we have previously noted: the strategy is working. Once again, CVG posted record quarterly revenue and improved margins for the quarter. We believe CVG is at an inflection point for improved growth and margins. The Company is well on its way to achieving its 2027 goal of $1.5 billion in revenue and 9% adjusted EBITDA margin, in our view.

Continue to Add New Business. CVG recorded approximately $40 million of new business wins in the quarter, increasing the YTD number to $125 million, rapidly approaching the already upward revised 2023 goal of $150 million of new business wins. The majority of new business wins continue to be within the Electrical Systems segment.


Get the Full Report

Equity Research is available at no cost to Registered users of Channelchek. Not a Member? Click ‘Join’ to join the Channelchek Community. There is no cost to register, and we never collect credit card information.

This Company Sponsored Research is provided by Noble Capital Markets, Inc., a FINRA and S.E.C. registered broker-dealer (B/D).

*Analyst certification and important disclosures included in the full report. NOTE: investment decisions should not be based upon the content of this research summary. Proper due diligence is required before making any investment decision. 

Why T Cells Fail to Eliminate Cancer Cells

A cytotoxic T cell (blue) attacks a cancer cell (green) by releasing toxic chemicals (red). Alex Ritter and Jennifer Lippincott Schwartz and Gillian Griffiths/National Institutes of Health via Flickr

 Immune Cells that Fight Cancer Become Exhausted Within Hours of First Encountering Tumors

A key function of our immune system is to detect and eliminate foreign pathogens such as bacteria and viruses. Immune cells like T cells do this by distinguishing between different types of proteins within cells, which allows them to detect the presence of infection or disease.

A type of T cell called cytotoxic T cells can recognize the mutated proteins on cancer cells and should therefore be able to kill them. However, in most patients, cancer cells grow unchecked despite the presence of T cells.

The current explanation scientists have as to why T cells fail to eliminate cancer cells is because they become “exhausted.” The idea is that T cells initially function well when they first face off against cancer cells, but gradually lose their ability to kill the cancer cells after repeated encounters.

Cancer immunotherapies such as immune checkpoint inhibitors and CAR-T cell therapy have shown remarkable promise by inducing long-lasting remission in some patients with otherwise incurable cancers. However, these therapies often fail to induce long-term responses in most patients, and T cell exhaustion is a major culprit.

This article was republished with permission from The Conversation, a news site dedicated to sharing ideas from academic experts. It represents the research-based findings and thoughts of Mary Philip, Assistant Professor of Medicine and Pathology, Vanderbilt University and Michael Rudloff, MD-Ph.D. Candidate in Molecular Pathology and Immunology, Vanderbilt University.

We are researchers who study ways to harness the immune system to treat cancer. Scientists like us have been working to determine the mechanisms controlling how well T cells function against tumors. In our newly published research, we found that T cells become exhausted within hours after encountering cancer cells.

Timing T Cell Exhaustion

By the time most patients are diagnosed with cancer, their immune system has been interacting with developing cancer cells for months to years. We wanted to go back earlier in time to figure out what happens when T cells first encounter tumor cells.

To do this, we used mice genetically engineered to develop liver cancers as they age, similarly to how liver cancers develop in people. We introduced trackable cytotoxic T cells that specifically recognize liver cancer cells to analyze the T cells’ function and monitor which of the genes are activated or turned off over time.

We also used these same trackable T cells to study their response in mice infected with the bacteria Listeria. In these mice, we found that the T cells were highly functional and eliminated infected cells. By comparing the differences between dysfunctional T cells from tumors and highly functional T cells from infected mice, we can home in on the genes that code for critical proteins that T cells use to regulate their function.

In our previous work, we found that T cells become dysfunctional with dramatically altered genetic structure within five days of encountering cancer cells in mice. We had originally decided to focus on the very earliest time points after T cells encounter cancer cells in mice with liver cancer or metastatic melanoma because we thought there would be fewer genetic changes. That would have allowed us to identify the earliest and most critical regulators of T cell dysfunction.

Instead, we found multiple surprising hallmarks of T cell dysfunction within six to 12 hours after they encountered cancer cells, including thousands of changes in genetic structure and gene expression.

T cells play an important role in fighting against disease. National Institute of Allergy and Infectious Diseases

We analyzed the different regulatory genes and pathways in T cells encountering cancer cells compared to those of T cells encountering infected cells. We found that genes associated with inflammation were highly activated in T cells interacting with infected cells but not in T cells interacting with cancer cells.

Next, we looked at how the initial early changes to the genetic structure of T cells evolved over time. We found that very early DNA changes were stabilized and reinforced with continued exposure to cancer cells, effectively “imprinting” dysfunctional gene expression patterns in the T cells. This meant that when the T cells were removed from the tumors after five days and transferred to tumor-free mice, they still remained dysfunctional.

Boosting T Cell Killing

Altogether, our research suggests that T cells in tumors are not necessarily working hard and getting exhausted. Rather, they are blocked right from the start. This is because the negative signals cancer cells send out to their surrounding environment induce T cell dysfunction, and a lack of positive signals like inflammation results in a failure to kick T cells into high gear.

Our team is now exploring strategies to stimulate inflammatory pathways in T cells encountering cancer cells to make them function as though they are encountering an infection. Our hope is that this will help T cells kill their cancer targets more effectively.

Higher Rates Could Mean More Equity Financing, What Investors Should Know

How Does Additional Equity Financing Affect Existing Shareholders?

Fitch Ratings was able to do for interest rates what the Federal Reserve has been looking to do for almost two years, increase them out along the yield curve. And this changes corporate finance in a way that impacts stock market investors. The ten-year US Treasury Note has gained nearly 0.25% since Monday July 31 as a result of the Fitch credit downgrade and big-name firms like Bank of America forecasting a soft landing. Some companies looking to grow through increased financing are now faced with either substantially increased borrowing costs or going to the equity markets and diluting shareholder value. How should shareholders look at share dilution considering today’s cost of money?

Equity Financing

Try to picture management of a company you are invested in that decides it needs funds to to either expand its operations, get out in front of competitors in new and growing markets, or even ease its financial burdens. Borrowing in the public markets, when possible, is much more expensive for a public company today.  This is why investors can expect more equity financing, by management offering shares not in circulation of the company to investors under today’s conditions.

The problem with this is that there is an immediate mathematical reaction. For simplicity, imagine you’re a shareholder in a company with 10% ownership. Suddenly, the company issues more shares, raising the total number in circulation. This increase creates a phenomenon known as share dilution. It dilutes your ownership percentage and, consequently, the value of your existing shares. This dilution can spark unease among investors, potentially leading to sell-offs in excess of the dilution.

On the day the shares are made available, the impact is real, long term shareholders that trust management may think of it as smart growth financing, but those in the company for a short trade may never realize the benefits of the company’s investment in growth.     

As a company issues new shares, its earnings-per-share (EPS) – a measure of profitability – often takes a hit. Consider a company with 10 million shares and an EPS of $0.20. If it issues 5 million more shares, the total becomes 15 million shares. Even if profits stay steady, EPS drops to $0.13 due to the increased share count.

This EPS dip isn’t taken lightly; it can be viewed as reflecting shifts in a company’s financial health, affecting investor perceptions and the stock price.

Stock Price Impact

An EPS drop from equity financing can initially dampen stock prices. Yet, it’s not a one-size-fits-all scenario. If a company uses the raised capital as an investment in the future by paying off debt or fueling strategic growth, a more positive outcome than not financing in this way can occur. Later, share prices might climb, reflecting optimism about the company’s future potential.

In contrast, if a struggling company resorts to equity financing as a last resort, stock prices might continue their downward trajectory, signaling financial instability.

Key Considerations

Deciding when to issue additional shares is a strategic move that companies carefully consider based on their financial needs, growth plans, market conditions, and investor sentiment. Here are some key factors that companies often take into account when making this decision:

Capital Requirements: Companies assess their current financial needs, including expansion plans, research and development, debt repayment, acquisitions, and working capital. If traditional financing options like bank loans or internal reserves are insufficient or less favorable, issuing additional shares might be considered.

Growth Opportunities: If a company identifies significant growth opportunities that require substantial capital infusion, issuing additional shares could be an effective way to fund those initiatives. This could involve entering new markets, launching new product lines, or investing in innovative technologies.

Market Conditions: Companies closely monitor the overall stock market conditions and investor sentiment. If the market is favorable and investor confidence is high, issuing new shares might be more likely to garner positive reception and minimize potential dilution concerns.

Debt Management: If a company aims to reduce its debt burden, it might issue new shares to raise capital for paying off loans or bonds. This can improve the company’s debt-to-equity ratio and overall financial stability.

Investor Demand: If there is strong demand from institutional investors or strategic partners to invest in the company, it might signal a good opportunity to issue additional shares. This can also boost the company’s credibility and valuation.

Valuation Considerations: Companies assess their current stock valuation and evaluate whether issuing new shares is likely to be accretive or dilutive to existing shareholders. If the company’s stock is trading at a relatively high valuation, issuing shares might be more attractive.

Investor Communication: Open and transparent communication with existing shareholders is vital. Companies often engage with their investor base to gauge their opinions on potential equity financing and address concerns.

Regulatory Considerations: The regulatory environment and legal requirements related to equity issuance need to be taken into account. Companies must comply with securities regulations and fulfill disclosure obligations.

Timing: Timing is an important ingredient. Companies aim to issue shares when market conditions are favorable and the company’s financial performance is strong. However, they must also balance this with their immediate needs and long-term goals.

Alternatives to Equity Financing: Companies explore other financing options, such as debt issuance, venture capital, private equity, or strategic partnerships. They compare these options to issuing additional shares and choose the one that aligns best with their goals.

Management’s Vision:The company’s management team plays a crucial role in the decision. They consider the company’s long-term vision, strategic goals, and the potential impact of issuing additional shares on the company’s future prospects.

The decision to issue additional shares involves management’s comprehensive evaluation of the company’s financial situation, growth prospects, market conditions, and investor sentiment. It’s a strategic move that requires careful analysis to balance the company’s short-term and long-term objectives while considering the potential impact on existing shareholders. Investors that trust management to do what is best are more comfortable with these financial decisions than those either distrusting or unfamiliar with affirms management.

Tesla as an Example

The case of Tesla (TSLA) exemplifies the nuances of equity financing. In February 2020, Tesla announced plans to issue 2.65 million equity shares. The funds were intended to enhance the company’s financial position and support various initiatives. While this move could have triggered concerns about share dilution, Tesla’s clear plan and CEO Elon Musk’s commitment to invest in these shares painted a positive picture.

Take Away

Additional equity financing is a complex decision for companies that could lead to different outcomes. Share dilution and EPS shifts can trigger investor reactions, impacting stock prices. However, a well-executed strategy can offer forward-looking investors a reason to be confident in their holdings or even a reason to increase their share number. Overall, understanding these dynamics is essential for investors and company stakeholders alike.

Paul Hoffman

Managing Editor, Channelchek

Release – Salem Media Group Schedules Second Quarter 2023 Earnings Release and Teleconference

Research News and Market Data on SALM

August 02, 2023 11:13am EDT

IRVING, Texas–(BUSINESS WIRE)– Salem Media Group, Inc. (NASDAQ: SALM) announced today that it plans to report its second quarter 2023 financial results after the market closes on August 8, 2023.

The company also plans to host a teleconference to discuss its results on August 8, 2023, at 4:00 PM Central Time. To access the teleconference, please dial (888) 770-7291, and then ask to be joined to the Salem Media Group Second Quarter 2023 call or listen to the webcast.

A replay of the teleconference will be available through August 22, 2023, and can be heard by dialing (800) 770-2030 – replay pin number 2413416, or on the investor relations portion of the company’s website, located at investor.salemmedia.com.

ABOUT SALEM MEDIA GROUP:

Salem Media Group is America’s leading multimedia company specializing in Christian and conservative content, with media properties comprising radio, digital media and book and newsletter publishing. Each day Salem serves a loyal and dedicated audience of listeners and readers numbering in the millions nationally. With its unique programming focus, Salem provides compelling content, fresh commentary and relevant information from some of the most respected figures across the Christian and conservative media landscape. Learn more about Salem Media Group, Inc. at www.salemmedia.comFacebook and Twitter.

View source version on businesswire.com: https://www.businesswire.com/news/home/20230801477446/en/

Evan D. Masyr
Executive Vice President and Chief
Financial Officer
(805) 384-4512
evan@salemmedia.com

Source: Salem Media Group, Inc.

Released August 2, 2023

Release – PDS Biotech to Present at BTIG Virtual Biotechnology Conference 2023

Research News and Market Data on PDSB

PRINCETON, N.J., Aug. 02, 2023 (GLOBE NEWSWIRE) — PDS Biotechnology Corporation (Nasdaq: PDSB), a clinical-stage immunotherapy company developing a growing pipeline of targeted cancer immunotherapies and infectious disease vaccines based on the Company’s proprietary T cell activating platforms, today announced that Dr. Frank Bedu-Addo, Chief Executive Officer, will participate in a fireside chat at the BTIG Virtual Biotechnology Conference 2023 being held August 7-8, 2023. Details for the event are as follows:

BTIG Virtual Biotechnology Conference 2023
Presentation Date: Tuesday, August 8, 2023
Event: Fireside chat
Time: 11:30 AM EDT

For more information about the conference or to schedule one-on-one meetings, please contact your BTIG representative directly.

About PDS Biotechnology
PDS Biotech is a clinical-stage immunotherapy company developing a growing pipeline of targeted cancer and infectious disease immunotherapies based on our proprietary Versamune®, Versamune® plus PDS0301, and Infectimune® T cell-activating platforms. We believe our targeted immunotherapies have the potential to overcome the limitations of current immunotherapy approaches through the activation of the right type, quantity and potency of T cells. To date, our lead Versamune® clinical candidate, PDS0101, has demonstrated the ability to reduce and shrink tumors and stabilize disease in combination with approved and investigational therapeutics in patients with a broad range of HPV16-associated cancers in multiple Phase 2 clinical trials and will be advancing into a Phase 3 clinical trial in combination with KEYTRUDA® for the treatment of recurrent/metastatic HPV16-positive head and neck cancer in 2023. Our Infectimune® based vaccines have also demonstrated the potential to induce not only robust and durable neutralizing antibody responses, but also powerful T cell responses, including long-lasting memory T cell responses in pre-clinical studies to date. To learn more, please visit www.pdsbiotech.com or follow us on Twitter at @PDSBiotech.

Investor Relations:
Deanne Randolph
PDS Biotech
Phone: +1 (908) 517-3613
Email: drandolph@pdsbiotech.com

Rich Cockrell
CG Capital
Phone: +1 (404) 736-3838
Email: pdsb@cg.capital

Media Contacts:
Tiberend Strategic Advisors, Inc.
Dave Schemelia
Phone: +1 (609) 468-9325
dschemelia@tiberend.com

Eric Reiss
Phone: +1 (802) 249-1136
ereiss@tiberend.com

Release – CVG Reports Second Quarter 2023 Results

Research News and Market Data on CVGI

AUGUST, 01, 2023

Strong quarterly revenues of $262 million, up 4.5% year-over-year
EPS of $0.30, adjusted EBITDA of $20.8 million or 7.9% of revenue
Continued strategy execution and operational excellence driving improved results

NEW ALBANY, Ohio, Aug. 01, 2023 (GLOBE NEWSWIRE) — CVG (NASDAQ: CVGI), a diversified industrial products and services company, today announced financial results for its second quarter ended June 30, 2023.

Second Quarter 2023 Highlights (Compared with prior year, where comparisons are noted)

  • Revenues of $262.2 million, up 4.5% primarily driven by strong price realization.
  • Operating income of $15.9 million, up 156.0%; adjusted operating income of $16.7 million, up 106.2%. Improved operating income was driven primarily by improved pricing and cost management.
  • Net income of $10.1 million, or $0.30 per diluted share. Adjusted net income of $10.7 million, or $0.32 per diluted share.
  • Adjusted EBITDA of $20.8 million, up 67.7% with an adjusted EBITDA margin of 7.9%, tracking further towards the Company’s long-term profitability target.
  • Net new business wins year-to-date are $124 million. The majority of the new business awards continue to be in the Electrical Systems segment.
  • Our cost reduction program continues to deliver cost savings through process improvements, footprint changes and organizational streamlining.

Robert C. Griffin, Chairman of the Board and Interim President and Chief Executive Officer, said, “CVG delivered solid second quarter results and we continued to execute well on our long-term strategy. The team’s efforts to drive the Company’s strategic plan are delivering improved financial results, highlighted by strong improvements in revenue, operating income, adjusted EBITDA and free cash flow during the quarter. Additionally, I am pleased to report that our Electrical Systems plant expansions are on track and the Aldama, Mexico plant is open and ramping up production. We remain on track to deliver record revenues in 2023 and continue to expect our full year Adjusted EBITDA margins to show significant expansion versus last year, based on the current vehicle production outlook for the second half of the year. We also believe we continue to be on track to deliver our 2027 targets of $1.5 billion in revenue and 9% EBITDA margin.”

Mr. Griffin concluded, “I would like to thank our team of employees who helped us improve CVG this quarter and continue to execute our strategy of growing and diversifying our revenue, optimizing our cost structure through process automation and cost reduction, and increasing our margins to become a bigger, more profitable company.”

Andy Cheung, Chief Financial Officer, added, “The continued execution of our strategy is delivering improved financial results for CVG.   Our focus on winning new business, improved price realization and cost reduction has allowed us to continue to improve our margins and profit.   Additionally, we remain heavily focused on optimizing working capital, increasing cash flows, and paying down our debt.”

Consolidated Results

Second Quarter 2023 Results

  • Second quarter 2023 revenues were $262.2 million, compared to $250.8 million in the prior year period, an increase of 4.5%. The increase in revenues was primarily driven by increased pricing and volume from new Electrical Systems business, partially offset by lower volumes in the Industrial Automation segment. Foreign currency translation also favorably impacted second quarter 2023 revenues by $0.7 million, or 0.3%.
  • Operating income in the second quarter 2023 was $15.9 million compared to $6.2 million in the prior year period. The increase in operating income was attributable to higher margins, partially offset by higher SG&A. The second quarter 2023 adjusted operating income was $16.7 million, excluding special charges.
  • Interest associated with debt and other expenses was $2.8 million and $2.1 million for the second quarter 2023 and 2022, respectively.
  • Net income was $10.1 million, or $0.30 per diluted share, for the second quarter 2023 compared to net income of $2.5 million, or $0.08 per diluted share, in the prior year period.

At June 30, 2023, the Company had $9.0 million of outstanding borrowings on its U.S. revolving credit facility and $4.1 million outstanding on its China credit facility, $42.4 million of cash and $148.1 million of availability from the credit facilities, resulting in total liquidity of $190.5 million.

Second Quarter 2023 Segment Results

Vehicle Solutions Segment

  • Revenues were $152.7 million compared to $142.8 million for the prior year period, an increase of 7.0%, primarily resulting from increased pricing.
  • Operating income was $14.1 million, compared to $1.5 million in the prior year period, an increase of 836.7%, primarily attributable to price increases with customers and cost reduction initiatives. Adjusted operating income was $14.5 million.

   Electrical Systems Segment

  • Revenues were $63.6 million compared to $47.3 million in the prior year period, an increase of 34.4%, primarily resulting from increased sales volume and pricing.
  • Operating income was $7.7 million compared to $5.9 million in the prior year period, an increase of 28.9%. The increase in operating income was primarily attributable to increased sales volume and pricing.

Aftermarket & Accessories Segment

  • Revenues were $36.8 million compared to $32.2 million in the prior year period, an increase 14.5%, primarily resulting from increased pricing.
  • Operating income was $5.5 million compared to $1.1 million in the prior year period, an increase of 388.2%. The increase in operating income was primarily attributable to increased pricing and cost reduction.

Industrial Automation Segment

  • Revenues were $9.0 million compared to $28.5 million in the prior year period, a decrease of 68.4%, primarily due to decreased customer demand which is expected to continue in the third quarter.
  • Operating loss was $2.1 million compared to operating income of $1.3 million in the prior year period. The decrease in operating income was primarily attributable to volume reduction and an inventory charge of $1.6 million. Adjusted operating loss was $1.7 million.

2023 Demand Outlook

According to ACT Research, 2023 North American Class 8 truck production levels are expected to be at 339,000 units and Class 5-7 production levels are expected to be at 258,000 units. Estimates from FTR for 2023 are 325,000 units, slightly lower than ACT Research for Class 8 truck builds. The 2022 actual Class 8 truck builds according to the ACT Research was 315,128 units.

The global commercial and automotive vehicle wire harness market is growing at approximately 4.5%.​ The global electric truck market expected to grow approximately 15% CAGR.

According to Interact Analysis, the Global Off-Highway vehicle market is expected to increase approximately 4% to 6.2 million units in 2023 from 5.9 million units in 2022. Beyond 2023, the Off-Highway vehicle market is expected to grow in the 4-5% range. We expect our legacy business growth rates to be in line with this outlook.

Industry forecasts are expecting at least 4% growth in 2023 for North American aftermarket truck parts. Compounded annual growth of at least 4% is forecasted for 2023-2027​.

GAAP to Non-GAAP Reconciliation

A reconciliation of GAAP to non-GAAP financial measures referenced in this release is included as Appendix A to this release.

Conference Call

A conference call to discuss this press release is scheduled for Wednesday, August 2, 2023, at 10:00 a.m. ET. Management intends to reference the Q2 2023 Earnings Call Presentation during the conference call. To participate, dial (888) 259-6580 using conference code 34051647. International participants dial (416) 764-8624 using conference code 34051647.

This call is being webcast and can be accessed through the “Investors” section of CVG’s website at ir.cvgrp.com, where it will be archived for one year.

A telephonic replay of the conference call will be available for a period of two weeks following the call. To access the replay, dial (877) 674-7070 using access code 051647 and international callers can dial (416) 764-8692 using access code 051647.

Company Contact
Andy Cheung
Chief Financial Officer
CVG
IR@cvgrp.com

Investor Relations Contact
Ross Collins or Stephen Poe
Alpha IR Group
CVGI@alpha-ir.com

About CVG

At CVG, we deliver real solutions to complex design, engineering and manufacturing problems while creating positive change for our customers, industries and communities we serve. Information about the Company and its products is available on the internet at www.cvgrp.com.

Forward-Looking Statements

This press release contains forward-looking statements that are subject to risks and uncertainties. These statements often include words such as “believe”, “anticipate”, “plan”, “expect”, “intend”, “will”, “should”, “could”, “would”, “project”, “continue”, “likely”, and similar expressions. In particular, this press release may contain forward-looking statements about the Company’s expectations for future periods with respect to its plans to improve financial results, the future of the Company’s end markets, changes in the Class 8 and Class 5-7 North America truck build rates, performance of the global construction equipment business, the Company’s prospects in the wire harness, warehouse automation and electric vehicle markets, the Company’s initiatives to address customer needs, organic growth, the Company’s strategic plans and plans to focus on certain segments, competition faced by the Company, volatility in and disruption to the global economic environment and the Company’s financial position or other financial information. These statements are based on certain assumptions that the Company has made in light of its experience as well as its perspective on historical trends, current conditions, expected future developments and other factors it believes are appropriate under the circumstances. Actual results may differ materially from the anticipated results because of certain risks and uncertainties, including those included in the Company’s filings with the SEC. There can be no assurance that statements made in this press release relating to future events will be achieved. The Company undertakes no obligation to update or revise forward-looking statements to reflect changed assumptions, the occurrence of unanticipated events or changes to future operating results over time. All subsequent written and oral forward-looking statements attributable to the Company or persons acting on behalf of the Company are expressly qualified in their entirety by such cautionary statements.

Use of Non-GAAP Measures

This earnings release contains financial measures that are not calculated in accordance with U.S. generally accepted accounting principles (“GAAP”). In general, the non-GAAP measures exclude items that (i) management believes reflect the Company’s multi-year corporate activities; or (ii) relate to activities or actions that may have occurred over multiple or in prior periods without predictable trends. Management uses these non-GAAP financial measures internally to evaluate the Company’s performance, engage in financial and operational planning and to determine incentive compensation.

Management provides these non-GAAP financial measures to investors as supplemental metrics to assist readers in assessing the effects of items and events on the Company’s financial and operating results and in comparing the Company’s performance to that of its competitors and to comparable reporting periods. The non-GAAP financial measures used by the Company may be calculated differently from, and therefore may not be comparable to, similarly titled measures used by other companies.

The non-GAAP financial measures disclosed by the Company should not be considered a substitute for, or superior to, financial measures calculated in accordance with GAAP. The financial results calculated in accordance with GAAP and reconciliations to those financial statements set forth above should be carefully evaluated.

Source: Commercial Vehicle Group, Inc.

Alliance Resource Partners (ARLP) – In-Line Second Quarter; Lowering Near-Term Estimates


Wednesday, August 02, 2023

ARLP is a diversified natural resource company that generates operating and royalty income from coal produced by its mining complexes and royalty income from mineral interests it owns in strategic oil & gas producing regions in the United States, primarily the Permian, Anadarko and Williston basins. ARLP currently produces coal from seven mining complexes its subsidiaries operate in Illinois, Indiana, Kentucky, Maryland and West Virginia. ARLP also operates a coal loading terminal on the Ohio River at Mount Vernon, Indiana. ARLP markets its coal production to major domestic and international utilities and industrial users and is currently the second largest coal producer in the eastern United States. In addition, ARLP is positioning itself as an energy provider for the future by leveraging its core technology and operating competencies to make strategic investments in the fast growing energy and infrastructure transition.

Mark Reichman, Managing Director, Equity Research Analyst, Natural Resources, Noble Capital Markets, Inc.

Refer to the full report for the price target, fundamental analysis, and rating.

Second quarter financial results. Alliance reported second quarter EBITDA and earnings per unit (EPU) of $249.2 million and $1.30, respectively, compared to $246.9 million and $1.23 during the prior year period. EPU was in line with our estimate and was modestly ahead of the consensus. We had forecast EBITDA and EPU of $254.4 million and $1.30. Revenue increased 3.5% to $641.8 million, while income from operations increased 3.7% to $183.9 million. The company generated free cash flow of $153.5 million compared to $81.3 million during the prior year period and distributable cash flow provided quarterly cash distribution coverage of 1.9x.

Refined management guidance. Alliance provided updated guidance for the remainder of the year which we have incorporated into our estimates as detailed in the body of this note. Total coal sales are expected to be in the range of 35.5 million to 36.0 million tons compared to previous expectations of 36.0 million to 38.0 million tons, while the coal sales price per ton is expected to be in the range of $65 to $66 compared to previous guidance of $65 to $67. Alliance also guided to lower depreciation, depletion, and amortization, general and administrative, and income tax expense.


Get the Full Report

Equity Research is available at no cost to Registered users of Channelchek. Not a Member? Click ‘Join’ to join the Channelchek Community. There is no cost to register, and we never collect credit card information.

This Company Sponsored Research is provided by Noble Capital Markets, Inc., a FINRA and S.E.C. registered broker-dealer (B/D).

*Analyst certification and important disclosures included in the full report. NOTE: investment decisions should not be based upon the content of this research summary. Proper due diligence is required before making any investment decision. 

Great Lakes Dredge & Dock (GLDD) – A Top Line Miss, But Better than Expected Bottom Line


Wednesday, August 02, 2023

Great Lakes Dredge & Dock Corporation is the largest provider of dredging services in the United States. In addition, Great Lakes is fully engaged in expanding its core business into the rapidly developing offshore wind energy industry. The Company has a long history of performing significant international projects. The Company employs experienced civil, ocean and mechanical engineering staff in its estimating, production and project management functions. In its over 131-year history, the Company has never failed to complete a marine project. Great Lakes owns and operates the largest and most diverse fleet in the U.S. dredging industry, comprised of approximately 200 specialized vessels. Great Lakes has a disciplined training program for engineers that ensures experienced-based performance as they advance through Company operations. The Company’s Incident-and Injury-Free® (IIF®) safety management program is integrated into all aspects of the Company’s culture. The Company’s commitment to the IIF® culture promotes a work environment where employee safety is paramount.

Joe Gomes, Managing Director, Equity Research Analyst, Generalist , Noble Capital Markets, Inc.

Joshua Zoepfel, Research Associate, Noble Capital Markets, Inc.

Refer to the full report for the price target, fundamental analysis, and rating.

2Q23. Revenue came in at $132.7 million down from $149.4 million last year, and below our $150 million projection. Reported gross margin was 13.5%, up from 7% in the year ago period and our 7.3% estimate. Adjusted EBITDA for the quarter was $16.6 million, the highest since 1Q22, versus $10.2 million last year. The Company reported net income of $1.7 million, or EPS of $0.03 per share, compared to last year’s loss of $4.0 million, or a loss of $0.06 per diluted share. We had projected a net loss of $4.5 million, or a loss of $0.07 per share.

Quarter Impacts. Second quarter top line was impacted by the reduced award levels in 2022 as well as the removal of the Terrapin Island and the two cold stacked vessels. On the positive side, a better mix of revenue and the cost cutting measures implemented positively impacted the bottom line.


Get the Full Report

Equity Research is available at no cost to Registered users of Channelchek. Not a Member? Click ‘Join’ to join the Channelchek Community. There is no cost to register, and we never collect credit card information.

This Company Sponsored Research is provided by Noble Capital Markets, Inc., a FINRA and S.E.C. registered broker-dealer (B/D).

*Analyst certification and important disclosures included in the full report. NOTE: investment decisions should not be based upon the content of this research summary. Proper due diligence is required before making any investment decision. 

Commercial Vehicle Group, Inc. (CVGI) – A First Look at 2Q23 Results


Wednesday, August 02, 2023

Joe Gomes, Managing Director, Equity Research Analyst, Generalist , Noble Capital Markets, Inc.

Joshua Zoepfel, Research Associate, Noble Capital Markets, Inc.

Refer to the full report for the price target, fundamental analysis, and rating.

Solid Top Line Results. CVGI had a solid quarter with revenues of $262.2 million, up 4.5% from the $250.8 million the prior year. We had revenue at $265 million. The higher revenue was driven by strong price realization, which drove revenue across three segments, partially offset by sales volume decreases in the Industrial Automation segment. Foreign currency translation favorably impacted second quarter 2023 revenues by $0.7 million, or 0.3%.

Even Better Bottom Line. Net income for the quarter was $10.1 million, or EPS of $0.30 per share. Adjusted EPS was $0.32. We had forecast net income of $8.7 million, or EPS of $0.26. New business, price realization, and cost reduction efforts all positively impacted the bottom line. Adjusted EBITDA came in at $20.8 million, or a 7.9% margin, up from $12.4 million and 4.9%.


Get the Full Report

Equity Research is available at no cost to Registered users of Channelchek. Not a Member? Click ‘Join’ to join the Channelchek Community. There is no cost to register, and we never collect credit card information.

This Company Sponsored Research is provided by Noble Capital Markets, Inc., a FINRA and S.E.C. registered broker-dealer (B/D).

*Analyst certification and important disclosures included in the full report. NOTE: investment decisions should not be based upon the content of this research summary. Proper due diligence is required before making any investment decision.