FDIC, Federal Reserve, and Treasury Issue Joint Statements on Silicon Valley Bank
In a joint statement released by Secretary of the Treasury Janet L. Yellen, Federal Reserve Board Chair Jerome H. Powell, and FDIC Chairman Martin J. Gruenberg, they announced actions they are now committed to taking to “protect the U.S. economy by strengthening public confidence in the banking system.” The actions are being taken to ensure that “the U.S. banking system continues to perform its vital roles of protecting deposits and providing access to credit to households and businesses in a manner that promotes strong and sustainable economic growth.”
Specifically, the actions directly impact two banks, Silicon Valley Bank in California and Signature Bank in New York, but it was made clear that it could be extended to other institutions. The joint news release reads, “After receiving a recommendation from the boards of the FDIC and the Federal Reserve and consulting with the President, Secretary Yellen approved actions enabling the FDIC to complete its resolution of Silicon Valley Bank, Santa Clara, California, in a manner that fully protects all depositors. Depositors will have access to all of their money starting Monday, March 13. No losses associated with the resolution of Silicon Valley Bank will be borne by the taxpayer.
In a second release by the three agencies, details were uncovered as to how this was designed to not impact depositors, with losses being borne by stockholders and debtholders. The release reads as follows:
“The additional funding will be made available through the creation of a new Bank Term Funding Program (BTFP), offering loans of up to one year in length to banks, savings associations, credit unions, and other eligible depository institutions pledging U.S. Treasuries, agency debt and mortgage-backed securities, and other qualifying assets as collateral. These assets will be valued at par. The BTFP will be an additional source of liquidity against high-quality securities, eliminating an institution’s need to quickly sell those securities in times of stress.
With approval of the Treasury Secretary, the Department of the Treasury will make available up to $25 billion from the Exchange Stabilization Fund as a backstop for the BTFP. The Federal Reserve does not anticipate that it will be necessary to draw on these backstop funds.
After receiving a recommendation from the boards of the Federal Deposit Insurance Corporation (FDIC) and the Federal Reserve, Treasury Secretary Yellen, after consultation with the President, approved actions to enable the FDIC to complete its resolutions of Silicon Valley Bank and Signature Bank in a manner that fully protects all depositors, both insured and uninsured. These actions will reduce stress across the financial system, support financial stability and minimize any impact on businesses, households, taxpayers, and the broader economy.
The Board is carefully monitoring developments in financial markets. The capital and liquidity positions of the U.S. banking system are strong and the U.S. financial system is resilient.”
Take Away
Confidence by depositors, investors, and all economic participants is important for those entrusted to keep the U.S. economy steady. The measures appear to strive for the markets to open on Monday with more calm than might otherwise have occurred.
While the sense of resolve of the steps explained in the two statements, both released at 6:15 ET Sunday evening is reminiscent of 2008, there is still no expectation that the problem is wider than a few institutions.
All dollar amounts expressed are in thousands of U.S. dollars unless otherwise indicated.
Q4 & Full Year 2022 Highlights
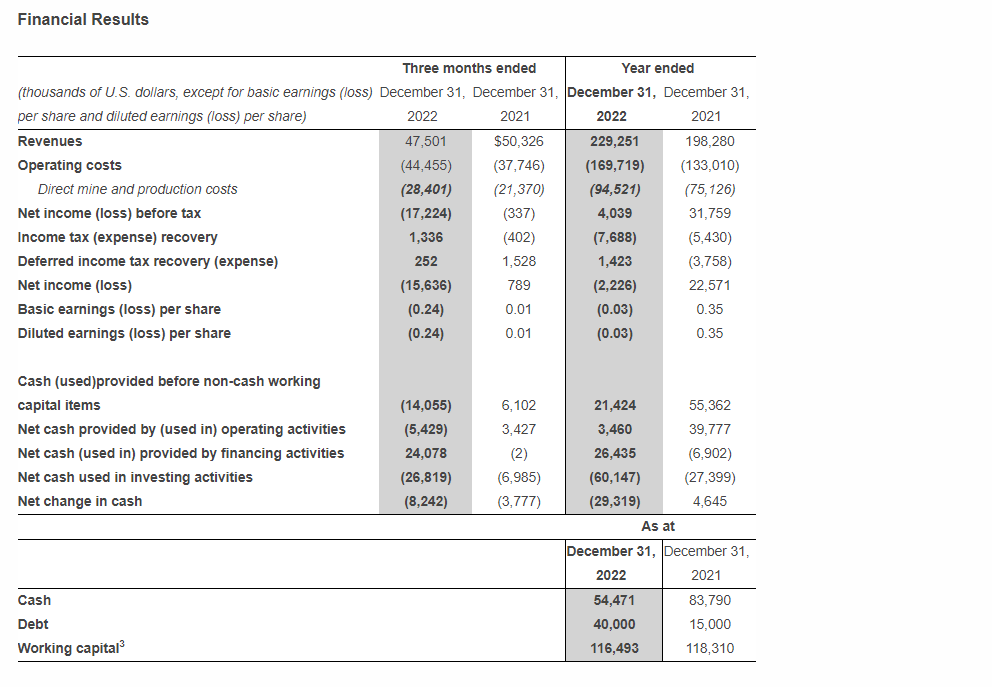
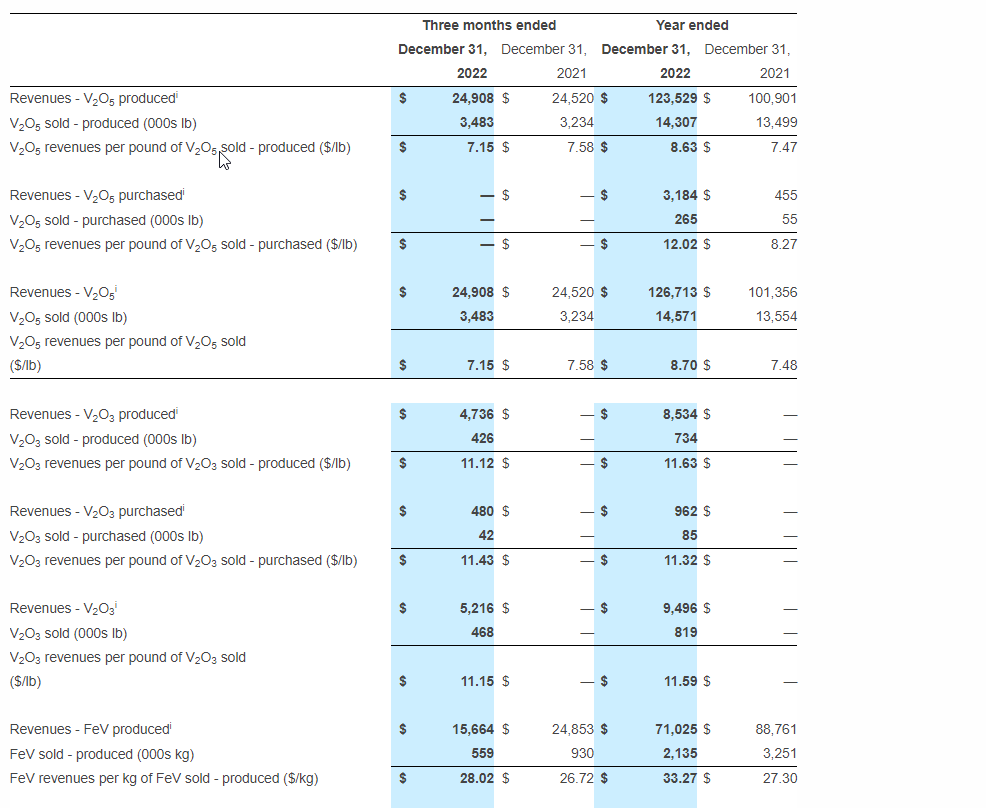
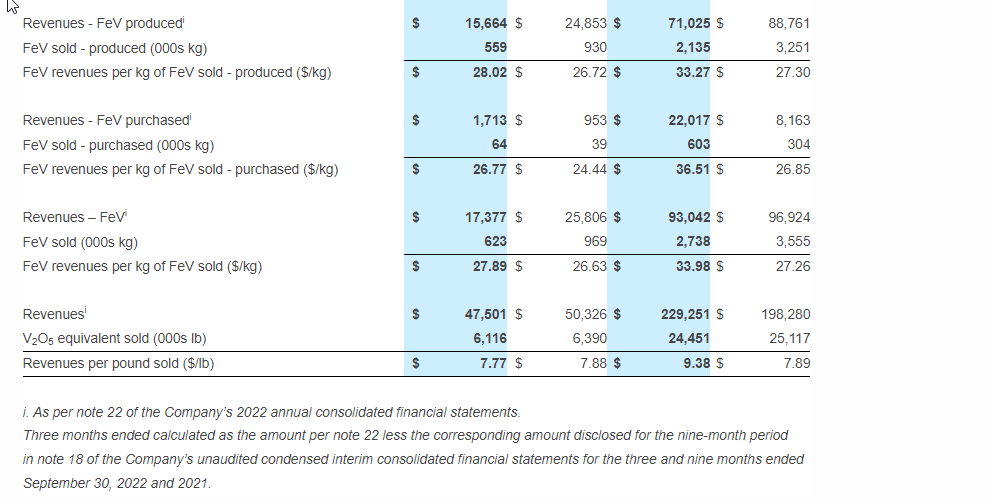
Revenues of $47.5 million in Q4 2022, 6% below Q4 2021; Revenues per pound sold1 of $7.77 in Q4 2022, largely in line with $7.88 recognized in Q4 2021
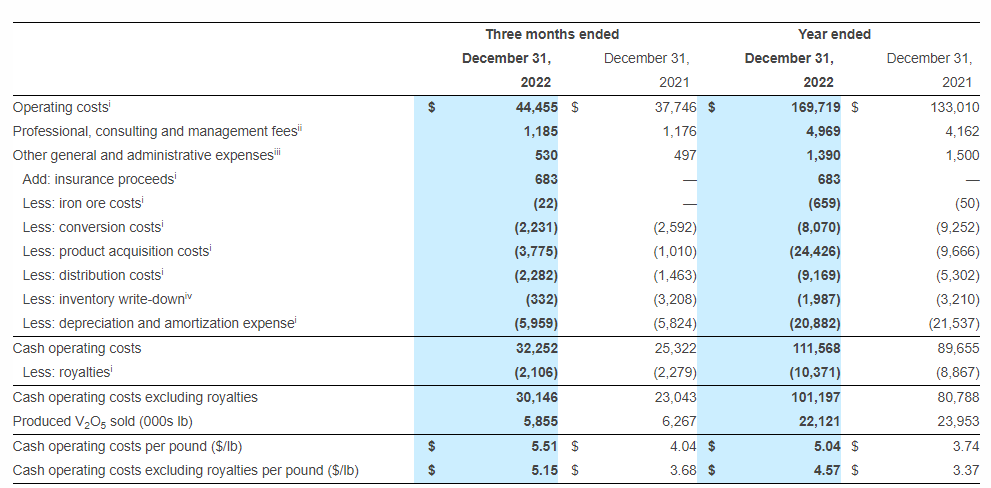
Operating costs of $44.5 million in Q4 2022 vs. $37.7 million in Q4 2021, and cash operating costs excluding royalties per pound1 of V2O5 equivalent sold of $5.15 in Q4 2022 vs. $3.68 in Q4 2021
Net loss of $15.6 million in Q4 2022 vs. net income of $1.0 million in Q4 2021; Basic loss per share of $0.24 in Q4 2022 vs. basic earnings per share of $0.01 in Q4 2021
In Q4 2022, the Company’s net loss included approximately $6.3 million of non-recurring expenditures
Revenues of $229.3 million in 2022, a 16% increase over 2021; Revenues per pound sold1 of $9.38 in 2022, a 19% increase over 2021
Operating costs of $169.7 million in 2022 vs. $133.0 million in 2021, and cash operating costs excluding royalties per pound1 of V2O5 equivalent sold of $4.57 in 2022 vs. $3.37 in 2021; 2% above upper range of revised 2022 guidance for cash operating costs excluding royalties per pound1
Net loss of $2.2 million in 2022 vs. net income of $22.6 million in 2021; Basic loss per share of $0.03 in 2022 vs. basic earnings per share of $0.35 in 2021
In 2022, the Company’s net loss included approximately $15.0 million of non-recurring expenditures
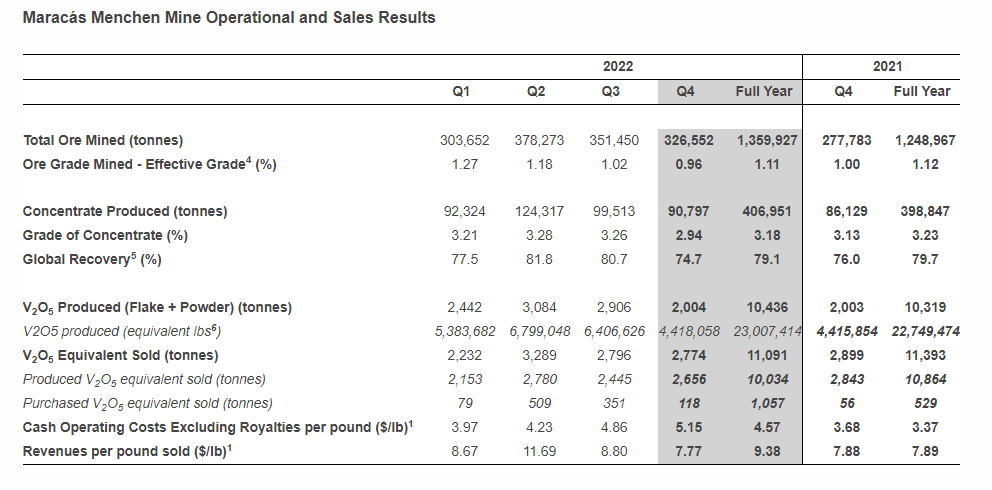
V2O5 production of 2,004 tonnes in Q4 2022 vs. 2,003 tonnes in Q4 2021; Annual V2O5 production of 10,436 tonnes in 2022 vs. 10,319 tonnes in 2021 and 6% below lower range of revised production guidance
Quarterly sales of 2,772 tonnes of V2O5 equivalent (inclusive of 118 tonnes of purchased material) in Q4 2022 vs. 2,899 tonnes in Q4 2021; Annual V2O5 equivalent sales of 11,091 (inclusive of 1,057 tonnes of purchased material) tonnes in 2022 vs. 11,393 tonnes in 2021 and within revised sales guidance of 11,000 – 12,000 tonnes
Vanadium Price Update2
The average benchmark price per pound of V2O5 in Europe was $8.25 in Q4 2022, being largely in line with the average of $8.23 seen in Q3 2022 and $8.30 in Q4 2021; The average benchmark price as of March 3, 2023 was $10.78, a 44% increase from the lows of 2022
The average benchmark price per kg of ferrovanadium (“FeV”) in Europe was $33.35 in Q4 2022, a 3% decrease from the average of $32.29 seen in Q4 2021; The average FeV benchmark price as of March 3, 2023 was $40.88, a 30% increase from the lows of 2022
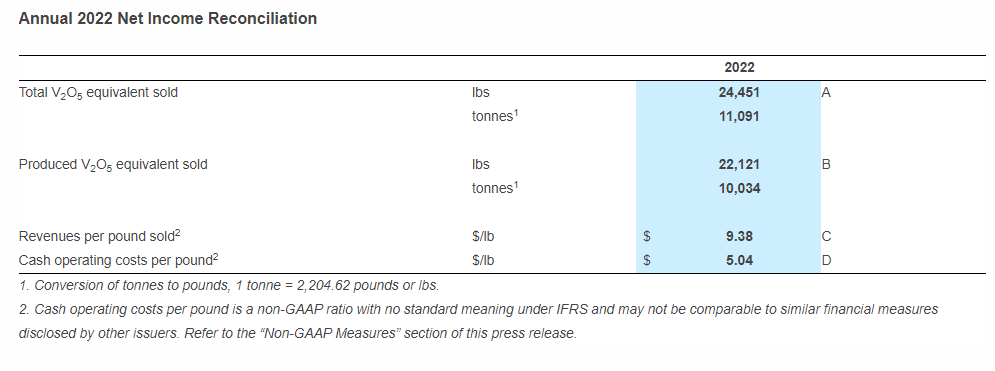
TORONTO–(BUSINESS WIRE)– Largo Inc. (“Largo” or the “Company“) (TSX: LGO) (NASDAQ: LGO) today released financial and operating results for the three and twelve months ended December 31, 2022. The Company reported annual vanadium pentoxide (“V2O5”) equivalent sales of 11,091 tonnes at a cash operating cost excluding royalties per pound1 sold of $4.58. Revenues in 2022 increased 16% over 2021 to $229.3 million mainly due to a strengthening of vanadium prices in the year.
Daniel Tellechea, Interim CEO and Director of Largo, stated: “For Largo, 2022 was a challenging year, which led to an underperformance on both production and cost metrics, particularly in Q4 2023 with the mining disruption caused by record rainfall at our mine, cost inflation of key raw materials and sizeable non-recurring expenditures. Although we continue to navigate an inflationary environment, we anticipate delivering and capitalizing on a 10% increase in production for 2023 over 2022, particularly with the recent strengthening of vanadium prices.” He continued: “This recent increase is due in part to increased demand from the energy storage sector, especially in China, where new vanadium redox flow battery (“VRFB”) deployments totaling around 2 GWh or approximately 10% of global vanadium output are planned for the next 12-24 months.Importantly, the VRFB sector accounted for the second largest source of vanadium demand outside of the steel sector in Q3 2022, according to Vanitec, a global vanadium organization. Other key markets including steel, aerospace, and chemical have also shown considerable demand growth in recent months.”
He continued: “As for growth plans this year, Largo’s ilmenite project remains on track and is expected to generate a new source of revenue for the Company. We anticipate providing guidance on ilmenite production for 2023 once commissioning of the plant has been completed. We continue to make progress on the installation of our first VRFB in Spain and our negotiations toward the formation of a joint venture with Ansaldo Green Tech (“Ansaldo”) for the deployment of VRFBs in the Europe, Middle East and Africa power generation markets. Lastly, safety and sustainability remain key priorities for Largo and we are pleased to be recently ranked in the top quartile of our peer group as measured by certain ESG rating agencies for 2022.”
Q4 & Full Year 2022 Financial Results Overview
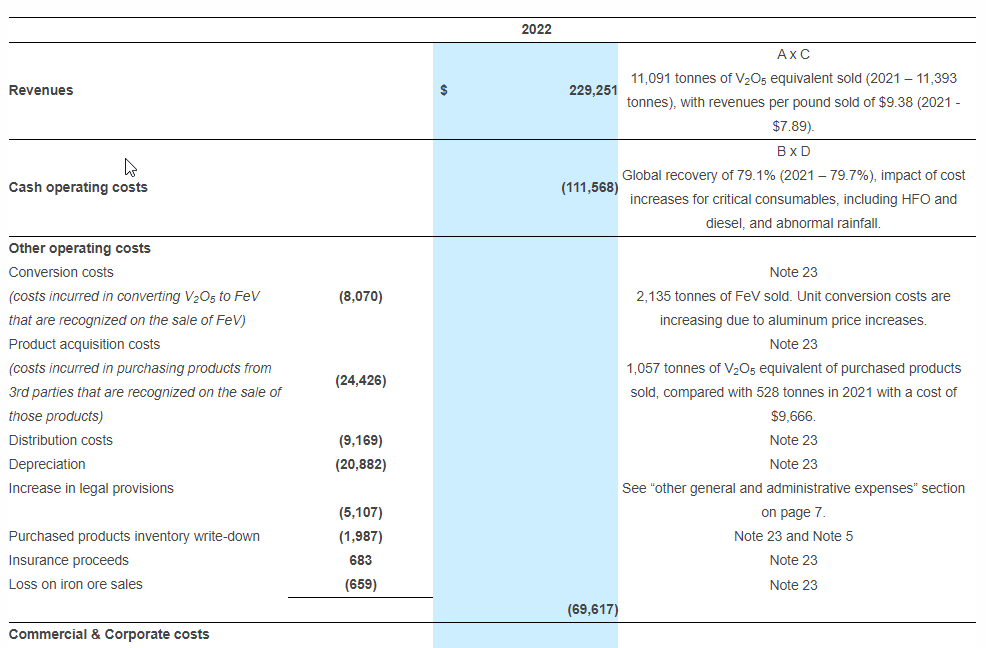
During 2022, the Company recognized revenues of $229.3 million from sales of 11,091 tonnes of V2O5 equivalent (2021 – 11,393 tonnes). This represents a 16% increase in revenues over 2021 ($198.3 million) mainly due to higher vanadium prices in the year, particularly with revenues recognized in Q2 2022. During Q4 2022, the Company recognized revenues of $47.5 million (Q4 2021 – $50.3 million) from sales of 2,772 tonnes of V2O5 equivalent (Q4 2021 – 2,899 tonnes).
Operating costs of $169.7 million in 2022 (2021 – $133.0 million) include direct mine and production costs of $94.5 million (2021 – $75.1 million), conversion costs of $8.1 million (2021 – $9.3 million), product acquisition costs of $24.4 million (2021 –$9.7 million), royalties of $10.4 million (2021 – $8.9 million), distribution costs of $9.2 million (2021 – $5.3 million), inventory write-down of $2.3 million (2021 – $3.2 million), depreciation and amortization of $20.9 million (2021 – $21.5 million) and iron ore costs of $1.0 million (2021 – $0.05 million), partially offset by insurance proceeds of $1.0 million (2021 – $nil).
Operating costs of $44.5 million in Q4 2022 (Q4 2021 – $37.7) include direct mine and production costs of $28.4 million (Q4 2021 – $21.4 million), conversion costs of $2.2 million (Q4 2021 – $2.6 million), product acquisition costs of $3.8 million (Q4 2021 – $1.0 million), royalties of $2.1 million (Q4 2021 – $2.3 million), distribution costs of $2.3 million (Q4 2021 – $1.5 million), inventory write-down of $0.4 million (Q4 2021 – $3.2 million), depreciation and amortization of $6.0 million (Q4 2021 – $5.8 million) and iron ore costs of $0.02 million (Q4 2021 – $nil), partially offset by insurance proceeds of $1.0 million (Q4 2021 – $nil).
The increases in direct mine and production costs are attributable to a decrease in the global recovery5, cost increases in critical consumables, including heavy fuel oil (“HFO”) and ammonium sulfate, as well as increased consumption of these critical consumables and sodium carbonate. Costs were further impacted by the Company’s mining contractor transition in Q3 2022 and corrective maintenance in the plant throughout the year. Higher costs of production in the current and previous periods in the year related to shutdowns caused by abnormally high rainfall during Q4 2022, while corrective maintenance continued to impact operating costs as a result of the time between production and sales.
Cash operating costs excluding royalties per pound1 of V2O5 equivalent soldwere $4.57 in 2022, compared with $3.37 in 2021. Cash operating costs excluding royalties per pound1 sold were $5.15 in Q4 2022, compared with $3.68 in Q4 2021. The increase seen in Q4 2022 and 2022 compared with Q4 2021 and 2021 is largely due to the impacts noted previously, in addition to produced V2O5 equivalent sold having decreased in 2022 as compared with 2021, with 10,034 tonnes sold versus 10,864 tonnes.
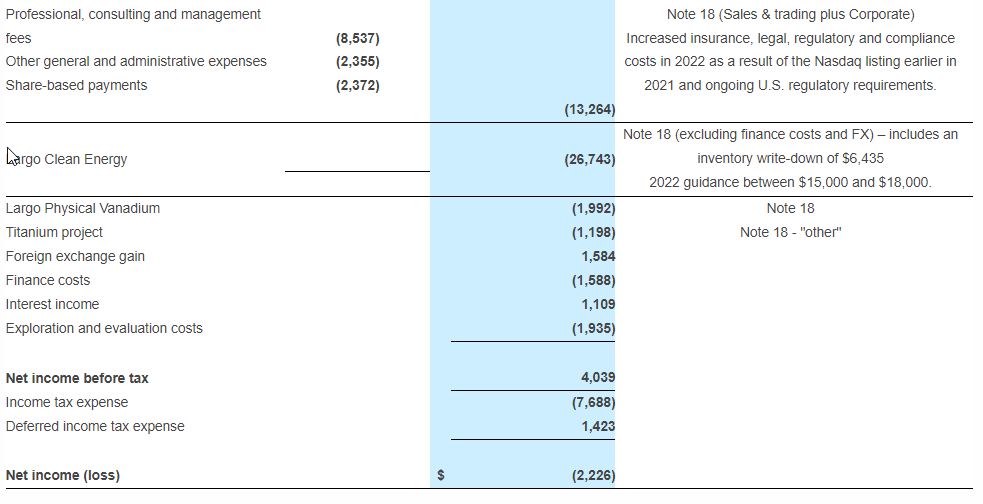
Professional, consulting and management fees were $25.3 million in 2022, compared with $17.9 million in 2021. Professional, consulting and management fees were $5.7 million in Q4 2022, compared with $5.6 million in Q4 2021. For 2022, the increase is primarily attributable to costs incurred earlier in the year in connection with LCE, which was not fully operational earlier in 2021 and transaction and listing related costs incurred by Largo Physical Vanadium Corp. (“LPV”) in connection with the completion of its qualifying transaction.
Other general and administrative expenses were $14.3 million in 2022, compared with $6.4 million in 2021. Other general and administrative expenses were $3.5 million in Q4 2022, compared with $2.3 million in Q4 2021. For 2022, the increase is primarily due to an increase in provisions as well as costs incurred in Q4 2022 in connection with LPV, and in Largo Clean Energy Corp. (“LCE”) which has scaled up activities throughout 2022. The increase in provisions relates to a supply agreement for the Maracás Menchen Mine which was filed with Brazilian courts in October 2014. The ruling requires the Company to pay amounts due, plus interest and legal fees.
Technology start-up costs were $12.7 million in 2022 (2021 – $3.8 million) and $8.2 million in Q4 2022 (Q4 2021 – 3.1 million). This includes a full write-down of battery components inventory at LCE of $6.4 million (Q4 2022 and 2022) (Q4 2021 and 2021 – $nil) to their expected net realizable value. Technology start-up costs relate to LCE’s activities related to ramping up its operations for the deployment of the VCHARGE VRFB system and the titanium project in Brazil.
Finance costs in Q4 2022 increased from Q4 2021 by 118% (or $0.4 million), which is attributable to increased debt, as well as the initial financing fees on the Company’s new debt facilities.
For 2022, cash provided by financing activities increased from cash used in financing activities in 2021 by $33.3 million. The movement is primarily attributable to the receipt of debt of $55.0 million and cash received from the sale of non-controlling interest of $7.3 million (2021 – $nil), partially offset by the repayment of debt of $30.0 million (2021 – $24.8 million) and share repurchases of $6.0 million. Cash provided by financing activities in Q4 2022 increased from cash used in financing activities in Q4 2021 by $24.1 million. This movement was primarily due to the receipt of new debt of $40.0 million, partially offset by a repayment of debt of $15.0 million.
Cash used in investing activities in Q4 2022 of $26.8 million is an increase of $19.8 million from the $7.0 million seen in Q4 2021. This movement was primarily driven by the purchase of vanadium assets and continued work on the ilmenite project. For 2022, the increase from 2021 was $32.7 million. Expenditures in 2022 primarily relate to the ilmenite project, mining equipment, costs relating to a software implementation and cash outflows for purchased product vanadium assets.
Additional Company Updates
Q4 and Full Year 2022 Operational Results: Production of 2,004 tonnes of V2O5 in Q4 2022 was in line with the 2,003 tonnes of V2O5 produced in Q4 2021, primarily due to reduced massive ore inventory arising from the transition in mining contractors in Q3 2022 and due to unusually heavy rainfall in December 2022. In Q4 2022, the Company produced 839 V2O5 equivalent tonnes of high purity products, including 650 tonnes of high purity V2O5 and 189 tonnes of high purity vanadium trioxide (“V2O3”). This represented 42% of the total quarterly production. In 2022, the Company produced 1,801 V2O5 equivalent tonnes of high purity products, including 1,368 tonnes of high purity V2O5 and 433 tonnes of high purity V2O3. In Q4 2022, 326,552 tonnes of ore were mined with an effective grade4 of 0.96% of V2O5. The ore mined in Q4 2022 was 18% higher than in Q4 2021. The Company produced 90,797 tonnes of concentrate with an effective grade4 of 2.94%. The global recovery5 achieved in Q4 2022 was 74.7%, a decrease of 1.7% from the 76.0% achieved in Q4 2021 and 7.4% lower than the 80.7% achieved in Q3 2022. The global recovery5 in October 2022 was 75.0%, with 67.8% achieved in November 2022 and 80.8% achieved in December 2022.
Continued Focus on ESG in 2022: The Company continued to improve its overall Environmental, Social and Governance (“ESG”) performance and public disclosures in 2022. This is reflected in additional improved ratings and scores, most notably its S&P Global Corporate Sustainability Assessment (“CSA”) rating having improved approximately 38%, placing the Company in the top quartile of its mining peer group for 2022. This improvement was largely driven by updates to Largo’s governance of ESG, including new policies, ESG oversight at the Board level and climate-related disclosures, as well as improved responses related to the Company’s on-going environmental compliance in Brazil. The Company expects to issue its 2022 sustainability report in late Q2 2023.
Largo Clean Energy Recent Developments: During Q4 2022, LCE continued to make significant progress on the delivery of the Enel Green Power España (“EGPE”) contract, which remains a priority focus. Substantially all the hardware is either in transit to or is in Spain awaiting installation. The Company shipped the remaining six of 12 electrolyte storage containers in early 2023 and the Field Service team has been on site in Q1 2023 and work is ongoing to install and interconnect the AC and DC power systems. Provisional acceptance, which requires the completion of as-build drawings, manuals, final punch-list items, and operational testing by EGPE, is expected to be completed by the end of May 2023. Additionally, LCE and Ansaldo continue to focus on the formation of a joint venture for the manufacturing and commercial deployment of VRFBs in the European, African and Middle East power generation markets. The Company’s previously announced memorandum of understanding (“MOU”) has been extended to March 31, 2023, to allow for the negotiation and entering into a joint venture and other ancillary agreements. Ansaldo and LCE continue to develop a business path for the joint venture to service the European markets with Long Duration Energy Storage (“LDES”).
Ilmenite Concentration Plant Progress: The Company progressed with the construction of its ilmenite concentration plant at its Maracás Menchen Mine in Q4 2022. The Company received all required flotation structures and is finalizing the building of its desliming, flotation, filtration, warehouse and pipe rack structures ands expects commissioning of the plant to be completed in Q2 2023.
January and February 2023 Production and Sales: Subsequent to Q4 2022, the Company produced 354 tonnes of V2O5 in January and 843 tonnes in February. The Company also sold 1,080 tonnes of V2O5 equivalent (including 68 tonnes of purchased material) in January 2023 and 750 tonnes (including 11 tonnes of purchased material) in February. Production in January and February was largely impacted by low ore availability in due to the heavy rains at the mine site and planned maintenance of the kiln for its refractory refurbishment, with sales in February being impacted by a delay in sales recognition. The Company expects to remain within its quarterly production and sales guidance for Q1 2023.
Largo Physical Vanadium Update: LPV’s net assets are now over 90% held in physical vanadium products and near-term delivery commitments (approximately 2.9 million lbs of V2O5 equivalent). The launch of LPV in September 2022 coincided with lower vanadium prices, which allowed LPV to purchase vanadium units at favorable market prices. LPV’s net asset value (“NAV”) is now C$2.56 per share or 28% above the closing share price of C$2.00 per share on March 8, 2023. LPV believes its NAV to share price discount offers current and new LPV investors an attractive investment case and closing this disconnect is now LPV’s key focus. LPV management are working on a broad marketing and communication campaign to raise awareness of its investment proposal.
Director Resignation: Following the Company’s previously announced leadership change on February 16, 2023, Mr. Paulo Misk has resigned from his position as a Director of the Company effective March 7, 2023.
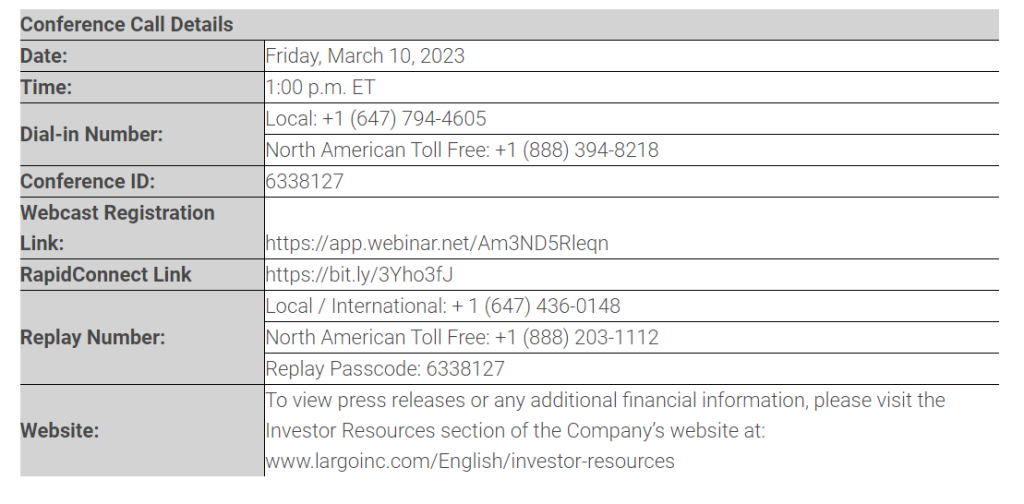
Annual 2022 Webcast and Conference Call Information
The Company will host a webcast and conference call on Friday, March 10, 2023, at 1:00 p.m. ET, to discuss its fourth quarter and annual 2022 results and progress.
Details of the webcast and conference call are listed below:
To join the conference call without operator assistance, you may register and enter your phone number at https://bit.ly/3Yho3fJ to receive an instant automated call back.
You can also dial direct to be entered to the call by an Operator via dial-in details below.
A playback recording will be available on the Company’s website for a period of 60-days following the conference call.
The information provided within this release should be read in conjunction with Largo’s annual consolidated financial statements for the years ended December 31, 2022 and 2021 and its management’s discussion and analysis for the year ended December 31, 2022 which are available on our website at www.largoinc.com or on the Company’s respective profiles at www.sedar.com and www.sec.gov.
About Largo
Largo has a long and successful history as one of the world’s preferred vanadium companies through the supply of its VPURETM and VPURE+TM products, which are sourced from one of the world’s highest-grade vanadium deposits at the Company’s Maracás Menchen Mine in Brazil. Aiming to enhance value creation at Largo, the Company will be implementing a titanium dioxide pigment plant using feedstock sourced from its existing operations in addition to advancing its U.S.-based clean energy division with its VCHARGE vanadium batteries. Largo’s VCHARGE vanadium batteries contain a variety of innovations, enabling an efficient, safe and ESG-aligned long duration solution that is fully recyclable at the end of its 25+ year lifespan. Producing some of the world’s highest quality vanadium, Largo’s strategic business plan is based on two pillars: 1.) leading vanadium supplier with an outlined growth plan and 2.) U.S.-based energy storage business support a low carbon future.
Largo’s common shares trade on the Nasdaq Stock Market and on the Toronto Stock Exchange under the symbol “LGO”. For more information, please visit www.largoinc.com.
This press release contains “forward-looking information” and “forward-looking statements” within the meaning of applicable Canadian and United States securities legislation. Forward‐looking information in this press release includes, but is not limited to, statements with respect to the timing and amount of estimated future production and sales; the future price of commodities; costs of future activities and operations, including, without limitation, the effect of inflation and exchange rates; the effect of unforeseen equipment maintenance or repairs on production; timing and cost related to the build-out of the ilmenite plant; the ability to produce vanadium trioxide according to customer specifications; the extent of capital and operating expenditures; the impact of global delays and related price increases on the Company’s global supply chain and future sales of vanadium products. Forward‐looking information in this press release also includes, but is not limited to, statements with respect to our ability to build, finance and successfully operate a VRFB business, the projected timing and cost of the completion of the EGPE project; our ability to protect and develop our technology, our ability to maintain our IP, the competitiveness of our product in an evolving market, our ability to market, sell and deliver our VCHARGE batteries on specification and at a competitive price, our ability to successfully deploy our VCHARGE batteries in foreign jurisdictions; our ability to negotiate and enter into a joint venture with Ansaldo Green Tech on terms satisfactory to the Company and the success of such joint venture; the receipt of necessary governmental permits and approvals on a timely basis, our ability to secure the required resources to build and deploy our VCHARGE batteries, and the adoption of VRFB technology generally in the market.
The following are some of the assumptions upon which forward-looking information is based: that general business and economic conditions will not change in a material adverse manner; demand for, and stable or improving price of V2O5 and other vanadium commodities; receipt of regulatory and governmental approvals, permits and renewals in a timely manner; that the Company will not experience any material accident, labour dispute or failure of plant or equipment or other material disruption in the Company’s operations at the Maracás Menchen Mine or relating to Largo Clean Energy, specially in respect of the installation and commissioning of the EGPE project; the availability of financing for operations and development; the ability to mitigate the impact of continuing heavy rainfall; the Company’s ability to procure equipment and operating supplies in sufficient quantities and on a timely basis; that the estimates of the resources and reserves at the Maracás Menchen Mine are within reasonable bounds of accuracy (including with respect to size, grade and recovery and the operational and price assumptions on which such estimates are based); the competitiveness of the Company’s VRFB technology; the ability to obtain funding through government grants and awards for the Green Energy sector, the accuracy of cost estimates and assumptions on future variations of VCHARGE battery system design, that the Company’s current plans for ilmenite and VRFBs can be achieved; the Company’s “two-pillar” business strategy will be successful; the Company’s sales and trading arrangements will not be affected by the evolving sanctions against Russia; and the Company’s ability to attract and retain skilled personnel and directors; the ability of management to execute strategic goals.
Forward-looking statements can be identified by the use of forward-looking terminology such as “plans”, “expects” or “does not expect”, “is expected”, “budget”, “scheduled”, “estimates”, “forecasts”, “intends”, “anticipates” or “does not anticipate”, or “believes”, or variations of such words and phrases or statements that certain actions, events or results “may”, “could”, “would”, “might” or “will be taken”, “occur” or “be achieved”. All information contained in this news release, other than statements of current and historical fact, is forward looking information. Forward-looking statements are subject to known and unknown risks, uncertainties and other factors that may cause the actual results, level of activity, performance or achievements of Largo or Largo Clean Energy to be materially different from those expressed or implied by such forward-looking statements, including but not limited to those risks described in the annual information form of Largo and in its public documents filed on www.sedar.com and available on www.sec.gov from time to time. Forward-looking statements are based on the opinions and estimates of management as of the date such statements are made. Although management of Largo has attempted to identify important factors that could cause actual results to differ materially from those contained in forward-looking statements, there may be other factors that cause results not to be as anticipated, estimated or intended. There can be no assurance that such statements will prove to be accurate, as actual results and future events could differ materially from those anticipated in such statements. Accordingly, readers should not place undue reliance on forward-looking statements. Largo does not undertake to update any forward-looking statements, except in accordance with applicable securities laws. Readers should also review the risks and uncertainties sections of Largo’s annual and interim MD&As which also apply.
Trademarks are owned by Largo Inc.
Non-GAAP Measures
The financial statements and related notes of Largo have been prepared in accordance with International Financial Reporting Standards (“IFRS”) as issued by the International Accounting Standards Board. This press release contains non-GAAP financial measures and non-GAAP ratios, which are not standardized financial measures under IFRS, and might not be comparable to similar financial measures disclosed by other issuers. These measures are intended to provide additional information and should not be considered in isolation or as a substitute for measures of performance prepared in accordance with IFRS.
Revenues Per Pound
The Company’s press release refers to revenues per pound sold, V2 O5 revenues per pound of V2 O5 sold, V2 O3 revenues per pound of V2 O3 sold and FeV revenues per kg of FeV sold, which are non-GAAP financial measures that are used to provide investors with information about a key measure used by management to monitor performance of the Company.
These measures, along with cash operating costs, are considered to be key indicators of the Company’s ability to generate operating earnings and cash flow from its Maracás Menchen Mine and sales activities. These measures differ from measures determined in accordance with IFRS, and are not necessarily indicative of net earnings or cash flow from operating activities as determined under IFRS.
The following table provides a reconciliation of revenues per pound sold, V2 O5 revenues per pound of V2 O5 sold, V2 O3 revenues per pound of V2 O3 sold and FeV revenues per kg of FeV sold to revenues and the revenue information presented in note 18 as per the 2022 annual consolidated financial statements.
Cash Operating Costs and Cash Operating Costs Excluding Royalties
The Company’s press release refers to cash operating costs per pound and cash operating costs excluding royalties per pound, which are non-GAAP ratios based on cash operating costs and cash operating costs excluding royalties, which are non-GAAP financial measures, in order to provide investors with information about a key measure used by management to monitor performance. This information is used to assess how well the Maracás Menchen Mine is performing compared to plan and prior periods, and also to assess its overall effectiveness and efficiency.
Cash operating costs includes mine site operating costs such as mining costs, plant and maintenance costs, sustainability costs, mine and plant administration costs, royalties and sales, general and administrative costs (all for the Mine properties segment), but excludes depreciation and amortization, share-based payments, foreign exchange gains or losses, commissions, reclamation, capital expenditures and exploration and evaluation costs. Operating costs not attributable to the Mine properties segment are also excluded, including conversion costs, product acquisition costs, distribution costs and inventory write-downs.
Cash operating costs excluding royalties is calculated as cash operating costs less royalties.
Cash operating costs per pound and cash operating costs excluding royalties per pound are obtained by dividing cash operating costs and cash operating costs excluding royalties, respectively, by the pounds of vanadium equivalent sold that were produced by the Maracás Menchen Mine.
Cash operating costs, cash operating costs excluding royalties, cash operating costs per pound and cash operating costs excluding royalties per pound, along with revenues, are considered to be key indicators of the Company’s ability to generate operating earnings and cash flow from its Maracás Menchen Mine. These measures differ from measures determined in accordance with IFRS, and are not necessarily indicative of net earnings or cash flow from operating activities as determined under IFRS.
The following table provides a reconciliation of cash operating costs and cash operating costs excluding royalties, cash operating costs per pound and cash operating costs excluding royalties per pound for the Maracás Menchen Mine to operating costs as per the 2022 annual consolidated financial statements.
Investor Relations Alex Guthrie Senior Manager, External Relations +1.416.861.9778 aguthrie@largoinc.com
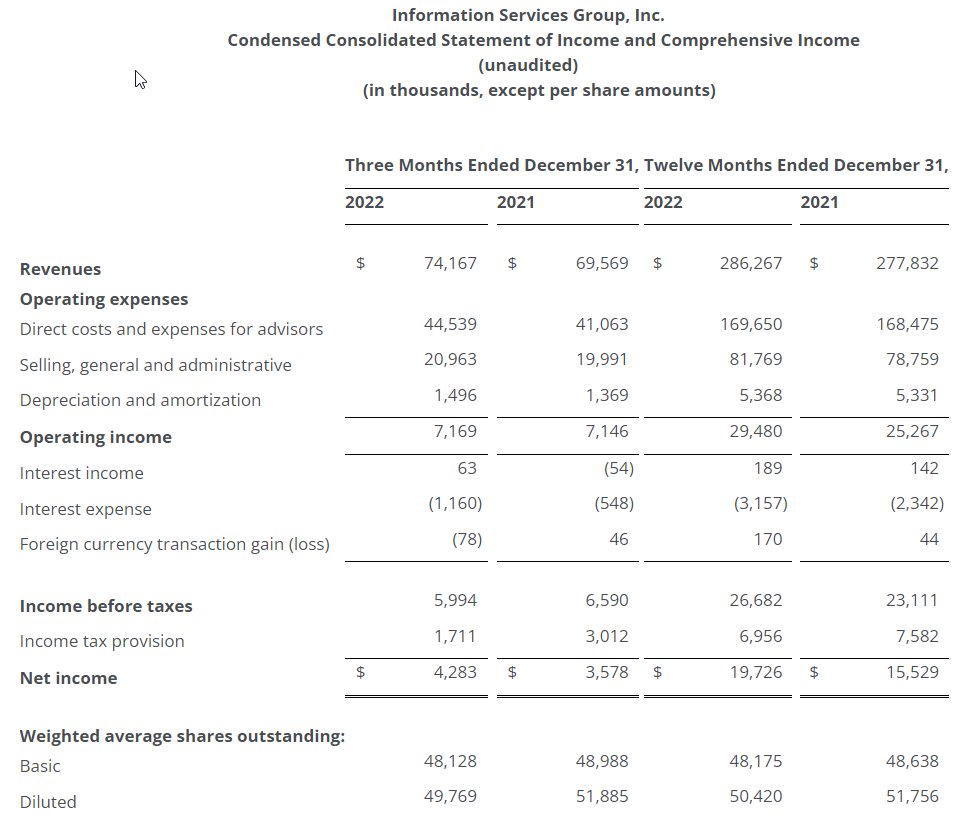
Reports fourth-quarter GAAP revenues of $74 million,an all-time quarterly high, exceeding guidance and including a negative FX impact of $3.2 million
Reports fourth-quarter net income of $4 million, GAAP EPS of $0.09 and adjusted EPS of $0.13, all fourth-quarter records
Reports record fourth-quarter adjusted EBITDA of $11 million, exceeding guidance
Achieves record full-year results: GAAP revenues of $286 million, up 8% in constant currency; operating income of $29 million, up 17%; net income of $20 million, up 27%; adjusted net income of $27 million, up 18%, GAAP EPS of $0.39, up 30%; adjusted EPS of $0.53, up 20%; adjusted EBITDA of $43 million, up 11%
Declares first-quarter dividend of $0.04 per share, payable March 31, 2023, to shareholders of record as of March 20, 2023
As previously announced, amends credit agreement to include more favorable terms, an extended maturity date, elimination of $4.3 million of mandatory annual principal payments, and conversion to an all-revolving credit facility with $140 million of borrowing capacity
Sets first-quarter guidance: revenues between $73 million and $75 million and adjusted EBITDA between $10 million and $11 million
STAMFORD, Conn.–(BUSINESS WIRE)– Information Services Group (ISG) (Nasdaq: III), a leading global technology research and advisory firm, today announced record financial results for the fourth quarter and full year ended December 31, 2022.
“ISG delivered our best quarterly and full-year performance in our 17-year history—on every key financial metric,” said Michael P. Connors, chairman and CEO. “Fourth-quarter revenue and profitability reached record highs, led by double-digit operating growth in the Americas and Europe as client demand for efficiency and optimization escalates. Our suite of client solutions in digital transformation, cost optimization, research, workplace and governance services, supported by our successful ISG NEXT operating model, is a winning combination.”
Some clients, especially those in industries and geographies facing the toughest market conditions, are turning to ISG to help them optimize their IT and operating environments, Connors said. “Clients trust ISG for our unmatched combination of data, insights, expertise, tools and solutions to help streamline their technology and operating environments, reinvest in continuous transformation and get the most out of the collaboration between people and technology,” he said.
Fourth-Quarter 2022 Results
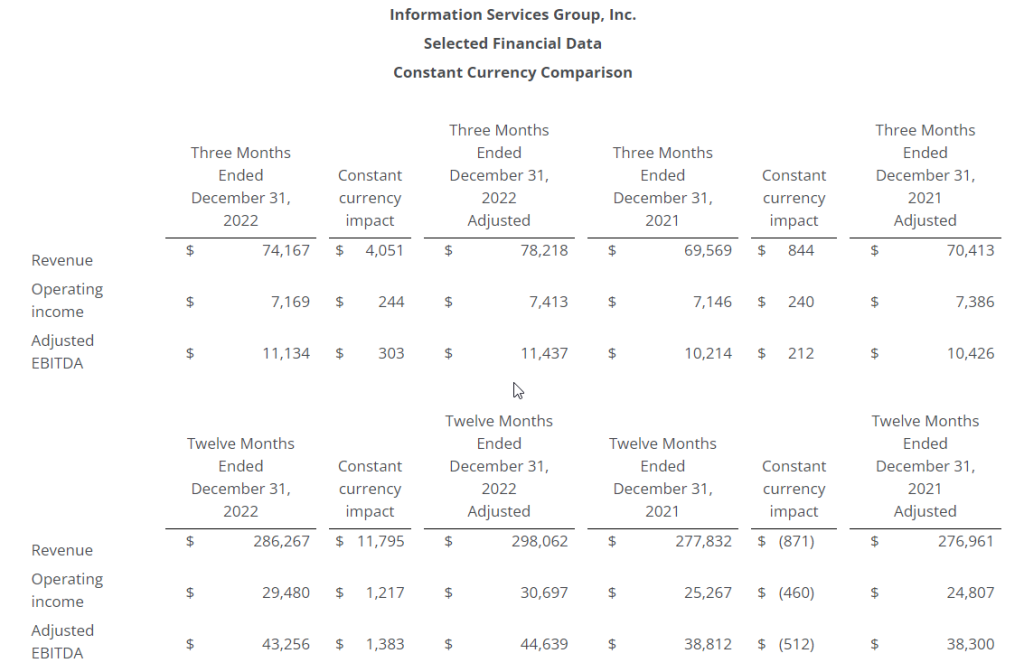
Reported revenues for the fourth quarter were a record $74.2 million, up 7 percent from $69.6 million in the prior year, and up 11 percent in constant currency. Currency translation negatively impacted reported revenues by $3.2 million versus the prior year. Reported revenues were $43.6 million in the Americas, up 12 percent; $23.9 million in Europe, up 1 percent on a reported basis and up 12 percent in constant currency; and $6.7 million in Asia Pacific, down 4 percent on a reported basis and up 5 percent in constant currency, all versus the prior year.
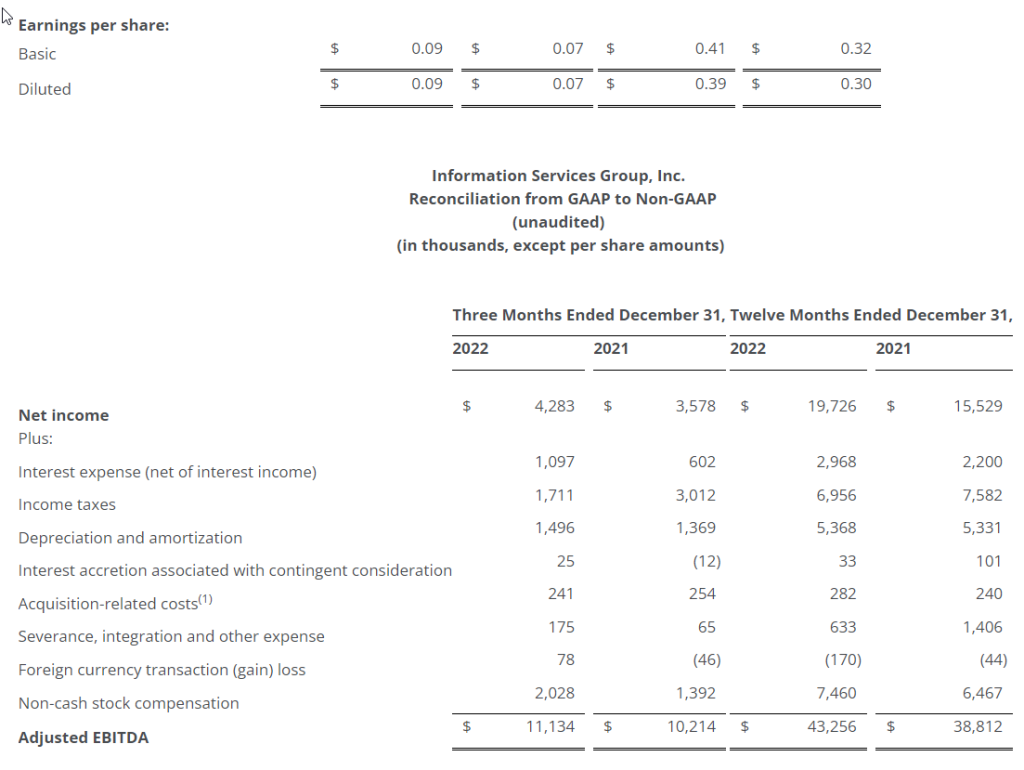
ISG reported fourth-quarter operating income of $7.2 million, flat versus the prior year. Reported fourth-quarter net income was a record $4.3 million, up 20 percent, compared with net income of $3.6 million in the prior year. Fully diluted earnings per share was a record $0.09, compared with $0.07 per fully diluted share in the prior year. Net income margin (calculated by dividing net income by reported revenues) increased to 5.8 percent, from 5.1 percent in the fourth quarter of 2021.
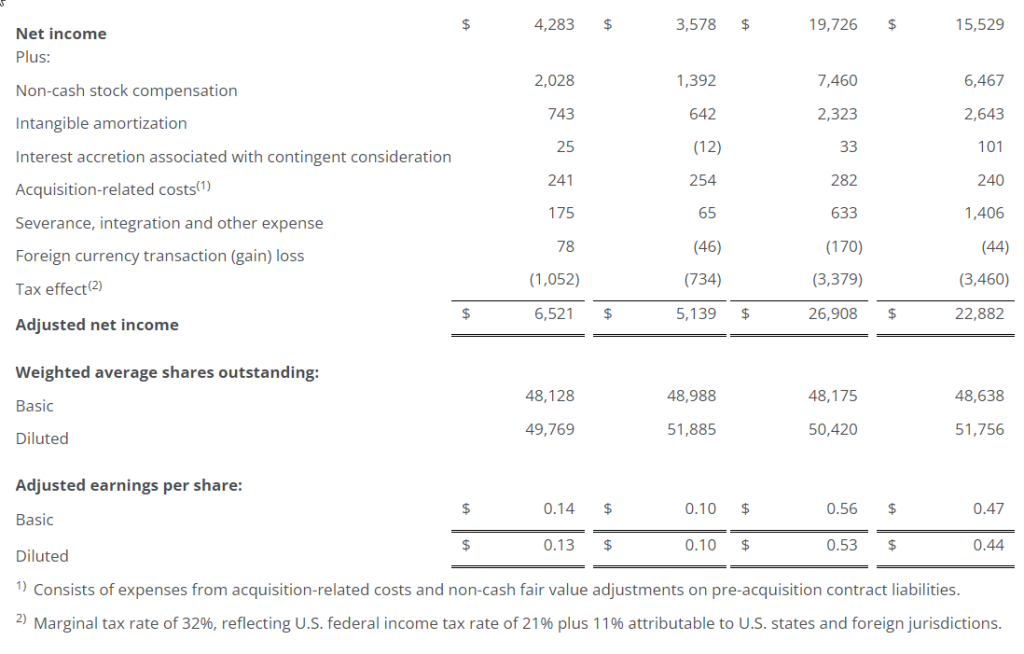
Adjusted net income (a non-GAAP measure defined below under “Non-GAAP Financial Measures”) for the fourth quarter was $6.5 million, or a record $0.13 per share on a fully diluted basis, compared with adjusted net income of $5.1 million, or $0.10 per share on a fully diluted basis, in the prior year’s fourth quarter.
Fourth-quarter adjusted EBITDA (a non-GAAP measure defined below under “Non-GAAP Financial Measures”) was a record $11.1 million, up 9 percent from the prior-year fourth quarter. Adjusted EBITDA margin (a non-GAAP measure calculated by dividing adjusted EBITDA by reported revenues) was 15 percent, up 33 basis points from the prior year.
Full-Year 2022 Results
Reported revenues for the full-year were a record $286.3 million, up 3 percent versus the prior-year, and up 8 percent in constant currency. Currency translation negatively impacted reported revenues by $12.7 million versus 2021. Reported revenues were $166.7 million in the Americas, up 4 percent; $89.9 million in Europe, flat on a reported basis and up 12 percent in constant currency; and $29.7 million in Asia Pacific, up 8 percent on a reported basis and up 16 percent in constant currency, all versus the prior year.
ISG reported record full-year operating income of $29.5 million, up 17 percent from $25.3 million in the prior year. The firm also reported record net income and fully diluted earnings per share of $19.7 million and $0.39, respectively, versus net income of $15.5 million and earnings per share of $0.30 in the prior year. Net income margin (calculated by dividing net income by reported revenues) increased to 6.9 percent, from 5.6 percent in the same period last year.
Adjusted net income (a non-GAAP measure defined below under “Non-GAAP Financial Measures”) for the full year was a record $26.9 million, or $0.53 per share on a fully diluted basis, compared with adjusted net income of $22.9 million, or $0.44 per share on a fully diluted basis, in the prior year.
Full-year adjusted EBITDA (a non-GAAP measure defined below under “Non-GAAP Financial Measures”) reached a record $43.3 million, up 11 percent from the prior year. Adjusted EBITDA margin (a non-GAAP measure calculated by dividing adjusted EBITDA by reported revenues) was a record 15 percent, up more than 110 basis points from the prior year.
Other Financial and Operating Highlights
ISG generated $6.6 million of cash from operations in the fourth quarter, compared with $2.5 million in the prior year, and $11.1 million for the full year. The firm’s cash balance totaled $30.6 million at December 31, 2022, up from $19.7 million at September 30, 2022.
During the fourth quarter, ISG paid dividends of $2.0 million, paid down $1.1 million of debt and drew down $9.0 million on its revolving credit agreement with the funds used for the acquisition of Change 4 Growth and for general operating purposes. As of December 31, 2022, ISG had $79.2 million in debt outstanding, compared with $74.5 million at the end of the fourth quarter last year. The firm’s gross-debt-to-adjusted-EBITDA ratio (a non-GAAP measure calculated by dividing outstanding debt by adjusted EBITDA) was 1.8 times, a record low for year end.
“Our strong operating results allowed us to return $23.6 million of capital to our shareholders in the form of dividends and share repurchases in 2022,” Connors said. “It also allowed us to amend our existing credit agreement, converting it to an all-revolver facility, with more favorable terms and an extended maturity date.”
Amended Credit Agreement
As previously announced, on February 22, 2023, ISG successfully amended the credit agreement that the firm originally entered into on March 10, 2020. The amended agreement provides $140 million of borrowing capacity at more favorable terms, converts the previous term and revolving loan into an all-revolving credit facility, eliminates $4.3 million of mandatory annual principal payments under the previous agreement, and extends the maturity date of the previous agreement by three years, to February 2028.
2023 First-Quarter Revenue and Adjusted EBITDA Guidance
“For the first quarter, ISG is targeting revenues of between $73 million and $75 million – including 200 basis points of FX headwinds – and adjusted EBITDA of between $10 million and $11 million. We will continue to monitor the macroeconomic environment, including the impact of FX, inflation and other factors, and adjust our business plans accordingly.”
Quarterly Dividend
The ISG Board of Directors declared a first-quarter dividend of $0.04 per share, payable on March 31, 2023, to shareholders of record as of March 20, 2023.
Conference Call
ISG has scheduled a call for 9 a.m., U.S. Eastern Time, Friday, March 10, 2023, to discuss the company’s fourth-quarter results. The call can be accessed by dialing +1 833-470-1428; or, for international callers, by dialing +1 929-526-1599. The access code is 356636. A recording of the conference call will be accessible on ISG’s website (www.isg-one.com) for approximately four weeks following the call.
Forward-Looking Statements
This communication contains “forward-looking statements” which represent the current expectations and beliefs of management of ISG concerning future events and their potential effects. Statements contained herein including words such as “anticipate,” “believe,” “contemplate,” “plan,” “estimate,” “target,” “expect,” “intend,” “will,” “continue,” “should,” “may,” and other similar expressions, are “forward-looking statements” under the Private Securities Litigation Reform Act of 1995. These forward-looking statements are not guarantees of future results and are subject to certain risks and uncertainties that could cause actual results to differ materially from those anticipated. Those risks relate to inherent business, economic and competitive uncertainties and contingencies relating to the businesses of ISG and its subsidiaries including without limitation: (1) failure to secure new engagements or loss of important clients; (2) ability to hire and retain enough qualified employees to support operations; (3) ability to maintain or increase billing and utilization rates; (4) management of growth; (5) success of expansion internationally; (6) competition; (7) ability to move the product mix into higher margin businesses; (8) general political and social conditions such as war, political unrest and terrorism; (9) healthcare and benefit cost management; (10) ability to protect ISG and its subsidiaries’ intellectual property or data and the intellectual property or data of others; (11) currency fluctuations and exchange rate adjustments; (12) ability to successfully consummate or integrate strategic acquisitions; (13) outbreaks of diseases, including coronavirus, or similar public health threats or fear of such an event; and (14) engagements may be terminated, delayed or reduced in scope by clients. Certain of these and other applicable risks, cautionary statements and factors that could cause actual results to differ from ISG’s forward-looking statements are included in ISG’s filings with the U.S. Securities and Exchange Commission. ISG undertakes no obligation to update or revise any forward-looking statements to reflect subsequent events or circumstances.
Non-GAAP Financial Measures
ISG reports all financial information required in accordance with U.S. generally accepted accounting principles (GAAP). In this release, ISG has presented both GAAP financial results as well as non-GAAP information for the three and twelve months ended December 31, 2022, and December 31, 2021. ISG believes that evaluating its ongoing operating results will be enhanced if it discloses certain non-GAAP information. These non-GAAP financial measures exclude non-cash and certain other special charges that many investors believe may obscure the user’s overall understanding of ISG’s current financial performance and the Company’s prospects for the future. ISG believes that these non-GAAP measures provide useful information to investors because they improve the comparability of the financial results between periods and provide for greater transparency of key measures used to evaluate the Company’s performance.
ISG provides adjusted EBITDA (defined as net income plus interest, taxes, depreciation and amortization, foreign currency transaction gains/losses, non-cash stock compensation, interest accretion associated with contingent consideration, acquisition-related costs, and severance, integration and other expense), adjusted net income (defined as net income plus amortization of intangible assets, non-cash stock compensation, foreign currency transaction gains/losses, interest accretion associated with contingent consideration, acquisition-related costs, and severance, integration and other expense, on a tax-adjusted basis), adjusted net income per diluted share, adjusted EBITDA margin, gross-debt-to-adjusted-EBITDA ratio and selected financial data on a constant currency basis which are non-GAAP measures that the Company believes provide useful information to both management and investors by excluding certain expenses and financial implications of foreign currency translations, which management believes are not indicative of ISG’s core operations. These non-GAAP measures are used by ISG to evaluate the Company’s business strategies and management’s performance.
We evaluate our results of operations on both an as reported and a constant currency basis. The constant currency presentation, which is a non-GAAP financial measure, excludes the impact of year-over-year fluctuations in foreign currency exchange rates. We believe providing constant currency information provides valuable supplemental information regarding our results of operations, thereby facilitating period-to-period comparisons of our business performance and is consistent with how management evaluates the Company’s performance. We calculate constant currency percentages by converting our current and prior-periods local currency financial results using the same point in time exchange rates and then compare the adjusted current and prior period results. This calculation may differ from similarly titled measures used by others and, accordingly, the constant currency presentation is not meant to be a substitution for recorded amounts presented in conformity with GAAP, nor should such amounts be considered in isolation.
Management believes this information facilitates comparison of underlying results over time. Non-GAAP financial measures, when presented, are reconciled to the most closely applicable GAAP measure. Non-GAAP measures are provided as additional information and should not be considered in isolation or as a substitute for results prepared in accordance with GAAP. A reconciliation of the forward-looking non-GAAP estimates contained herein to the corresponding GAAP measures is not being provided, due to the unreasonable efforts required to prepare it.
About ISG
ISG (Information Services Group) (Nasdaq: III) is a leading global technology research and advisory firm. A trusted business partner to more than 900 clients, including more than 75 of the world’s top 100 enterprises, ISG is committed to helping corporations, public sector organizations, and service and technology providers achieve operational excellence and faster growth. The firm specializes in digital transformation services, including automation, cloud and data analytics; sourcing advisory; managed governance and risk services; network carrier services; strategy and operations design; change management; market intelligence and technology research and analysis. Founded in 2006, and based in Stamford, Conn., ISG employs 1,600 digital-ready professionals operating in more than 20 countries—a global team known for its innovative thinking, market influence, deep industry and technology expertise, and world-class research and analytical capabilities based on the industry’s most comprehensive marketplace data. For more information, visit www.isg-one.com.
Company to host conference call and webcast at 4:30 p.m. ET on Thursday, March 16, 2023
NEWTOWN, Pa., March 09, 2023 (GLOBE NEWSWIRE) — Onconova Therapeutics, Inc. (NASDAQ: ONTX), (“Onconova”), a clinical-stage biopharmaceutical company focused on discovering and developing novel products for patients with cancer, today announced that the Company intends to release its fourth quarter and full year 2022 financial results on Thursday, March 16, 2023. Management plans to host a conference call and live webcast at 4:30 p.m. ET on the same day to discuss these results and provide an update on its pipeline programs.
Conference Call and Webcast Information
Interested parties who wish to participate in the conference call may do so by dialing (800) 715-9871 for domestic and (646) 307-1963 for international callers and using conference ID 3097517.
Those interested in listening to the conference call via the internet may do so by visiting the investors and media page on the Company’s website at www.onconova.com and clicking on the webcast link. In addition to the live webcast, a replay will be available on the Onconova website for 90 days following the call.
About Onconova Therapeutics, Inc.
Onconova Therapeutics is a clinical-stage biopharmaceutical company focused on discovering and developing novel products for patients with cancer. The Company has proprietary targeted anti-cancer agents designed to disrupt specific cellular pathways that are important for cancer cell proliferation.
Onconova’s novel, proprietary multi-kinase inhibitor narazaciclib (formerly ON 123300) is being evaluated in two separate and complementary Phase 1 dose escalation and expansion studies. These trials are currently underway in the United States and China. Based on preclinical and clinical studies of CDK 4/6 inhibitors, Onconova is also planning a combination trial of narazaciclib with estrogen blockade in advanced endometrial cancer, as well as its clinical study in additional indications.
Onconova’s product candidate rigosertib is being studied in multiple investigator-sponsored studies, including a dose-escalation and expansion Phase 1/2a study of oral rigosertib in combination with nivolumab in patients with KRAS+ non-small cell lung cancer, and a Phase 2 program evaluating rigosertib monotherapy in advanced squamous cell carcinoma complicating recessive dystrophic epidermolysis bullosa.
Some of the statements in this release are forward-looking statements within the meaning of Section 27A of the Securities Act of 1933, as amended, Section 21E of the Securities Exchange Act of 1934, as amended, and the Private Securities Litigation Reform Act of 1995, and involve risks and uncertainties. These statements relate to Onconova’s expectations regarding its clinical development and trials, its product candidates, its business and financial position. Onconova has attempted to identify forward-looking statements by terminology including “believes,” “estimates,” “anticipates,” “expects,” “plans,” “intends,” “may,” “could,” “might,” “will,” “should,” “preliminary,” “encouraging,” “approximately” or other words that convey uncertainty of future events or outcomes. Although Onconova believes that the expectations reflected in such forward-looking statements are reasonable as of the date made, expectations may prove to have been materially different from the results expressed or implied by such forward-looking statements. These statements are only predictions and involve known and unknown risks, uncertainties, and other factors, including the success and timing of Onconova’s clinical trials, investigator-initiated trials and regulatory agency and institutional review board approvals of protocols, Onconova’s collaborations, market conditions and those discussed under the heading “Risk Factors” in Onconova’s most recent Annual Report on Form 10-K and quarterly reports on Form 10-Q. Any forward-looking statements contained in this release speak only as of its date. Onconova undertakes no obligation to update any forward-looking statements contained in this release to reflect events or circumstances occurring after its date or to reflect the occurrence of unanticipated events.
MELVILLE, N.Y. – March 9, 2023– Comtech (NASDAQ: CMTL) today announced its second quarter fiscal 2023 financial results and updated its third quarter fiscal 2023 financial targets in a letter to shareholders which is now posted to the Investor Relations section of Comtech’s website.
Investors are invited to access the second quarter fiscal 2023 shareholder letter at its web site at comtech.com/investor-relations/. A copy of the letter will also be filed with the Securities and Exchange Commission in a Form 8-K.
Comtech also intends to host a previously scheduled earnings conference call at 5:00PM ET today that is intended to be briefer but provide more time for questions and discussion. Individuals can access the conference call by dialing (800) 225-9448 (domestic) or (203) 518-9708 (international) and using the conference I.D. of “Comtech.” A replay of the conference call will be available for two weeks by dialing (800) 839-3516 or (402) 220-7238. A live webcast of the call is also available at comtech.com/investor-relations/.
About Comtech
Comtech Telecommunications Corp. is a leading global technology company providing terrestrial and wireless network solutions, next-generation 9-1-1 emergency services, satellite and space communications technologies, and cloud native capabilities to commercial and government customers around the world. Our unique culture of innovation and employee empowerment unleashes a relentless passion for customer success. With multiple facilities located in technology corridors throughout the United States and around the world, Comtech leverages our global presence, technology leadership, and decades of experience to create the world’s most innovative communications solutions.For more information, please visit www.comtech.com.
Certain information in this press release contains statements that are forward-looking in nature and involve certain significant risks and uncertainties. Actual results could differ materially from such forward-looking information. The Company’s Securities and Exchange Commission filings identify many such risks and uncertainties. Any forward- looking information in this press release is qualified in its entirety by the risks and uncertainties described in such Securities and Exchange Commission filings.
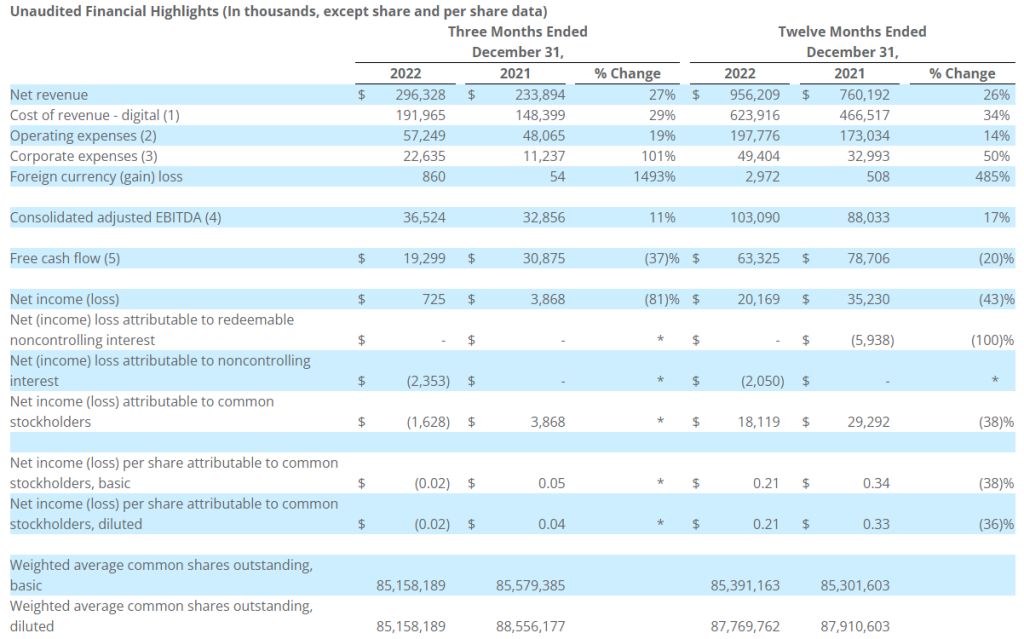
SANTA MONICA, Calif.–(BUSINESS WIRE)– Entravision Communications Corporation (NYSE: EVC), a leading global advertising solutions, media and technology company, today announced financial results for the three- and twelve-month periods ended December 31, 2022.
Fourth Quarter and Full Year 2022 Highlights
Record fourth quarter and annual revenue
Record fourth quarter and annual consolidated adjusted EBITDA
Record political advertising revenue compared to prior election cycles, including presidential
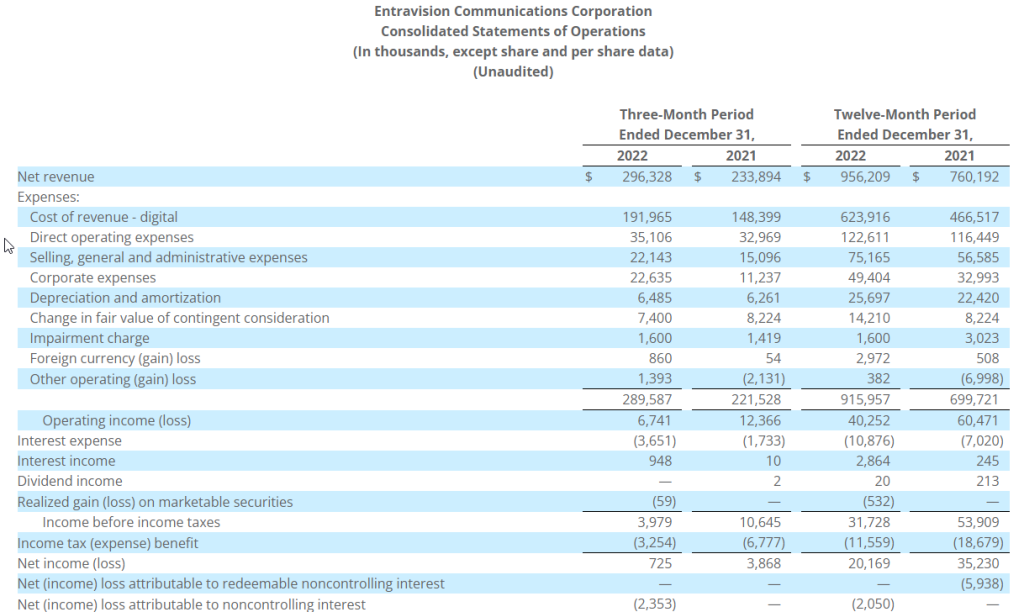
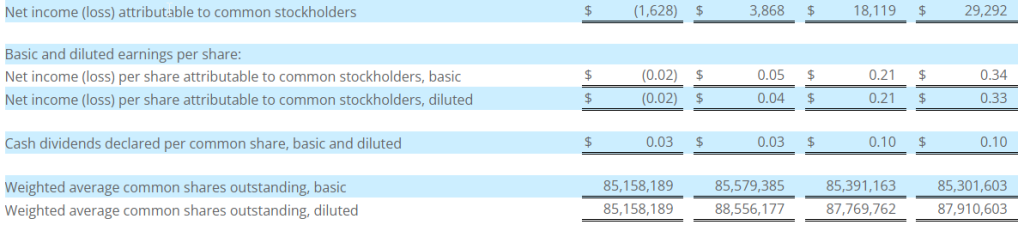
Net loss attributable to common stockholders of $1.6 million in the fourth quarter compared to net income attributable to common stockholders of $3.9 million in the prior-year quarter
Net income attributable to common stockholders for the full year down 38% compared to the prior-year
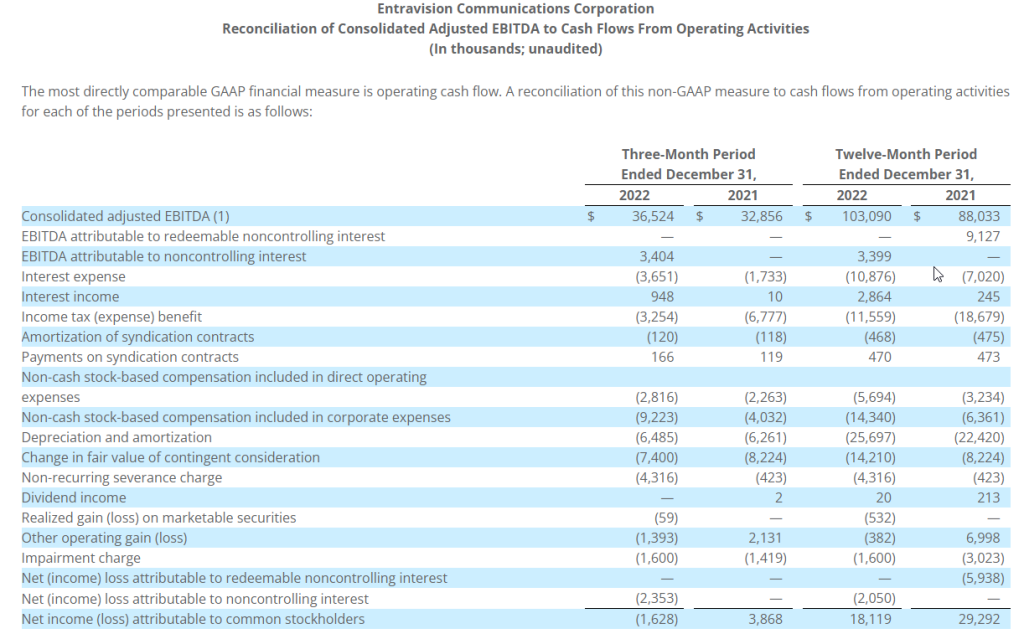
Consolidated adjusted EBITDA up 11% and 17% compared to the prior-year quarter and full year, respectively
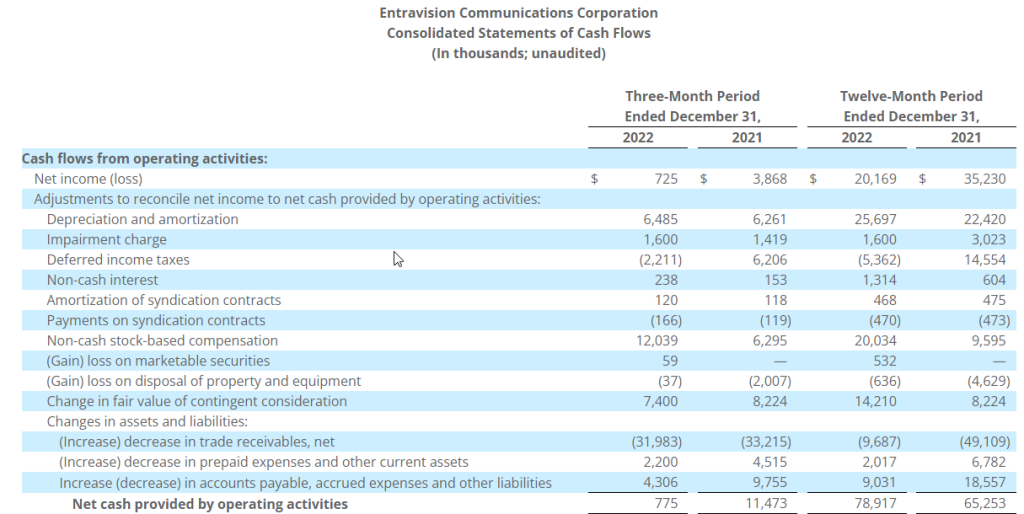
Operating cash flow down 93% and up 21% compared to the prior-year quarter and full year, respectively
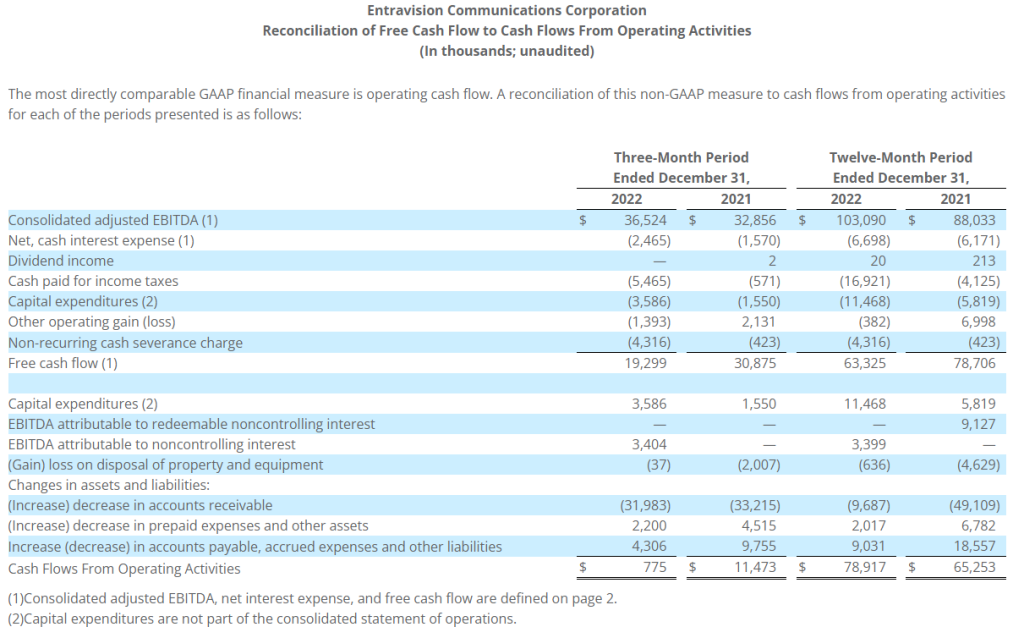
Free cash flow down 37% and 20% compared to the prior-year quarter and full year, respectively
Quarterly cash dividend increase to $0.05 per share
“We are pleased with our 2022 performance, which marks a record year for Entravision for revenue and consolidated adjusted EBITDA,” said Entravision Interim Chief Executive Officer and Chief Financial Officer, Chris Young. “Our results demonstrate the resiliency and strength of our business through challenging macro conditions, and the successful execution of our strategic plan to create a leading global advertising solutions, media and technology company. We have enhanced our digital segment organically, as well as through strategic partnerships, geographic expansion and accretive acquisitions to bolster our suite of digital services in the large and growing advertising industry. Our complementary non-digital businesses, while a smaller percentage of our revenue portfolio, continue to be an important contributor to our growth. We will continue to leverage our tools, reach, technology and world-class team to meet our clients’ evolving needs and deliver enhanced shareholder value.”
Paul Zevnik, Interim Chair and co-founder said, “The Entravision team mourns the sudden and tragic loss of our late CEO, founder and dear friend, Walter Ulloa. Walter passed unexpectedly on the last day of the most successful year in the company’s history. Since we founded Entravision in 1996, we have developed a clear vision to build a leading global advertising solutions, media and technology company serving diverse demographics with diverse media. Through Walter’s leadership and with the support of a strong leadership team and dedicated entrepreneurs across each of Entravision’s business platforms, we have achieved tremendous growth and transformed the Company’s geographical breadth and media portfolio. Most importantly, we created a company that is a great place to work with a focus on engagement, trust, open communications, community service and involvement, and long-lasting relationships with our key partners. I miss our friend dearly, and the Board is committed to working with management to advance Walter’s vision and execute on our roadmap to deliver enhanced value for our stakeholders and partners.”
Quarterly Cash Dividend
As previously announced, the Company’s Board of Directors approved a quarterly cash dividend to shareholders of $0.05 per share on the Company’s Class A and Class U common stock, in an aggregate amount of approximately $4.4 million. This is double the Company’s previous quarterly dividend of $0.025 in 2022 and returns the dividend to its pre-pandemic level. The quarterly dividend will be payable on March 31, 2023 to shareholders of record as of the close of business on March 16, 2023, and the common stock will trade ex-dividend on March 15, 2023. The Company currently anticipates that future cash dividends will be paid on a quarterly basis; however, any decision to pay future cash dividends will be subject to approval by the Board.
Non-GAAP Financial Measures
This press release contains certain non-GAAP financial measures as defined by SEC Regulation G. The GAAP financial measure most directly comparable to each of these non-GAAP financial measures, and a table reconciling each of these non-GAAP financial measures to its most directly comparable GAAP financial measure is included beginning on page 10.
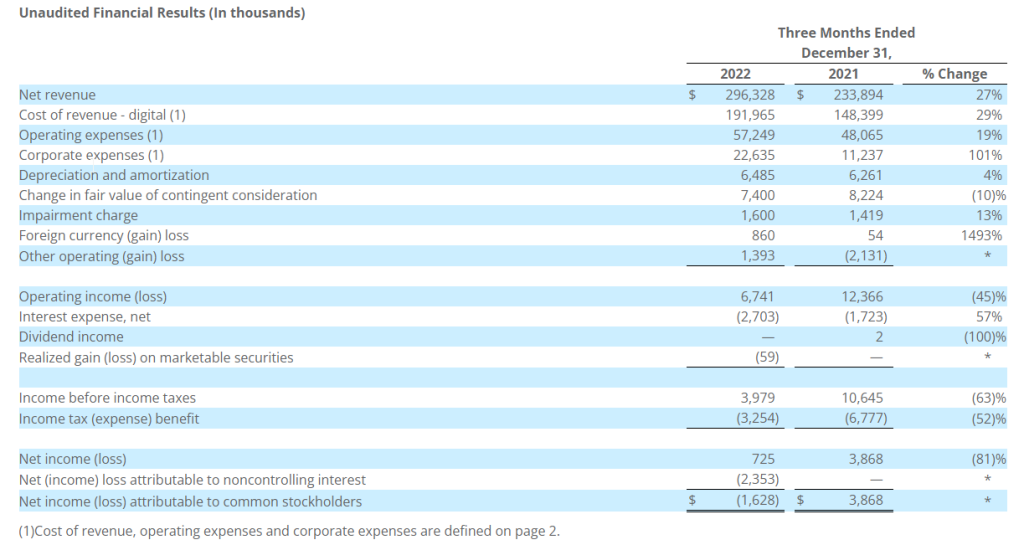
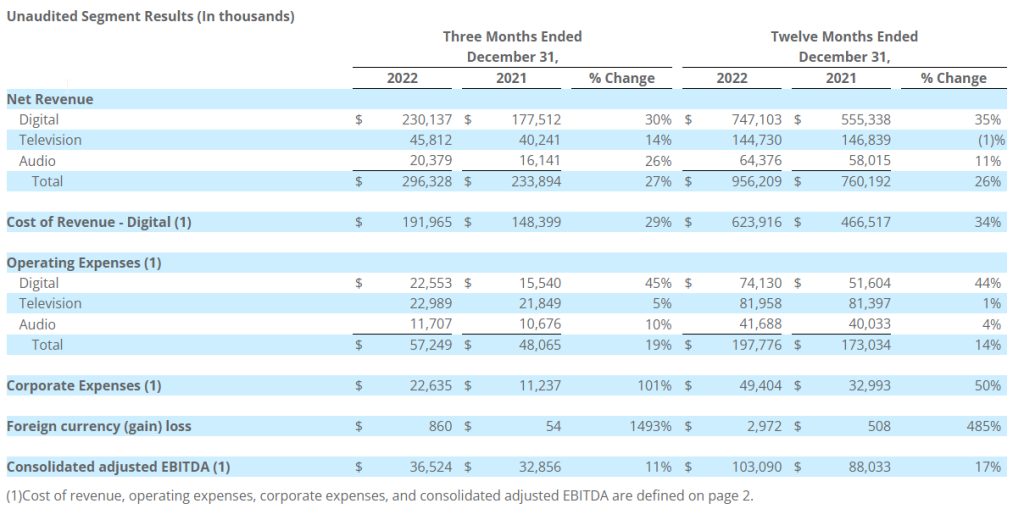
Net revenue in the fourth quarter of 2022 totaled $296.3 million, up 27% from $233.9 million in the prior-year period. Of the overall increase, approximately $52.6 million was attributable to our digital segment and was primarily due to advertising revenue growth from our digital commercial partnerships business. In addition, the increase in net revenue in our digital segment was due to our investments in variable interest entities in 2022, which did not contribute to our results of operations in the comparable prior-year period. In addition, of the overall increase, approximately $5.6 million was attributable to our television segment, primarily due to an increase in political advertising revenue, partially offset by decreases in local and national advertising revenue. These decreases were mainly attributed to the expiration of our Univision and UniMás network affiliation agreements in Orlando, Tampa and Washington, D.C. on December 31, 2021. Additionally, of the overall increase, approximately $4.2 million was attributable to our audio segment, primarily due to increases in political advertising revenue and national advertising revenue, partially offset by a decrease in local advertising revenue.
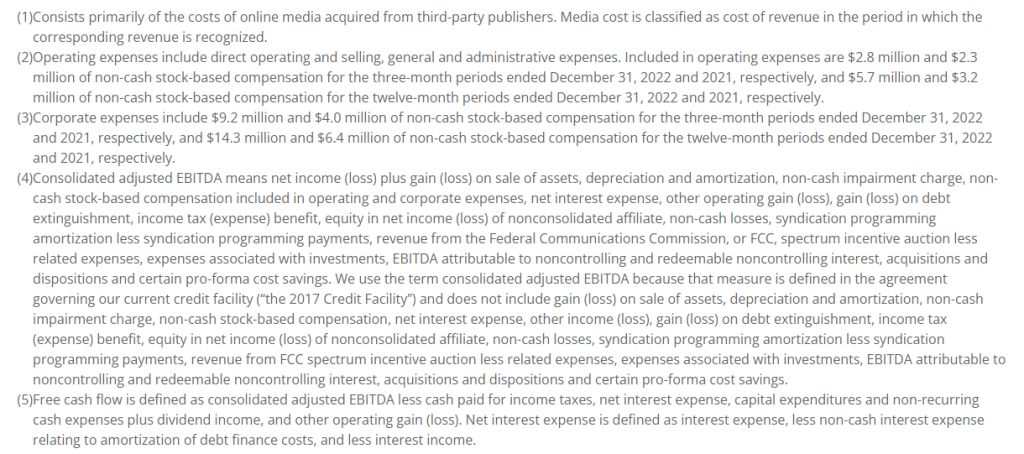
Cost of revenue in the fourth quarter of 2022 totaled $192.0 million, up 29% from $148.4 million in the prior-year period. The increase was primarily due to increased cost of revenue related to advertising revenue growth from our digital commercial partnerships business, and due to our investments in variable interest entities in 2022, which did not contribute to our results of operations in the comparable prior-year period.
Operating expenses in the fourth quarter of 2022 totaled $57.2 million, up 19% from $48.1 million in the prior-year period. Of the overall increase, approximately $7.0 million was attributable to our digital segment and was primarily due to an increase in expenses associated with the increase in digital advertising revenue, an increase in salary expense and non-cash stock-based compensation, and an increase due to our investments in variable interest entities in 2022, which did not contribute to our results of operations in the comparable prior-year period. In addition, of the overall increase in operating expenses, approximately $1.1 million was attributable to our television segment primarily due to an increase in rent expense, an increase in bad debt expense and an increase in non-cash stock-based compensation, partially offset by a decrease in expenses associated with the decrease in local and national advertising revenue. Additionally, of the overall increase in operating expenses, approximately $1.0 million was attributable to our audio segment primarily due to an increase in expenses associated with the increase in national advertising revenue and an increase in rent expense.
Corporate expenses in the fourth quarter of 2022 totaled $22.6 million, up 101% from $11.2 million in the prior-year period. The increase was primarily due to $8.1 million of severance related expense incurred upon the passing of our late Chief Executive Officer, and due to increases in non-cash stock-based compensation and an increase in salaries.
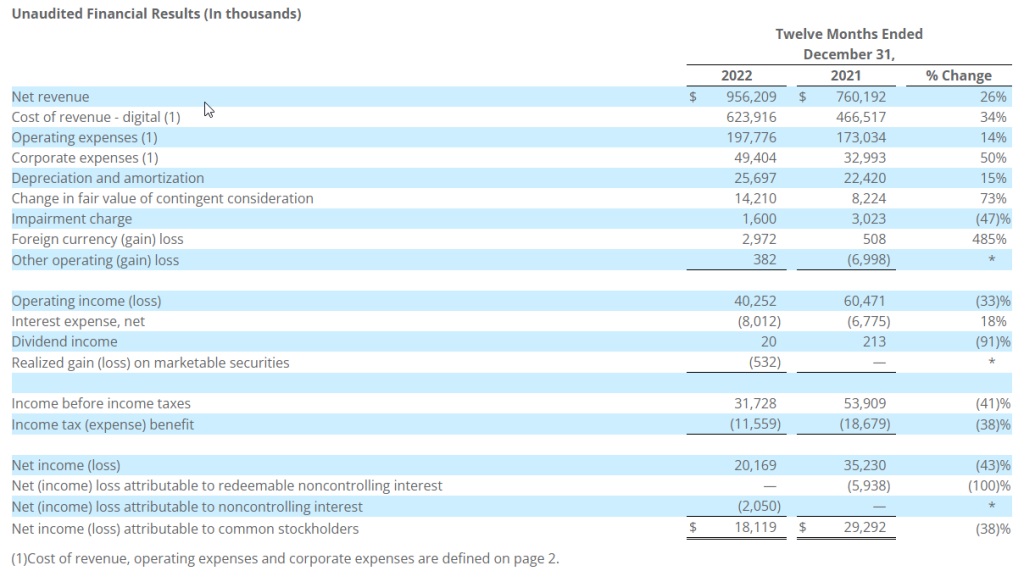
Net revenue for the year ended December 31, 2022 totaled $956.2 million, up 26% from $760.2 million in the prior-year period. Of the overall increase, approximately $191.8 million was attributable to our digital segment and was primarily due to advertising revenue growth from our digital commercial partnerships business. In addition, the increase in net revenue in our digital segment was due to our investments in variable interest entities in 2022 and our acquisitions in 2021, which did not contribute to our results of operations for the full prior-year period. In addition, of the overall increase, approximately $6.4 million was attributable to our audio segment primarily due to increases in political advertising revenue and local advertising revenue, partially offset by a decrease in national advertising revenue. The overall increase was partially offset by a decrease of approximately $2.1 million attributable to our television segment, primarily due to decreases in local and national advertising revenue, a decrease in spectrum usage rights revenue, and a decrease in retransmission consent revenue. These decreases were mainly attributed to the expiration of our Univision and UniMás network affiliation agreements in Orlando, Tampa and Washington, D.C. on December 31, 2021. The decrease in our television segment revenue was partially offset by an increase in political advertising revenue.
Cost of revenue for the year ended December 31, 2022 totaled $623.9 million, up 34% from $466.5 million in the prior-year period. The increase was primarily due to increased cost of revenue related to advertising revenue growth from our digital commercial partnerships business, and due to our investments in variable interest entities in 2022 and our acquisitions in 2021, which did not contribute to our results of operations for the full prior-year period.
Operating expenses for the year ended December 31, 2022 totaled $197.8 million, up 14% from $173.0 million in the prior-year period. Of the overall increase, approximately $22.5 million was attributable to our digital segment and was primarily due to an increase in expenses associated with the increase in digital advertising revenue, an increase in salary expense and non-cash stock-based compensation, and an increase due to our investments in variable interest entities in 2022 and our acquisitions in 2021, which did not contribute to our results of operations for the full prior-year period. In addition, of the overall increase in operating expenses, approximately $0.6 million was attributable to our television segment primarily due to an increase in rent expense, an increase in bad debt expense and an increase in non-cash stock-based compensation, partially offset by a decrease in expenses associated with the decrease in local and national advertising revenue. Additionally, of the overall increase in operating expenses, approximately $1.7 million was attributable to our audio segment primarily due to an increase in expenses associated with the increase in local advertising revenue and an increase in rent expense.
Corporate expenses for the year ended December 31, 2022 totaled $49.4 million, up 50% from $33.0 million in the prior-year period. The increase was primarily due to $8.1 million of severance related expense incurred upon the passing of our late Chief Executive Officer, and due to increases in non-cash stock-based compensation and an increase in salaries.
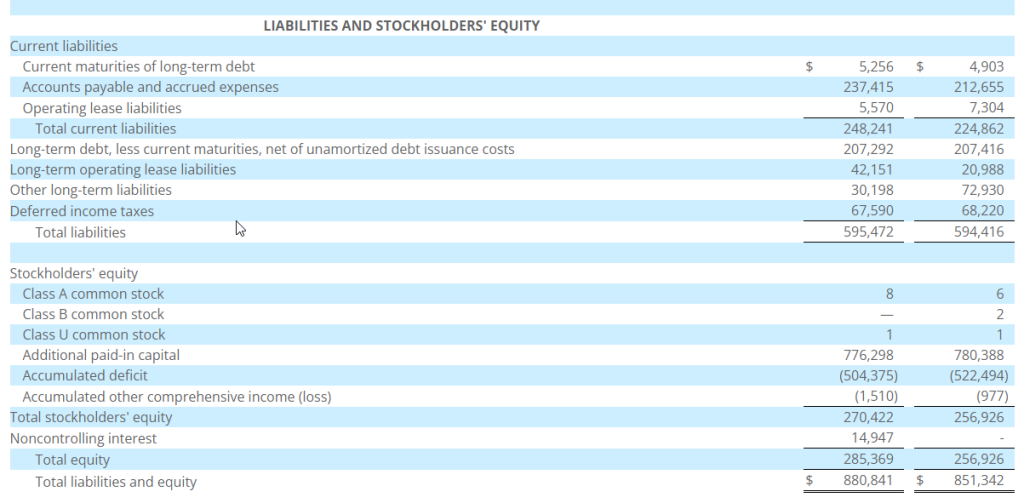
Balance Sheet and Related Metrics
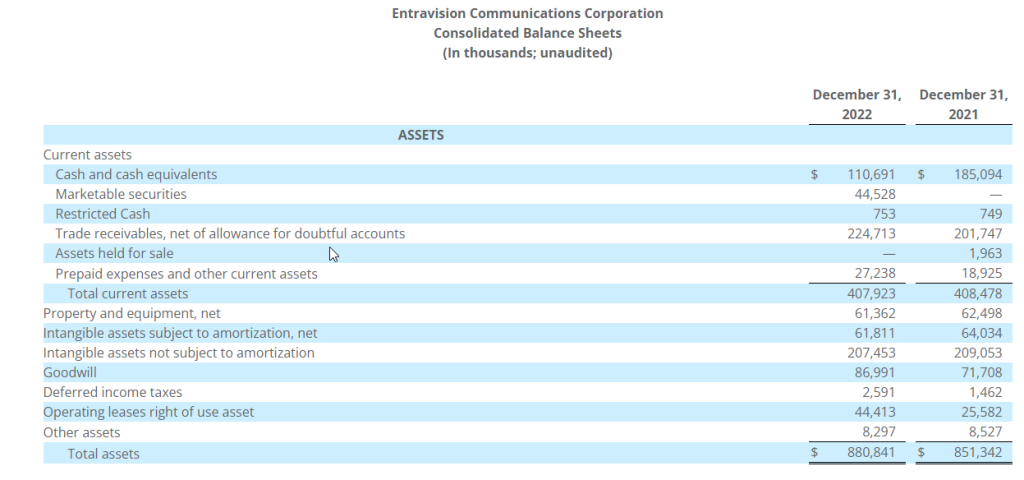
Cash and marketable securities as of December 31, 2022 totaled approximately $155.2 million. Total debt under the Company’s credit agreement was $209.3 million. Net of $75 million of cash and marketable securities, total leverage as defined in the Company’s credit agreement was 1.3 times as of December 31, 2022. Net of total cash and marketable securities, total leverage was 0.5 times.
Notice of Conference Call
Entravision Communications Corporation will hold a conference call to discuss its fourth quarter and full year 2022 results on Thursday, March 9, 2023 at 5:00 p.m. Eastern Time. To access the conference call, please dial (844) 836-8739 (U.S.) or (412) 317-5440 (Int’l) ten minutes prior to the start time and reference Conference ID number 10176187. The call will also be available via live webcast on the investor relations portion of the Company’s website located at www.entravision.com.
About Entravision Communications Corporation
Entravision is a leading global advertising, media and ad-tech solutions company connecting brands to consumers by representing top platforms and publishers. Our dynamic portfolio includes digital, television and audio offerings. Digital, our largest revenue segment, is comprised of four business units: our digital sales representation business; Smadex, our programmatic ad purchasing platform; our branding and mobile performance solutions business; and our digital audio business. Through our digital sales representation business, we connect global media companies such as Meta, Twitter, TikTok and Spotify with advertisers in primarily emerging growth markets worldwide. Smadex is our mobile-first demand side platform, enabling advertisers to execute performance campaigns using machine learning. We also offer a branding and mobile performance solutions business, which provides managed services to advertisers looking to connect with global consumers, primarily on mobile devices, and our digital audio business provides digital audio advertising solutions for advertisers in the Americas. In addition to digital, Entravision has 49 television stations and is the largest affiliate group of the Univision and UniMás television networks. Entravision also manages 45 primarily Spanish-language radio stations that feature nationally recognized, Emmy award-winning talent. Shares of Entravision Class A Common Stock trade on the NYSE under ticker: EVC. Learn more about our offerings at entravision.com or connect with us on LinkedIn and Facebook.
Forward-Looking Statements
This press release contains certain forward-looking statements. These forward-looking statements, which are included in accordance with the safe harbor provisions of the Private Securities Litigation Reform Act of 1995, may involve known and unknown risks, uncertainties and other factors that may cause the Company’s actual results and performance in future periods to be materially different from any future results or performance suggested by the forward-looking statements in this press release. Although the Company believes the expectations reflected in such forward-looking statements are based upon reasonable assumptions, it can give no assurance that actual results will not differ materially from these expectations, and the Company disclaims any duty to update any forward-looking statements made by the Company. From time to time, these risks, uncertainties and other factors are discussed in the Company’s filings with the Securities and Exchange Commission.
Christopher T. Young Interim Chief Executive Officer, and Chief Financial Officer and Treasurer Entravision Communications Corporation 310-447-3870
Townsquare is a community-focused digital media and digital marketing solutions company with market leading local radio stations, principally focused outside the top 50 markets in the U.S. Our assets include a subscription digital marketing services business, Townsquare Interactive, providing website design, creation and hosting, search engine optimization, social media and online reputation management as well as other digital monthly services for approximately 26,800 SMBs; a robust digital advertising division, Townsquare IGNITE, a powerful combination of a) an owned and operated portfolio of more than 330 local news and entertainment websites and mobile apps along with a network of leading national music and entertainment brands, collecting valuable first party data, and b) a proprietary digital programmatic advertising technology stack with an in-house demand and data management platform; and a portfolio of 321 local terrestrial radio stations in 67 U.S. markets strategically situated outside the Top 50 markets in the United States. Our portfolio includes local media brands such as WYRK.com, WJON.com, and NJ101.5.com and premier national music brands such as XXLmag.com, TasteofCountry.com, UltimateClassicRock.com and Loudwire.com.
Michael Kupinski, Director of Research, Noble Capital Markets, Inc.
Patrick McCann, Research Associate, Noble Capital Markets, Inc.
Refer to the full report for the price target, fundamental analysis, and rating.
Strong Q4 results. The company reported Q4 revenue of $120.3 million, an increase of 8.8% from the prior year period, beating our estimate of $118.1 million by 1.8%. Adj. EBITDA of $28.4 million grew by 11% from the same period last year and beat our estimate of $28 million by 1.4%. Digital advertising grew $5.2 million to $36.8 million, up 16.3% from the prior year period.
Soft start to the year. Management guided Q1 revenue to be flat to modestly higher from the year earlier in the range of $100 million to $102 million. Adj. EBITDA to be down yoy in the range of $17.5 million to $18.5 million. National advertising is pacing down 30% in Q1, a decline of $3 million from prior year quarter, with sports accounting for 66%. Its Interactive business has softened and is pacing flat revenues in Q1, while digital advertising is pacing up 12% to 14%.
Equity Research is available at no cost to Registered users of Channelchek. Not a Member? Click ‘Join’ to join the Channelchek Community. There is no cost to register, and we never collect credit card information.
This Company Sponsored Research is provided by Noble Capital Markets, Inc., a FINRA and S.E.C. registered broker-dealer (B/D).
*Analyst certification and important disclosures included in the full report. NOTE: investment decisions should not be based upon the content of this research summary. Proper due diligence is required before making any investment decision.
ISG (Information Services Group) (Nasdaq: III) is a leading global technology research and advisory firm. A trusted business partner to more than 700 clients, including more than 75 of the world’s top 100 enterprises, ISG is committed to helping corporations, public sector organizations, and service and technology providers achieve operational excellence and faster growth. The firm specializes in digital transformation services, including automation, cloud and data analytics; sourcing advisory; managed governance and risk services; network carrier services; strategy and operations design; change management; market intelligence and technology research and analysis. Founded in 2006, and based in Stamford, Conn., ISG employs more than 1,300 digital-ready professionals operating in more than 20 countries—a global team known for its innovative thinking, market influence, deep industry and technology expertise, and world-class research and analytical capabilities based on the industry’s most comprehensive marketplace data. For additional information, visit www.ISG-One.com
Joe Gomes, Managing Director – Generalist Analyst, Noble Capital Markets, Inc.
Joshua Zoepfel, Research Associate, Noble Capital Markets, Inc.
Refer to the full report for the price target, fundamental analysis, and rating.
4Q22 Results. ISG reported record fourth quarter revenue of $74.2 million, up from $69.6 million in the year ago period. FX negatively impacted revenue by $3.2 million. We had estimated $71 million. Fourth quarter net income was $4.3 million, GAAP EPS was $0.09, and adjusted EPS was $0.13. Adjusted EBITDA was $11.1 million, a 9% increase year-over-year. We forecasted net income of $4.45 million, EPS of $0.09, adjusted EPS of $0.13, and adjusted EBITDA of $10.6 million.
Segment Results. Reported revenues were $43.6 million in the Americas, up 12%; $23.9 million in Europe, up 1% on a reported basis and up 12% in constant currency; and $6.7 million in Asia Pacific, down 4% on a reported basis and up 5% in constant currency, all versus the prior year.
Equity Research is available at no cost to Registered users of Channelchek. Not a Member? Click ‘Join’ to join the Channelchek Community. There is no cost to register, and we never collect credit card information.
This Company Sponsored Research is provided by Noble Capital Markets, Inc., a FINRA and S.E.C. registered broker-dealer (B/D).
*Analyst certification and important disclosures included in the full report. NOTE: investment decisions should not be based upon the content of this research summary. Proper due diligence is required before making any investment decision.
Entravision Communications Corporation is a diversified Spanish-language media company utilizing a combination of television and radio operations to reach Hispanic consumers across the United States, as well as the border markets of Mexico. Entravision owns and/or operates 53 primary television stations and is the largest affiliate group of both the top-ranked Univision television network and Univision’s TeleFutura network, with television stations in 20 of the nation’s top 50 Hispanic markets. The Company also operates one of the nation’s largest groups of primarily Spanish-language radio stations, consisting of 48 owned and operated radio stations.
Michael Kupinski, Director of Research, Noble Capital Markets, Inc.
Patrick McCann, Research Associate, Noble Capital Markets, Inc.
Refer to the full report for the price target, fundamental analysis, and rating.
Strong Q4 results. The company reported quarterly revenue of $296.3 million, up 27% from the prior year period, surpassing our estimate of $265.4 million by 11.7%. Adj. EBITDA of $36.5 million increased 11% year over year and beat our estimate of $34.8 million by 5.1%. The quarter was driven by strong digital revenue growth of $52.6 million, up 30% year-over-year.
Capital allocation. The company announced a 100% increase in its quarterly cash dividend, from $0.025 per share to $0.05 per share. Given its favorable cash position of $ $110.7 million and robust free cash flow generation of $63.3 million in 2022, we expect the company to seek additional accretive acquisitions and comfortably pay the dividend. Notably, management highlighted a favorable pipeline of potential targets.
Equity Research is available at no cost to Registered users of Channelchek. Not a Member? Click ‘Join’ to join the Channelchek Community. There is no cost to register, and we never collect credit card information.
This Company Sponsored Research is provided by Noble Capital Markets, Inc., a FINRA and S.E.C. registered broker-dealer (B/D).
*Analyst certification and important disclosures included in the full report. NOTE: investment decisions should not be based upon the content of this research summary. Proper due diligence is required before making any investment decision.
Comstock (NYSE: LODE) innovates technologies that contribute to global decarbonization and circularity by efficiently converting under-utilized natural resources into renewable fuels and electrification products that contribute to balancing global uses and emissions of carbon. The Company intends to achieve exponential growth and extraordinary financial, natural, and social gains by building, owning, and operating a fleet of advanced carbon neutral extraction and refining facilities, by selling an array of complimentary process solutions and related services, and by licensing selected technologies to qualified strategic partners. To learn more, please visit www.comstock.inc.
Mark Reichman, Senior Research Analyst, Natural Resources, Noble Capital Markets, Inc.
Refer to the full report for the price target, fundamental analysis, and rating.
Key executive appointment. Comstock appointed Dr. Fortunato Villamagna as President of Comstock Metals Corporation which owns LINICO Corporation, Comstock’s lithium-ion battery metals recycling business. Dr. Villamagna earned a PhD in Chemistry from McGill University, along with MSc and BSc degrees in Chemistry from Concordia University. His experience in new technology development, commercialization, product introduction, market development, and team building are expected to benefit the growth of Comstock’s battery recycling business.
Reassessing property needs. LINICO agreed to sell its battery recycling facility in the Tahoe-Reno Industrial Center in Nevada for gross proceeds of $27 million ex the legacy processing equipment to American Battery Technology Company (OTCQX, ABML). LINICO had leased the facility with an option to purchase for $15.25 million, of which $3.25 million was paid. Comstock expects to receive net proceeds of approximately $12.5 million. While the sale could extend LINICO’s development time line, the transaction turns a $12 million cash obligation into a $12.5 million net cash inflow.
Equity Research is available at no cost to Registered users of Channelchek. Not a Member? Click ‘Join’ to join the Channelchek Community. There is no cost to register, and we never collect credit card information.
This Company Sponsored Research is provided by Noble Capital Markets, Inc., a FINRA and S.E.C. registered broker-dealer (B/D).
*Analyst certification and important disclosures included in the full report. NOTE: investment decisions should not be based upon the content of this research summary. Proper due diligence is required before making any investment decision.
Stock are Less Likely to Spring Ahead for Daylight Savings Time
Alan Greenspan once made a brief comment saying that there is a correlation between sales of mens underwear and difficult markets ahead. Apparently, the Great Maestro, could support his data with an elasticity of demand chart. The data showed that sales in underpants were extremely consistent, except just before a recession. Another stock market correlation (with likely causation), is daylight savings time and stock prices. This has been the subject of another time-consuming study of numbers by a couple of Yale College professors.
With all stock market traders eager to develop an edge in the market, over time there has been a growing interest in the impact of external factors on the stock market. A study titled “Losing Sleep at the Market: The Daylight-Savings Anomaly,” conducted by Matthew J. Kotchen and Laura E. Grant from Yale University. It explored the impact of DST on stocks. The study found that DST may have a negative impact on the market during the first week after the time change.
Kotchen and Grant’s study focused on the impact of DST on the New York Stock Exchange (NYSE) from 1964 to 2012. They found that during the first week after the springtime change to DST, stock prices tended to dip. This effect was most pronounced on the Monday following the time change, with an average decrease of 0.31% in stock prices. This effect was observed even after controlling for other factors that may have affected the stock market.
One possible explanation for this phenomenon is that the disruption to people’s sleep patterns may affect their productivity and decision-making abilities. This could lead to a decrease in trading activity and a temporary decline in stock prices. Another explanation is that the time change may lead to a decrease in trading volume due to confusion or technical glitches.
It’s worth noting that the effect of DST on the stock market, while statistically significant, is not very large and normally short-lived. The study found that the negative impact on stock prices disappeared after the first week, and there was no significant impact during the fall transition out of DST.
While Kotchen and Grant’s study sheds light on the impact of DST on the stock market, it’s important to keep in mind that many other factors have a much greater impact on stock prices. Economic indicators, political events, and company earnings reports are just a few examples of factors that can affect the stock market. Investors should not view this as significant enough to trade off of.
Take Away
“Losing Sleep at the Market: The Daylight-Savings Anomaly” suggests that DST may have a small, temporary negative impact on the stock market during the first week after the time change. However, the overall impact of DST on the stock market is likely to be small compared to other factors that affect stock prices.
The SVB Loss Demonstrates A Risk Investors Should Pay Attention To
Individual investors and even some institutional money managers are reminded of a helpful truth from the Silicon Valley Bank (SVB) balance sheet problem. The reminder of the investment risk stands in conflict with what many top firms have been recommending to investors. So it should be revisited because, unlike banks, individuals and wealth managers tend to have a wider variety of places to look for return.
Bank balance sheet management is tricky. I say this with some credibility. In August of 2008, I accepted a role as the Treasurer of a mid-sized bank just two weeks before Freddie Mac and Fannie Mae were placed into conservatorship, and three weeks before Lehman filed for bankruptcy. I was responsible for quickly finding solutions for a big potential balance sheet problem. It was a problem similar to SVB’s. Depositors at the bank were taking money out at a faster pace than bank investments, including loans cashflows, could cover. Money that had not been committed to loans were invested in low-risk investment-grade fixed-income securities. It was nerve-racking, at one point, I calculated if any two of the largest ten customers withdrew all of their funds, the bank would not have the ability to cover the withdrawal. The pain that SVB is faced with is not dissimilar.
SVB is a bank that serves many fledgling companies during a period when capital and investment in start-ups have weakened from the days of easier money just a couple of years ago. Banks make money by borrowing short from customers (demand deposits, checking, and CDs) and then lend long, presumably at a higher rate. Here they make the spread that a typical upward-sloping yield curve provides. The main risk is in maturity. What happens if your longer-term loans were made at Fed Funds plus 2.50% two years ago when average deposit costs were 0.20%, since today Fed Funds are 4.50%? Your loans are paying the bank less than the bank’s cost to fund them with short deposits. This is a risk that all banks manage – balance sheet risk.
As deposits ran off at SVB because of business conditions in Silicon Valley, the bank turned to its investment portfolio to fund withdrawals. Securities in a US bank portfolio, when purchased, are designated at the custodian, by the Treasurer, either “Trading” which in this department of the bank is rare, “Available for Sale,” which provides the treasury department the ability to sell if need be, but also requires the assets to be priced at market (this impacts the banks valuation), or “Hold to Maturity” where the fixed income securities appear on the balance sheet at cost.
If the securities are designated at purchase “Hold to Maturity” and the bank finds itself needing to sell any “Hold to Maturity” security, all securities marked “Hold to Maturity” become what regulators call tainted. The entire portfolio also becomes designated “Available for Sale.” This decision could dramatically reduce the bank’s book value in cases when interest rates have risen and bond values have dropped.
In the case of SVB, its securities portfolio, designed to earn more than deposits, was marked “Available for Sale.” When they sold, the market values were in such a lower position, from just a year earlier, that they recognized a dramatic loss. A $1.8 billion dollar loss which prompted its shares to lose more than half their market price.
Self-Directed Investors and Money Managers Should Note
The SVB explanation above, wernt a long way to remind that bonds, including US Treasury Notes have prices that rise and fall. They are different than equities, but price risk is real, and the $1.8 billion loss SVB recognized is front page proof. But since the beginning of the year many top-tier investment firms have recommended investors increase these fixed income investments and capture the new higher yields. Some even suggested ETFs in mortgaged-backed securities (MBS) or emerging markets (EM).
Goldman Asset Management is just one of the respected firms that have loudly suggested fixed income investments (CNBC, February 7, 2023)
Bond prices fall as rates rise. The Chair of the Federal Reserve, the same person that had orchestrated near zero rates, has clearly stated that the Fed will continue orchestrating higher rates. So while the stock market has been unattractive over the past 14 months, so have bonds. The difference, of course, is that bond math is absolute. As rates rise, the present value of any fixed-income security is calculated by the future value of future cash flow – this more or less determines the bonds price movement. For example, if an investor buys a bond that yields 3%, and later rates go to 6% for the same maturity, the present value is about halved. This is a plausible scenario currently, with inflation near 6%.
Stock indexes have taken a beating over the past 14 months, just like bonds. The difference is rising rates sink all bonds. It doesn’t sink all stocks.
So while the S&P 500 is down 17% since January 1, 2022, and the Russell 2000 small-cap index is down 20%, one doesn’t even have to get out of the A’s to find AT&T (T) is up 4.15% in the same period, and Canadian Company Alvopetro (ALVOF) is up 43.6%). You won’t find this type of disparity in performance or direction on the fixed-income side. US Treasuries were down 10.5% for the period.
So from one perspective, stock selection may provide potential upside, whereas rising rates could mathematically sink all bond portfolio holdings.
Take Away
Silicon Valley Bank is in a unique situation as its customer base is not very diversified. The challenges they face may be similar to other banks, but this does not appear indicative of the whole sector based on recent stress tests. Banks are restricted in what they can invest in, with rates having risen, and promised to rise more, fixed-income holdings are at a loss in many portfolios, SVB’s need to raise cash caused them to recognize what was already a market loss.
Investors, however, can take a lesson from the loss the bank took. While I have seen articles this year suggesting capitalizing on higher interest rates, the ten-year US Treasury Note is well below its historical average (40-yr. avg.+5.17% vs 3.73% today). And rates are not even returning a real rate of return relative to current and expected inflation. This would indicate a period of likely market losses on bond holdings put on today.
A Stock, or portfolio of stocks, of course, may also present losses, but the odds that any particular stock, or even an index, would seem less certain than bonds.
VIRGINIA CITY, NEVADA, MARCH 9, 2023 – Comstock Inc. (NYSE: LODE) (“Comstock” or the “Company”) today announced that it will host a conference call on Thursday, March 16, 2023, at 1:15 p.m. Pacific Daylight Time (4:15 p.m. Eastern Daylight Time) to report its 2022 year end results and business update. The webcast will include a moderated question and answer session after the Company’s prepared remarks. Please click the link below to register in advance and please join the event at least 10 minutes prior to the scheduled start time.
Once registered, you will receive a confirmation email containing information about joining the Webcast.
March 16, 2023, 1:15 PM Pacific Daylight Time / 4:15 PM Eastern Daylight Time (US and Canada)
Topic: Comstock’s Year End 2022 Results and Business Update
Please click here to register in advance for this webcast.
About Comstock
Comstock (NYSE: LODE) innovates technologies that contribute to global decarbonization and circularity by efficiently converting under-utilized natural resources into renewable fuels and electrification products that contribute to balancing global uses and emissions of carbon and through the deployment of more advanced mineral and material discovery technologies. To learn more, please visit www.comstock.inc.
Forward-Looking Statements
This press release and any related calls or discussions may include forward-looking statements within the meaning of Section 27A of the Securities Act of 1933, as amended, and Section 21E of the Securities Exchange Act of 1934, as amended. All statements, other than statements of historical facts, are forward-looking statements. The words “believe,” “expect,” “anticipate,” “estimate,” “project,” “plan,” “should,” “intend,” “may,” “will,” “would,” “potential” and similar expressions identify forward-looking statements but are not the exclusive means of doing so. Forward-looking statements include statements about matters such as: future industry market conditions; future explorations or acquisitions; future changes in our exploration activities; future prices and sales of, and demand for, our products; land entitlements and uses; permits; production capacity and operations; operating and overhead costs; future capital expenditures and their impact on us; operational and management changes (including changes in the Board of Directors); changes in business strategies, planning and tactics; future employment and contributions of personnel, including consultants; future land sales; investments, acquisitions, joint ventures, strategic alliances, business combinations, operational, tax, financial and restructuring initiatives, including the nature, timing and accounting for restructuring charges, derivative assets and liabilities and the impact thereof; contingencies; litigation, administrative or arbitration proceedings; environmental compliance and changes in the regulatory environment; offerings, limitations on sales or offering of equity or debt securities, including asset sales and associated costs; and future working capital, costs, revenues, business opportunities, debt levels, cash flows, margins, taxes, earnings and growth. These statements are based on assumptions and assessments made by our management considering their experience and their perception of historical and current trends, current conditions, possible future developments, and other factors they believe to be appropriate. Forward-looking statements are not guarantees, representations or warranties and are subject to risks and uncertainties, many of which are unforeseeable and beyond our control and could cause actual results, developments, and business decisions to differ materially from those contemplated by such forward-looking statements. Some of those risks and uncertainties include the risk factors set forth in our filings with the SEC and the following: adverse effects of climate changes or natural disasters; adverse effects of global or regional pandemic disease spread or other crises; global economic and capital market uncertainties; the speculative nature of gold or mineral exploration, and lithium, nickel and cobalt recycling, including risks of diminishing quantities or grades of qualified resources; metal recycling, processing or mining activities; costs, hazards and uncertainties associated with precious metal based activities, including environmentally friendly and economically enhancing clean mining and processing technologies, precious metal exploration, resource development, economic feasibility assessment and cash generating mineral production; costs, hazards and uncertainties associated with metal recycling, processing or mining activities; contests over our title to properties; potential dilution to our stockholders from our stock issuances, recapitalization and balance sheet restructuring activities; potential inability to comply with applicable government regulations or law; adoption of or changes in legislation or regulations adversely affecting our businesses; permitting constraints or delays; ability to achieve the benefits of business opportunities that may be presented to, or pursued by, us, including those involving battery technology, quantum computing and advanced materials development, and development of cellulosic technology in bio-fuels and related carbon-based material production; ability to successfully identify, finance, complete and integrate acquisitions, joint ventures, strategic alliances, business combinations, asset sales, and investments that we may be party to in the future; changes in the United States or other monetary or fiscal policies or regulations; interruptions in our production capabilities due to capital constraints; equipment failures; fluctuation of prices for gold or certain other commodities (such as silver, zinc, lithium, nickel, cobalt, cyanide, water, diesel, gasoline and alternative fuels and electricity); changes in generally accepted accounting principles; adverse effects of war, mass shooting, terrorism and geopolitical events; potential inability to implement our business strategies; potential inability to grow revenues; potential inability to attract and retain key personnel; interruptions in delivery of critical supplies, equipment and raw materials due to credit or other limitations imposed by vendors; assertion of claims, lawsuits and proceedings against us; potential inability to satisfy debt and lease obligations; potential inability to maintain an effective system of internal controls over financial reporting; potential inability or failure to timely file periodic reports with the Securities and Exchange Commission; potential inability to list our securities on any securities exchange or market or maintain the listing of our securities; and work stoppages or other labor difficulties. Occurrence of such events or circumstances could have a material adverse effect on our business, financial condition, results of operations or cash flows, or the market price of our securities. All subsequent written and oral forward-looking statements by or attributable to us or persons acting on our behalf are expressly qualified in their entirety by these factors. Except as may be required by securities or other law, we undertake no obligation to publicly update or revise any forward-looking statements, whether because of new information, future events, or otherwise.
Neither this press release nor any related calls or discussions constitutes an offer to sell, the solicitation of an offer to buy or a recommendation with respect to any securities of the Company, the fund, or any other issuer.
Contact information:
Comstock Inc. P.O. Box 1118 Virginia City, NV 89440 www.comstock.inc
Corrado De Gasperis Executive Chairman & CEO Tel (775) 847-4755 degasperis@comstockinc.com
Zach Spencer Director of External Relations Tel (775) 847-5272 Ext.151 questions@comstockinc.com