Defense Metals Corp. is a mineral exploration and development company focused on the acquisition, exploration and development of mineral deposits containing metals and elements commonly used in the electric power market, defense industry, national security sector and in the production of green energy technologies, such as, rare earths magnets used in wind turbines and in permanent magnet motors for electric vehicles. Defense Metals owns 100% of the Wicheeda Rare Earth Element Property located near Prince George, British Columbia, Canada. Defense Metals Corp. trades in Canada under the symbol “DEFN” on the TSX Venture Exchange, in the United States, under “DFMTF” on the OTCQB and in Germany on the Frankfurt Exchange under “35D”.
Mark Reichman, Senior Research Analyst, Natural Resources, Noble Capital Markets, Inc.
Refer to the full report for the price target, fundamental analysis, and rating.
2022 drill program. The 2022 resource delineation and pit slope geotechnical drill program comprised 18 core drill holes totaling 5,510 meters. Defense Metals recently released results from eight core drill holes, representing 2,104 meters of drilling, completed during 2022. To date, assay results have been announced for a total of 16 holes with results for the two remaining holes expected shortly.
Recent assay results. Recent results were from two exploration, three resource delineation, and three pit slope geotechnical core drill holes, one of which returned the second longest REE-mineralized intercept of the 2021 and 2022 Wicheeda drilling programs. Following receipt of remaining results, Defense Metals expects to update the Wicheeda mineral resource to include results from 10,859 meters of drilling in 47 core holes completed during the 2021 and 2022 drilling programs that were not included in the preliminary economic assessment (PEA).
Equity Research is available at no cost to Registered users of Channelchek. Not a Member? Click ‘Join’ to join the Channelchek Community. There is no cost to register, and we never collect credit card information.
This Company Sponsored Research is provided by Noble Capital Markets, Inc., a FINRA and S.E.C. registered broker-dealer (B/D).
*Analyst certification and important disclosures included in the full report. NOTE: investment decisions should not be based upon the content of this research summary. Proper due diligence is required before making any investment decision.
Why America Has a Debt Ceiling: Five Questions Answered
The Treasury Department on Jan. 13, 2023, said it expects the U.S. to hit the current debt limit of $31.38 trillion on Jan. 19. After that, the government would take “extraordinary measures” – which could extend the deadline until May or June – to avoid default. A default, even a risk of default would drive bond prices (interest rates) much higher than they currently are.
Is the debt ceiling still a good idea?
Economist Steve Pressman is a professor at The New School in Manhattan, below he explains the debt ceiling is and why we have it – and then shares his opinion on its usefulness.
What is the Debt Ceiling?
Like the rest of us, governments must borrow when they spend more money than they receive. They do so by issuing bonds, which are IOUs that promise to repay the money in the future and make regular interest payments. Government debt is the total sum of all this borrowed money.
The debt ceiling, which Congress established a century ago, is the maximum amount the government can borrow. It’s a limit on the national debt.
What’s the National Debt?
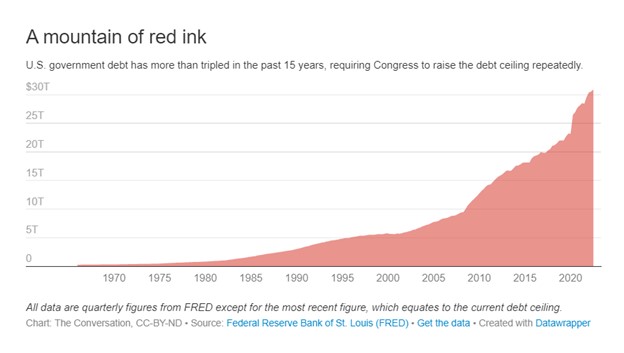
On Jan. 10, 2023, U.S. government debt was $30.92 trillion, about 22% more than the value of all goods and services that will be produced in the U.S. economy this year.
Around one-quarter of this money the government actually owes itself. The Social Security Administration has accumulated a surplus and invests the extra money, currently $2.8 trillion, in government bonds. And the Federal Reserve holds $5.5 trillion in U.S. Treasurys.
The rest is public debt. As of October 2022, foreign countries, companies and individuals owned $7.2 trillion of U.S. government debt. Japan and China are the largest holders, with around $1 trillion each. The rest is owed to U.S. citizens and businesses, as well as state and local governments.
Before 1917, Congress would authorize the government to borrow a fixed sum of money for a specified term. When loans were repaid, the government could not borrow again without asking Congress for approval.
The Second Liberty Bond Act of 1917, which created the debt ceiling, changed this. It allowed a continual rollover of debt without congressional approval.
Congress enacted this measure to let then-President Woodrow Wilson spend the money he deemed necessary to fight World War I without waiting for often-absent lawmakers to act. Congress, however, did not want to write the president a blank check, so it limited borrowing to $11.5 billion and required legislation for any increase.
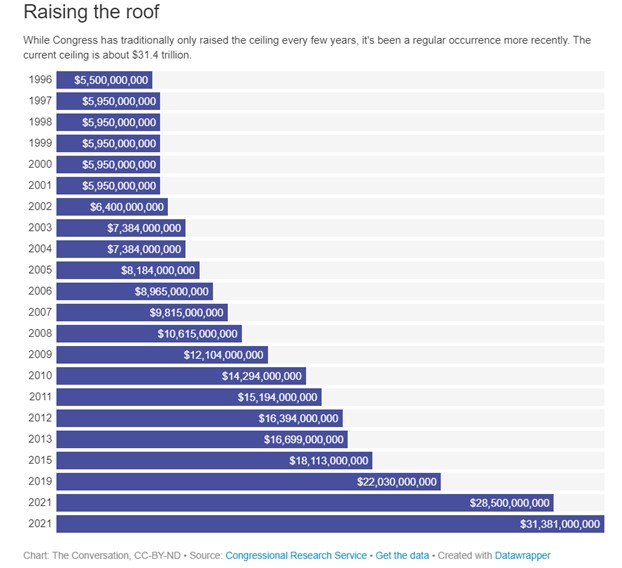
The debt ceiling has been increased dozens of times since then and suspended on several occasions. The last change occurred in December 2021, when it was raised to $31.38 trillion.
Currently, the U.S. Treasury has under $400 billion cash on hand, and the U.S. government expects to borrow around $100 billion each month this year.
When the U.S. nears its debt limit, the Treasury secretary – currently Janet Yellen – can use “extraordinary measures” to conserve cash, which she indicated would begin on Jan. 19. One such measure is temporarily not funding retirement programs for government employees. The expectation will be that once the ceiling is raised, the government would make up the difference. But this will buy only a small amount of time.
If the debt ceiling isn’t raised before the Treasury Department exhausts its options, decisions will have to be made about who gets paid with daily tax revenues. Further borrowing will not be possible. Government employees or contractors may not be paid in full. Loans to small businesses or college students may stop.
When the government can’t pay all its bills, it is technically in default. Policymakers, economists and Wall Street are concerned about a calamitous financial and economic crisis. Many fear that a government default would have dire economic consequences – soaring interest rates, financial markets in panic and maybe an economic depression.
Under normal circumstances, once markets start panicking, Congress and the president usually act. This is what happened in 2013 when Republicans sought to use the debt ceiling to defund the Affordable Care Act.
But we no longer live in normal political times. The major political parties are more polarized than ever, and the concessions McCarthy gave Republicans may make it impossible to get a deal on the debt ceiling.
Is There a Better Way?
One possible solution is a legal loophole allowing the U.S. Treasury to mint platinum coins of any denomination. If the U.S. Treasury were to mint a $1 trillion coin and deposit it into its bank account at the Federal Reserve, the money could be used to pay for government programs or repay government bondholders. This could even be justified by appealing to Section 4 of the 14th Amendment to the U.S. Constitution: “The validity of the public debt of the United States … shall not be questioned.”
Few countries even have a debt ceiling. Other governments operate effectively without it. America could too. A debt ceiling is dysfunctional and periodically puts the U.S. economy in jeopardy because of political grandstanding.
The best solution would be to scrap the debt ceiling altogether. Congress already approved the spending and the tax laws that require more debt. Why should it also have to approve the additional borrowing?
It should be remembered that the original debt ceiling was put in place because Congress couldn’t meet quickly and approve needed spending to fight a war. In 1917 cross-country travel was by rail, requiring days to get to Washington. This made some sense then. Today, when Congress can vote online from home, this is no longer the case.
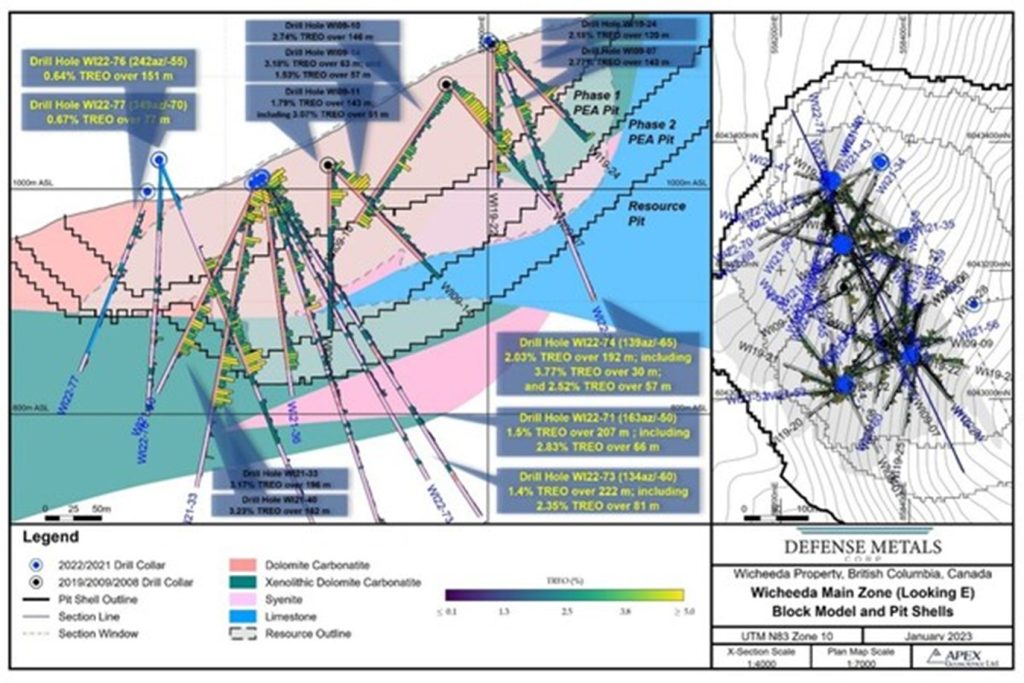
VANCOUVER, BC , Jan. 17, 2023 /PRNewswire/ – Defense Metals Corp. (“Defense Metals” or the “Company”) (TSXV: DEFN) (OTCQB: DFMTF) (FSE:35D) is pleased to announce Rare Earth Element (“REE”) assay results from an additional eight core drill holes, totalling 2,104 metres (“m”), completed during 2022 at its 100% owned Wicheeda REE Deposit. These assay results are from two exploration, three resource delineation, and three pit slope geotechnical core drill holes, one of which (hole WI22-73) returned the second longest REE-mineralized intercept of the 2021 and 2022 Wicheeda drilling campaigns (10,859 metres in 47 core holes).
Figure 1. Wicheeda REE Deposit Long Section Looking East (CNW Group/Defense Metals Corp.)
Pit slope geotechnical drill hole WI22-74 (-65o dip at azimuth 139o) drilled into the south pit wall intersected high-grade mineralized dolomite carbonatite that assayed 3.77% total rare earth oxide (“TREO”) over 30 metres (“m”) from surface and 2.52% TREO over 59 m at mid-hole depths, within a broader zone averaging 2.03% TREO over a 192 m interval (see Table 1 and Figure 1).
Resource delineation drill holes WI22-71 (-50o dip at 163o azimuth) and WI22-73 (-60o dip at azimuth 134o) drilled within the central area of the deposit similarly intersected mineralized dolomite-carbonatite, from surface, assaying 2.83% TREO over 66 m and 2.35% TREO over 81 m, respectively; within broader mineralized zones yielding 1.47% TREO over 207 m, and 1.42% TREO over 222 m, respectively (see Table 1 and Figure 1).
Resource delineation and pit slope geotechnical drill holes WI22-76 (-55o dip at 242o azimuth) and WI22-77 (-70o dip at 348o azimuth) returned moderate-grade, mixed syenite-xenolithic dolomite carbonatite intervals from the northern limit of the Wicheeda Deposit and north pit wall that assayed 0.64% TREO over 151 m; and 0.67% TREO over 76 m, respectively (see Table 1 and Figure 1).
Kristopher Raffle, P.Geo., Director of Defense Metals and a Qualified Person stated:
“We are excited to be nearing the release of our final drill results from a very successful year of drilling. It’s very telling that one of our geotechnical drill holes not only gave us important data about future open pit slope design, but also yielded one of the best drill intercepts of our 2021 and 2022 drill programs. Following the receipt of assays from our two remaining geotechnical drill holes, we will update the Wicheeda mineral resource based on more than 10,000 metres in the 47 drill holes Defense Metals has completed post-PEA. We firmly believe Wicheeda is one of the best rare earths projects globally and we eagerly look forward to advancing the project during 2023.”
High-wall pit slope geotechnical drill hole WI22-75 (-60o dip at 110o azimuth), collared 100 m east of the Wicheeda Deposit, and greenfield exploration drill holes WI22-65 (-60o dip at 140o azimuth) and WI22-66 (-60o dip at 140o azimuth), which targeted REE soil geochemical anomalies 500 m southwest and 1,000 m northwest of the Wicheeda Deposit, did not return significant REE mineralization.
1The true width of REE mineralization is estimated to be 70-100% of the drilled interval.
2TREO % sum of CeO2, La2O3, Nd2O3, Pr6O11, Sm2O3, Eu2O3, Gd2O3, Tb4O7, Dy2O3 and Ho2O3.
Geotechnical drill hole data collected will support future pre-feasibility level mine planning studies (see Defense Metals’ news release dated May 24, 2022). The 2022 Wicheeda REE Deposit resource delineation and pit slope geotechnical drill program comprised 18 core drill holes totalling 5,510 m (~18,077 feet). Assay results have been announced for a total of 16 holes to date, with results of the remaining two holes expected shortly.
About the Wicheeda REE Property
The 100% owned, 4,262-hectare (~10,532-acre) Wicheeda REE Property is located approximately 80 km northeast of the city of Prince George, British Columbia; population 77,000. The Wicheeda project is readily accessible by all-weather gravel roads and is near infrastructure, including power transmission lines, gas pipelines, the Canadian National Railway, and major highways.
The 2021 Wicheeda REE Project Preliminary Economic Assessment technical report (“PEA”) outlined a robust after-tax net present value (NPV@8%) of $517 million and an 18% IRR3. This PEA contemplated an open pit mining operation with a 1.75:1 (waste:mill feed) strip ratio providing a 1.8 Mtpa (“million tonnes per year”) mill throughput producing an average of 25,423 tonnes REO annually over a 16 year mine life. A Phase 1 initial pit strip ratio of 0.63:1 (waste:mill feed) would yield rapid access to higher grade surface mineralization in year 1 and payback of $440 million initial capital within 5 years.
3 Independent Preliminary Economic Assessment for the Wicheeda Rare Earth Element Project, British Columbia, Canada, dated January 6, 2022, with an effective date of November 7, 2021, and prepared by SRK Consulting (Canada) Inc. is filed under Defense Metals Corp.’s Issuer Profile on SEDAR (www.sedar.com).
Methodology and Quality Assurance/Quality Control
The analytical work reported on herein was performed by ALS Canada Ltd. (“ALS”) at their Langley (sample preparation) and Vancouver (ICP-MS fusion), B.C. facilities. ALS is an ISO-IEC 17025:2017 and ISO 9001:2015 accredited geoanalytical laboratory and is independent of the Defense Metals and the QP. Drill core samples were subject to crushing at a minimum of 70% passing 2 mm, followed by pulverizing of a 250-gram split to 85% passing 75 microns. A 0.1-gram sample pulp was then subject to multi-element ICP-MS analysis via lithium-borate fusion to determine individual REE content (ME-MS81h). Defense Metals follows industry standard procedures for the work carried out on the Wicheeda Project, with a quality assurance/quality control (“QA/QC”) program. Blank, duplicate, and standard samples were inserted into the sample sequence sent to the laboratory for analysis. Defense Metals detected no significant QA/QC issues during review of the data.
Qualified Person
The scientific and technical information contained in this news release as it relates to the Wicheeda REE Project has been reviewed and approved by Kristopher J. Raffle, P.Geo. (B.C.), Principal and Consultant of APEX Geoscience Ltd. of Edmonton, Alberta, who is a director of Defense Metals and a “Qualified Person” (“QP”) as defined in NI 43-101. Mr. Raffle has verified the data, which included a review of the sampling, analytical and test methods underlying the data, information and opinions disclosed herein.
About Defense Metals Corp.
Defense Metals Corp. is a company focused on the development of its 100% owned Wicheeda Rare Earth Element mineral deposit, located near Prince George, British Columbia, Canada, that contains metals and elements commonly used in in green energy, aerospace, automotive and defense technologies. Rare earth elements are especially important in the production of magnets used in wind turbines and in permanent magnet motors for electric vehicles. Defense Metals Corp. trades in Canada under the symbol “DEFN” on the TSX Venture Exchange, in the United States, under “DFMTF” on the OTCQB and in Germany on the Frankfurt Exchange under “35D”.
Neither the TSX Venture Exchange nor its Regulation Services Provider (as that term is defined in the policies of the TSX Venture Exchange) accepts responsibility for the adequacy or accuracy of this news release.
Cautionary Statement Regarding “Forward-Looking” Information
This news release contains “forward–looking information or statements” within the meaning of applicable securities laws, which may include, without limitation, statements relating to advancing the Wicheeda REE Project, drill results including anticipated timeline of such results/assays, the Company’s plans for its Wicheeda REE Project, expanded resource and scale of expanded resource, expected results and outcomes, plans to complete a PFS, the technical, financial and business prospects of the Company, its project and other matters. All statements in this news release, other than statements of historical facts, that address events or developments that the Company expects to occur, are forward-looking statements. Although the Company believes the expectations expressed in such forward-looking statements are based on reasonable assumptions, such statements are not guarantees of future performance and actual results may differ materially from those in the forward-looking statements. Such statements and information are based on numerous assumptions regarding present and future business strategies and the environment in which the Company will operate in the future, including the price of rare earth elements, the anticipated costs and expenditures, the ability to achieve its goals, that general business and economic conditions will not change in a material adverse manner, that financing will be available if and when needed and on reasonable terms. Such forward-looking information reflects the Company’s views with respect to future events and is subject to risks, uncertainties and assumptions, including the risks and uncertainties relating to the interpretation of exploration results, risks related to the inherent uncertainty of exploration and cost estimates, the potential for unexpected costs and expenses and those other risks filed under the Company’s profile on SEDAR at www.sedar.com. While such estimates and assumptions are considered reasonable by the management of the Company, they are inherently subject to significant business, economic, competitive and regulatory uncertainties and risks. Factors that could cause actual results to differ materially from those in forward looking statements include, but are not limited to, continued availability of capital and financing and general economic, market or business conditions, adverse weather and climate conditions, failure to maintain or obtain all necessary government permits, approvals and authorizations, failure to maintain community acceptance (including First Nations), risks relating to unanticipated operational difficulties (including failure of equipment or processes to operate in accordance with specifications or expectations, cost escalation, unavailability of personnel, materials and equipment, government action or delays in the receipt of government approvals, industrial disturbances or other job action, and unanticipated events related to health, safety and environmental matters), risks relating to inaccurate geological and engineering assumptions, decrease in the price of rare earth elements, the impact of Covid-19 or other viruses and diseases on the Company’s ability to operate, an inability to predict and counteract the effects of COVID-19 on the business of the Company, including but not limited to, the effects of COVID-19 on the price of commodities, capital market conditions, restriction on labour and international travel and supply chains, loss of key employees, consultants, or directors, increase in costs, delayed drilling results, litigation, and failure of counterparties to perform their contractual obligations. The Company does not undertake to update forward–looking statements or forward–looking information, except as required by law.
NEW ALBANY, Ohio, Jan. 17, 2023 (GLOBE NEWSWIRE) — CVG (NASDAQ: CVGI) announced today that Harold Bevis, President and Chief Executive Officer, and Andy Cheung, Executive Vice President and Chief Financial Officer, will present virtually at the Sidoti January Micro-Cap Virtual Conference on January 19, 2023, at 10:45 a.m. ET. A link to the webcast can be accessed through the investor section of the Company’s website at cvgrp.com. The presentation materials will be posted on the Company Website and be archived there for a period of 30 days.
Management will also meet virtually with investors registered for the conference.
At CVG, we deliver real solutions to complex design, engineering and manufacturing problems while creating positive change for our customers, industries, and communities we serve. Information about the Company and its products is available on the internet at www.cvgrp.com.
Investor Relations Contact: Ross Collins or Stephen Poe Alpha IR Group CVGI@alpha-ir.com
NEW YORK, NY / ACCESSWIRE / January 17, 2023 / Engine Gaming and Media, Inc. (“Engine” or the “Company”) (NASDAQ:GAME)(TSXV:GAME), a data-driven, gaming, media and influencer marketing platform company, today announced results for its fiscal first quarter 2023 ended November 30, 2022. All amounts are stated in U.S. dollars unless otherwise indicated.
Financial Highlights:
The Company announced the successful completion of its strategic process resulting in the signed merger agreement with GameSquare Esports, Inc
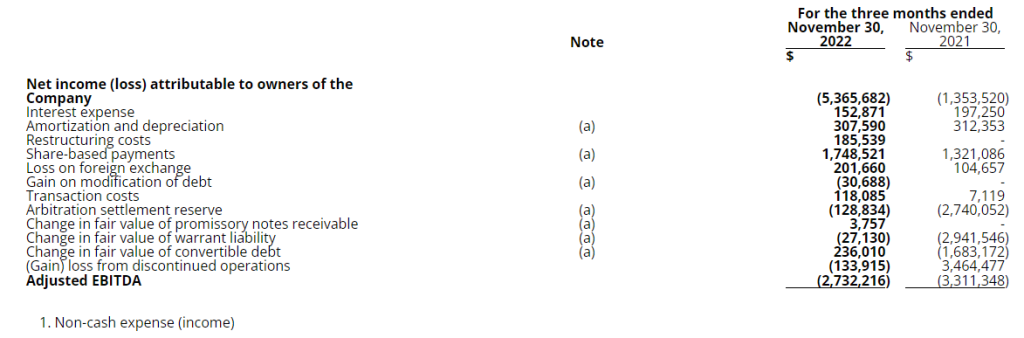
For the fiscal first quarter 2023 net loss improved significantly to $5.4 million, compared to $15.2 million in the fiscal fourth quarter 2022, an improvement of 65%
Significant improvement in Adjusted EBITDA of 32% to $(2.7) million in the first fiscal quarter 2023 sequentially compared to an Adjusted EBITDA of $(4.0) million in the fiscal fourth quarter 2022
The Company’s Influencer and Data Technology SaaS revenues increased 35% during the first fiscal quarter of 2023 compared to the first fiscal quarter of 2022
Management Commentary
“We are proud of the continued improvement we have made towards our near-term goal of achieving cash-flow breakeven. This quarter is highlighted by a 65% improvement in net loss of nearly $10 million and a 32% improvement in Adjusted EBITDA on a sequential basis to $(2.7) million, despite the restructuring charges related to discontinued operations said Lou Schwartz, Chief Executive Officer of Engine. “Despite some expected short-term headwinds in the advertising market, driven by Google algorithm changes, we continue to see heightened demand for our influencer and data technology SaaS services by our gaming and brand clients, which grew 35% YoY. We see this as a welcoming trend heading into our merger with GameSquare.”
Tom Rogers, Executive Chairman of the Company, commented on the recently announced merger with GameSquare, adding, “Our strengths speak to the heart of the thesis behind the GameSquare transaction. GameSquare brings content development, a publisher advertising network, and a gaming influencer network, which is complementary to our gaming content analytics technology, our programmatic advertising technology, and our influencer marketing and management technology. When the two companies’ assets are combined, these elements create an end-to-end solution for brands to reach their target audience. Moreover, the combined companies offering provides a highly scaled answer to reach younger demographics at a level sought by brands, which traditional media can no longer perform. In addition, digital advertising continues to be constrained by new privacy protection steps of the major tech players, which has inhibited efficient targeting of certain audiences particularly gaming audiences. Traditional media’s failings and digital advertising limitations create the setting for why the combined company provides a solution to both problems that is both differentiated and scalable.”
Fiscal First Quarter 2023 Financial Results
Total revenue in the fiscal first quarter of 2023 was $10.3 million, compared to revenue of $11.5 million in the fiscal fourth quarter of 2022. Overall Software-as-a-Service (SaaS) revenues were relatively flat due to the declines in legacy content management related SaaS revenues. However, gaming and influencer data and analytics SaaS revenues grew 34.6% YoY. The decrease in advertising revenues was primarily due to changes in Google discovery and algorithms which impacted audience traffic that is expected to gradually improve throughout the fiscal second quarter and fiscal third quarter of 2023.
Expenses in the fiscal first quarter were $15.8 million, an improvement of approximately $6.0 million, when compared to $21.8 million on a sequential basis.
Net Loss in the fiscal first quarter improved 64.7% to $5.4 million, compared to a net loss of $15.2 million in the fiscal fourth quarter of 2022 inclusive of the restructuring charges related to discontinued operations.
Adjusted EBITDA was $(2.7) million for the fiscal first quarter, an improvement of 32.5% when compared to $(4.0) million in the fiscal fourth quarter of 2022, and when compared to the same year-ago quarter Adjusted EBITDA improved 17.5%.
At November 30, 2022, the Company had cash of $6.9 million.
Recent Operational Highlights:
Successful completion of Strategic Process resulting in signed merger with GameSquare.
Stream Hatchet new and expanded client highlights for the quarter include XSET, Benefit Cosmetics, a16z, Immortal, Tencent and Epic.
Sideqik new and expanded client highlights for the quarter include PDP Gaming, AverMedia, Misfits Gaming and ASUS.
Frankly new and expanded client highlights for the quarter include Citadel Communications, Krol Communications, Beyond TV, Sports News Highlights, Palmetto Network, and BmovieNation.
FY Q1 2023 Earnings Conference Call
Management will host an investor conference call at 8:45 a.m. EDT (5:45 a.m. PDT) today, Tuesday, January 17, 2023, to discuss Engine Gaming and Media, Inc.’s fiscal first quarter 2023 financial results, provide a corporate update, and conclude with a Q&A from participants. To participate, please use the following information:
Please dial in at least 10 minutes before the start of the call to ensure timely participation.
Non-IFRS Measures
The Company reports earnings before interest, taxes, depreciation and amortization (“EBITDA”) and Adjusted EBITDA, which are not financial measures calculated and presented in accordance with International Financial Reporting Standards (“IFRS”) and therefore may not be comparable to similar measures presented by other issuers. EBITDA and Adjusted EBITDA should not be considered in isolation or as a substitute to net income (loss) or any other financial measures of performance or liquidity calculated and presented in accordance with IFRS. The Company defines Adjusted EBITDA as EBITDA, adjusted to exclude certain non-cash charges and other items that we do not believe are reflective of our ongoing operating results. The Company utilizes Adjusted EBITDA internally for purposes of forecasting, determining compensation, and assessing the performance of our business, therefore, we believe this measure provides useful supplemental information that may assist investors in assessing an investment in the Company.
The following unaudited table presents the reconciliation of net loss to Adjusted EBITDA for the three months ended November 30, 2022, and 2021, respectively.
About Engine Gaming and Media, Inc.
Engine Gaming and Media, Inc. (NASDAQ:GAME)(TSXV:GAME) provides unparalleled live streaming data and social analytics, influencer relationship management and monetization, and programmatic advertising to support the world’s largest video gaming companies, brand marketers, ecommerce companies, media publishers and agencies to drive new streams of revenue. The company’s subsidiaries include Stream Hatchet, the global leader in gaming video distribution analytics; Sideqik, a social influencer marketing discovery, analytics, and activation platform; and Frankly Media, a digital publishing platform used to create, distribute, and monetize content across all digital channels. Engine generates revenue through a combination of software-as-a-service subscription fees, managed services, and programmatic advertising. For more information, please visit www.enginegaming.com.
Cautionary Statement on Forward-Looking Information
This news release contains forward-looking statements. Forward-looking statements involve known and unknown risks, uncertainties and other factors which may cause the actual results, performance or achievements of Engine to be materially different from any future results, performance or achievements expressed or implied by the forward-looking statements. Often, but not always, forward-looking statements can be identified by the use of words such as “plans”, “expects” or “does not expect”, “is expected”, “estimates”, “intends”, “anticipates” or “does not anticipate”, or “believes”, or variations of such words and phrases or state that certain actions, events or results “may”, “could”, “would”, “might” or “will” be taken, occur or be achieved. In respect of the forward-looking information contained herein, Engine has provided such statements and information in reliance on certain assumptions that management believed to be reasonable at the time. Forward-looking information involves known and unknown risks, uncertainties and other factors which may cause the actual results, performance or achievements stated herein to be materially different from any future results, performance or achievements expressed or implied by the forward-looking information. Actual results could differ materially from those currently anticipated due to a number of factors and risks. Accordingly, readers should not place undue reliance on forward-looking information contained in this news release.
The forward-looking statements contained in this news release are made as of the date of this release and, accordingly, are subject to change after such date. Engine does not assume any obligation to update or revise any forward-looking statements, whether written or oral, that may be made from time to time by us or on our behalf, except as required by applicable law.
Neither the TSX Venture Exchange nor its Regulation Services Provider (as that term is defined in policies of the TSX Venture Exchange) accepts responsibility for the adequacy or accuracy of this release.
Company Contact:
Lou Schwartz 647-725-7765
Investor Relations Contact:
Shannon Devine Z North America Main: 203-741-8811 GAME@mzgroup.us
VIRGINIA CITY, NEVADA, January 17, 2023 – Comstock Inc. (NYSE: LODE) (“Comstock” or the “Company”) is pleased to announce that Mr. Corrado De Gasperis, Executive Chairman and CEO, and Mr. Michael Norred, Director of Strategic Resource Planning and Development, will attend and present at the 2023 Vancouver Resource Investment Conference (VRIC). The VRIC is the world’s largest resource investment conference dedicated to resource exploration and development. The VRIC is January 29 & 30, 2023 at the Vancouver Convention Centre West, in Vancouver, Canada.
Mr. De Gasperis will provide a company update during the live presentation, including the recently completed consolidation of its properties in the historic Comstock and Silver City mining districts, increasing the Company’s total owned, published mineral resources to include Measured and Indicated resources containing 605,000 ounces of gold and 5,880,000 ounces of silver, plus additional Inferred resources containing 297,000 ounces of gold and 2,572,000 ounces of silver. Mr. De Gasperis will also be joined by Mr. Deep Prasad, CEO of Quantum Generative Materials LLC (“GenMat”), Comstock’s strategic investee and mineral resource discovery and development partner.
GenMat is accelerating the commercialization of disruptive, AI generated materials with the help of quantum-probabilistic software solutions that integrate specific, proprietary, hyperspectral technology solutions that (a) increase certainty in mineral discovery targets, (b) reduce costs of traditional drill programs, with ground penetrating scans and analytics, and (c) increase discernment for categorizing measured, indicated, and inferred mineral resources.
They are also scheduled to participate in one-on-one meetings with registered conference investors. Registration for these meetings is restricted to qualified investors, portfolio managers, and private wealth and family office managers. If you would like to attend the conference, please Click Here.
Comstock now owns or controls twelve square miles of patented mining claims, unpatented mining claims, and surface parcels, covering six and a half miles of strike length along the Comstock and Silver City lodes. The properties span from midway through Virginia City down to US HWY 50 in the south.
The Company recently announced the publication of the initial technical report for the Dayton resource. Behre Dolbear authored the independent, initial assessment of the Dayton mineral resources, as of November 1, 2022, compliant with current SEC S-K 1300 guidelines. The full report is available on the Company’s website, at www.comstock.inc/investors.
About Comstock
Comstock (NYSE: LODE) innovates technologies that contribute to global decarbonization and circularity by efficiently converting under-utilized natural resources into renewable fuels and electrification products that contribute to balancing global uses and emissions of carbon and through the deployment of more advanced mineral and material discovery technologies. To learn more, please visit www.comstock.inc.
About GenMat
GenMat enables customer solutions that generate high quality artificial intelligence (AI) data sets customized to their specific business needs and apply state-of-the-art AI models to learn from this data. GenMat’s GENMAT-1 satellite, targeted for low earth orbit launch on the SpaceX Falcon in June 2023, represents one of the most powerful hyperspectral systems to be launched into space, several times more powerful than NASA’s Earth Observing-1 satellite and enables customers to extract commercially relevant chemical and physical information for high-precision mineral prospecting and site-specific discovery.
Forward-Looking Statements
This press release and any related calls or discussions may include forward-looking statements within the meaning of Section 27A of the Securities Act of 1933, as amended, and Section 21E of the Securities Exchange Act of 1934, as amended. All statements, other than statements of historical facts, are forward-looking statements. The words “believe,” “expect,” “anticipate,” “estimate,” “project,” “plan,” “should,” “intend,” “may,” “will,” “would,” “potential” and similar expressions identify forward-looking statements but are not the exclusive means of doing so. Forward-looking statements include statements about matters such as: future industry market conditions; future explorations or acquisitions; future changes in our exploration activities; future prices and sales of, and demand for, our products; land entitlements and uses; permits; production capacity and operations; operating and overhead costs; future capital expenditures and their impact on us; operational and management changes (including changes in the Board of Directors); changes in business strategies, planning and tactics; future employment and contributions of personnel, including consultants; future land sales; investments, acquisitions, joint ventures, strategic alliances, business combinations, operational, tax, financial and restructuring initiatives, including the nature, timing and accounting for restructuring charges, derivative assets and liabilities and the impact thereof; contingencies; litigation, administrative or arbitration proceedings; environmental compliance and changes in the regulatory environment; offerings, limitations on sales or offering of equity or debt securities, including asset sales and associated costs; and future working capital, costs, revenues, business opportunities, debt levels, cash flows, margins, taxes, earnings and growth. These statements are based on assumptions and assessments made by our management considering their experience and their perception of historical and current trends, current conditions, possible future developments, and other factors they believe to be appropriate. Forward-looking statements are not guarantees, representations or warranties and are subject to risks and uncertainties, many of which are unforeseeable and beyond our control and could cause actual results, developments, and business decisions to differ materially from those contemplated by such forward-looking statements. Some of those risks and uncertainties include the risk factors set forth in our filings with the SEC and the following: adverse effects of climate changes or natural disasters; adverse effects of global or regional pandemic disease spread or other crises; global economic and capital market uncertainties; the speculative nature of gold or mineral exploration, and lithium, nickel and cobalt recycling, including risks of diminishing quantities or grades of qualified resources; metal recycling, processing or mining activities; costs, hazards and uncertainties associated with precious metal based activities, including environmentally friendly and economically enhancing clean mining and processing technologies, precious metal exploration, resource development, economic feasibility assessment and cash generating mineral production; costs, hazards and uncertainties associated with metal recycling, processing or mining activities; contests over our title to properties; potential dilution to our stockholders from our stock issuances, recapitalization and balance sheet restructuring activities; potential inability to comply with applicable government regulations or law; adoption of or changes in legislation or regulations adversely affecting our businesses; permitting constraints or delays; ability to achieve the benefits of business opportunities that may be presented to, or pursued by, us, including those involving battery technology, quantum computing and advanced materials development, and development of cellulosic technology in bio-fuels and related carbon-based material production; ability to successfully identify, finance, complete and integrate acquisitions, joint ventures, strategic alliances, business combinations, asset sales, and investments that we may be party to in the future; changes in the United States or other monetary or fiscal policies or regulations; interruptions in our production capabilities due to capital constraints; equipment failures; fluctuation of prices for gold or certain other commodities (such as silver, zinc, lithium, nickel, cobalt, cyanide, water, diesel, gasoline and alternative fuels and electricity); changes in generally accepted accounting principles; adverse effects of war, mass shooting, terrorism and geopolitical events; potential inability to implement our business strategies; potential inability to grow revenues; potential inability to attract and retain key personnel; interruptions in delivery of critical supplies, equipment and raw materials due to credit or other limitations imposed by vendors; assertion of claims, lawsuits and proceedings against us; potential inability to satisfy debt and lease obligations; potential inability to maintain an effective system of internal controls over financial reporting; potential inability or failure to timely file periodic reports with the Securities and Exchange Commission; potential inability to list our securities on any securities exchange or market or maintain the listing of our securities; and work stoppages or other labor difficulties. Occurrence of such events or circumstances could have a material adverse effect on our business, financial condition, results of operations or cash flows, or the market price of our securities. All subsequent written and oral forward-looking statements by or attributable to us or persons acting on our behalf are expressly qualified in their entirety by these factors. Except as may be required by securities or other law, we undertake no obligation to publicly update or revise any forward-looking statements, whether because of new information, future events, or otherwise.
Neither this press release nor any related calls or discussions constitutes an offer to sell, the solicitation of an offer to buy or a recommendation with respect to any securities of the Company, the fund, or any other issuer.
Contact information:
Comstock Inc. P.O. Box 1118 Virginia City, NV 89440 www.comstock.inc
Corrado De Gasperis Executive Chairman & CEO Tel (775) 847-4755 degasperis@comstockinc.com
Zach Spencer Director of External Relations Tel (775) 847-5272 Ext.151 questions@comstockinc.com
TULSA, Okla.–(BUSINESS WIRE)– Alliance Resource Partners, L.P. (NASDAQ: ARLP) will report its fourth quarter 2022 financial results before the market opens on Monday, January 30, 2023. Alliance management will discuss these results during a conference call beginning at 10:00 a.m. Eastern that same day.
To participate in the conference call, dial (877) 407-0784 and request to be connected to the Alliance Resource Partners, L.P. earnings conference call. International callers should dial (201) 689-8560 and request to be connected to the same call. Investors may also listen to the call via the “investor relations” section of ARLP’s website at http://www.arlp.com.
An audio replay of the conference call will be available for approximately one week. To access the audio replay, dial U.S. Toll Free (844) 512-2921; International Toll (412) 317-6671 and request to be connected to replay using access code 13735338.
About Alliance Resource Partners, L.P.
ARLP is a diversified energy company that is currently the second largest coal producer in the eastern United States. ARLP also generates operating and royalty income from mineral interests it owns in strategic coal and oil & gas producing regions in the United States. In addition, ARLP is positioning itself as an energy provider for the future by leveraging its core technology and operating competencies to make strategic investments in the fast-growing energy and infrastructure transition.
News, unit prices and additional information about ARLP, including filings with the Securities and Exchange Commission (“SEC”), are available at http://www.arlp.com. For more information, contact the investor relations department of ARLP at (918) 295-7674 or via e-mail at investorrelations@arlp.com.
Brian L. Cantrell Alliance Resource Partners, L.P. (918) 295-7673
TORONTO–(BUSINESS WIRE)– Sierra Metals Inc. (TSX: SMT) (“Sierra Metals” or the “Company”) announced today the departure of Mr. Ed Guimaraes, the Chief Financial Officer (“CFO”) of the Company, and the appointment of Mr. José Fernández-Baca as Interim CFO.
Mr. Oscar Cabrera, Chair of the Board of Sierra Metals stated, “The Sierra Metals Board of Directors is pleased that Mr. Fernandez-Baca has agreed to serve as the Company’s Interim CFO. His extensive experience in financial leadership positions in the mining industry, including with Sierra Metals since 2020, gives him the skills, experience and business relationships to lead the Company’s financial management and reporting during the on-going strategic review process”.
Mr. Fernandez-Baca has a degree in Economics from the Universidad del Pacifico, Lima-Peru, and an MBA from Northern Illinois University. He also has advanced executive program certifications from Northwestern, INCAE, Cambridge, and the Universidad de Piura, among others.
About Sierra Metals
Sierra Metals is a diversified Canadian mining company with Green Metal exposure including copper production and base metal production with precious metals byproduct credits, focused on the production and development of its Yauricocha Mine in Peru, and Bolivar and Cusi Mines in Mexico. The Company is focused on increasing production volume and growing mineral resources. The Company also has large land packages at all three mines with several prospective regional targets providing longer-term exploration upside and mineral resource growth potential. For further information regarding Sierra Metals, please visit www.sierrametals.com.
We saved you the trip! Last month, Noble Capital Markets’ equity analysts and investment bankers attended the most important healthcare investment symposium in the industry which connects global industry leaders, emerging fast-growth companies, innovative technology creators and members of the investment community. They attended meetings, networking events and interviewed c-suite executives. They shared their collective takeaways and interviewed a selection of the company executives during this virtual event presented by Channelchek. The next best thing to being there! Watch the replays below:
Noble Capital Markets Equity Analysts Robert LeBoyer and Greg Aurand provide their takeaways from the conference along with some industry outlook for 2023 and beyond.
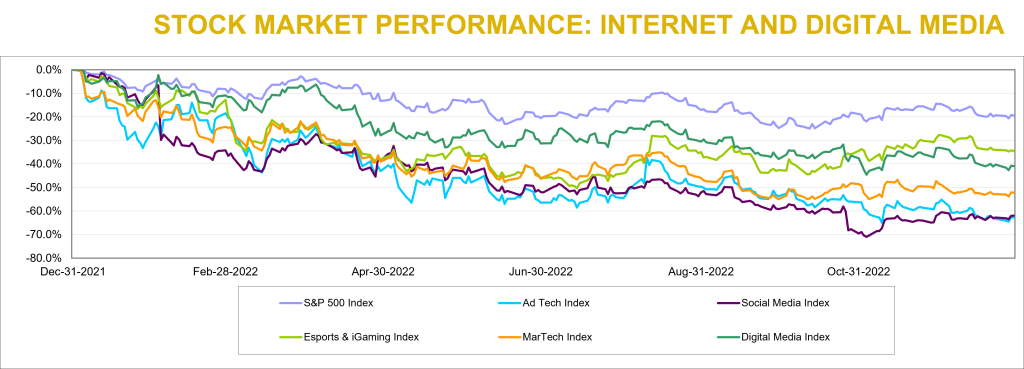
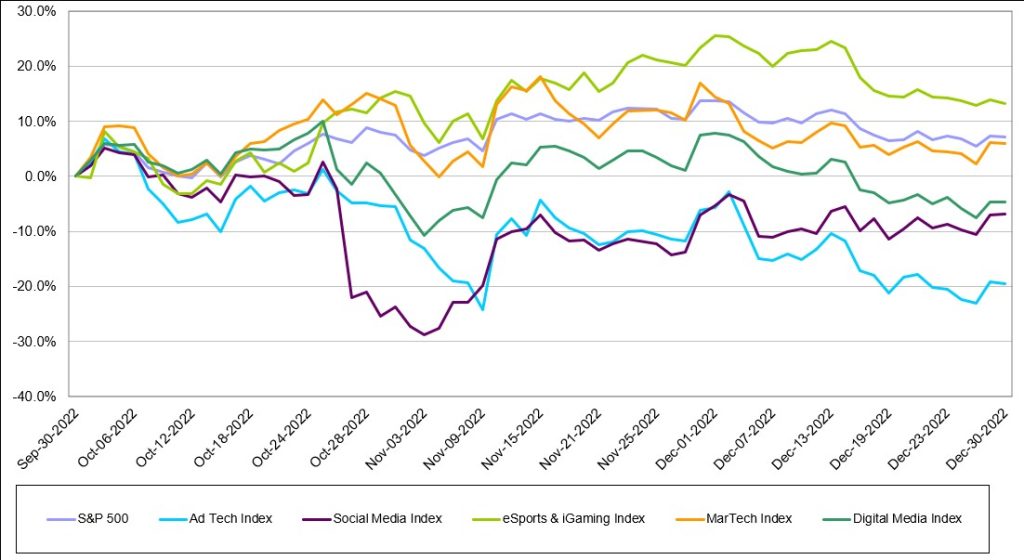
The S&P 500 increased by 7% during the fourth quarter of 2022, marking the first time the Index had increased since fourth quarter of 2021. We also saw signs of life in two of Noble’s Internet and Digital Media Indices: Noble’s eSports and iGaming Index increased (+13%) and outperformed the broader market (which we define as the S&P 500) while Noble’s MarTech Index also increased (+6%), roughly in-line with the market. This marked the second quarter in a row in which the eSports and iGaming Index not only increased but significantly outperformed the broader market, following several quarters of underperformance. Laggards during the fourth quarter were Noble’s Digital Media Index (-5%), Social Media Index (-7%) and Ad Tech Index (-20%).
Noble Indices are market cap weighted, and we attribute the relative strength of the eSports and iGaming Index to its largest constituent, Flutter Entertainment (ISE: FLTR). Flutter shares finished the year at $127.80, down only 8% from the start of the year, despite trading as low as $76 per share in mid-July. Investors appear to appreciate Flutter’s FanDuel business and its market leading position and competitive advantage, something that Flutter management highlighted during a November Investor Day. Management also laid out a case to increase U.S. revenues by 5x and achieve margins of 25%-30% implying EBITDA of up to $5 billion in 8 years-time, quadruple its levels today. Despite the overall strength of the eSports and iGaming Index, share price gains within the sector were not widely dispersed. Only 3 of the 16 stocks in eSports and iGaming sector finished the quarter up, including Engine Gaming and Media (GAME, +71%) and SportRadar Group (SRAD; +13%).
Noble’s MarTech Index increased by 6% with 11 of the 22 stocks in the index posting gains, led by Yext (YEXT; +46%), Shopify (SHOP; +29%), LiveRamp (RAMP; +29%) and Adobe (ADBE; +22%). This marks significant improvement from last quarter when only 4 of the sectors’ stocks finished the quarter in positive territory. MarTech stocks have suffered from a market resetting of revenue multiples which began when the Fed began raising rates. MarTech share price declines in the first, second and third quarters of 2022 were mostly driven by multiple compression as investors rotated out of high-flying tech sectors where companies had chased growth at all costs (at the expense of profitability). Only 7 of the MarTech companies in the Index posted positive EBITDA in the latest quarter.
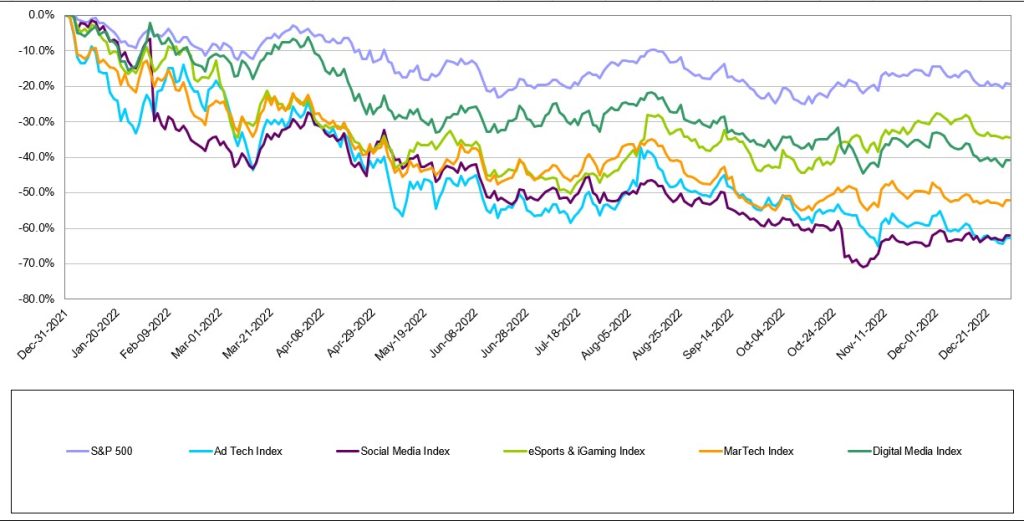
2022 – A Year That Internet and Digital Media Investors Would Like to Forget
While there were signs of life in the fourth quarter of 2022 for the Internet and Digital Media sectors, 2022 was a year most investors in these sectors would like to forget. Every one of these sectors substantially underperformed the S&P 500 last year. The S&P 500 Index finished the year down 19% which was substantially better than Noble’s eSports and iGaming Index (-35%), Digital Media Index (-41%), MarTech Index (-52%), Social Media Index (-63%), and Ad Tech Index (-63%). Rather than focus on the stocks that significantly underperformed their respective Indices (and there are many), we would rather focus on the three stocks that finished 2022 up for the year.
Harte Hanks (HHS) – Shares of Harte Hanks increased by 53% in 2022, which continued its multi-year turnaround from a highly levered and unprofitable business (in 2019), to a double-digit EBITDA margin business with a debt-free balance sheet (in 2022).
Tencent (TME) – Shares of Tencent increased by 21% in 2022. Shares declined earlier in the year as China’s economy slowed as it maintained its Zero Covid-19 lockdown, but surged in the fourth quarter as it appeared that the company would enjoy an increase in demand as China begins easing Covid restrictions.
Perion Networks (PERI) – Perion shares increased by 5% in 2022 as Perion consistently beat expectations and raised its guidance throughout 2022. In the first week of 2023, the company once again pre-announced better than expected results for the fourth quarter, and shares are already up 18% since the start of the new year.
2022 M&A – A Tale of Two Halves
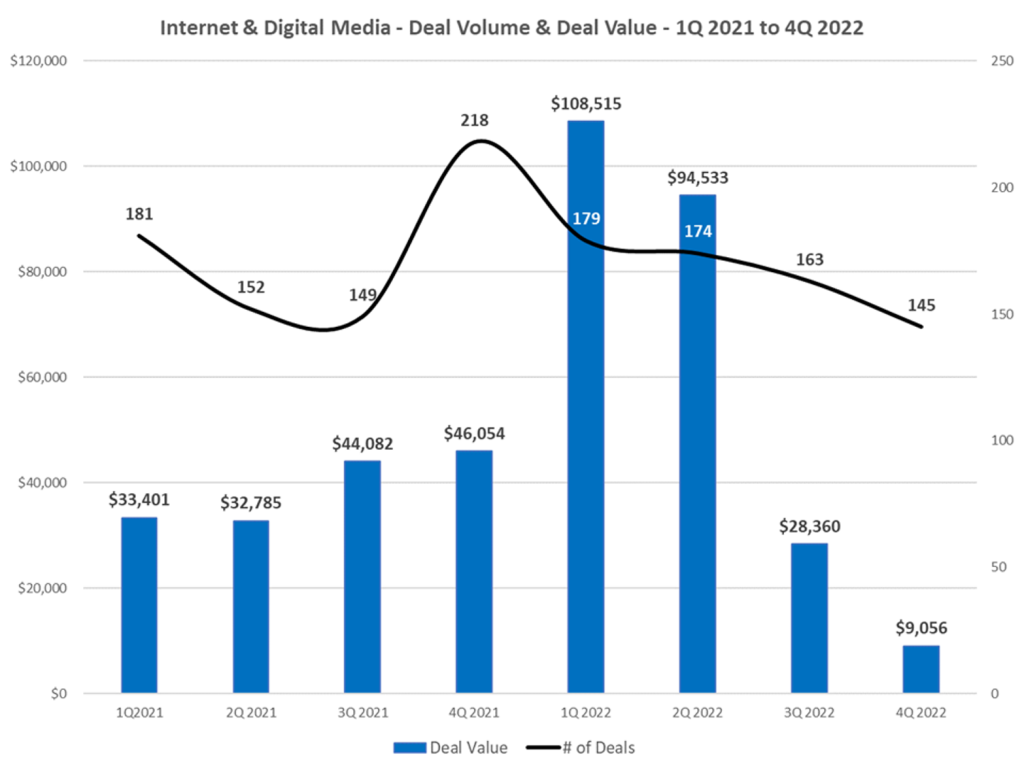
When we look back at last year from an M&A perspective, we can say that 2022 was another year of robust M&A activity. The total number of deals increased by just under 2%, as we tracked 667 deals in 2022 compared to 657 deals in 2021. Deal values were up a robust 71% in 2022 to $241 billion, up from $141 billion in 2021. The fact that deal value was so significantly higher happened despite the fact that there were far fewer deals where the transaction value was disclosed in 2022 compared to 2021. In 2022, there were 184 deals where the purchase price was disclosed, significantly lower than the 264 deals where the purchase price was disclosed in 2021.
2022 – A Year of Mega Deals
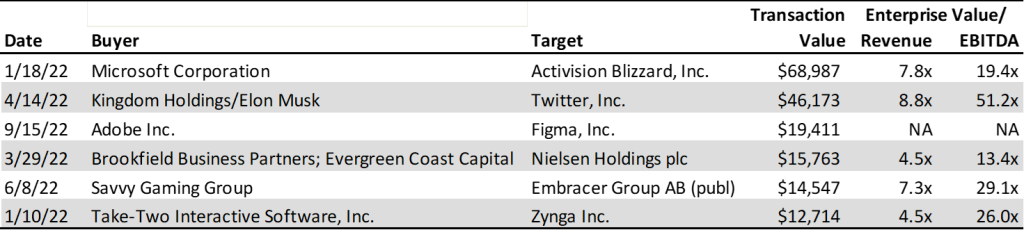
The biggest difference between 2022 and 2021 was two “mega” deals that were announced in 2022: Microsoft’s $69 billion announced acquisition of Activision Blizzard (which the Federal Trade Commission is seeking to block) and Elon Musk/Kingdom Holding’s $46 billion acquisition of Twitter. In fact, there were six transactions in 2022 that exceeded $10 billion in deal value, while there were only 2 such deals in 2021. Five of the 6 largest transactions of 2022 took place in the first half of the year. Half the largest M&A deals in 2022 were in the video or mobile gaming sector.
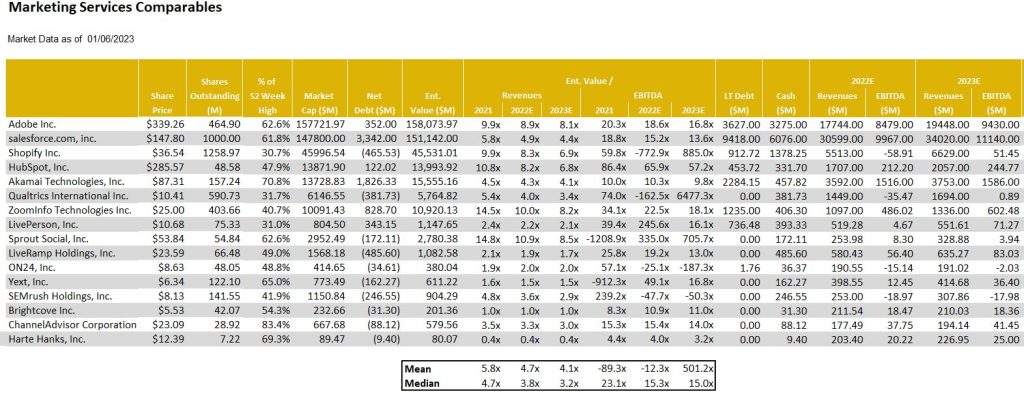
Only Adobe’s $19 billion announced acquisition of Figma took place in the second half of the year, which is not surprising given that the cost of financing M&A transactions using debt increased by approximately 300 basis points as the Fed continued to raise rates to fight inflation. Given the higher cost of financing deals, in 2023 we are not likely to see as many mega deals particularly at the relatively elevated EBITDA multiples shown above.
4Q 2022 M&A: A Chink in the Armor – M&A Activity and Deal Values Slide
Through the first three quarters of the year in 2022, we noted how well M&A had held up despite public equity market declines, Fed rate hikes, elevated inflation, contractionary monetary policy and geopolitical conflict. While the M&A market stayed resilient throughout most of 2022, it is clear that we began to see some “chinks in the armor” in 4Q 2022. We are not surprised by this relative weakness given the economic uncertainty and an inability to accurately forecast revenue and earnings trends for both acquirors and target companies alike.
Deal making in the fourth quarter of 2022 slowed both from a deal volume and deal value perspective. The total number of deals we tracked in the Internet and Digital Media space fell by 17% to 145 deals in 4Q 2022 compared to 174 deals in 4Q 2021. On a sequential basis, the total number of deals fell by 14% to 143 deals compared to 167 deals in 3Q 2022.
The biggest change was in deal value, where the total dollar value of deals fell by 70% to $9.1 billion in 4Q 2022 compared to $30.1 billion in 4Q 2021. On a sequential basis, deal value fell by 69% in 4Q 2022 from $29.1 billion in deal value in 3Q 2022.
The tale of two halves is best represented by the chart below.
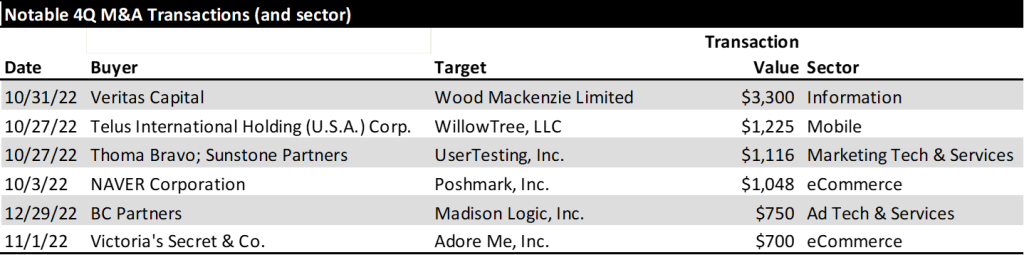
From a deal volume perspective, the most active sectors we tracked were Digital Content (40 deals), Marketing Tech (36 deals), Agency & Analytics (32 deals) and Information Services (12 deals). From a deal value perspective, the Information Services sector had the largest dollar value of transactions ($3.3 billion), followed by eCommerce ($1.7 billion), Mar Tech ($1.2 billion), and Mobile ($1.2 billion).
During the fourth quarter there were a dozen announced deals in the video gaming sector, but the sector did not register as a top sector based on deal value. In fact, only 2 of the 12 deals that were announced included the purchase price: Churchill Down’s $250 million acquisition of horse racing game provider Exacta Systems and Playstudios’ $97 million acquisition of mobile game developer Branium Studios. The largest deals in the quarter by dollar value are shown below.
Digital Advertising
Digital Advertising Outlook for 2023
Last October eMarketer revised lower its 2023 U.S. digital advertising forecast by $5.5 billion, from $284.1 billion to $278.6 billion. While this sounds like a substantial drop, in percentage terms they lowered their 2023 forecast by only 2 percentage points, from 14% growth to 12% growth. Most of the global ad agencies expect digital to continue to grow by double digits driven by dollars migrating to such digital ad channels as retail media and connected TV. Both sectors continue to demonstrate impressive growth.
Retail Media – A retail media network is a retailer-owned advertising service that allows marketers to purchase advertising space across all digital assets owned by a retail business, using the retailer’s first-party data to connect with shoppers throughout their buying journey. eMarketer forecasts that retail media ad spending in the U.S. grew by 31% last year to $41 billion and will grow to $61 billion over the next two years, by which time it will equate to 20% of all digital advertising. The leaders in retail media are Amazon, Walmart and Instacart.
Through a retail media network, partners (advertisers) get direct access to a retailer’s customers. The benefit to the partners/advertisers is that they get access to first party data. Retailers own and store this data and allow advertisers to access them through their retail media programs. The first party data is valuable because it is collected at the point of sale allowing brands to get better insights into purchase behavior. Traditional retailers are beginning to follow suit. Traditional retailers with the largest digital audiences (per comScore) are Walmart, Target, Home Depot, Lowes, CVS, Walgreens, Costco and Kohls.
On January 10th, Microsoft announced that it intended to create the industry’s most complete omnichannel retail media technology stack supported by its Promote IQ platform, a company Microsoft acquired in 2019. We expect companies that serve the retail media sector from an Ad Tech or Mar Tech standpoint are poised to benefit from secular trends in this sector.
Connected TV (CTV) – Last July, Nielsen announced that for the first time U.S. streaming TV viewership was larger than cable TV viewing. In July 2022, eMarketer forecast that CTV advertising would reach $18.9 billion in 2022. However, in October 2022,
eMarketer raised its forecast for CTV advertising by $2.3 billion to $21.2 billion in 2022. In October, the forecaster also raised its 2023 CTV advertising forecast by $3 billion to $26.9 billion, up from $23.9 billion in the July 2022 forecast. The big increase is due primarily to Netflix and Disney+ announcing they were launching ad supported tiers to their streaming offerings.
The ability to target specific audiences and measure specific outcomes tied to the ads that viewers watched has made CTV a force to be reckoned with, particularly for those advertisers that are never quite sure which of their advertising mediums provide the highest returns. Historically, TV was a mass medium used by large brands that wanted massive reach. CTV has opened the door to a wider variety of advertisers that are looking to reach more targeted, even niche, audiences. According to MNTN, a connected TV performance marketing platform, many CTV advertisers are first-time TV advertisers. With new FAST (Free Ad-Supported Streaming TV) channels coming online every month, there is no shortage of supply coming to market. This is just one reason why eMarketer predicts CTV advertising to grow by $10+ billion over the next two years and reach nearly $32 billion in advertising revenue in 2024. Ad Tech or Mar Tech companies that serve this market are also poised to benefit from secular viewing trends and the advertising dollars that are migrating to these platforms.
TRADITIONAL MEDIA COMMENTARY
The following is an excerpt from a recent note by Noble’s Media Equity Research Analyst Michael Kupinski
Overview – Will It Be A Happy New Year?
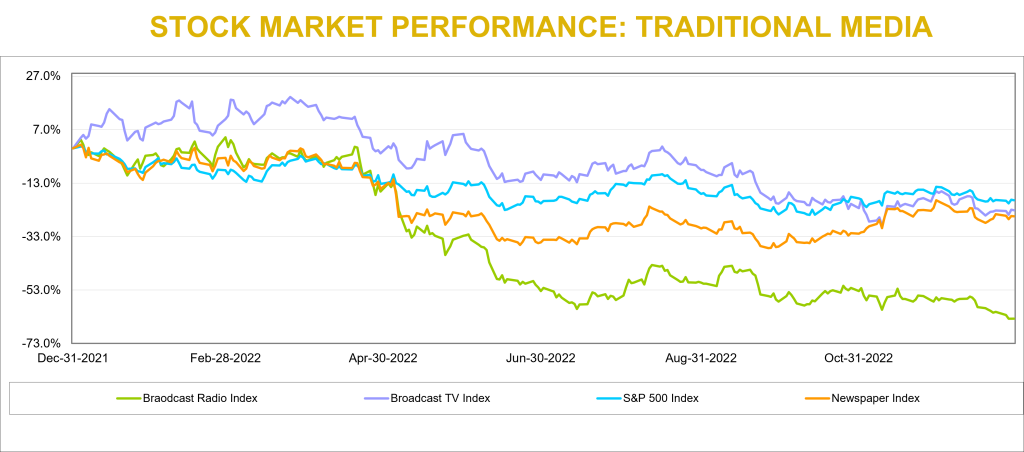
2022 was one of the worst for media stock performance in recent memory, with stocks across traditional and digital media sectors down over 40% or more. Media stocks underperformed the general market, as measured by the S&P 500 Index, which was down a more moderate 19% on a comparable basis for the full year 2022. It is typical for media stocks to underperform in a late-stage economic cycle or in the midst of an economic downturn, but the significant stock declines are stunning. Macro-economic issues including inflation, rising interest rates, and the prospect of a looming economic downturn all contributed to the poor performance.
The question is “will 2023 be better?” We believe so. There has been recent signs of life. The S&P 500 increased by 7% during the fourth quarter of 2022, marking the first time the Index had increased since fourth quarter of 2021. Notably, the Noble Publishing Index outperformed the general market in the latest quarter. However, the full impact of the recent interest rate increase likely have not been reflected in the economy. Many media stocks seem to anticipate an economic downturn, but current fundamentals do not appear to be in a freefall and may be better than expected. If the economy further deteriorates from the recent or future rate hikes, it appears now that it may adversely affect the second half of 2023. Advertising pacings appear to be holding up well so far in the first half 2023. Notably, media stocks may begin to anticipate an improving economic outlook and overlook the weak fundamental environment in the second half.
Conventional thought anticipates that increasing concerns over an economic recession may prompt mortgage rates to trend lower in 2023. Furthermore, it is possible that the Fed may lower interest rates if inflation moderates, although the Fed is not currently anticipating rate decreases in 2023. Nonetheless, this paints a favorable picture for media stocks in 2023. Traditionally, the best time to buy media stocks is in the midst of an economic downturn. In addition, these consumer cyclical stocks tend to be among the first movers in an early-stage economic cycle and tend to perform well in a moderating interest rate environment. As mentioned earlier, the stocks may currently be oversold given the prospect that the current fundamental environment is better than anticipated.
What is the risk to this favorable outlook? We believe that the resurging Chinese economy may be disruptive. Within the last month, China’s economy has been reopened from Covid lockdowns, which may put pressure on global energy prices. Such a prospect may make the Fed’s fight on inflation more stubborn to combat, potentially throwing off our favorable outlook for moderating interest rates. Given the prospect that these stocks tend to outperform the market in an early-stage economic recovery, we believe it is time for investors to accumulate positions in the media sectors.
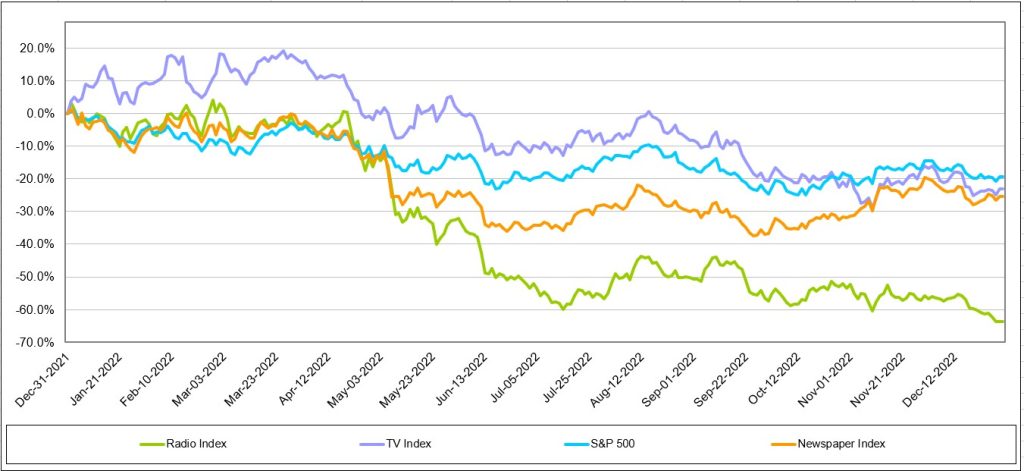
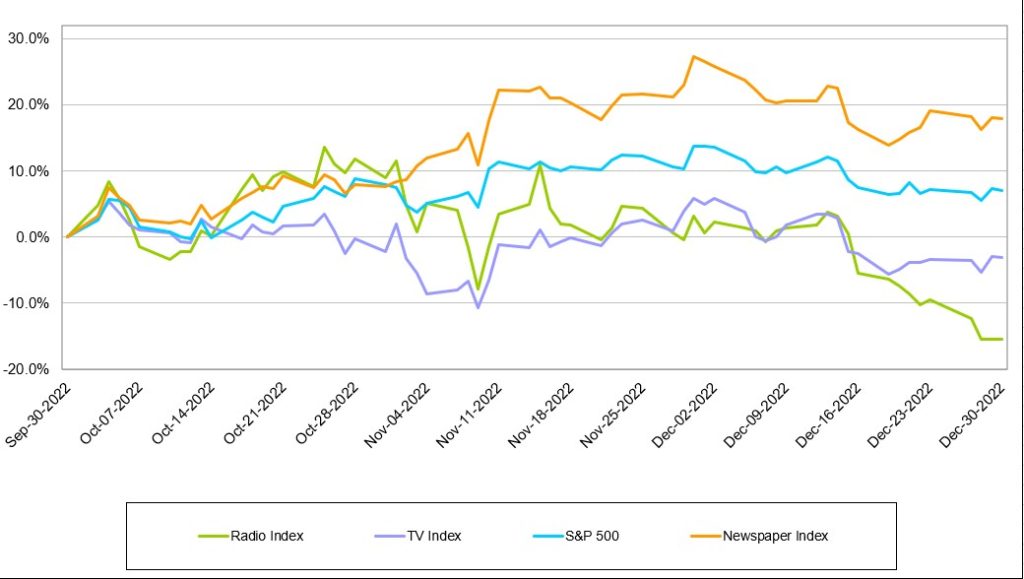
Traditional Media – Another Quarter of Moderating Stock Performance
Traditional media stocks underperformed the general market in 2022, with the Radio sector the hardest hit. The Noble Radio Index declined 64% versus 19% for the general market, as measured by the S&P 500, in a comparable time period. Television and Publishing stocks were down 23% and 25%, respectively, more in line with the general market returns. But there were notable company stock performance disparities within each sector, highlighted later in this report. Larger market capitalized companies performed better, which skewed the market cap weighted Indices.
Traditional media stocks seemed to have stabilized from the rapid declines in early 2022. The Publishing sector once again outperformed the general market in the quarter. Noble’s Television Index declined 3%, but this decline moderated from the 10% decline in the third quarter. The Radio industry still has not yet stabilized, with the Noble Radio Index down 15% in the latest quarter.
Broadcast Television
Will Netflix suck the air out of the room?
Netflix launched a new pricing plan on November 3rd which offers a basic tier with advertising at a low price point of $6.99. This compares with its previous tiers of $9.99 and $19.99 for advertising-free streaming. While reports indicate that the advertising platform is off to a slow start, we believe that the Netflix move could be disruptive to the broadcast television network business as its lower price basic service gains traction. It is likely that there will be some cannibalization from its higher pricing tier, but we believe that the move will broaden its subscriber base. While Netflix has not considered offering live sports on its streaming platform given the cost of sports rights, we believe that the potential success of its subscription/advertising tier may provide a platform to upend that decision. There is a strong tailwind for viewership trends on streaming platforms, which now exceed that of broadcast television viewing. A decision to enter sports will be a big deal and disruptive to network broadcasting.
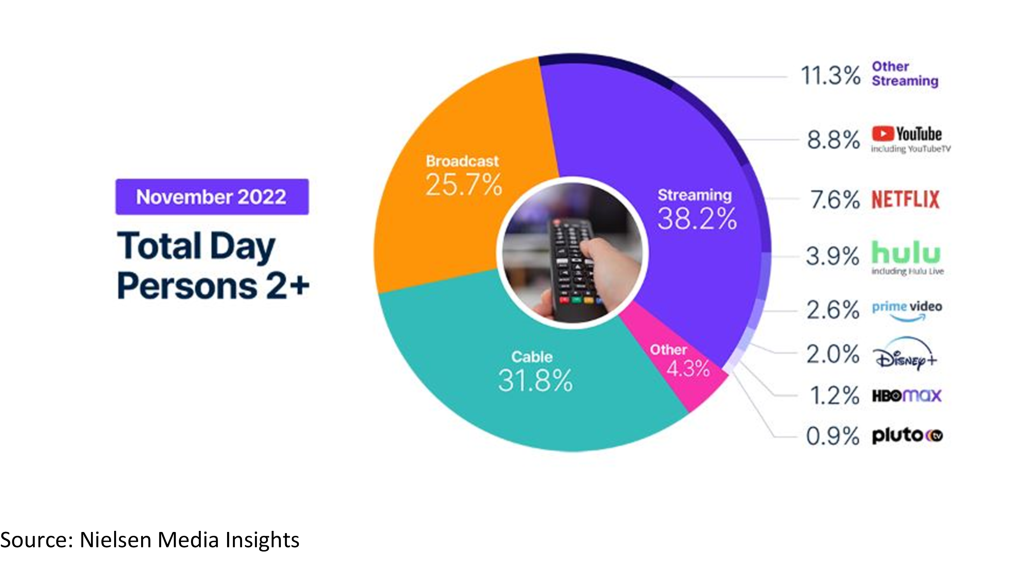
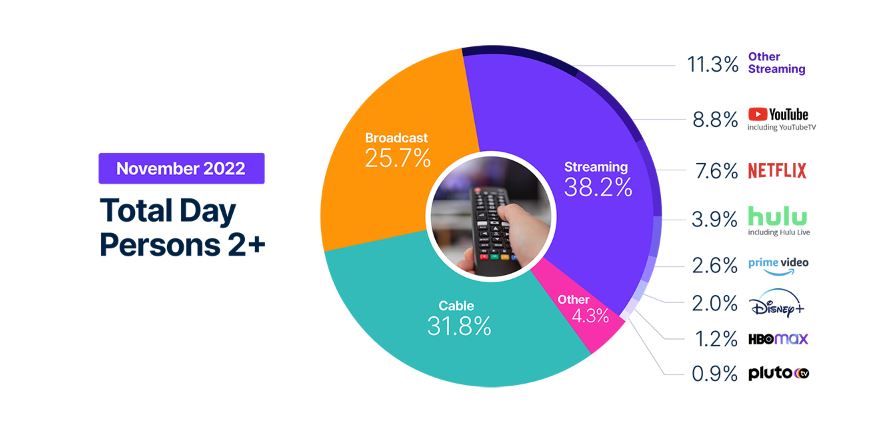
Streaming viewership not only eclipsed television viewing in July 2022, but also that of cable viewing, 34.8% versus 34.4%. In addition, based on the latest Nielsen data from November 2022, streaming now accounts for 38.2% of total viewing with Broadcast at 25.7% and cable at 31.8%, as shown in the chart below. While TV viewership increased 7.8% in November, largely due to sports content, streaming usage year over year was up more than 41%.
Scripps Plans To Expand Sports
The declining cable subscriptions and cable viewership, especially on regional sports networks, led E.W. Scripps to launch a new Scripps Sports division. This division plans to seek broadcast rights from teams and leagues and bring that programming to broadcast television. The company plans to obtain rights either in local TV markets where it can partner with local teams or on a national basis, utilizing its distribution on its Ion Network. It is important to note that ION is unique from other networks. Ion’s distribution is nearly 100% of the US television market given that it has local licenses and local towers in every market, it is fully distributed on cable and satellite, and is offered over the air. As such, we believe that Scripps offers a unique proposition to sports teams interested in building its audiences.
Will ATSC 3.0 Stream The Tide?
Furthermore, the broadcast industry appears to be more aggressively ramping its own streaming capabilities with the rollout of its new broadcast standard, ATSC 3.0. ATSC 3.0 is built on the same Internet Protocol as other streaming platforms which enables broadcast programming and internet content to be accessible in the car, on mobile devices, and in the home. While there are many opportunities for the new standard, services and offerings are still being developed. ATSC 3.0 offers promising opportunities for broadcasters to compete with streaming services in the future. We expect that the industry will make more announcements about this promising technology at future events, including the upcoming NAB Show, April 16-19 in Las Vegas, NV.
Are We In A Recession?
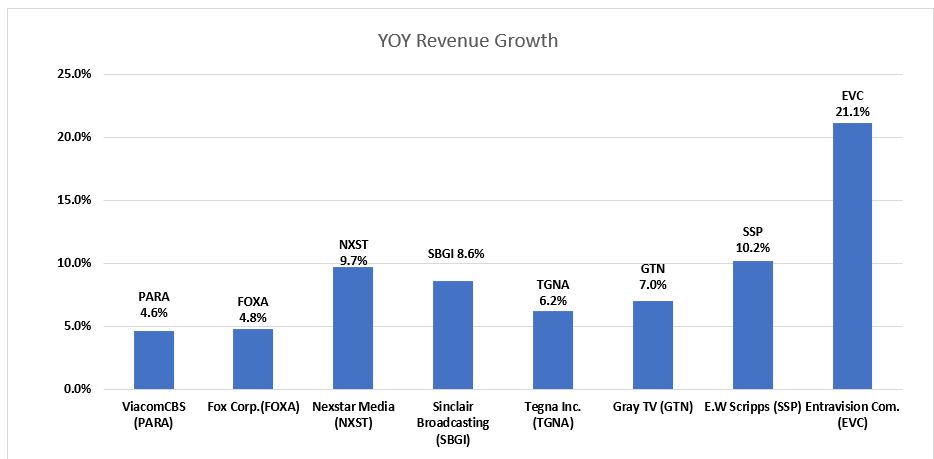
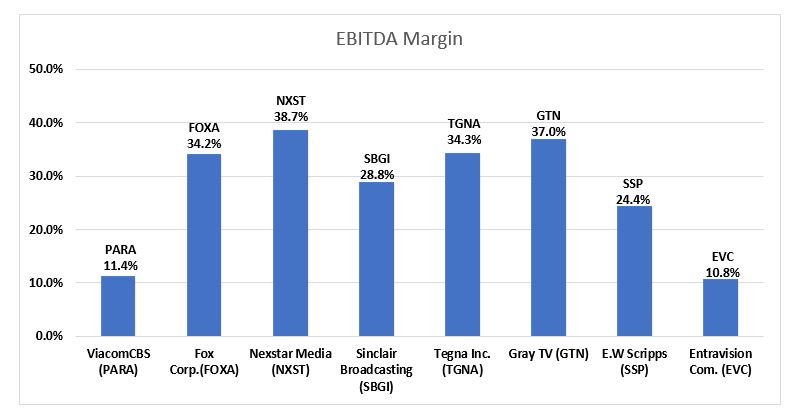
In our view, the current fundamentals may be better than the stocks project. Advertising seems to be holding up, post political advertising. Most companies in the industry reported strong Q3 revenue growth, influenced by a large influx of political advertising. The largest broadcasters, particularly Nexstar, have the largest EBITDA margins. The two stocks with the highest revenue growth in the quarter, Entravision and E.W. Scripps, saw their shares perform the best in the fourth quarter.
Notably, local advertising appears to be fairing better than national advertising. Based on our estimates, core local advertising is expected to be down in the range of 5% to 8%, with core national down as much as double digits. We believe that some large advertising categories like auto, retail and home improvement will show improving trends. The first quarter 2023 appears to be consistent with the fourth quarter. Broadcast network TV is another story, which we believe is weak. Network has potential heightened competition from streamers such as Netflix and Disney+ which have just launched ad-supported streaming tiers.
Is There Room For Upside?
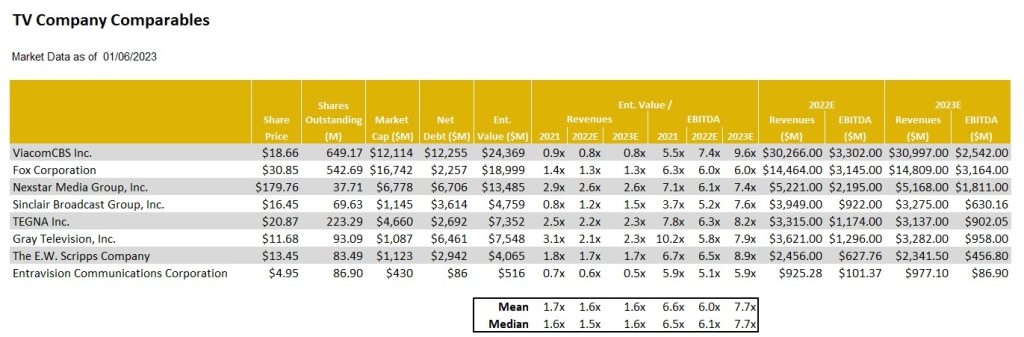
Most TV stocks are trading in a tight range of each other. The biggest variance in stock valuations is Entravision, which is trading at 5.9x EV to our 2023 EBITDA estimate, well below that of its industry peers which trade on average at 7.7x. One might argue that Entravision, which has migrated to become a leading Digital Media company which contributes roughly 80% of its total company revenues, ought to trade at a premium to its broadcast peers, rather than at a discount. Investors appear to be somewhat confused by the company’s relatively low EBITDA margins, which is a function of how revenues are accounted for in its digital media division. We would also note that its capital structure is among the best in the industry, with a large cash position and modest net debt position.
As mentioned earlier, the Noble Broadcast TV Index declined 3% in the latest quarter, underperforming the general market’s 7% advance. E.W. Scripps, which increased 6% and Entravision, which increased 5% were among the strongest revenue performers in the third quarter. Among the poor performers were shares of Gray Television, down a significant 34% and Sinclair Broadcasting, which was down 24%. With the TV stocks down a significant 23% for the year, have the stocks already assumed that the industry is in an economic downturn? We believe that the stocks may be oversold based on the prospect that advertising is currently holding up in the first quarter.
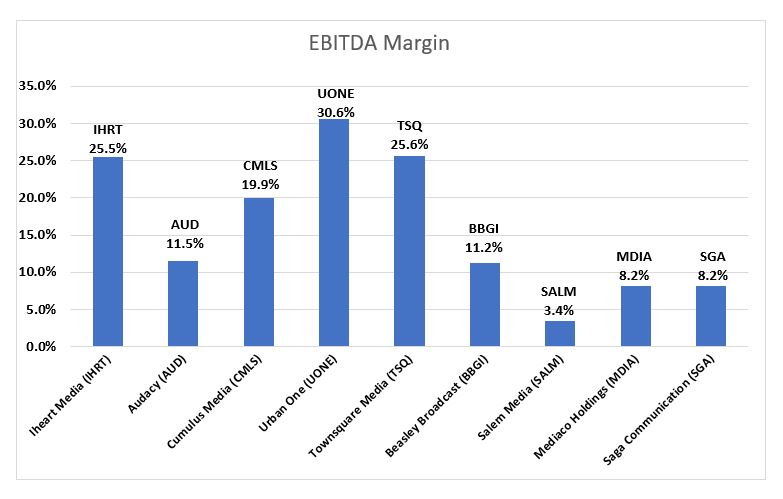
Broadcast Radio
Digital Is Bolstering Performance
The radio industry index was the worst performing index in the traditional media segment, declining 15% in 4Q22 and 64% for the year. The radio industry is feeling the pressure that recessionary concerns place on the demand for advertising. In addition to increased competition for audiences from digital music providers and shifting advertising dollars from radio to a more targeted advertising medium, digital media.
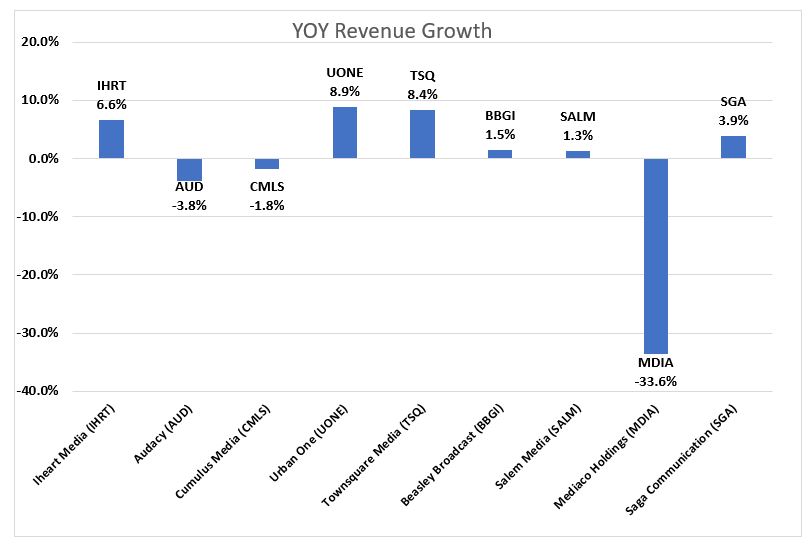
For the third quarter Urban One and Townsquare Media top its peers with revenue growth of 9% and 8%, respectively. A common theme with companies that grew fastest was diversified revenue streams. Salem Media and Beasley Broadcast Group grew less quickly but are taking steps to further diversify revenue. Salem has diversified into content creation and digital media and Beasley is continuing to pursue a digital agency model. The median Q3 revenue growth rate was 1.5%, and the average revenue growth was -1%. The average growth rate of -1% is skewed due to the poor performance of Medico Holdings (MDIA). In previous quarters Medico benefited from Covid-19 vaccine advertising campaigns and ticket sales for an annual outdoor live event that took place in Q3 of 2021. Without Covid vaccine advertising and Medico’s concert being held in Q2 2022 instead of Q3 resulted in revenue declining 34% on a year over year basis.
After the 2022 calendar year ended, Moody’s downgraded Cumulus Media’s Corporate Family Rating to B3 from B2. Moody’s believes Cumulus Media will face a further decline in advertising demand as the economy weakens. Moody’s could upgrade its rating if leverage decreases to 5x as a result of positive performance and could downgrade its rating if leverage ratio increases to 7x as a result of poor performance. It should be noted that Cumulus has a large cash position of $118 million and could access an additional $100 million through an asset backed loan.
However, there are several companies in the radio industry with improving leverage profiles. We believe that radio companies are diversifying traditional revenue streams with digital revenue. In our view, companies that achieved a greater degree of digital transformation and are better shielded from macroeconomic headwinds. Townsquare Media, Cumulus Media, and Salem Media are among the cheapest in the group. For those companies with substantial digital media businesses that are growing rapidly, like Townsquare Media and Beasley, we believe that advertising pacings in the first quarter are likely to be positive. On the low end pacings are expected to be flat to plus 3% and may even be stronger, up 8% or more in the second quarter (although this is too early to bank). In our view, advertising for these companies do not appear to be falling off of a cliff as the stocks seem to project. Therefore, we believe that the Radio sector appears to be in an oversold position and should have some upside prospects in 2023.
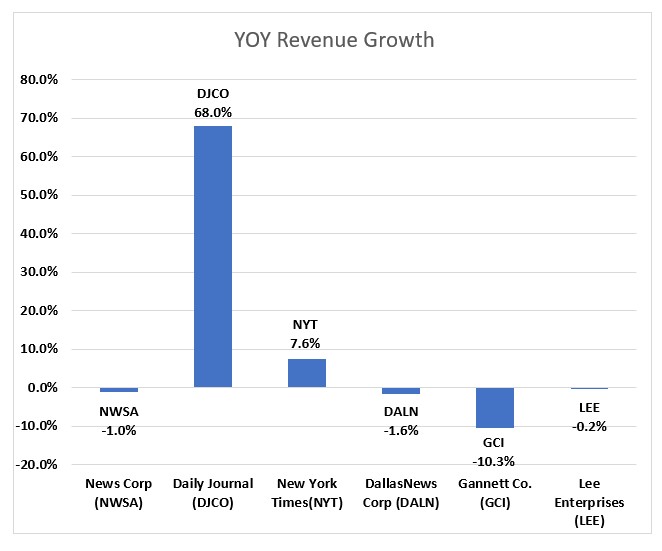
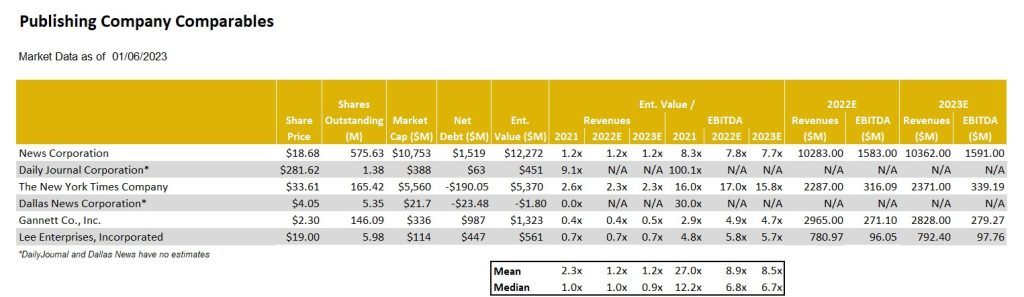
Publishing
Publishing stocks had a pretty good quarter, up 18% as measured by the Noble Publishing Index versus the general market as measured by the S&P 500 Index up 7%. But the largest stocks in the index, New York Times and News Corp, were the only stocks that were up in the sector. Given that the Noble Publishing Index is market cap weighted, it was the reason that the Index was up in the quarter. Lee Enterprises was down a very modest 2% in the quarter. The relatively favorable performance of the index was primarily due to its largest constituents, News Corp. and The New York Times, which rebounded from -30% and -39%, respectively in Q2 2022, to -3% and +3%, respectively, in Q3 2022 and then up 17% and 16%, respectively, in Q4 2022.
We believe that Gannett, the nation’s largest newspaper company, continues to create a pall over the publishing group as it continues to struggle to manage cash flows with its heavy debt burden. In August, the company announced a round of layoffs of 400 employees and then announced another 200 in December. We believe that the company is trying to shore up its cash flow amidst a weak fundamental environment. Not surprisingly, GCI shares (-30%) were among the worst performers in the sector in the fourth quarter. To a large extent, the stock performance in the latest quarter reflected the various company results in Q3.
Q3 publishing revenue declined on average 1%, which excludes the strong revenue growth of the Daily Journal. The company benefited from its Journal Technologies consulting fees which bolstered revenues in its fiscal Q4 results. In addition, during the year, the company sold marketable securities for roughly $80.6 million, realizing net gains of $14.2 million. We have backed out the extraordinary results of the Daily Journal from our industry averages. Notably, Gannett had the weakest revenue performance in the fourth quarter, down 10%.
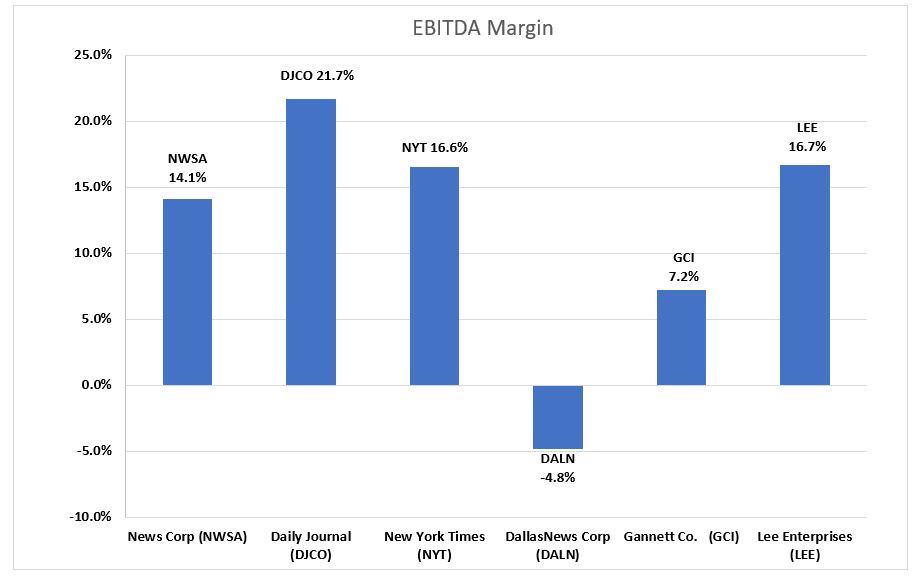
Notable exceptions to the overall weak industry revenue performance was The New York Times, up 7.5% in Q3 revenues, which reflected a moderation in revenue growth from the prior quarter of an increase of 12%. News Corp, declined 1%, which was well below the 7% gain in the prior quarter. Importantly, Lee Enterprises’ fiscal quarter revenue was down a modest 0.2%, a sequential improvement from the modest 0.7% decrease in the prior fiscal quarter. We believe that Lee’s digital strategy continues to gain traction and that the company is very close to an inflection point toward revenue growth. We continue to note that Lee’s digital subscriptions currently lead the industry. The company has exceeded all of its peers in terms of digital subscription growth in the past 11 consecutive quarters. Furthermore, over 50% of its advertising is derived from digital. Currently, roughly 30% of the company’s total revenues are derived from digital, still short of the 55% at The New York Times, but closing the gap.
Not only is Lee performing well on the digital revenue front, but the company has industry leading margins. Lee’s Q3 EBITDA margins were industry leading at 16.7%. We believe that Lee’s margins are notable given that it demonstrates that the company is managing its margins in spite of the investments in its digital media businesses. Its margins place it on par with its digital media focused peers, such as the New York Times.
LEE’s shares trade at an average industry multiple of 5.7x Enterprise Value to our 2023 adj. EBITDA estimate. Notably, the company is closing the gap with its digital media revenue contribution to that of New York Times. The New York Times carries a significantly higher stock valuation, currently trading at an estimated 15.8x EV to 2023 adj. EBITDA. We believe that the valuation gap with the New York Times should close.
This newsletter was prepared and provided by Noble Capital Markets, Inc. For any questions and/or requests regarding this news letter, please contact Chris Ensley
DISCLAIMER
All statements or opinions contained herein that include the words “ we”,“ or “ are solely the responsibility of NOBLE Capital Markets, Inc and do not necessarily reflect statements or opinions expressed by any person or party affiliated with companies mentioned in this report Any opinions expressed herein are subject to change without notice All information provided herein is based on public and non public information believed to be accurate and reliable, but is not necessarily complete and cannot be guaranteed No judgment is hereby expressed or should be implied as to the suitability of any security described herein for any specific investor or any specific investment portfolio The decision to undertake any investment regarding the security mentioned herein should be made by each reader of this publication based on their own appraisal of the implications and risks of such decision This publication is intended for information purposes only and shall not constitute an offer to buy/ sell or the solicitation of an offer to buy/sell any security mentioned in this report, nor shall there be any sale of the security herein in any state or domicile in which said offer, solicitation or sale would be unlawful prior to registration or qualification under the securities laws of any such state or domicile This publication and all information, comments, statements or opinions contained or expressed herein are applicable only as of the date of this publication and subject to change without prior notice Past performance is not indicative of future results.
Please refer to the above PDF for a complete list of disclaimers pertaining to this newsletter
Ocugen, Inc. is a biotechnology company focused on developing and commercializing novel gene therapies, biologicals, and vaccines. The lead product, Covaxin, is a killed-virus vaccine for COVID-19 in-licensed from Bharat Biotech (India). The lead product in its gene therapy program, OCU400, is in Phase 1/2 clinical trials for retinitis pigmentosa.
Robert LeBoyer, Vice President, Research Analyst, Life Sciences , Noble Capital Markets, Inc.
Refer to the full report for the price target, fundamental analysis, and rating.
Bridging Study Shows Equivalence. Ocugen announced that its Phase 2/3 immuno-bridging study for Covaxin met both its co-primary immunogenicity endpoints. The study was designed to demonstrate that vaccination with Covaxin in US patients stimulated immunogenicity that is equivalent to the Phase 3 study conducted by Bharat Biotech in India in 2020. The study also assessed the boosting effect of Covaxin in patients previously receiving an mRNA or viral vector vaccine.
Study Design. The OCU-002 immuno-bridging study was a randomized, placebo-controlled study that enrolled 419 patients at 8 clinical sites. This was intended to test Covaxin in a demographically diverse population of healthy adults in the US with current SARS-CoV-2 strains. Participants received a first dose of Covaxin or placebo followed by a second dose 28 days later. The immune response was evaluated using microneutralization test (MNT) assay by a blinded observer.
Equity Research is available at no cost to Registered users of Channelchek. Not a Member? Click ‘Join’ to join the Channelchek Community. There is no cost to register, and we never collect credit card information.
This Company Sponsored Research is provided by Noble Capital Markets, Inc., a FINRA and S.E.C. registered broker-dealer (B/D).
*Analyst certification and important disclosures included in the full report. NOTE: investment decisions should not be based upon the content of this research summary. Proper due diligence is required before making any investment decision.
Mark Reichman, Senior Research Analyst, Natural Resources, Noble Capital Markets, Inc.
Refer to the full report for the price target, fundamental analysis, and rating.
Lithium from Nevada claystone. Cypress Development is advancing its 100%-owned Clayton Valley Lithium Project in Nevada. Cypress intends to mine claystone, produce a high-grade lithium concentrate solution using a chloride leach process, and apply a licensed direct lithium extraction process based on ion-exchange to produce lithium carbonate suitable for battery producers supplying the growing electric vehicle and battery storage market.
Funding from the U.S. Department of Energy. The U.S. Department of Energy’s (DOE) Loan Programs Office (LPO) recently offered a conditional commitment to lend up to US$700 million to develop Ioneer’s (Nasdaq: IONR) Rhyolite Ridge lithium-boron mining project in Nevada. In our view, the loan reflects the U.S. government’s commitment to assure domestic supplies of lithium and other critical minerals for the growing electric vehicle battery market.
Equity Research is available at no cost to Registered users of Channelchek. Not a Member? Click ‘Join’ to join the Channelchek Community. There is no cost to register, and we never collect credit card information.
This Company Sponsored Research is provided by Noble Capital Markets, Inc., a FINRA and S.E.C. registered broker-dealer (B/D).
*Analyst certification and important disclosures included in the full report. NOTE: investment decisions should not be based upon the content of this research summary. Proper due diligence is required before making any investment decision.
Michael Kupinski, Director of Research, Noble Capital Markets, Inc.
Jacob Mutchler, Research Associate, Noble Capital Markets, Inc.
Refer to the bottom of the report for important disclosures
Overview:Will It Be A Happy New Year? The full impact of the recent increase in interest rates likely have not been fully reflected in the economy. But, many media stocks seem to anticipate that the industry is in a downturn now. Notably, some stocks have recently performed better and the current fundamentals are not falling off of a cliff.
Digital Media: Coming Off Of Its Sugar High?While Google now plans to phase out cookies in the second half of 2024, it is likely that the plan will affect 2023 as marketers and publishers prepare for the deprecation of cookies.
Television Broadcasting: A Watershed Year For Streaming. Streaming has now eclipsed both broadcast TV and cable TV in terms of viewing based on Nielsen data. Recently, Netflix launched a new pricing plan on November 3 which offers a basic tier, with advertising, at a low price point of $6.99. What does this mean for the TV industry?
Radio Broadcasting:Digital Is Bolstering Performance. It has been a bloodbath for Radio stocks, but the fundamentals appear better than the stock performance might suggest. Radio broadcasters with significant digital businesses are anticipated to report favorable pacings in Q1.
Publishing: You Are Golden If You Have Digital. The trouble with the largest newspaper company, Gannett, has created a pall over the group as it struggles to cut expenses. But, companies with substantial digital operations have performed well. We highlight one of our current favorites Lee Enterprises (LEE).
Overview
Will It Be A Happy New Year?
2022 was one of the worse for media stock performance in recent memory, with stocks across traditional and digital media sectors down over 40% or more. Media stocks underperformed the general market, as measured by the S&P 500 Index, which was down a more moderate 19.4% on a comparable basis for the full year 2022. It is typical for media stocks to underperform in a late-stage economic cycle or in the midst of an economic downturn. But, the significant stock declines are stunning. Macro-economic issues including inflation, rising interest rates, and the prospect of a looming economic downturn, all contributed to the poor performance.
The question is “will 2023 be better?” We believe so. There has been recent signs of life. The S&P 500 increased by 7% during the fourth quarter of 2022, marking the first time the Index had increased since fourth quarter of 2021. Notably, the Noble Publishing and Noble MarTech Indices outperformed the general market in the latest quarter. But, the full impact of the recent interest rate increase likely have not been reflected in the economy. Many media stocks seem to anticipate an economic downturn, but current fundamentals do not appear to be in a freefall and may be better than expected. If the economy further deteriorates from the recent or future rate hikes, it appears now that it may adversely affect the second half of 2023. Advertising pacings appear to be holding up well so far in the first half 2023. Notably, media stocks may begin to anticipate an improving economic outlook and overlook the weak fundamental environment in the second half.
Conventional thought anticipates that increasing concerns over an economic recession may prompt mortgage rates to trend lower in 2023. Furthermore, it is possible that the Fed may lower interest rates if inflation moderates, although the Fed is not currently anticipating rate decreases in 2023. Nonetheless, this paints a favorable picture for media stocks in 2023. Traditionally, the best time to buy media stocks is in the midst of an economic downturn. In addition, these consumer cyclical stocks tend to be among the first movers in an early-stage economic cycle and tend to perform well in a moderating interest rate environment. As mentioned earlier, the stocks may currently be oversold given the prospect that the current fundamental
environment is better anticipated.
What is the risk to this favorable outlook? We believe that the resurging Chinese economy may be disruptive. Within the last month, the China’s economy has been reopened from Covid lockdowns, which may put pressure on global energy prices. Such a prospect may make our fight on inflation more stubborn to combat, potentially throwing off our favorable outlook for moderating interest rates. In our view, we are closer to the light at the end of the tunnel than we were last year. Given the prospect that these stocks tend to outperform the market in an early stage economic recovery, we believe it is time for investors to accumulate positions in the media sectors. In this quarterly, we highlight some of our favorite plays in the Digital, Media & Technology space.
Digital Media & Technology
A Year To Forget
While there were signs of life in the fourth quarter of 2022 for the Internet and Digital Media sectors, 2022 was a year most investors in these sectors would like to forget. As Figure #1 LTM Internet & Digital Technology Performance illustrates, every one of these sectors substantially underperformed the S&P 500 last year. The S&P 500 Index finished the year down 19% which was substantially better than Noble’s Digital Media Index (-41%), MarTech Index (-52%), Social Media Index (-63%), and Ad Tech Index (-63%). Rather than focus on the stocks that significantly underperformed their respective Indices (and there are many), we would rather focus on the three stocks that finished 2022 up for the year.
The shares of one of our favorites, Harte Hanks (HHS)increased by 53% in 2022. The company continued its multi-year turnaround from a highly levered and unprofitable business (in 2019), to a double digit EBITDA margin business with a debt-free balance sheet. Furthermore, we believe that many of the company’s business lines have recession resilient qualities. The other stocks that performed well are Tencent (TME), whichincreased by 21%in 2022. Shares declined earlier in the year as China’s economy slowed as it maintained its Zero Covid-19 lockdowns, but surged in the fourth quarter as it appeared that the company would enjoy an increase in demand as China begins easing Covid restrictions. Finally, the shares of Perion Networks (PERI) increased by 5% in 2022 as Perion consistently beat expectation and raised its guidance throughout 2022. In the first week of 2023, the company once again pre-announced better than expected results for the fourth quarter, and shares are already up 14% since the start of the new year.
As Figure #2 Q4 Internet & Digital Technology Performancehighlights, there has been signs of life in Noble’s MarTech Index which increased 6%, roughly in-line with the market. In Noble’s MarTech Index, 11 of the 22 stocks in the index posted gains, led by Yext (YEXT; +46%), Shopify (SHOP; +29%), LiveRamp (RAMP; +29%) and Adobe (ADBE; +22%). This marks significant improvement from last quarter when only 4 of the sectors’ stocks finished the quarter in positive territory. MarTech stocks have suffered from a market reset to revenue multiples that began when the Fed began raising rates. MarTech share price declines in the first, second and third quarters of 2022 were mostly driven by multiple compression as investors rotated out of high-flying tech sectors where companies had chased growth at all costs (at the expense of profitability). Only 7 of the MarTech companies in the Index posted positive EBITDA in the latest quarter. Laggards during the fourth quarter were Noble’s Digital Media Index (-5%), Social Media Index (-7%) and Ad Tech Index (-20%).
Coming Off Of A Sugar High?
One of the largest issues affecting the Digital Media industry in 2023 will be the phase out of the use of third-party cookies. Cookies were used to track a user visits on internet sites and that data was used to model behavior. The industry has moved away from the use of cookies as governments and consumers have raised concerns over privacy issues and as consumers wanted more control over how their data is used. Governments have taken a more active role in protecting consumer privacy. California, Colorado, Connecticut, Utah, and Virginia have passed privacy laws. It is likely that there will be a federal privacy law at some point.
How will this affect the industry? We believe that there has been plenty of time to “work around” this issue. The implementation of the phase out of cookies has been delayed several times, originally announced by Google in 2020. Google now plans to phased out cookies in the second half of 2024, if it is not delayed again. As marketers and publishers prepare for the deprecation of cookies, digital advertising likely will be begin to affect 2023.
Digital Advertising Outlook for 2023
Last October eMarketer revised lower its 2023 U.S. digital advertising forecast by $5.5 billion, from $284.1 billion to $278.6 billion. While this sounds like a substantial drop in percentage terms, the 2023 guidance was lowered from 14% growth to 12% growth. Most of the global ad agencies expect digital to continue to grow by double digits driven with dollars migrating to such digital ad channels as retail media and connected TV. Both sectors continue to demonstrate impressive growth.
Retail Media – A retail media network is a retailer-owned advertising service that allows marketers to purchase advertising space across all digital assets owned by a retail business, using the retailer’s first-party data to connect with shoppers throughout the buying journey. eMarketer forecasts that retail media ad spending grew by 31% last year to $41 billion and will grow to $61 billion over the next two years, by which time it will equate to 20% of digital advertising. The leaders in retail media are Amazon, Walmart and Instacart.
Through a retail media network, partners (advertisers) get direct access to a retailer’s customers. The benefit to the partners/advertisers is that they get access to first party data. Retailers own and store this data and allow advertisers to access them through their retail media programs. The first party data is valuable because it is collected at the point of sale allowing brands to get better insights into purchase behavior. Traditional retailers are beginning to follow suit. Traditional retailers with the largest digital audiences (per comScore) are Walmart, Target, Home Depot, Lowes, CVS, Walgreens, Costco and Kohls.
On January 10th, Microsoft announced that it intended to create the industry’s most complete omnichannel retail media technology stack supported by its Promote IQ platform, a company Microsoft acquired in 2019. We expect companies that serve the retail media sector from an Ad Tech or Mar Tech standpoint are poised to benefit from secular trends in this sector.
Connected TV (CTV) – Last July, Nielsen announced that for the first time U.S. streaming TV viewership was larger than cable TV viewing. In July 2022, eMarketer forecast that CTV advertising would reach $18.9 billion in 2022. However, in October 2022, eMarketer raised its forecast for CTV advertising by $2.3 billion to $21.2 billion in 2022. In October, the forecaster also raised its 2023 CTV advertising forecast by $3 billion to $26.9 billion, up from $23.9 billion in the July 2022 forecast. The big increase is due primarily to Netflix and Disney+ announcing they were launching ad supported tiers to their streaming offerings. Ad Tech or Mar Tech companies that serve this market are also poised to benefit from secular viewing trends and the advertising dollars that are migrating to these platforms, discussed later in this report.
The ability to target specific audiences and measure specific outcomes tied to the ads that viewers watched, has made CTV a force to be reckoned with, particularly for those advertisers that are never quite sure which advertising mediums provide the highest returns. Historically, TV was a mass medium used by large brands that wanted massive reach. CTV has opened the door to a wider variety of advertisers that are looking to reach more targeted, even niche, audiences. According to MNTN, a connected TV performance marketing platform, many CTV advertisers are first-time TV advertisers. With new FAST (Free Ad-Supported Streaming TV) channels coming online every month, there is no shortage of supply coming to market. This is just one reason why eMarketer predicts CTV advertising to grow by $10+ billion over the next two years and reach nearly $32 billion in advertising revenue in 2024.
As we look toward 2023, our current favorites include Harte Hanks (HHS) and Direct Digital (DRCT). In terms of Harte Hanks, we believe that the company has recession resilient qualities and that the company’s balance sheet is in a sound position. Furthermore, given the recent rising interest rate environment, the company’s unfunded pension liabilities have dramatically improved. The company may have the opportunity to further mitigate its pension liabilities in 2023. Figure #3 Marketing Tech Comparables highlights, the shares of HHS are trading well below its peers. We believe that there is meaningful upside potential in the shares as it closes the valuation gap with its peers.
While the deprecation of cookies has created a pall over the sector, we believe that Direct Digital has worked with its Publishers to mitigate this issue. In addition, the company is a relatively small player in a very large marketplace. As such, we believe that the company has the ability to attractively grow in 2023. In our view, the shares appear to be oversold given the continuation of favorable advertising trends. Figure #4 Advertising Tech Comparables illustrates that the DRCT shares trade below the average valuation in its Advertising Marketing peer set. In our view, the valuation should be higher than the averages given that the company has leading industry revenue growth. Closing this valuation gap offers compelling stock appreciation potential.
Figure #1 LTM Internet & Digital Technology Performance
Source: Capital IQ
Figure #2 Q4 Internet & Digital Technology Performance
Source: Capital IQ
Marketing Technology
Figure #3 Marketing Tech Comparables
Source: Eikon, Company filings and Noble estimates
Figure #4 Advertising Tech Comparables
Source: Eikon, Company filings and Noble estimates
Traditional Media
Another Quarter Of Moderating Stock Performance
Traditional media stocks underperformed the general market in 2022, with the Radio sector the hardest hit. As Figure #5 LTM Traditional Media Performance Chart illustrates, the Noble Radio Index declined 63.8% versus 19.4% for the general market, as measured by the S&P 500, in a comparable time period. Television and Publishing stocks were down 23.2% and 25.4%, respectively, more in line with the general market returns. But, there were notable company stock performance disparities within each sector, highlighted later in this report. Larger market capitalized companies performed better, which skewed the market cap weighted Indices.
The traditional media stocks seemed to have stabilized from the rapid declines earlier in the year. Possible signs of life in the traditional media sector as well? As Figure #6 Q4 Traditional Media Performance highlights, the Publishing sector once again outperformed the general market in the quarter. The Noble Television Index declined 3.2%, but this decline moderated from the 10.1% decline in the third quarter. The Radio industry still has not yet stabilized, with the Noble Radio Index down 15.4% in the latest quarter.
Figure #5 LTM Traditional Media Performance
Source: Capital IQ
Figure #6 Q4 Traditional Media Performance
Source: Capital IQ
Television Broadcast
Will Netflix suck the air out of the room?
Netflix launched a new pricing plan on November 3 which offers a basic tier, with advertising, at a low price point of $6.99. This compares with its previous tiers of $9.99 and $19.99 for advertising free streaming. While reports indicate that the advertising platform is off to a slow start, we believe that the Netflix move could be disruptive to the Broadcast Television Network business as its lower price basic service gains traction. It is likely that there will be some cannibalization from its higher pricing tier, but we believe that the move will broaden its subscriber base. While Netflix has not considered offering live sports on its streaming platform given the cost of sports rights, we believe that the potential success of its subscription/advertising tier may provide a platform to upend that decision. There is a strong tailwind for viewership trends on streaming platforms, which now exceed that of broadcast television viewing. A decision to enter sports will be a big deal and disruptive to Network broadcasting.
Streaming viewership not only eclipsed television viewing in July 2022, but also that of cable viewing, 34.8% versus 34.4%. In addition, based on the latest Nielsen data from November 2022, streaming now accounts for 38.2% of total viewing with Broadcast at 25.7% and cable at 31.8%. Figure #7 Viewership illustrates the November viewership data. While TV viewership increased 7.8% in November, largely due to sports content, streaming usage year over year was up more than 41%.
Figure #7 Viewership
Source: Nielsen Media Insights
Scripps Plans To Expand Sports
The declining cable subscriptions and cable viewership, especially on regional sports networks, led E.W. Scripps to launch a new Scripps Sports division. This division plans to seek broadcast rights from teams and leagues and bring that programming to broadcast television. The company plans to obtain rights either in local TV markets where it can partner with the the teams or on a national basis, utilizing its distribution on its Ion Network. It is important to note that ION is unique from other networks. Ion’s distribution is nearly 100% of the US television market given that it has local licenses and local towers in every market, it is fully distributed on cable and satellite, and is offered over the air. As such, we believe that Scripps offers a unique proposition to sports teams interested in building its audiences.
Will ATSC 3.0 Stream The Tide?
Furthermore, the broadcast industry appears to be more aggressively ramping its own streaming capabilities with the rollout of its new broadcast standard, ATSC 3.0. ATSC 3.0 is built on the same Internet Protocol as other streaming platforms, and, as such, broadcast programming and internet content can be accessible in the car, on mobile devices, as well as in the home. Importantly, the new standard can handle signal shifting, like if you were moving in a car, and the signal is more robust so you may be able to pick up more stations in a local market. While there are many opportunities for the new standard, services and offerings are still being developed. But, it offers promising opportunities for broadcasters to compete with streaming services in the future. We expect that the industry will make more announcements about this promising technology at future events, including the upcoming NAB Show, April 16-19 in Las Vegas, NV.
Are We In A Recession?
In our view, the current fundamentals may be better than the stocks project. Advertising seems to be holding up, post political advertising. As Figure #8 TV Q3 YoY Revenue Growth highlights, most companies in the industry reported strong Q3 revenue growth, influenced by a large influx of Political advertising. Figure #9 TV Q3 EBITDA Margins illustrates that the largest broadcasters, particularly Nexstar, has the largest EBITDA margins. Notably, the two stocks with the highest revenue growth in the quarter, Entravision and E.W. Scripps, performed the best in the fourth quarter, discussed later.
Notably, Local advertising appears to be fairing better than National advertising. Based on our estimates, core local advertising is expected to be down in the range of 5% to 8%, with core National down as much as the double digits. We believe that some large advertising categories like Auto, Retail and Home Improvement will show improving trends. The first quarter 2023 appears to be consistent with the fourth quarter. Smaller market TV likely will perform at the lower end of the range, while larger market TV will be at the higher end (greater core revenue decline). Broadcast Network is another story, which we believe is weak. Network has potential heightened competition. Figure #8 TV Q3 YoY Revenue Growth
Source: Eikon and Company filings
Figure #9 TV Q3 EBITDA Margins
Source: Eikon and Company filings
As mentioned earlier, the Noble Television Broadcast Index declined 3.2% in the latest quarter, underperforming the general market’s 7.2% advance. Importantly, the 3.2% decline in valuations was a moderation from the 10.1% decline in the third quarter. There were variances in the performance and some notable performers including two of our favorites: E.W. Scripps, which increased 5.8% and Entravision, which increase 5.3%. Both of these companies were among the strongest revenue performers in the third quarter. Among the poor performers was Gray Television, down a significant 33.7% and Sinclair Broadcasting, down 24.0%. With the TV stocks down a significant 23.2% for the year, have the stocks already assumed that the industry is in an economic downturn? We believe that the stock may be oversold based on the prospect that advertising is currently holding up in the first quarter.
Is There Room For Upside?
As Figure # 10 TV Industry Comparables highlight, most TV stocks are trading in a tight range of each other. The biggest variance in stock valuations is our current favorite Entravision, trading at 5.9 times EV to our 2023 EBITDA estimate, well below that of its industry peers which trade on average at 7.7 times. We believe that Entravision, which has migrated to become a leading Digital Media company which contributes roughly 80% of its total company revenues, should trade at a premium to its broadcast peers, rather than at a discount. Investors appear to be somewhat confused by the company’s relatively low EBITDA margins, which is a function of how revenues are accounted for in its Digital Media Division. We would also note that its financial profile is among the best in the industry, with a large cash position and modest net debt position of $86 million. As such, EVC leads our favorites in this sector.
Figure #10 TV Industry Comparables
Source: Eikon, Company filings and Nobles estimates
Radio Broadcast
Digital Is Bolstering Performance
The radio industry index was the worst performing index in the traditional media segment, declining 15.4% in the quarter and 63.8% for the year. The radio industry is feeling the pressure that recessionary concerns place on the demand for advertising. In addition to increased competition for audiences from digital music providers and shifting advertising dollars from radio to a more targeted advertising medium, digital media.
Figure #11 Radio Industry Q3 YoY Revenue Growth chart illustrates the year over year change in revenue for the third quarter. Urban One and Townsquare Media top their peers with revenue growth of 8.9% and 8.4%, respectively. A common theme with companies at the top of the list are diversified revenue streams. Salem Media and Beasley Broadcast Group are in the middle of the pack and are both taking steps to further diversify revenue. Salem has diversified into content creation and digital media and Beasley is continuing to pursue digital agency model. The median Q3 revenue growth rate was 1.5%, and the average revenue growth was -1%. The Average growth rate of -1% is skewed due to the poor performance of Medico holdings. In previous quarters Medico benefited from Covid-19 vaccine advertising campaigns and ticket sales for an annual outdoor live event that took place in Q3 of 2021. Without Covid vaccine advertising and Medico’s concert being held in Q2 2022 instead of Q3 resulted in revenue declining 33.6% on a year over year basis.
Industry adj. EBITDA margins were healthy, as Figure #12 Radio Industry Q3 EBITDA margins illustrates, Urban one, Townsquare Media and Iheart Media top the list with adj. EBITDA margins of 30.6%, 25.6% and 25.5%, respectively.
After the 2022 calendar year ended, Moody’s downgraded Cumulus Media’s Corporate Family Rating to B3 from B2. Moody’s believes Cumulus Media will face a further decline in advertising demand as the economy weakens. Moody’s could upgrade its rating if leverage decreases to 5x as a result of positive performance and could downgrade its rating if leverage ratio increases to 7x as a result of poor performance. It should be noted that Cumulus has a large cash position of $118 million and could access an additional $100 million through an asset backed loan.
However, there are several companies in the Radio industry with improving leverage profiles. Moreover, we believe that radio companies are diversifying traditional revenue streams with digital revenue. In our view, companies that achieved a greater degree of digital transformation and are better shielded from macroeconomic headwinds. Figure #13 Radio Industry Comparables highlights, Townsquare Media, Cumulus Media, and Salem Media are among the cheapest in the group. For those companies with substantial digital media businesses that are growing rapidly, like Townsquare Media and Beasley, we believe that advertising pacings in the first quarter are likely to be positive. On the low end pacings are expected to be flat to plus 3% and may even be stronger, up 8% or more in the second quarter (although this is too early to bank). In our view, advertising for these companies do not appear to be falling off of a cliff as the stocks seem to project. As such, we believe that the Radio sector appears to be in an oversold position and should have some upside prospects in 2023. Our favorites include TSQ, SALM, BBGI, and CMLS.
Figure #11 Radio Industry Q3 YoY Revenue Growth
Source: Eikon and Company filings
Figure #12 Radio Industry Q3 EBITDA Margins
Source: Eikon and Company filings
Figure #13 Radio Industry Comparables
Source: Eikon, Company filings and Nobles estimates
Publishing
Illustrated above in Figure #6 Q4 Traditional Media Performance, the Publishing stocks had a pretty good quarter, up 17.9% as measured by the Noble Publishing Index versus the general market as measured by the S&P 500 Index up 7.1%. But the largest stocks in the index, New York Times and News Corp, were the only stocks that were up in the sector. Given that the Noble Publishing Index is market cap weighted, it was the reason that the Index was up in the quarter. Importantly, one of our favorites, Lee Enterprises was down a very modest 2.3% in the quarter. Again, the relatively favorable performance of the index was primarily due to its largest constituents, News Corp. and The New York Times, which rebounded from -29.7% and -39.1%, respectively in Q2, to -3% and +3%, respectively, in Q3 and then up 16.8% and 16.3%, respectively, in Q4.
We believe that Gannett, the nation’s largest newspaper company, continues to create a pall over the publishing group as it continues to struggle to manage cash flows with its heavy debt burden. In August, the company announced a round of lay offs of 400 employees and then announced another 200 in December. We believe that the company is trying to shore up its cash flow amidst a weak fundamental environment. Not surprisingly, the GCI shares were among the worse performers in the sector in the latest quarter, down 30%. To a large extent, the stock performance in the latest quarter reflected the various company results in Q3.
As Figure #14 Publishing Industry Q3 YoY Revenue Performance chart illustrates, Q3 publishing revenue declined on average 1.1%, which excludes the strong revenue growth of the Daily Journal. The company benefited from its Journal Technologies consulting fees which bolstered revenues in its fiscal Q4 results. In addition, during the year, the company sold marketable securities for roughly $80.6 million, realizing net gains of $14.2 million. As such, we have backed out the extraordinary results of the Daily Journal from our industry averages. Notably, Gannett had the weakest revenue performance in the latest quarter, down 10%.
The notable exceptions to the overall weak industry revenue performance was The New York Times, up 7.5% in Q3 revenues, which reflected a moderation in revenue growth from the prior quarter of an increase of 11.5%. News Corp, declined 1%, which was well below the 7.3% gain in the prior quarter. Importantly, Lee Enterprises fiscal quarter revenue was down a modest 0.2%, a sequential improvement from the modest 0.7% decrease in the prior fiscal quarter. We believe that Lee’s digital strategy continues to gain traction and that the company is very close to an inflection point toward revenue growth. We continue to note that Lee’s digital subscriptions currently lead the industry. The company has exceeded all of its peers in terms of digital subscription growth in the past 11 consecutive quarters. Furthermore, over 50% of its advertising is derived from digital. Currently, roughly 30% of the company total revenues are derived from Digital, still short of the 55% at The New York Times, but closing the gap.
Not only is Lee performing well on the Digital revenue front, it has industry leading margins. As Figure #15 Publishing Industry Q3 EBITDA Margins illustrates, Lee’s Q3 EBITDA margins were industry leading at 16.7%, again, excluding the extraordinary results at the Daily Journal which benefited from marketable securities trading. We believe that Lee’s margins are notable given that it demonstrates that the company is managing its margins in spite of the investments in its Digital Media businesses. Its margins place it on pare with its Digital Media focused peers, such as the New York Times.
As Figure #16 Publishing Industry Comparables chart illustrates, the LEE shares trade at an average industry multiple of 5.7 times Enterprise Value to our 2023 adj. EBITDA estimate. Notably, the company is closing the gap with its Digital Media revenue contribution to that of New York Times. The New York Times carries a significantly higher stock valuation, currently trading at an estimated 15.8 times EV to 2023 adj. EBITDA. We believe that the valuation gap with the New York Times should close. As such, we view the LEE shares as among our favorites in the industry.
Figure #14 Publishing Industry Q3 YoY Revenue Growth
Source: Eikon and Company filings
Figure #15 Publishing Industry Q3 EBITDA Margins
Source: Eikon and Company filings
Figure #16 Publishing Industry Comparables
Source: Eikon, Company filings and Nobles estimates.
For additional disclosures and information on companies mentioned in this report, please click on the company name:
All statements or opinions contained herein that include the words “we”, “us”, or “our” are solely the responsibility of Noble Capital Markets, Inc.(“Noble”) and do not necessarily reflect statements or opinions expressed by any person or party affiliated with the company mentioned in this report. Any opinions expressed herein are subject to change without notice. All information provided herein is based on public and non-public information believed to be accurate and reliable, but is not necessarily complete and cannot be guaranteed. No judgment is hereby expressed or should be implied as to the suitability of any security described herein for any specific investor or any specific investment portfolio. The decision to undertake any investment regarding the security mentioned herein should be made by each reader of this publication based on its own appraisal of the implications and risks of such decision.
This publication is intended for information purposes only and shall not constitute an offer to buy/sell or the solicitation of an offer to buy/sell any security mentioned in this report, nor shall there be any sale of the security herein in any state or domicile in which said offer, solicitation or sale would be unlawful prior to registration or qualification under the securities laws of any such state or domicile. This publication and all information, comments, statements or opinions contained or expressed herein are applicable only as of the date of this publication and subject to change without prior notice. Past performance is not indicative of future results. Noble accepts no liability for loss arising from the use of the material in this report, except that this exclusion of liability does not apply to the extent that such liability arises under specific statutes or regulations applicable to Noble. This report is not to be relied upon as a substitute for the exercising of independent judgement. Noble may have published, and may in the future publish, other research reports that are inconsistent with, and reach different conclusions from, the information provided in this report. Noble is under no obligation to bring to the attention of any recipient of this report, any past or future reports. Investors should only consider this report as single factor in making an investment decision.
IMPORTANT DISCLOSURES
This publication is confidential for the information of the addressee only and may not be reproduced in whole or in part, copies circulated, or discussed to another party, without the written consent of Noble Capital Markets, Inc. (“Noble”). Noble seeks to update its research as appropriate, but may be unable to do so based upon various regulatory constraints. Research reports are not published at regular intervals; publication times and dates are based upon the analyst’s judgement. Noble professionals including traders, salespeople and investment bankers may provide written or oral market commentary, or discuss trading strategies to Noble clients and the Noble proprietary trading desk that reflect opinions that are contrary to the opinions expressed in this research report. The majority of companies that Noble follows are emerging growth companies. Securities in these companies involve a higher degree of risk and more volatility than the securities of more established companies. The securities discussed in Noble research reports may not be suitable for some investors and as such, investors must take extra care and make their own determination of the appropriateness of an investment based upon risk tolerance, investment objectives and financial status.
Company Specific Disclosures
The following disclosures relate to relationships between Noble and the company (the “Company”) covered by the Noble Research Division and referred to in this research report. Noble is not a market maker in any of the companies mentioned in this report. Noble intends to seek compensation for investment banking services and non-investment banking services (securities and non-securities related) with any or all of the companies mentioned in this report within the next 3 months
ANALYST CREDENTIALS, PROFESSIONAL DESIGNATIONS, AND EXPERIENCE
Senior Equity Analyst focusing on Basic Materials & Mining. 20 years of experience in equity research. BA in Business Administration from Westminster College. MBA with a Finance concentration from the University of Missouri. MA in International Affairs from Washington University in St. Louis. Named WSJ ‘Best on the Street’ Analyst and Forbes/StarMine’s “Best Brokerage Analyst.” FINRA licenses 7, 24, 63, 87
WARNING
This report is intended to provide general securities advice, and does not purport to make any recommendation that any securities transaction is appropriate for any recipient particular investment objectives, financial situation or particular needs. Prior to making any investment decision, recipients should assess, or seek advice from their advisors, on whether any relevant part of this report is appropriate to their individual circumstances. If a recipient was referred to Noble Capital Markets, Inc. by an investment advisor, that advisor may receive a benefit in respect of transactions effected on the recipients behalf, details of which will be available on request in regard to a transaction that involves a personalized securities recommendation. Additional risks associated with the security mentioned in this report that might impede achievement of the target can be found in its initial report issued by Noble Capital Markets, Inc.. This report may not be reproduced, distributed or published for any purpose unless authorized by Noble Capital Markets, Inc..
RESEARCH ANALYST CERTIFICATION
Independence Of View All views expressed in this report accurately reflect my personal views about the subject securities or issuers.
Receipt of Compensation No part of my compensation was, is, or will be directly or indirectly related to any specific recommendations or views expressed in the public appearance and/or research report.
Ownership and Material Conflicts of Interest Neither I nor anybody in my household has a financial interest in the securities of the subject company or any other company mentioned in this report.