Axcella Therapeutics (AXLA) – AXA1125 Receives Fast Track Designation For NASH Indication

Tuesday, February 15, 2022

Axcella Therapeutics (AXLA)
AXA1125 Receives Fast Track Designation For NASH Indication

Axcella Health Inc. is a clinical-stage biotechnology company focused on treating complex diseases and improvinge health using endogenous metabolic modulator, or EMM, compositions. Its product candidates are comprised of multiple EMMs that are engineered in distinct combinations and ratios to simultaneously impact multiple biological pathways. The company’s pipeline includes two lead therapeutic candidates:, AXA1665 for the reduction in risk of recurrent overt hepatic encephalopathy (OHE) , and AXA1125 for the treatment of non-alcoholic steatohepatitis (NASH).

Robert LeBoyer, Senior Research Analyst, Noble Capital Markets, Inc.

Refer to the full report for the price target, fundamental analysis, and rating.

    Fast Track Designation Is A Strong Positive.  Axcella announced that the FDA has granted Fast Track Designation for AXA1125 in its non-alcoholic steatohepatitis (NASH) with fibrosis indication. AXA1125 is a formulation of amino acids in development to resolve NASH by controlling metabolic, inflammatory, and fibrotic pathways. AXA 1125 is currently in the Phase 2b EMMPACT clinical trial for the NASH indication.

    Fast Track Designation Signifies Recognition Of Potential Impact.  AXA1125 was granted Fast Track Designation after the FDA reviewed clinical data from the previous studies. This designation is intended to assist development and shorten time to market by allowing the company to have more frequent communications about clinical plans and requirements. It can also allow for rolling submission and …


This Company Sponsored Research is provided by Noble Capital Markets, Inc., a FINRA and S.E.C. registered broker-dealer (B/D).

*Analyst certification and important disclosures included in the full report. NOTE: investment decisions should not be based upon the content of this research summary.  Proper due diligence is required before making any investment decision. 

Kelly Services (KELYA) – Gearing Up For Meaningful Change

Tuesday, February 15, 2022

Kelly Services (KELYA)
Gearing Up For Meaningful Change

Kelly Services Inc is a provider of workforce solutions and consulting and staffing services. The company’s operations are divided into three business segments namely Americas Staffing, Global Talent Solutions (“GTS”) and International Staffing. It provides staffing solutions through its branch networks in Americas and International operations and also provides a suite of innovative talent fulfilment and outcome-based solutions through GTS segment. Americas Staffing generates maximum revenue from its operations.

Joe Gomes, Senior Research Analyst, Noble Capital Markets, Inc.

Joshua Zoepfel, Research Associate, Noble Capital Markets, Inc.

Refer to the full report for the price target, fundamental analysis, and rating.

    4Q21. Revenue of $1.25 billion was up 0.7% year-over-year (1.1% in constant currency) but up 6% when adjusting for the additional week in 2021. Consensus was $1.3 billion and we were at $1.31 billion. Kelly reported operating earnings of $15.3 million, compared to $9.5 million in 4Q20, and $19.4 million versus $13.9 million on an adjusted basis. GAAP EPS for 4Q21 was $1.80 compared to $0.59 in 4Q20. Adjusted EPS for the fourth quarter was $0.65 versus $0.41 last year. We had projected adjusted EPS of $0.32.

    Monetization of APAC.  Kelly entered into an agreement to sell nearly all of its PersolKelly JV and its shareholdings in Persol Group. Net cash proceeds are anticipated to be approximately $255 million, or $6.75 per KELYA share. Combined with availability under its credit facilities, Kelly has about $0.5 billion of capital to accelerate its growth in high-margin, high-growth specialties …


This Company Sponsored Research is provided by Noble Capital Markets, Inc., a FINRA and S.E.C. registered broker-dealer (B/D).

*Analyst certification and important disclosures included in the full report. NOTE: investment decisions should not be based upon the content of this research summary.  Proper due diligence is required before making any investment decision. 

Allegiant Gold (AUXXF)(AUAU:CA) – Drilling Program to Commence in March

Tuesday, February 15, 2022

Allegiant Gold (AUXXF)(AUAU:CA)
Drilling Program to Commence in March

Allegiant Gold Ltd is a gold exploration company. Its project profile consists of Bolo, Browns Canyon, Clara Moro, Four Metals, Monitor Hills, Red Hills, Silver Dome, West Goldfield, White Horse Flats, Mogollon, Eastside, Dutch Flat, and others.

Mark Reichman, Senior Research Analyst of Natural Resources, Noble Capital Markets, Inc.

Refer to the full report for the price target, fundamental analysis, and rating.

    New roads improve access to drill targets. Allegiant has completed over 6 kilometers of additional roads at the Eastside project to improve access to the high-grade and east pediment zones and the western anomaly which will be targeted during the upcoming drilling program.

    Drilling to commence in March.  Reverse circulation (RC) drilling will focus on the east pediment zone and the western anomaly and entail 35 holes, including 25 holes at the east pediment zone with an average depth of 200 meters per hole, and 10 holes at the western anomaly with an average depth of 300 meters per hole. Core drilling will begin in May to test the recently discovered high-grade zone …


This Company Sponsored Research is provided by Noble Capital Markets, Inc., a FINRA and S.E.C. registered broker-dealer (B/D).

*Analyst certification and important disclosures included in the full report. NOTE: investment decisions should not be based upon the content of this research summary.  Proper due diligence is required before making any investment decision. 

Michael Burry’s Stock Market Holdings (Filed Feb 14, 2022)


Image Credit: Livewire


Michael Burry’s Public Investments in SPACs, Prisons, and Electric Hogs


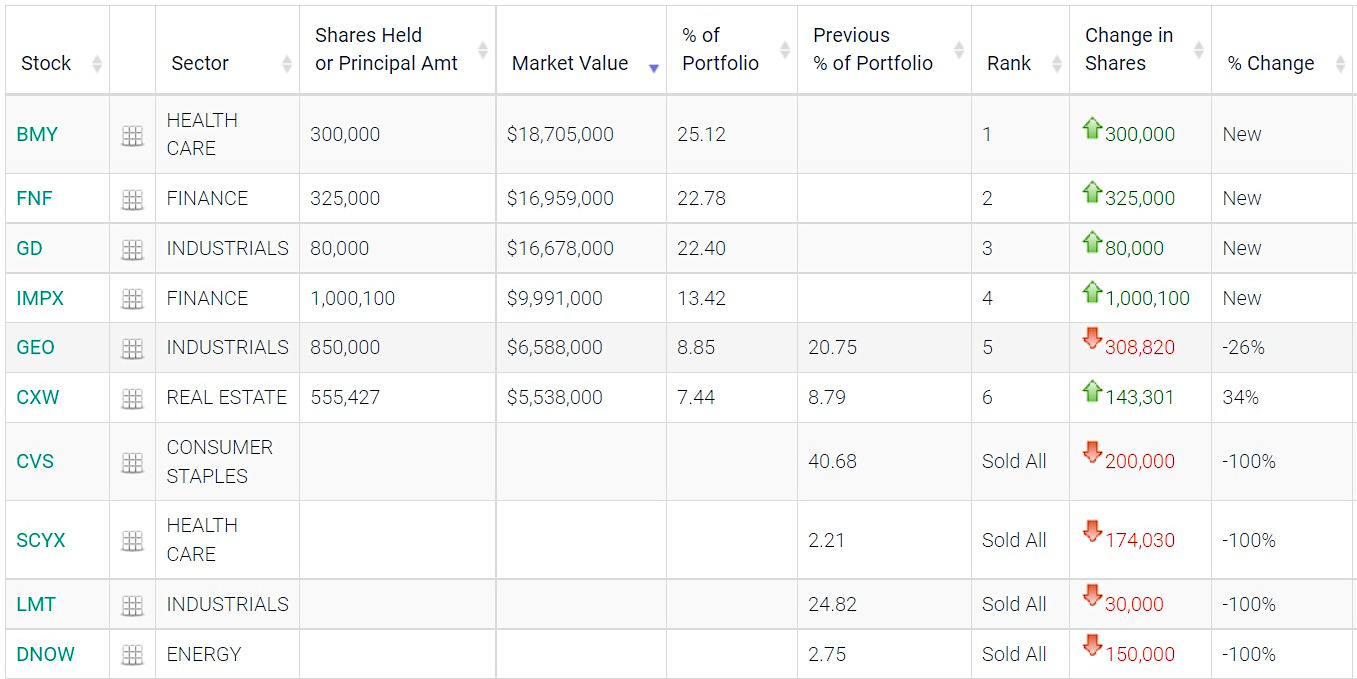
On February 14, Michael Burry filed his company’s holdings report with the SEC.  Relative to the previous quarter there was a little reshuffling of his positions. While many fund managers and successful investors such as Cathie Wood are talking about their ideas several times a week in the news, Burry is more quiet. A good way to understand Burry’s thinking and Scion Asset Management’s direction is to review changes to his 13F holdings. Or, hope for a rare
tweet.

Below we list all of Scion’s public company purchases and sales then provide information so you may drill down even deeper into Burry’s small and microcap holdings.  


Why it Matters

No one would disagree that Burry’s investment universe is broader than the average self-directed investor and even deeper than the average hedge fund manager.  With this in mind, out of the entire universe of publicly held corporations he could hold, there are only six that Burry’s portfolio owned at the end of the fourth quarter. One is a SPAC that is merging with an electric vehicle (EV) company. Two are small-cap holdings Scion had owned the previous quarter – Burry lightened up on one position and added to another. Three new large-cap purchases that round out the rest of the holdings span the defense, finance, and pharmaceutical industries.

Holdings Top to Bottom

Scion’s largest holding is Bristol-Myers Squibb (BMY). BMY had a market value on filing date of $18.7M, Scion’s position represents .014% of the company. The large pharmaceutical company was added last quarter while holdings in drug retailer CVS were brought to zero during the quarter.

Insurance company Fidelity National Financial, Inc. (FNF) provides various insurance products in the US with a large focus on real estate-related products. This includes title insurance, escrow, and other title-related services. FNF also provides technology and transaction services to the real estate and mortgage industries. Plus, life insurance products including annuities. The company had a market value on the filing date
of $16.96M, Scion’s position represents .114% of the company.

General Dynamics Corporation (GD) is a large U.S. aerospace and defense contractor. It operates through four segments: Aerospace, Marine Systems, Combat Systems, and Technologies. GD had a market value on the filing date of $16.68, Scion’s position represents .287% of the company. Scion’s position in defense contractor Lockheed Martin (LMT) was brought to zero during the quarter.

On Dec. 13, 2021 Harley-Davidson, Inc. (HOG), announced that AEA-Bridges Impact Corp. (IMPX), a special purpose acquisition company or SPAC with a focus on sustainability, entered into a definitive business combination agreement under which they will combine with LiveWire. LiveWire which will trade under ticker LVW is Harley-Davidson’s electric motorcycle division. The deal will create a new publicly-traded company. Michael Burry added this SPAC to Scion’s holdings. As of year-end, Scion owned 2.50% of the special purpose company or $9.99M.

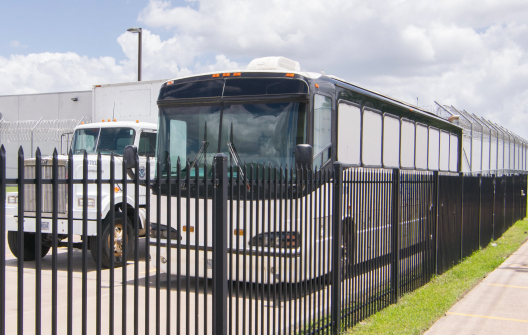
The GEO Group (GEO) is a correctional facility that specializes in the ownership, leasing, and management of correctional, detention, and reentry facilities. The market value of Scion’s position was $6.69 million at quarter-end, which represented 6.94% of the company’s market value. Burry rebalanced this position which was carried over from the previous quarter as he reduced his holdings by 26%.

CoreCivic (CXW) is a publicly owned prison system that was trading as a REIT up until January 2021, it now trades as a Regular C-Corporation. Scion took a position during the third quarter of last year and apparently added to it. Burry’s quarter-end $5.54M position represents .46% of the company. During the quarter Burry increased the share of the company his fund holds by .34%.


Take-Away

Dr. Burry has an excellent record of spotting investment opportunities before the rest of the market catches up. His picks are as disparate as the mortgage market in 2008 and GameStop (GME) in 2020.

Recent research (GEO, CXW), and recorded interviews with management (CXW), and other small/microcap companies are available and regularly updated on Channelchek. Channelchek also closely follows and reports on the SPAC market with SPACtrac coverage and informative articles.

Sign-up to receive updates in your inbox.


Suggested Reading


One Great Protection Inherent in SPACs for Investors


Michael Burry’s Investments in Health, Bombs, and Bars


EV SPAC Activity Accelerated in 2021


Analysis of a SPAC


Sources

https://investor.harley-davidson.com/news-releases/news-release-details/livewire-become-first-publicly-traded-ev-motorcycle-company-us

https://investor.harley-davidson.com/news-releases/news-release-details/livewire-become-first-publicly-traded-ev-motorcycle-company-us

https://whalewisdom.com/filer/scion-asset-management-llc#tabholdings_tab_link

https://13f.info/manager/0001649339-scion-asset-management-llc

https://www.corecivic.com/

https://www.geogroup.com/


Stay up to date. Follow us:


Bunker Hill Announces Appointment Of General Manager And Secures Mining Contractor


Bunker Hill Announces Appointment Of General Manager And Secures Mining Contractor

News and Market Data on Bunker Hill Mining


TORONTO, Feb. 15, 2022 (GLOBE NEWSWIRE) — Bunker Hill Mining Corp. (the “Company”) (CSE: BNKR, OTCQB: BHLL) is pleased to announce the appointment of Tom Francis as General Manager for the Bunker Hill Mine, and the execution of a mining services contract with Coeur d’Alene Mine Contracting LLC (“CMC”).
 

Sam Ash, CEO stated, “A critical driver of our success has been the strength that comes from building a world-class team, which will remain a central focus as we accelerate the restart of the Bunker Hill Mine. Tom’s demonstrated leadership skills and track record are a perfect fit for our needs, and I am pleased to welcome him on our journey towards not just building a mine, but a mining company. He will oversee all operational aspects of the restart of the Bunker Hill Mine including technical services, construction, contract management, and Safety and Health.”

“I am also pleased to announce the appointment of CMC as our mining contractor through planned commercial production. This extends an excellent and productive relationship that began in 2020, during which time they have demonstrated their world-class mining capabilities, knowledge of the Silver Valley, and ability to procure skilled personnel to meet our needs. Importantly, agreed rates are in line with those modelled in our PEA. Together with the MOU for the purchase of Teck’s Pend Oreille process plant for approximately $3 million, we are pleased that key capital and operating costs continue to be in line with estimates.”

APPOINTMENT OF TOM FRANCIS AS GENERAL MANAGER

The Company has appointed Tom Francis as General Manager of the Bunker Hill Mine. Mr. Francis joins the Bunker Hill team after 10 years with Rio Tinto, the second-largest mining company in the world, where he was most recently Mine Manager at the Kennecott Bingham Canyon Mine (“Kennecott”) in Utah, USA, its single largest mining operation. Among other achievements, his team delivered world-class payload metrics on Kennecott’s ultra-class truck fleet while simultaneously increasing average haul truck speeds and tire life. Previous roles with Rio Tinto included responsibility for productivity across the full Kennecott value stream (mine, concentrator, smelter and refinery), three years in the Group strategic investment analysis team assessing its global suite of projects (greenfield, brownfield & closure), and several years in Rio Tinto Exploration (RTX) managing operational support (incl. safety) for Rio Tinto’s Exploration’s projects across Africa and Eurasia.

Prior to his mining experience, Mr. Francis served as an officer in the Royal Marines and UK Special Forces, serving on multiple operational tours in Kosovo, Iraq & Afghanistan. He is a dual national US/UK citizen having lived, studied and worked in both the US and the UK. He holds a first-class degree from the University of Oxford (BA, Mathematics & Computation).

APPOINTMENT OF CMC AS MINING CONTRACTOR

The Company has also agreed a Contract Services Agreement (“CSA”) with Coeur d’Alene Mine Contracting, LLC for underground mining and development requirements through December 31, 2023, by which time it plans to be in commercial production. CMC is a locally owned and operated mining services company based in Idaho’s Silver Valley with extensive contracting experience in the deepest underground mines across North America. Their contract experience spans production, development, mine rehabilitation, mine start-ups and mine closures.

The CSA extends an ongoing relationship with CMC that has seen them work alongside the Bunker Hill team for the last two years, during which time they have performed safely, productively and developed an extensive first-hand knowledge of the Bunker Hill mine. Importantly, CMC has demonstrated an ability to grow in accordance with the step-up in physical activity at Bunker Hill without diluting operational performance. Labor and equipment rates in the CSA are consistent with the Company’s Preliminary Economic Assessment published in November 2021, and CMC has also been advising on and supporting the procurement of necessary additional equipment as operational activity increases.

ABOUT BUNKER HILL MINING CORP.

Under new Idaho-based leadership the Bunker Hill Mining Corp, intends to sustainably restart and develop the Bunker Hill Mine as the first step in consolidating a portfolio of North American mining assets with a focus on silver. Information about the Company is available on its website, www.bunkerhillmining.com , or within the SEDAR and EDGAR databases.

For additional information contact:

David Wiens, CFA

CFO & Corporate Secretary

+1 208 370 3665

ir@bunkerhillmining.com

Cautionary Statements

Certain statements in this news release are forward-looking and involve a number of risks and uncertainties. Such forward-looking statements are within the meaning of that term in Section 27A of the Securities Act of 1933, as amended, and Section 21E of the Securities Exchange Act of 1934, as amended, as well as within the meaning of the phrase ‘forward-looking information’ in the Canadian Securities Administrators’ National Instrument 51-102 – Continuous Disclosure Obligations. Forward-looking statements are not comprised of historical facts. Forward-looking statements include estimates and statements that describe the Company’s future plans, objectives or goals, including words to the effect that the Company or management expects a stated condition or result to occur. Forward-looking statements may be identified by such terms as “believes”, “anticipates”, “expects”, “estimates”, “may”, “could”, “would”, “will”, or “plan”. Since forward-looking statements are based on assumptions and address future events and conditions, by their very nature they involve inherent risks and uncertainties. Although these statements are based on information currently available to the Company, the Company provides no assurance that actual results will meet management’s expectations. Risks, uncertainties and other factors involved with forward-looking information could cause actual events, results, performance, prospects and opportunities to differ materially from those expressed or implied by such forward-looking information.

Forward looking information in this news release includes, but is not limited to, the Company’s intentions regarding its objectives, goals or future plans and statements. Factors that could cause actual results to differ materially from such forward-looking information include, but are not limited to: the ability to predict and counteract the effects of COVID-19 on the business of the Company, including but not limited to the effects of COVID-19 on the price of commodities, capital market conditions, restriction on labour and international travel and supply chains; failure to identify mineral resources; failure to convert estimated mineral resources to reserves; the inability to complete a feasibility study which recommends a production decision; the preliminary nature of metallurgical test results; the Company’s ability to restart and develop the Bunker Hill Mine and the risks of not basing a production decision on a feasibility study of mineral reserves demonstrating economic and technical viability, resulting in increased uncertainty due to multiple technical and economic risks of failure which are associated with this production decision including, among others, areas that are analyzed in more detail in a feasibility study, such as applying economic analysis to resources and reserves, more detailed metallurgy and a number of specialized studies in areas such as mining and recovery methods, market analysis, and environmental and community impacts and, as a result, there may be an increased uncertainty of achieving any particular level of recovery of minerals or the cost of such recovery, including increased risks associated with developing a commercially mineable deposit with no guarantee that production will begin as anticipated or at all or that anticipated production costs will be achieved; failure to commence production would have a material adverse impact on the Company’s ability to generate revenue and cash flow to fund operations; failure to achieve the anticipated production costs would have a material adverse impact on the Company’s cash flow and future profitability; delays in obtaining or failures to obtain required governmental, environmental or other project approvals; political risks; changes in equity markets; uncertainties relating to the availability and costs of financing needed in the future; the inability of the Company to budget and manage its liquidity in light of the failure to obtain additional financing, including the ability of the Company to complete the payments pursuant to the terms of the agreement to acquire the Bunker Hill Mine Complex; inflation; changes in exchange rates; fluctuations in commodity prices; delays in the development of projects; capital, operating and reclamation costs varying significantly from estimates and the other risks involved in the mineral exploration and development industry; and those risks set out in the Company’s public documents filed on SEDAR. Although the Company believes that the assumptions and factors used in preparing the forward-looking information in this news release are reasonable, undue reliance should not be placed on such information, which only applies as of the date of this news release, and no assurance can be given that such events will occur in the disclosed time frames or at all. The Company disclaims any intention or obligation to update or revise any forward-looking information, whether as a result of new information, future events or otherwise, other than as required by law. No stock exchange, securities commission or other regulatory authority has approved or disapproved the information contained herein.

Cautionary Note to United States Investors Concerning Estimates of Measured, Indicated and Inferred Resources

This press release has been prepared in accordance with the requirements of the securities laws in effect in Canada, which differ from the requirements of U.S. securities laws. Unless otherwise indicated, all resource and reserve estimates included in this press release have been disclosed in accordance with NI 43-101 and the Canadian Institute of Mining, Metallurgy, and Petroleum Definition Standards on Mineral Resources and Mineral Reserves. NI 43-101 is a rule developed by the Canadian Securities Administrators which establishes standards for all public disclosure an issuer makes of scientific and technical information concerning mineral projects. Canadian disclosure standards, including NI 43-101, differ significantly from the requirements of the United States Securities and Exchange Commission (“SEC”), and resource and reserve information contained in this press release may not be comparable to similar information disclosed by U.S. companies. In particular, and without limiting the generality of the foregoing, the term “resource” does not equate to the term “reserves”. Under U.S. standards, mineralization may not be classified as a “reserve” unless the determination has been made that the mineralization could be economically and legally produced or extracted at the time the reserve determination is made. The SEC’s disclosure standards normally do not permit the inclusion of information concerning “measured mineral resources”, “indicated mineral resources” or “inferred mineral resources” or other descriptions of the amount of mineralization in mineral deposits that do not constitute “reserves” by U.S. standards in documents filed with the SEC. Investors are cautioned not to assume that any part or all of mineral deposits in these categories will ever be converted into reserves. U.S. investors should also understand that “inferred mineral resources” have a great amount of uncertainty as to their existence and great uncertainty as to their economic and legal feasibility. It cannot be assumed that all or any part of an “inferred mineral resource” will ever be upgraded to a higher category. Investors are cautioned not to assume that all or any part of an “inferred mineral resource” exists or is economically or legally mineable. Disclosure of “contained ounces” in a resource is permitted disclosure under Canadian regulations; however, the SEC normally only permits issuers to report mineralization that does not constitute “reserves” by SEC standards as in-place tonnage and grade without reference to unit measures. The requirements of NI 43-101 for disclosure of “reserves” are also not the same as those of the SEC, and reserves disclosed by the Company in accordance with NI 43-101 may not qualify as “reserves” under SEC standards. Accordingly, information concerning mineral deposits contained in our website may not be comparable with information made public by companies that report in accordance with U.S. standards.

Michael Burrys Stock Market Holdings Filed Feb 14, 2022


Image Credit: Livewire


Michael Burry’s Public Investments in SPACs, Prisons, and Electric Hogs


NEW Filing: Michael Burry’s Stock Market Holdings (Filed May 16, 2022)

On February 14, Michael Burry filed his company’s holdings report with the SEC.  Relative to the previous quarter there was a little reshuffling of his positions. While many fund managers and successful investors such as Cathie Wood are talking about their ideas several times a week in the news, Burry is more quiet. A good way to understand Burry’s thinking and Scion Asset Management’s direction is to review changes to his 13F holdings. Or, hope for a rare
tweet.

Below we list all of Scion’s public company purchases and sales then provide information so you may drill down even deeper into Burry’s small and microcap holdings.  


Why it Matters

No one would disagree that Burry’s investment universe is broader than the average self-directed investor and even deeper than the average hedge fund manager.  With this in mind, out of the entire universe of publicly held corporations he could hold, there are only six that Burry’s portfolio owned at the end of the fourth quarter. One is a SPAC that is merging with an electric vehicle (EV) company. Two are small-cap holdings Scion had owned the previous quarter – Burry lightened up on one position and added to another. Three new large-cap purchases that round out the rest of the holdings span the defense, finance, and pharmaceutical industries.

Holdings Top to Bottom

Scion’s largest holding is Bristol-Myers Squibb (BMY). BMY had a market value on filing date of $18.7M, Scion’s position represents .014% of the company. The large pharmaceutical company was added last quarter while holdings in drug retailer CVS were brought to zero during the quarter.

Insurance company Fidelity National Financial, Inc. (FNF) provides various insurance products in the US with a large focus on real estate-related products. This includes title insurance, escrow, and other title-related services. FNF also provides technology and transaction services to the real estate and mortgage industries. Plus, life insurance products including annuities. The company had a market value on the filing date
of $16.96M, Scion’s position represents .114% of the company.

General Dynamics Corporation (GD) is a large U.S. aerospace and defense contractor. It operates through four segments: Aerospace, Marine Systems, Combat Systems, and Technologies. GD had a market value on the filing date of $16.68, Scion’s position represents .287% of the company. Scion’s position in defense contractor Lockheed Martin (LMT) was brought to zero during the quarter.

On Dec. 13, 2021 Harley-Davidson, Inc. (HOG), announced that AEA-Bridges Impact Corp. (IMPX), a special purpose acquisition company or SPAC with a focus on sustainability, entered into a definitive business combination agreement under which they will combine with LiveWire. LiveWire which will trade under ticker LVW is Harley-Davidson’s electric motorcycle division. The deal will create a new publicly-traded company. Michael Burry added this SPAC to Scion’s holdings. As of year-end, Scion owned 2.50% of the special purpose company or $9.99M.

The GEO Group (GEO) is a correctional facility that specializes in the ownership, leasing, and management of correctional, detention, and reentry facilities. The market value of Scion’s position was $6.69 million at quarter-end, which represented 6.94% of the company’s market value. Burry rebalanced this position which was carried over from the previous quarter as he reduced his holdings by 26%.

CoreCivic (CXW) is a publicly owned prison system that was trading as a REIT up until January 2021, it now trades as a Regular C-Corporation. Scion took a position during the third quarter of last year and apparently added to it. Burry’s quarter-end $5.54M position represents .46% of the company. During the quarter Burry increased the share of the company his fund holds by .34%.


Take-Away

Dr. Burry has an excellent record of spotting investment opportunities before the rest of the market catches up. His picks are as disparate as the mortgage market in 2008 and GameStop (GME) in 2020.

Recent research (GEO, CXW), and recorded interviews with management (CXW), and other small/microcap companies are available and regularly updated on Channelchek. Channelchek also closely follows and reports on the SPAC market with SPACtrac coverage and informative articles.

Sign-up to receive updates in your inbox.


Suggested Reading


One Great Protection Inherent in SPACs for Investors


Michael Burry’s Investments in Health, Bombs, and Bars


EV SPAC Activity Accelerated in 2021


Analysis of a SPAC


Sources

https://investor.harley-davidson.com/news-releases/news-release-details/livewire-become-first-publicly-traded-ev-motorcycle-company-us

https://investor.harley-davidson.com/news-releases/news-release-details/livewire-become-first-publicly-traded-ev-motorcycle-company-us

https://whalewisdom.com/filer/scion-asset-management-llc#tabholdings_tab_link

https://13f.info/manager/0001649339-scion-asset-management-llc

https://www.corecivic.com/

https://www.geogroup.com/


Stay up to date. Follow us:


Release – Euroseas Ltd. Reports Results for the Year and Quarter Ended December 31 2021


Euroseas Ltd. Reports Results for the Year and Quarter Ended December 31, 2021

Research, News, and Market Data on Euroseas Ltd


ATHENS, Greece, Feb. 15, 2022 (GLOBE NEWSWIRE) — Euroseas Ltd. (NASDAQ: ESEA, the “Company” or “Euroseas”), an owner and operator of container carrier vessels and provider of seaborne transportation for containerized cargoes, announced today its results for the three-month period and full year ended December 31, 2021.

Fourth Quarter 2021 Financial Highlights:

  • Total net revenues of $38.3 million. Net income and net income attributable to common shareholders of $22.7 million or $3.14 and $3.13 earnings per share basic and diluted, respectively. Adjusted net income attributable to common shareholders1 for the period was $22.9 million or $3.18 and $3.17 per share basic and diluted, respectively.

  • Adjusted EBITDA1 was $26.1 million.

  • An average of 15.01 vessels were owned and operated during the fourth quarter of 2021 earning an average time charter equivalent rate of $29,994 per day.

Full Year 2021 Highlights:

  • Total net revenues of $93.9 million. Net income of $42.9 million; net income attributable to common shareholders (after a $0.3 million dividend on Series B Preferred Shares and a $0.3 million of preferred deemed dividend arising out of the redemption of approximately $8.4 million of Series B Preferred Shares in the first half of 2021) of $42.3 million or $6.06 and $6.05 earnings per share basic and diluted, respectively. Adjusted net income attributable to common shareholders1 for the period was $42.0 million or $6.02 and $6.01 per share basic and diluted, respectively.

  • Adjusted EBITDA1 was $52.7 million.

  • An average of 14.25 vessels were owned and operated during the year 2021, earning an average time charter equivalent rate of $19,309 per day.

Recent developments

  • On January 28, 2022, we signed a contract for the construction of two additional Eco design fuel efficient containerships. The vessels will have a carrying capacity of about 2,800 teu each and will be built at Hyundai Mipo Dockyard Co. in South Korea. The two newbuildings are scheduled to be delivered during the fourth quarter of 2023 and first quarter of 2024, respectively. The total consideration for each of these two newbuilding contracts is approximately $43.15 million and will be financed with a combination of debt and equity. The vessels are sisterships of a pair of vessels ordered by Euroseas Ltd. in June 2021.

_____________________________________________
1Adjusted EBITDA, Adjusted net income and Adjusted earnings per share are not recognized measurements under U.S. GAAP (GAAP) and should not be used in isolation or as a substitute for Euroseas financial results presented in accordance with GAAP. Refer to a subsequent section of the Press Release for the definitions and reconciliation of these measurements to the most directly comparable financial measures calculated and presented in accordance with GAAP.

Aristides Pittas, Chairman and CEO of Euroseas commented:
“The fourth quarter of 2021 was a seminal one for Euroseas as we recorded the highest net income level in our history of about $22.7 million. At the same time, we have chartered about 92% of our available capacity in 2022, about 62% of our available capacity in 2023, and even about 40% of our available days in 2024. The high level of our contracted revenues secures extremely high profitability levels for Euroseas over the next two to three years.”

“In light of the increased environmental regulation that would reduce -on average- the transportation capacity of the existing fleet, we have shifted our strategic focus on how to position Euroseas post-pandemic and beyond. In this context, in January 2022, we placed an order for two more 2,800 teu vessels that we expect to have delivered in the fourth quarter of 2023 and first quarter of 2024. This brings our newbuilding program to four vessels and solidifies our market presence in the large eco feeder sector.”

“The retreat of the containerships rates during November and December 2021 proved to be short-lived. With the turn of the year, containership rates started increasing again and have returned to -and for some segments exceeded- the record high levels set only four months ago in October 2021. We are quite optimistic about the strength of the market over the next couple of years despite the expected easing of the inefficiencies in ports, due to the limited deliveries in the near term and the constraints on effective fleet supply of the emissions regulations from 2023 onwards alongside trade growth which has rebounded from the pandemic lows. We continuously monitor market developments and evaluate investment opportunities focusing on creating consistent returns for our shareholders and exploiting our public listing and increasing liquidity position.”

Tasos Aslidis, Chief Financial Officer of Euroseas commented: “The operating results of the fourth quarter of 2021 reflect the increased levels of charter rates in the containership markets as compared to the same period of 2020, with net income amounting to $22.7 million for the fourth quarter in 2021 compared to a net income of $0.6 million for the fourth quarter of 2020. On average, during the fourth quarter of 2021, our vessels earned approximately 185.7% higher time charter equivalent rates compared to the fourth quarter of 2020.”

“Total daily vessel operating expenses, including management fees, general and administrative expenses, but excluding drydocking costs, were higher by 7.6% during the fourth quarter of 2021 compared to the same quarter of last year. The increased operating expenses for the fourth quarter of 2021 are mainly due to higher hull and machinery insurance premiums and the increased crewing costs for our vessels resulting from difficulties in crew rotation due to COVID-19 related restrictions. Adjusted EBITDA during the fourth quarter of 2021 was $26.1 million compared to the $2.1 million achieved in fourth quarter of last year, and it reached $52.7 million versus $11.8 million for the respective twelve-month periods of 2021 and 2020.”

“As of December 31, 2021, our outstanding bank debt (excluding the unamortized loan fees) was $119.0 million, versus restricted and unrestricted cash of approximately $31.5 million. As of the same date, our scheduled debt repayments over the next 12 months amounted to about $29.3 million (excluding the unamortized loan fees).”

Fourth Quarter 2021 Results:
For the fourth quarter of 2021, the Company reported total net revenues of $38.3 million representing a 217.9% increase over total net revenues of $12.0 million during the fourth quarter of 2020, which was the result of the increased average time charter rates our vessels earned in the fourth quarter of 2021 compared to the corresponding period of 2020. The Company reported net income and net income attributable to common shareholders for the period of $22.7 million, as compared to a net income of $0.6 million and a net income attributable to common shareholders of $0.4 million for the fourth quarter of 2020.

Vessel operating expenses for the same period of 2021 amounted to $8.3 million as compared to $7.5 million for the same period of 2020. The increased amount is mainly due to the higher number of vessels owned and operated in the three months of 2021 compared to the same period of 2020, as well as the increased crewing costs for our vessels compared to the same period of 2020, resulting from difficulties in crew rotation due to COVID-19 related restrictions and the increase in hull and machinery insurance premiums. Drydocking expenses amounted to $1.2 million during the fourth quarter of 2021 comprising the cost of one vessel completing her special survey with drydock. For the same period of 2020 drydocking expenses amounted to $0.1 million comprising the cost of one vessel completing her intermediate survey in-water. Depreciation expense for the fourth quarter of 2021 increased to $2.4 million from $1.6 million in the fourth quarter of 2020, as a result of the increased number of vessels operated and the fact that the new vessels acquired in the fourth quarter of 2021 have a higher average daily depreciation charge as a result of their higher acquisition price compared to the remaining vessels. General and administrative expenses increased to $1.2 million in the fourth quarter of 2021, as compared to $0.8 million in the fourth quarter of 2020, mainly due to higher executive compensation expenses.

On average, 15.01 vessels were owned and operated during the fourth quarter of 2021 earning an average time charter equivalent rate of $29,994 per day compared to 14.43 vessels in the same period of 2020 earning on average $10,497 per day.

Interest and other financing costs for the fourth quarter of 2021 amounted to $0.78 million compared to $0.81 million for the same period of 2020. This decrease is due to the decrease in the weighted average LIBOR rate, partly offset by the increase in the Company’s average outstanding indebtedness in the current period compared to the same period of 2020.

Adjusted EBITDA1 for the fourth quarter of 2021 was $26.1 million compared to $2.1 million for the corresponding period in 2020.

Basic and diluted earnings per share attributable to common shareholders for the fourth quarter of 2021 was $3.14 and $3.13 calculated on 7,210,466 and 7,244,042 basic and diluted weighted average number of shares outstanding, respectively, compared to basic and diluted earnings per share of $0.07 for the fourth quarter of 2020, calculated on 6,149,300 basic and diluted weighted average number of shares outstanding.

Excluding the effect on the income attributable to common shareholders for the quarter of the unrealized loss on derivatives, the amortization of below market time charters acquired and the depreciation charged due to the increased value of the vessel acquired with below market time charter, the adjusted earnings attributable to common shareholders for the quarter ended December 31, 2021 would have been $3.18 and $3.17 per share basic and diluted, respectively, compared to an adjusted loss of $0.16 per share basic and diluted for the quarter ended December 31, 2020, after excluding unrealized gain on derivatives, net gain on sale of vessels, the amortization of below market time charters acquired and the depreciation charged due to the increased value of the vessels acquired with below market time charters. Usually, security analysts do not include the above items in their published estimates of earnings per share.

Full Year 2021 Results:
For the full year of 2021, the Company reported total net revenues of $93.9 million, representing a 76.2% increase, over total net revenues of $53.3 million during the twelve months of 2020. The Company reported a net income for the year of $42.9 million and a net income attributable to common shareholders of $42.3 million, as compared to a net income of $4.0 million and a net income attributable to common shareholders of $3.3 million for the twelve months of 2020. The results for the twelve months of 2021 include a $0.2 million of amortization of below market time charters acquired and a $0.2 million unrealized gain on derivatives. The results for the twelve months of 2020 included a $1.7 million of amortization of below market time charters acquired, a $0.6 million unrealized loss on derivatives, a $2.5 million net gain on sale of vessels and a $0.1 million loss on write-down of vessel held for sale.

Vessel operating expenses for the twelve months of 2021 amounted to $29.7 million as compared to $32.2 million for the same period of 2020. This decrease in vessel operating expenses is due to the lower average number of vessels operated by the Company in the twelve months of 2021 as compared to the same period of 2020, partly offset by the increased crewing costs for our vessels compared to the same period of 2020, resulting from difficulties in crew rotation due to COVID-19 related restrictions and the increase in hull and machinery insurance premiums. Depreciation expense for the twelve months of 2021 was $7.2 million compared to $6.6 million during the same period of 2020. Although the average number of vessels operating decreased in 2021 as compared to the same period of 2020, the new vessels acquired in the fourth quarter of 2021 have a higher average daily depreciation charge as a result of their higher acquisition price compared to the vessels sold during 2020, some of which were also fully depreciated.

Related party management fees for the twelve months of 2021 were $4.3 million compared to $5.3 million for the same period of 2020. This decrease in related party management fees is due to the lower average number of vessels operated by the Company in the twelve months of 2021 as compared to the same period of 2020, as well as due to termination fees paid in 2020 for the vessels sold during last year, in accordance with the management agreement. General and administrative expenses increased to $3.5 million during the twelve months of 2021 as compared to $3.0 million in the last year, mainly due to higher executive compensation expenses.

Drydocking expenses amounted to $4.1 million for the twelve months of 2021 (three vessels passed their special survey with drydock), compared to $0.5 million for the same period of 2020 (one vessel passed her intermediate survey in-water and three vessels passed their special survey in-water).

On average, 14.25 vessels were owned and operated during the twelve months of 2021 earning an average time charter equivalent rate of $19,309 per day compared to 17.23 vessels in the same period of 2020 earning on average $9,445 per day.

Interest and other financing costs for the twelve months of 2021 amounted to $2.8 million compared to $4.1million for the same period of 2020. This decrease is due to the decrease in the weighted average LIBOR rate, partly offset by the increase in the Company’s average outstanding indebtedness in the current period compared to the same period of 2020.

Adjusted EBITDA1 for the twelve months of 2021 was $52.7 million compared to $11.8 million during the twelve months of 2020.

Basic and diluted earnings per share attributable to common shareholders for the twelve months of 2021 was $6.06 and $6.05, calculated on 6,976,905 and 6,993,405 basic and diluted weighted average number of shares outstanding, respectively, compared to basic and diluted earnings per share of $0.58 for the twelve months of 2020, calculated on 5,753,917 basic and diluted weighted average number of shares outstanding.

Excluding the effect on the income attributable to common shareholders for the twelve months of 2021 of the unrealized gain on derivatives, the amortization of the below market time charters acquired, the depreciation charged due to the increased value of the vessel acquired with below market time charter and the net loss on sale of vessel, the adjusted earnings attributable to common shareholders for the year ended December 31, 2021 would have been $6.02 and $6.01 basic and diluted, respectively, compared to adjusted loss of $0.02 per share basic and diluted for 2020, after excluding unrealized loss on derivatives, net gain on sale of vessels, loss on write down of vessel held for sale, amortization of the below market time charters acquired and the depreciation charged due to the increased value of the vessels acquired with below market time charters. As previously mentioned, usually, security analysts do not include the above items in their published estimates of earnings per share.

Fleet Profile:

The Euroseas Ltd. fleet profile is as follows:

Name

Type

Dwt

TEU

Year Built

Employment(*)

TCE Rate ($/day)

Container Carriers

MARCOS V

Intermediate

72,968

6,350

2005

TC until Dec-24
plus 12 months option

$42,200
option $15,000

AKINADA BRIDGE (*)

Intermediate

71,366

5,610

2001

TC until Oct-22

$20,000

SYNERGY BUSAN (*)

Intermediate

50,726

4,253

2009

TC until Aug-24

$25,000

SYNERGY ANTWERP (+)

Intermediate

50,726

4,253

2008

TC until Dec-23

$18,000

SYNERGY OAKLAND (*)

Intermediate

50,787

4,253

2009

TC until Apr-22
then until Mar-26

$160,000 (***)
$42,000

SYNERGY KEELUNG (+)

Intermediate

50,969

4,253

2009

TC until Jun-22
plus 8-12 months option

$11,750
option $14,500

EM KEA (*)

Feeder

42,165

3,100

2007

TC until May-23

$22,000

EM ASTORIA (+)

Feeder

35,600

2,788

2004

TC until Feb-22
then until Feb-23
then until Feb-24
then until Feb-25

$18,650
$65,000
$50,000
$20,000

EVRIDIKI G (*)

Feeder

34,677

2,556

2001

TC until Feb-25

$40,000

EM CORFU (*)

Feeder

34,654

2,556

2001

TC until Feb-25

$40,000

DIAMANTIS P (*)

Feeder

30,360

2,008

1998

TC until Oct-24

$27,000

EM SPETSES (*)

Feeder

23,224

1,740

2007

TC until Aug-24

$29,500

JONATHAN P (*)

Feeder

23,351

1,740

2006

TC until Sep-24

$26,662(**)

EM HYDRA (*)

Feeder

23,351

1,740

2005

TC until Apr-23

$20,000

JOANNA (*)

Feeder

22,301

1,732

1999

TC until Oct-22

$16,800

AEGEAN EXPRESS (*)

Feeder

18,581

1,439

1997

TC until Mar-22

$11,500

Total Container Carriers

16

635,806

50,371

Vessels under construction

Type

Dwt

TEU

To be delivered

H4201

Feeder

37,237

2,800

Q1 2023

H4202

Feeder

37,237

2,800

Q2 2023

H4236

Feeder

37,237

2,800

Q4 2023

H4237

Feeder

37,237

2,800

Q1 2024

Notes:

(*) TC denotes time charter. All dates listed are the earliest redelivery dates under each time charter unless the contract rate is lower than the current market rate in which cases the latest redelivery date is assumed; vessels with the latest redelivery date shown are marked by (+).

(**) Rate is net of commissions (which are typically 5-6.25%)

(***) The previous charter of M/V Synergy Oakland of $202,000/day exceeded its maximum duration by about 25 days due to port delays with payment of the higher ($202,000/day) rate to the Company continuing during the extension. However, the extension resulted in the loss of the subsequent short-term charter of $130,000/day that was to be performed before the 4-year charter starts. The vessel, after an idle period of 15 days, was chartered for a single voyage charter at $160,000/day after the completion of which it will commence the 4-yr charter; the new charter arrangements will result in about the same average rate and total revenues as the original arrangements.

Summary Fleet Data:

Three Months, Ended
December 31, 2020

Three Months, Ended
December 31, 2021

Twelve Months, Ended
December 31, 2020

Twelve Months, Ended
December 31, 2021

FLEET DATA

Average number of vessels (1)

14.43

15.01

17.23

14.25

Calendar days for fleet (2)

1,328.0

1,381.0

6,306.0

5,203.0

Scheduled off-hire days incl. laid-up (3)

73.1

31.1

283.4

88.4

Available days for fleet (4) = (2) – (3)

1,254.9

1,349.9

6,022.6

5,114.6

Commercial off-hire days (5)

18.5

150.6

Operational off-hire days (6)

46.6

20.5

118.1

77.2

Voyage days for fleet (7) = (4) – (5) – (6)

1,189.8

1,329.4

5,753.9

5,037.4

Fleet utilization (8) = (7) / (4)

94.8%

98.5%

95.5%

98.5%

Fleet utilization, commercial (9) = ((4) – (5)) / (4)

98.5%

100.0%

97.5%

100.0%

Fleet utilization, operational (10) = ((4) – (6)) / (4)

96.3%

98.5%

98.0%

98.5%

AVERAGE DAILY RESULTS (usd/day)

Time charter equivalent rate (11)

10,497

29,994

9,445

19,309

Vessel operating expenses excl. drydocking expenses (12)

6,586

6,807

5,949

6,541

General and administrative expenses (13)

578

901

482

671

Total vessel operating expenses (14)

7,164

7,708

6,431

7,212

Drydocking expenses (15)

75

866

85

787

(1) Average number of vessels is the number of vessels that constituted the Company’s fleet for the relevant period, as measured by the sum of the number of calendar days each vessel was a part of the Company’s fleet during the period divided by the number of calendar days in that period.

(2) Calendar days. We define calendar days as the total number of days in a period during which each vessel in our fleet was in our possession including off-hire days associated with major repairs, drydockings or special or intermediate surveys or days of vessels in lay-up. Calendar days are an indicator of the size of our fleet over a period and affect both the amount of revenues and the amount of expenses that we record during that period.

(3) The scheduled off-hire days including vessels laid-up, vessels committed for sale or vessels that suffered unrepaired damages, are days associated with scheduled repairs, drydockings or special or intermediate surveys or days of vessels in lay-up, or with vessels that were committed for sale or suffered unrepaired damages.

(4) Available days. We define available days as the Calendar days in a period net of scheduled off-hire days as defined above. We use available days to measure the number of days in a period during which vessels were available to generate revenues.

(5) Commercial off-hire days. We define commercial off-hire days as days a vessel is idle without employment.

(6) Operational off-hire days. We define operational off-hire days as days associated with unscheduled repairs or other off-hire time related to the operation of the vessels.

(7) Voyage days. We define voyage days as the total number of days in a period during which each vessel in our fleet was in our possession net of commercial and operational off-hire days. We use voyage days to measure the number of days in a period during which vessels actually generate revenues or are sailing for repositioning purposes.

(8) Fleet utilization. We calculate fleet utilization by dividing the number of our voyage days during a period by the number of our available days during that period. We use fleet utilization to measure a company’s efficiency in finding suitable employment for its vessels and minimizing the amount of days that its vessels are off-hire for reasons such as unscheduled repairs or days waiting to find employment.

(9) Fleet utilization, commercial. We calculate commercial fleet utilization by dividing our available days net of commercial off-hire days during a period by our available days during that period.

(10) Fleet utilization, operational. We calculate operational fleet utilization by dividing our available days net of operational off-hire days during a period by our available days during that period.

(11) Time charter equivalent rate, or TCE rate, is a measure of the average daily net revenue performance of our vessels. Our method of calculating TCE is determined by dividing time charter revenue and voyage charter revenue net of voyage expenses by voyage days for the relevant time period. Voyage expenses primarily consist of port, canal and fuel costs that are unique to a particular voyage, which would otherwise be paid by the charterer under a time charter contract, or are related to repositioning the vessel for the next charter. TCE is a standard shipping industry performance measure used primarily to compare period-to-period changes in a shipping company’s performance despite changes in the mix of charter types (i.e., spot voyage charters, time charters and bareboat charters) under which the vessels may be employed between the periods. Our definition of TCE may not be comparable to that used by other companies in the shipping industry.

(12) Daily vessel operating expenses, which includes crew costs, provisions, deck and engine stores, lubricating oil, insurance, maintenance and repairs and management fees are calculated by dividing vessel operating expenses and related party management fees by fleet calendar days for the relevant time period. Drydocking expenses are reported separately.

(13) Daily general and administrative expense is calculated by dividing general and administrative expenses by fleet calendar days for the relevant time period.

(14) Total vessel operating expenses, or TVOE, is a measure of our total expenses associated with operating our vessels. TVOE is the sum of vessel operating expenses, management fees and general and administrative expenses; drydocking expenses are not included. Daily TVOE is calculated by dividing TVOE by fleet calendar days for the relevant time period.

(15) Drydocking expenses include expenses during drydockings that would have been capitalized and amortized under the deferral method, divided by the fleet calendar days for the relevant period. Drydocking expenses could vary substantially from period to period depending on how many vessels underwent drydocking during the period. The Company expenses drydocking expenses as incurred.

Conference Call and Webcast:
Today, Tuesday, February 15, 2022 at 10:30 a.m. Eastern Standard Time, the Company’s management will host a conference call to discuss the results.

Conference Call details:
Participants should dial into the call 10 minutes before the scheduled time using the following numbers: 1 (877) 553-9962 (US Toll Free Dial In), 0(808) 238- 0669 (UK Toll Free Dial In) or +44 (0) 2071 928592 (Standard International Dial In). Please quote “Euroseas” to the operator.

Audio Webcast – Slides Presentation:
There will be a live and then archived webcast of the conference call and accompanying slides, available through the Company’s website. To listen to the archived audio file, visit our website http://www.euroseas.gr and click on Company Presentations under our Investor Relations page. Participants to the live webcast should register on the website approximately 10 minutes prior to the start of the webcast.

The slide presentation on the fourth quarter ended December 31, 2021 will also be available in PDF format minutes prior to the conference call and webcast, accessible on the company’s website (www.euroseas.gr) on the webcast page. Participants to the webcast can download the PDF presentation.

Euroseas Ltd.
Unaudited Consolidated Condensed Statements of Operations
(All amounts expressed in U.S. Dollars – except number of shares)

Three Months Ended
December 31,

Three Months Ended
December 31,

Twelve Months Ended
December 31,

Twelve Months Ended
December 31,

2020

2021

2020

2021

Revenues

Time charter revenue

12,532,549

39,999,276

55,681,124

97,979,667

Commissions

(499,174)

(1,745,138)

(2,378,007)

(4,085,717)

Net revenues

12,033,375

38,254,138

53,303,117

93,893,950

Operating expenses/ (income)

Voyage expenses

43,467

124,742

1,334,259

713,448

Vessel operating expenses

7,501,283

8,307,463

32,219,689

29,739,437

Drydocking expenses

99,093

1,195,712

536,199

4,094,693

Vessel depreciation

1,604,139

2,413,569

6,605,976

7,203,198

Related party management fees

1,244,394

1,093,684

5,293,199

4,294,789

Net (gain) / loss on sale of vessels

(1,148,720)

(2,453,736)

9,417

General and administrative expenses

767,229

1,244,023

3,041,435

3,491,120

Other operating income

(2,687,205)

(1,298,318)

Loss on write down of vessel held for sale

121,165

Total operating expenses, net

10,110,885

14,379,193

44,010,981

48,247,784

Operating income

1,922,490

23,874,945

9,292,136

45,646,166

Other (expenses)/ income

Interest and other financing costs

(805,076)

(776,652)

(4,125,150)

(2,779,729)

Loss on debt extinguishment

(491,571)

(491,571)

Loss on derivatives, net

(23,357)

(448,449)

(587,988)

(27,141)

Foreign exchange (loss) / gain

(20,469)

26,497

(63,007)

34,418

Interest income

820

541

17,011

3,510

Other expenses, net

(1,339,653)

(1,198,063)

(5,250,705)

(2,768,942)

Net income

582,837

22,676,882

4,041,431

42,877,224

Dividend Series B Preferred shares

(168,676)

(693,297)

(255,324)

Preferred deemed dividend

(345,423)

Net income attributable to common shareholders

414,161

22,676,882

3,348,134

42,276,477

Weighted average number of shares outstanding, basic

6,149,300

7,210,466

5,753,917

6,976,905

Earnings per share attributable to common shareholders – basic

0.07

3.14

0.58

6.06

Weighted average number of shares outstanding, diluted

6,149,300

7,244,042

5,753,917

6,993,405

Earnings per share attributable to common shareholders – diluted

0.07

3.13

0.58

6.05

Euroseas Ltd.,
Unaudited Consolidated Condensed Balance Sheets
(All amounts expressed in U.S. Dollars – except number of shares)

December 31,
2020

December 31,
2021

ASSETS

(unaudited)

Current Assets:

Cash and cash equivalents

3,559,399

26,530,944

Trade accounts receivable, net

2,013,023

1,274,729

Other receivables

1,866,624

1,722,885

Inventories

1,662,422

2,185,740

Restricted cash

345,010

167,285

Prepaid expenses

244,315

382,729

Derivatives

540,753

Total current assets

9,690,793

32,805,065

Fixed assets:

Vessels, net

98,458,447

176,286,989

Long-term assets:

Advances for vessels under construction

7,615,958

Restricted cash

2,433,768

4,800,000

Total assets

110,583,008

221,508,012

LIABILITIES, MEZZANINE EQUITY AND SHAREHOLDERS’ EQUITY

Current liabilities:

Long-term bank loans, current portion

20,645,320

29,034,049

Related party loan, current

2,500,000

Trade accounts payable

2,854,377

2,804,194

Accrued expenses

1,300,420

1,702,925

Accrued preferred dividends

168,676

Deferred revenue

949,364

3,293,986

Derivatives

203,553

Due to related company

24,072

309,969

Total current liabilities

28,645,782

37,145,123

Long-term liabilities:

Long -term bank loans, net of current portion

46,220,028

89,004,951

Derivatives

362,195

952,666

Fair value of below market time charters acquired

17,634,812

Total long-term liabilities

46,582,223

107,592,429

Total liabilities

75,228,005

144,737,552

Mezzanine equity:

Series B Preferred shares (par value $0.01, 20,000,000 shares authorized, 8,000 and nil issued and outstanding, respectively)

8,019,636

Shareholders’ equity:

Common stock (par value $0.03, 200,000,000 shares authorized, 6,708,946 and 7,294,541 issued and outstanding, respectively)

201,268

218,836

Additional paid-in capital

257,467,980

264,609,028

Accumulated deficit

(230,333,881)

(188,057,404)

Total shareholders’ equity

27,335,367

76,770,460

Total liabilities, mezzanine and shareholders’ equity

110,583,008

221,508,012

Euroseas Ltd.
Unaudited Consolidated Condensed Statements of Cash Flows
(All amounts expressed in U.S. Dollars)

Twelve Months
Ended December 31,

Twelve Months
Ended December 31,

2020

2021

Cash flows from operating activities:

Net income

4,041,431

42,877,224

Adjustments to reconcile net income to net cash provided by operating activities:

Vessel depreciation

6,605,976

7,203,198

Amortization and write off of deferred charges

288,163

223,492

Share-based compensation

121,631

182,324

Gain on hull & machinery claim

(2,687,205)

Net (gain) / loss on sale of vessels

(2,453,736)

9,417

Loss on write down of vessel held for sale

121,165

Amortization of fair value of below market time charters acquired

(1,714,370)

(232,390)

Unrealized loss / (gain) on derivatives

565,748

(153,835)

Loss on debt extinguishment

491,571

Changes in operating assets and liabilities

(2,950,997)

2,517,236

Net cash provided by operating activities

2,429,377

52,626,666

Cash flows from investing activities:

Cash paid for vessels under construction

(7,615,958)

Cash paid for vessel acquisitions and capitalized expenses

(65,523,144)

Cash paid for vessel improvements

(667,069)

(974,058)

Proceeds from sale of vessels

14,622,768

Insurance proceeds

2,343,608

Net cash provided by / (used in) investing activities

16,299,307

(74,113,160)

Cash flows from financing activities:

Redemption of Series B preferred shares

(2,000,000)

Proceeds from issuance of common stock, net of commissions paid

715,550

743,553

Preferred dividends paid

(320,877)

(424,000)

Loan arrangement fees paid

(758,000)

Offering expenses paid

(184,321)

(123,167)

Proceeds from long- term bank loans

75,500,000

Repayment of long-term bank loans

(17,905,920)

(23,791,840)

Repayment of related party loan

(625,000)

(2,500,000)

Net cash (used in) / provided by financing activities

(18,320,568)

46,646,546

Net increase in cash, cash equivalents and restricted cash

408,116

25,160,052

Cash, cash equivalents and restricted cash at beginning of year

5,930,061

6,338,177

Cash, cash equivalents and restricted cash at end of year

6,338,177

31,498,229

Cash breakdown

Cash and cash equivalents

3,559,399

26,530,944

Restricted cash, current

345,010

167,285

Restricted cash, long term

2,433,768

4,800,000

Total cash, cash equivalents and restricted cash shown in the statement of cash flows

6,338,177

31,498,229

Euroseas Ltd.
Reconciliation of Net income to Adjusted EBITDA
(All amounts expressed in U.S. Dollars)

Three Months Ended
December 31, 2020

Three Months Ended
December 31, 2021

Twelve Months Ended
December 31, 2020

Twelve Months Ended
December 31, 2021

Net income

582,837

22,676,882

4,041,431

42,877,224

Interest and other financing costs, net (incl. interest income and loss on debt extinguishment)

1,295,827

776,111

4,599,710

2,776,219

Vessel depreciation

1,604,139

2,413,569

6,605,976

7,203,198

Net (gain) / loss on sale of vessels

(1,148,720)

(2,453,736)

9,417

Loss on write down of vessel held for sale

121,165

Amortization of below market time charters acquired

(240,639)

(232,390)

(1,714,370)

(232,390)

Loss on interest rate swap derivatives

23,357

448,449

587,988

27,141

Adjusted EBITDA

2,116,801

26,082,621

11,788,164

52,660,809

Adjusted EBITDA Reconciliation:
Euroseas Ltd. considers Adjusted EBITDA to represent net income before interest, income taxes, depreciation, loss on interest rate swap derivatives, net (gain) / loss on sale of vessels, amortization of below market time charters acquired and loss on write down of vessel held for sale. Adjusted EBITDA does not represent and should not be considered as an alternative to net income, as determined by United States generally accepted accounting principles, or GAAP. Adjusted EBITDA is included herein because it is a basis upon which the Company assesses its financial performance and we believe that this non- GAAP financial measure assists our management and investors by increasing the comparability of our performance from period to period by excluding the potentially disparate effects between periods of, financial costs, amortization of below market time charters acquired, loss on interest rate swaps, net (gain) / loss on sale of vessels, loss on write down of vessel held for sale and depreciation. The Company’s definition of Adjusted EBITDA may not be the same as that used by other companies in the shipping or other industries.

Euroseas Ltd.
Reconciliation of Net income to Adjusted net (loss) / income
(All amounts expressed in U.S. Dollars – except share data and number of shares)

Three Months Ended
December 31, 2020

Three Months Ended
December 31, 2021

Twelve Months Ended
December 31, 2020

Twelve Months Ended
December 31, 2021

Net income

582,837

22,676,882

4,041,431

42,877,224

Unrealized (gain) / loss on derivatives

(17,102)

398,797

565,748

(153,835)

Net (gain)/ loss on sale of vessels

(1,148,720)

(2,453,736)

9,417

Loss on write down of vessel held for sale

121,165

Amortization of below market time charters acquired

(240,639)

(232,390)

(1,714,370)

(232,390)

Depreciation charged due to increase in vessel value from below market time charter acquired

24,455

99,941

125,403

99,941

Adjusted net (loss) / income

(799,169)

22,943,230

685,641

42,600,357

Preferred dividends

(168,676)

(693,297)

(255,324)

Preferred deemed dividend

(345,423)

Adjusted net (loss) / income attributable to common shareholders

(967,845)

22,943,230

(7,656)

41,999,610

Adjusted (loss) / earnings per share, basic

(0.16)

3.18

(0.00)

6.02

Weighted average number of shares, basic

6,149,300

7,210,466

5,753,917

6,976,905

Adjusted (loss) / earnings per share, diluted

(0.16)

3.17

(0.00)

6.01

Weighted average number of shares, diluted

6,149,300

7,244,042

5,753,917

6,993,405

Adjusted net (loss) / income and Adjusted (loss) / earnings per share Reconciliation:
Euroseas Ltd. considers Adjusted net (loss) / income to represent net (loss) / income before unrealized (gain) / loss on derivatives, net (gain) / loss on sale of vessels, loss on write down of vessel held for sale, amortization of below market time charters acquired, and depreciation charged due to increase in vessel value from below market time charter acquired. Adjusted net (loss) / income and Adjusted (loss) / earnings per share is included herein because we believe it assists our management and investors by increasing the comparability of the Company’s fundamental performance from period to period by excluding the potentially disparate effects between periods of unrealized (gain) / loss on derivatives, net (gain) / loss on sale of vessels, loss on write down of vessel held for sale, amortization of below market time charters acquired and depreciation charged due to increase in vessel value from below market time charter acquired, which items may significantly affect results of operations between periods.

Adjusted net (loss) / income and Adjusted (loss) / earnings per share do not represent and should not be considered as an alternative to net income or earnings per share, as determined by GAAP. The Company’s definition of Adjusted net (loss) / income and Adjusted (loss) / earnings per share may not be the same as that used by other companies in the shipping or other industries.

About Euroseas Ltd.
Euroseas Ltd. was formed on May 5, 2005 under the laws of the Republic of the Marshall Islands to consolidate the ship owning interests of the Pittas family of Athens, Greece, which has been in the shipping business over the past 140 years. Euroseas trades on the NASDAQ Capital Market under the ticker ESEA.

Euroseas operates in the container shipping market. Euroseas’ operations are managed by Eurobulk Ltd., an ISO 9001:2008 and ISO 14001:2004 certified affiliated ship management company, which is responsible for the day-to-day commercial and technical management and operations of the vessels. Euroseas employs its vessels on spot and period charters and through pool arrangements.

The Company has a fleet of 16 vessels, including 10 Feeder containerships and 6 Intermediate Container carriers. Euroseas 16 containerships have a cargo capacity of 50,371 teu. After the delivery of four feeder containership newbuildings in 2023 and the first half of 2024, Euroseas’ fleet will consist of 20 vessels with a total carrying capacity of 61,571 teu.

Forward Looking Statement
This press release contains forward-looking statements (as defined in Section 27A of the Securities Act of 1933, as amended, and Section 21E of the Securities Exchange Act of 1934, as amended) concerning future events and the Company’s growth strategy and measures to implement such strategy; including expected vessel acquisitions and entering into further time charters. Words such as “expects,” “intends,” “plans,” “believes,” “anticipates,” “hopes,” “estimates,” and variations of such words and similar expressions are intended to identify forward-looking statements. Although the Company believes that the expectations reflected in such forward-looking statements are reasonable, no assurance can be given that such expectations will prove to have been correct. These statements involve known and unknown risks and are based upon a number of assumptions and estimates that are inherently subject to significant uncertainties and contingencies, many of which are beyond the control of the Company. Actual results may differ materially from those expressed or implied by such forward-looking statements. Factors that could cause actual results to differ materially include, but are not limited to changes in the demand for containerships, competitive factors in the market in which the Company operates; risks associated with operations outside the United States; and other factors listed from time to time in the Company’s filings with the Securities and Exchange Commission. The Company expressly disclaims any obligations or undertaking to release publicly any updates or revisions to any forward-looking statements contained herein to reflect any change in the Company’s expectations with respect thereto or any change in events, conditions or circumstances on which any statement is based.

Visit our website www.euroseas.gr

Company Contact

Investor Relations / Financial Media

Tasos Aslidis
Chief Financial Officer
Euroseas Ltd.
11 Canterbury Lane,
Watchung, NJ 07069
Tel. (908) 301-9091
E-mail: aha@euroseas.gr

Nicolas Bornozis
Markella Kara
Capital Link, Inc.
230 Park Avenue, Suite 1536
New York, NY 10169
Tel. (212) 661-7566
E-mail: euroseas@capitallink.com

Release – Bunker Hill Announces Appointment Of General Manager And Secures Mining Contractor


Bunker Hill Announces Appointment Of General Manager And Secures Mining Contractor

News and Market Data on Bunker Hill Mining


TORONTO, Feb. 15, 2022 (GLOBE NEWSWIRE) — Bunker Hill Mining Corp. (the “Company”) (CSE: BNKR, OTCQB: BHLL) is pleased to announce the appointment of Tom Francis as General Manager for the Bunker Hill Mine, and the execution of a mining services contract with Coeur d’Alene Mine Contracting LLC (“CMC”).
 

Sam Ash, CEO stated, “A critical driver of our success has been the strength that comes from building a world-class team, which will remain a central focus as we accelerate the restart of the Bunker Hill Mine. Tom’s demonstrated leadership skills and track record are a perfect fit for our needs, and I am pleased to welcome him on our journey towards not just building a mine, but a mining company. He will oversee all operational aspects of the restart of the Bunker Hill Mine including technical services, construction, contract management, and Safety and Health.”

“I am also pleased to announce the appointment of CMC as our mining contractor through planned commercial production. This extends an excellent and productive relationship that began in 2020, during which time they have demonstrated their world-class mining capabilities, knowledge of the Silver Valley, and ability to procure skilled personnel to meet our needs. Importantly, agreed rates are in line with those modelled in our PEA. Together with the MOU for the purchase of Teck’s Pend Oreille process plant for approximately $3 million, we are pleased that key capital and operating costs continue to be in line with estimates.”

APPOINTMENT OF TOM FRANCIS AS GENERAL MANAGER

The Company has appointed Tom Francis as General Manager of the Bunker Hill Mine. Mr. Francis joins the Bunker Hill team after 10 years with Rio Tinto, the second-largest mining company in the world, where he was most recently Mine Manager at the Kennecott Bingham Canyon Mine (“Kennecott”) in Utah, USA, its single largest mining operation. Among other achievements, his team delivered world-class payload metrics on Kennecott’s ultra-class truck fleet while simultaneously increasing average haul truck speeds and tire life. Previous roles with Rio Tinto included responsibility for productivity across the full Kennecott value stream (mine, concentrator, smelter and refinery), three years in the Group strategic investment analysis team assessing its global suite of projects (greenfield, brownfield & closure), and several years in Rio Tinto Exploration (RTX) managing operational support (incl. safety) for Rio Tinto’s Exploration’s projects across Africa and Eurasia.

Prior to his mining experience, Mr. Francis served as an officer in the Royal Marines and UK Special Forces, serving on multiple operational tours in Kosovo, Iraq & Afghanistan. He is a dual national US/UK citizen having lived, studied and worked in both the US and the UK. He holds a first-class degree from the University of Oxford (BA, Mathematics & Computation).

APPOINTMENT OF CMC AS MINING CONTRACTOR

The Company has also agreed a Contract Services Agreement (“CSA”) with Coeur d’Alene Mine Contracting, LLC for underground mining and development requirements through December 31, 2023, by which time it plans to be in commercial production. CMC is a locally owned and operated mining services company based in Idaho’s Silver Valley with extensive contracting experience in the deepest underground mines across North America. Their contract experience spans production, development, mine rehabilitation, mine start-ups and mine closures.

The CSA extends an ongoing relationship with CMC that has seen them work alongside the Bunker Hill team for the last two years, during which time they have performed safely, productively and developed an extensive first-hand knowledge of the Bunker Hill mine. Importantly, CMC has demonstrated an ability to grow in accordance with the step-up in physical activity at Bunker Hill without diluting operational performance. Labor and equipment rates in the CSA are consistent with the Company’s Preliminary Economic Assessment published in November 2021, and CMC has also been advising on and supporting the procurement of necessary additional equipment as operational activity increases.

ABOUT BUNKER HILL MINING CORP.

Under new Idaho-based leadership the Bunker Hill Mining Corp, intends to sustainably restart and develop the Bunker Hill Mine as the first step in consolidating a portfolio of North American mining assets with a focus on silver. Information about the Company is available on its website, www.bunkerhillmining.com , or within the SEDAR and EDGAR databases.

For additional information contact:

David Wiens, CFA

CFO & Corporate Secretary

+1 208 370 3665

ir@bunkerhillmining.com

Cautionary Statements

Certain statements in this news release are forward-looking and involve a number of risks and uncertainties. Such forward-looking statements are within the meaning of that term in Section 27A of the Securities Act of 1933, as amended, and Section 21E of the Securities Exchange Act of 1934, as amended, as well as within the meaning of the phrase ‘forward-looking information’ in the Canadian Securities Administrators’ National Instrument 51-102 – Continuous Disclosure Obligations. Forward-looking statements are not comprised of historical facts. Forward-looking statements include estimates and statements that describe the Company’s future plans, objectives or goals, including words to the effect that the Company or management expects a stated condition or result to occur. Forward-looking statements may be identified by such terms as “believes”, “anticipates”, “expects”, “estimates”, “may”, “could”, “would”, “will”, or “plan”. Since forward-looking statements are based on assumptions and address future events and conditions, by their very nature they involve inherent risks and uncertainties. Although these statements are based on information currently available to the Company, the Company provides no assurance that actual results will meet management’s expectations. Risks, uncertainties and other factors involved with forward-looking information could cause actual events, results, performance, prospects and opportunities to differ materially from those expressed or implied by such forward-looking information.

Forward looking information in this news release includes, but is not limited to, the Company’s intentions regarding its objectives, goals or future plans and statements. Factors that could cause actual results to differ materially from such forward-looking information include, but are not limited to: the ability to predict and counteract the effects of COVID-19 on the business of the Company, including but not limited to the effects of COVID-19 on the price of commodities, capital market conditions, restriction on labour and international travel and supply chains; failure to identify mineral resources; failure to convert estimated mineral resources to reserves; the inability to complete a feasibility study which recommends a production decision; the preliminary nature of metallurgical test results; the Company’s ability to restart and develop the Bunker Hill Mine and the risks of not basing a production decision on a feasibility study of mineral reserves demonstrating economic and technical viability, resulting in increased uncertainty due to multiple technical and economic risks of failure which are associated with this production decision including, among others, areas that are analyzed in more detail in a feasibility study, such as applying economic analysis to resources and reserves, more detailed metallurgy and a number of specialized studies in areas such as mining and recovery methods, market analysis, and environmental and community impacts and, as a result, there may be an increased uncertainty of achieving any particular level of recovery of minerals or the cost of such recovery, including increased risks associated with developing a commercially mineable deposit with no guarantee that production will begin as anticipated or at all or that anticipated production costs will be achieved; failure to commence production would have a material adverse impact on the Company’s ability to generate revenue and cash flow to fund operations; failure to achieve the anticipated production costs would have a material adverse impact on the Company’s cash flow and future profitability; delays in obtaining or failures to obtain required governmental, environmental or other project approvals; political risks; changes in equity markets; uncertainties relating to the availability and costs of financing needed in the future; the inability of the Company to budget and manage its liquidity in light of the failure to obtain additional financing, including the ability of the Company to complete the payments pursuant to the terms of the agreement to acquire the Bunker Hill Mine Complex; inflation; changes in exchange rates; fluctuations in commodity prices; delays in the development of projects; capital, operating and reclamation costs varying significantly from estimates and the other risks involved in the mineral exploration and development industry; and those risks set out in the Company’s public documents filed on SEDAR. Although the Company believes that the assumptions and factors used in preparing the forward-looking information in this news release are reasonable, undue reliance should not be placed on such information, which only applies as of the date of this news release, and no assurance can be given that such events will occur in the disclosed time frames or at all. The Company disclaims any intention or obligation to update or revise any forward-looking information, whether as a result of new information, future events or otherwise, other than as required by law. No stock exchange, securities commission or other regulatory authority has approved or disapproved the information contained herein.

Cautionary Note to United States Investors Concerning Estimates of Measured, Indicated and Inferred Resources

This press release has been prepared in accordance with the requirements of the securities laws in effect in Canada, which differ from the requirements of U.S. securities laws. Unless otherwise indicated, all resource and reserve estimates included in this press release have been disclosed in accordance with NI 43-101 and the Canadian Institute of Mining, Metallurgy, and Petroleum Definition Standards on Mineral Resources and Mineral Reserves. NI 43-101 is a rule developed by the Canadian Securities Administrators which establishes standards for all public disclosure an issuer makes of scientific and technical information concerning mineral projects. Canadian disclosure standards, including NI 43-101, differ significantly from the requirements of the United States Securities and Exchange Commission (“SEC”), and resource and reserve information contained in this press release may not be comparable to similar information disclosed by U.S. companies. In particular, and without limiting the generality of the foregoing, the term “resource” does not equate to the term “reserves”. Under U.S. standards, mineralization may not be classified as a “reserve” unless the determination has been made that the mineralization could be economically and legally produced or extracted at the time the reserve determination is made. The SEC’s disclosure standards normally do not permit the inclusion of information concerning “measured mineral resources”, “indicated mineral resources” or “inferred mineral resources” or other descriptions of the amount of mineralization in mineral deposits that do not constitute “reserves” by U.S. standards in documents filed with the SEC. Investors are cautioned not to assume that any part or all of mineral deposits in these categories will ever be converted into reserves. U.S. investors should also understand that “inferred mineral resources” have a great amount of uncertainty as to their existence and great uncertainty as to their economic and legal feasibility. It cannot be assumed that all or any part of an “inferred mineral resource” will ever be upgraded to a higher category. Investors are cautioned not to assume that all or any part of an “inferred mineral resource” exists or is economically or legally mineable. Disclosure of “contained ounces” in a resource is permitted disclosure under Canadian regulations; however, the SEC normally only permits issuers to report mineralization that does not constitute “reserves” by SEC standards as in-place tonnage and grade without reference to unit measures. The requirements of NI 43-101 for disclosure of “reserves” are also not the same as those of the SEC, and reserves disclosed by the Company in accordance with NI 43-101 may not qualify as “reserves” under SEC standards. Accordingly, information concerning mineral deposits contained in our website may not be comparable with information made public by companies that report in accordance with U.S. standards.

Release – Motorsport Games Announces Next Gen Car For Nascar 21 Ignition


Motorsport Games Announces Next Gen Car For Nascar 21: Ignition

Research, News, and Market Data on Motorsport Games


UPDATE ARRIVES AHEAD OF THE SEASON KICKOFF AT THE DAYTONA 500, WHERE LIVE FAST MOTORSPORTS WILL RACE WITH A NASCAR 21: IGNITION PAINT SCHEME

MIAMI, Feb. 15, 2022 (GLOBE NEWSWIRE) — Motorsport Games Inc. (NASDAQ: MSGM) (“Motorsport Games”), a leading racing game developer, publisher and esports ecosystem provider of official motorsport racing series throughout the world, announces today the addition of NASCAR’s Next Gen car to NASCAR 21: Ignition, the officially licensed  video game of the world’s most popular stock car racing series. The Next Gen car update will be available starting Thursday, February 17, 2022 within a new “Test Drive mode” for players on all platforms (PlayStation, Xbox and PC).

The Next Gen car update arrives just in time for the start of the 2022 NASCAR regular season and its first race – the Daytona 500 – scheduled to be held Sunday, February 20, 2022. With the Next Gen cars being the most highly anticipated change coming to NASCAR this year, Motorsport Games has been working on implementing the car into NASCAR 21: Ignition since its launch to ensure that players will have authentic representation of the sport in its most current state. Players can look forward to driving the No. 78 Live Fast Motorsports Next Gen Ford Mustang test car in-game within the all-new Test Drive mode, getting a handle on the new car for the first time.

“Our development team couldn’t be happier about adding Next Gen cars to the current iteration of Ignition, especially prior to the kickoff of the 2022 NASCAR season,” said George Holmquist, Vice President of Publishing and Marketing at Motorsport Games. “We have shared in the excitement of our players and NASCAR fans with this highly anticipated game addition. We made sure to recreate the Next Gen car as close to its real-life counterpart as possible and we can’t wait for everyone to get acclimated with driving the newest stock car in-game, just like the drivers will be throughout the year.”

Not only will users at home get to use the Next Gen cars in-game, but attendees of the Daytona 500 race weekend will have the opportunity to test drive the Next Gen car at the eNASCAR Arcade on site. Players will be able to drive the car around the iconic Daytona International Speedway prior to the showcase event on race day. Motorsport Games representatives will be on hand to assist players and answer questions about the newest update.

In addition, fans can look forward to kicking off the 2022 NASCAR season with a Free Play Weekend of NASCAR 21: Ignition, available on the Xbox platform from February 17 – 20, 2022. The game comes complete with a number of modes, such as Race Now, Online Multiplayer and the brand new Paint Booth. NASCAR 21: Ignition contains all drivers, teams and tracks from the 2021 NASCAR Cup Series season and is accessible for players of all skill levels.

The Daytona 500 weekend will also see Live Fast Motorsports kick off the second year of its partnership with Motorsport Games by racing with a NASCAR 21: Ignition and Xbox-themed scheme on its No. 78 Ford Mustang. This marks the first of seven select races this season that B.J. McLeod’s No. 78 car will feature a Motorsport Games-inspired livery. Additionally, McLeod will race with a custom-designed Motorsport Games helmet and the Live Fast Motorsports pit crew will wear Motorsport Games branded fire suits throughout the season.

To purchase NASCAR 21: Ignition, please visit the PlayStation StoreXbox Store and Steam.

To keep up with the latest Motorsport Game news visit www.motorsportgames.com and follow on Twitter, Instagram, Facebook and LinkedIn.

About Motorsport Games:
Motorsport Games, a Motorsport Network company, combines innovative and engaging video games with exciting esports competitions and content for racing fans and gamers around the globe. The Company is the officially licensed video game developer and publisher for iconic motorsport racing series across PC, PlayStation, Xbox, Nintendo Switch and mobile, including NASCAR, INDYCAR, 24 Hours of Le Mans and the British Touring Car Championship (“BTCC”). Motorsport Games is an award-winning esports partner of choice for 24 Hours of Le Mans, Formula E, BTCC, the FIA World Rallycross Championship and the eNASCAR Heat Pro League, among others.

Forward-Looking Statements:
Certain statements in this press release which are not historical facts are forward-looking statements within the meaning of Section 27A of the Securities Act of 1933, as amended, and Section 21E of the Securities Exchange Act of 1934, as amended, and are provided pursuant to the safe harbor provisions of the Private Securities Litigation Reform Act of 1995. Any statements in this press release that are not statements of historical fact may be deemed forward-looking statements. Words such as “continue,” “will,” “may,” “could,” “should,” “expect,” “expected,” “plans,” “intend,” “anticipate,” “believe,” “estimate,” “predict,” “potential,” and similar expressions are intended to identify such forward-looking statements. These forward-looking statements include, but are not limited to, statements concerning the Company’s expectations regarding the future impact of new or planned products, features, offerings or events, and the timing of launching such products, features, offerings or events. All forward-looking statements involve significant risks and uncertainties that could cause actual results to differ materially from those expressed or implied in the forward-looking statements, many of which are generally outside the control of Motorsport Games and are difficult to predict. Examples of such risks and uncertainties include, but are not limited to the Company experiencing difficulties and/or delays in enhancing the quality of its product offerings that could negatively impact its future development plans, such as due to difficulties or delays in launching new products, higher than anticipated costs incurred in developing, launching and continuing to enhance and improve such products and/or less than anticipated consumer acceptance of the Company’s products and/or difficulties, delays in or unanticipated events that may impact the timing and scope of new product launches, such as due to delays and higher than anticipated expenses related to the ongoing and prolonged COVID-19 pandemic and related economic lockdowns and government mandates; unanticipated operating costs, transaction costs and actual or contingent liabilities; adverse effects of increased competition; and unanticipated changes in consumer behavior, including as a result of general economic factors, such as increased inflation. Factors other than those referred to above could also cause Motorsport Games’ results to differ materially from expected results. All forward-looking statements involve significant risks and uncertainties that could cause actual results to differ materially from those expressed or implied in the forward-looking statements, many of which are generally outside the control of Motorsport Games and are difficult to predict. Factors other than those referred to above could also cause Motorsport Games’ results to differ materially from expected results. Additional factors that could cause actual results to differ materially from those expressed or implied in the forward-looking statements can be found in Motorsport Games’ filings with the SEC, which may be found at www.sec.gov and at ir.motorsportgames.com, including its Annual Report on Form 10-K for the fiscal year ended December 31, 2020, its Quarterly Reports on Form 10-Q filed with the SEC during 2021, as well as in its subsequent filings with the SEC. Motorsport Games anticipates that subsequent events and developments may cause its plans, intentions and expectations to change. Motorsport Games assumes no obligation, and it specifically disclaims any intention or obligation, to update any forward-looking statements, whether as a result of new information, future events or otherwise, except as expressly required by law. Forward-looking statements speak only as of the date they are made and should not be relied upon as representing Motorsport Games’ plans and expectations as of any subsequent date. Additionally, the business and financial materials and any other statement or disclosure on, or made available through, Motorsport Games’ website or other websites referenced or linked to this press release shall not be incorporated by reference into this press release.

Website and Social Media Disclosure:
Investors and others should note that we announce material financial information to our investors using our investor relations website (ir.motorsportgames.com), SEC filings, press releases, public conference calls and webcasts. We use these channels, as well as social media and blogs, to communicate with our investors and the public about our company and our products. It is possible that the information we post on our websites, social media and blogs could be deemed to be material information. Therefore, we encourage investors, the media and others interested in our company to review the information we post on the websites, social media channels and blogs, including the following (which list we will update from time to time on our investor relations website):

Websites Social Media
motorsportgames.com Twitter:@msportgames & @traxiongg
traxion.gg Instagram: msportgames & traxiongg
motorsport.com Facebook: Motorsport Games & traxiongg
  LinkedIn: Motorsport Games
  Twitch: traxiongg
  Reddit: traxiongg

The contents of these websites and social media channels are not part of, nor will they be incorporated by reference into, this press release.

Investors:
Ashley DeSimone
Ashley.Desimone@icrinc.com

Press:
Motorsport Games PR
press@motorsportgames.com

Release – PDS Biotech Announces Clinical Trial with Mayo Clinic to Study PDS0101


PDS Biotech Announces Clinical Trial with Mayo Clinic to Study PDS0101 in Early Stage Pre-Metastatic- HPV-Associated Head and Neck Cancer

Research, News, and Market Data on PDS Biotech


The study evaluates PDS0101 with and without KEYTRUDA® prior to surgery for HPV-associated oropharyngeal cancer

FLORHAM PARK, N.J., Feb. 15, 2022 (GLOBE NEWSWIRE) — PDS Biotechnology Corporation (Nasdaq: PDSB), a clinical-stage immunotherapy company developing novel cancer therapies and infectious disease vaccines based on the Company’s proprietary Versamune® and Infectimune™ T-cell activating technologies, today announced the initiation of an Investigator-Initiated Trial (ITT), MC200710, for PDS0101 alone or in combination with the checkpoint inhibitor, KEYTRUDA®, in patients with HPV-associated oropharyngeal cancer (HPV(+)OPSCC) at high risk of recurrence. The trial is being led by Drs. David Routman, Katharine Price, Kathryn Van Abel, and Ashish Chintakuntlawar of Mayo Clinic, a nationally and internationally recognized center of excellence for the treatment of head and neck cancers.

HPV(+)OPSCC is now the most common type of head and neck cancer and has been increasing significantly in recent years.  Oropharyngeal cancer is a disease in which cancer cells form in the tonsil tissues of the back (base of tongue) and side (palatine tonsils) of the throat. According to the National Cancer Institute, smoking or being infected with the human papillomavirus (HPV), especially HPV16, can increase the risk of oropharyngeal cancer. The American Cancer Society estimates there are over 54,000 new cases of oral and oropharyngeal cancer and over 11,000 related deaths in the United States, annually.

“We are excited to have a team of doctors at Mayo Clinic conducting a trial to study our novel Versamune®-based T cell immunotherapy platform and lead asset, PDS0101 in earlier-stage disease,” commented Dr. Lauren Wood, Chief Medical Officer of PDS Biotech. “This upcoming trial not only broadens our addressable patient population of those affected by the increasing incidence of HPV(+)OPSCC, but also allows us to better understand the activity of PDS0101 alone or in combination with KEYTRUDA® in earlier stages of disease.”

The study treatment will be administered before patients proceed to transoral robotic surgery (TORS) with curative intent. Treatment in this setting is referred to as neoadjuvant treatment. PDS0101 has been shown to induce killer T-cells that target and kill HPV-positive cancers, either alone or in combination with checkpoint inhibitors in preclinical studies, and in combination in clinical studies of patients with advanced recurrent/metastatic HPV-associated cancers.  This study will explore whether PDS0101 with or without checkpoint inhibition may increase HPV-specific anti-tumor responses, potentially resulting in tumor shrinkage, pathologic regression, and decreases in circulating tumor DNA (ctDNA).

About PDS Biotechnology

PDS Biotech is a clinical-stage immunotherapy company developing a growing pipeline of cancer and infectious disease immunotherapies based on the Company’s proprietary Versamune® and Infectimune™ T-cell activating technology platforms.

Our Versamune®-based products have demonstrated the potential to overcome the limitations of current immunotherapy by inducing in vivo, large quantities of high-quality, highly potent polyfunctional tumor specific CD4+ helper and CD8+ killer T-cells. PDS Biotech has developed multiple therapies, based on combinations of Versamune® and disease-specific antigens, designed to train the immune system to better recognize diseased cells and effectively attack and destroy them.  The Company’s pipeline products address various cancers including HPV16-associated cancers (anal, cervical, head and neck, penile, vaginal, vulvar) and breast, colon, lung, prostate, and ovarian cancers.  

Our Infectimune™-based vaccines have demonstrated the potential to induce not only robust and durable neutralizing antibody responses, but also powerful T-cell responses including long-lasting memory T-cell responses. To learn more, please visit www.pdsbiotech.com or follow us on Twitter at @PDSBiotech.

Forward Looking Statements

This communication contains forward-looking statements (including within the meaning of Section 21E of the United States Securities Exchange Act of 1934, as amended, and Section 27A of the United States Securities Act of 1933, as amended) concerning PDS Biotechnology Corporation (the “Company”) and other matters. These statements may discuss goals, intentions and expectations as to future plans, trends, events, results of operations or financial condition, or otherwise, based on current beliefs of the Company’s management, as well as assumptions made by, and information currently available to, management. Forward-looking statements generally include statements that are predictive in nature and depend upon or refer to future events or conditions, and include words such as “may,” “will,” “should,” “would,” “expect,” “anticipate,” “plan,” “likely,” “believe,” “estimate,” “project,” “intend,” “forecast,” “guidance”, “outlook” and other similar expressions among others. Forward-looking statements are based on current beliefs and assumptions that are subject to risks and uncertainties and are not guarantees of future performance. Actual results could differ materially from those contained in any forward-looking statement as a result of various factors, including, without limitation: the Company’s ability to protect its intellectual property rights; the Company’s anticipated capital requirements, including the Company’s anticipated cash runway and the Company’s current expectations regarding its plans for future equity financings; the Company’s dependence on additional financing to fund its operations and complete the development and commercialization of its product candidates, and the risks that raising such additional capital may restrict the Company’s operations or require the Company to relinquish rights to the Company’s technologies or product candidates; the Company’s limited operating history in the Company’s current line of business, which makes it difficult to evaluate the Company’s prospects, the Company’s business plan or the likelihood of the Company’s successful implementation of such business plan; the timing for the Company or its partners to initiate the planned clinical trials for PDS0101, PDS0203 and other Versamune® based products; the future success of such trials; the successful implementation of the Company’s research and development programs and collaborations, including any collaboration studies concerning PDS0101, PDS0203 and other Versamune® based products and the Company’s interpretation of the results and findings of such programs and collaborations and whether such results are sufficient to support the future success of the Company’s product candidates; the success, timing and cost of the Company’s ongoing clinical trials and anticipated clinical trials for the Company’s current product candidates, including statements regarding the timing of initiation, pace of enrollment and completion of the trials (including our ability to fully fund our disclosed clinical trials, which assumes no material changes to our currently projected expenses), futility analyses, presentations at conferences and data reported in an abstract, and receipt of interim results (including, without limitation, any preclinical results or data), which are not necessarily indicative of the final results of the Company’s ongoing clinical trials; any Company statements about its understanding of product candidates mechanisms of action and interpretation of preclinical and early clinical results from its clinical development programs and any collaboration studies; the acceptance by the market of the Company’s product candidates, if approved; the timing of and the Company’s ability to obtain and maintain U.S. Food and Drug Administration or other regulatory authority approval of, or other action with respect to, the Company’s product candidates; and other factors, including legislative, regulatory, political and economic developments not within the Company’s control, including unforeseen circumstances or other disruptions to normal business operations arising from or related to COVID-19. The foregoing review of important factors that could cause actual events to differ from expectations should not be construed as exhaustive and should be read in conjunction with statements that are included herein and elsewhere, including the risk factors included in the Company’s annual and periodic reports filed with the SEC. The forward-looking statements are made only as of the date of this press release and, except as required by applicable law, the Company undertakes no obligation to revise or update any forward-looking statement, or to make any other forward-looking statements, whether as a result of new information, future events or otherwise.

Investor Contact:
Rich Cockrell
CG Capital
Phone: +1 (404) 736-3838
Email: rich@cg.capital

Release – Entravision Partners with Roku to Serve as Media Advertising Partner in Mexico


Entravision Partners with Roku to Serve as Media Advertising Partner in Mexico

Research, News, and Market Data on Entravision


Partnership Expands Entravision’s Position in the Rapidly Growing Connected Television Marketplace

SANTA MONICA, Calif.–(BUSINESS WIRE)– Entravision (NYSE: EVC), a leading global advertising, media and ad-tech solutions company connecting brands to consumers by representing top platforms and publishers, announced today that the Company has partnered with Roku, the #1 TV streaming platform in the U.S., Mexico and Canada*, to serve as Roku’s media advertising partner in Mexico. Entravision will help brands effectively reach consumers by advertising on the Roku streaming platform.

As more consumers are moving to TV streaming, advertisers can reach them by moving budgets into TV streaming. Through Roku’s advertising solutions, brands and marketers can reach audiences at scale on the Roku platform. Entravision, as Roku’s trusted partner, will serve as an advertising partner in Mexico to work with brands interested in advertising through the Roku platform.

“Entravision is very excited to partner with Roku, the pioneer in television streaming, as they begin advertising in Mexico,” said Juan Saldívar, Entravision’s Chief Digital, Strategy and Accountability Officer. “Through our partnership, Entravision will be able to connect brands and marketers in Mexico with Roku’s advertising solution, in order to reach TV streamers on the Roku streaming platform.”

Mr. Saldívar continued, “Entravision has extensive digital marketing expertise for companies looking to tap into growing Latino audiences, including in Mexico. We look forward to leveraging our expertise and local market connections to support Roku’s global advertising growth.”

Brands and content providers will be able to reach consumers through ad-supported content as part of Roku advertising, which includes benefits such as:

  • Reach consumers at scale: Roku has a direct relationship with its consumers, enabling better ad targeting and measurement.
  • Access to premium inventory: Brands can advertise with trusted editorially-curated, premium channels, including local networks, film & TV, sports and lifestyle.
  • Unique storytelling for brands: Create advertiser experiences that go beyond the 30-second ad and take full advantage of the TV streaming environment.
  • Performance driven: Roku combines TV’s branding power with digital data to drive performance and results.

To learn more about this partnership with Roku, please contact Entravision’s digital sales team.

* by hours streamed (Hypothesis Group, October 2021)

About Entravision

Entravision is a leading global advertising, media and ad-tech solutions company connecting brands to consumers by representing top platforms and publishers. Our dynamic portfolio of services includes digital, television and radio offerings. Digital, our largest revenue segment, is comprised of five core businesses: Entravision Digital, Smadex, Cisneros Interactive, MediaDonuts, and 365 Digital. Entravision Digital provides branding and performance digital solutions to clients and small- and mid-size businesses throughout the world. Smadex provides cutting-edge mobile programmatic solutions and demand-side platforms which enable advertisers to effectively execute performance campaigns using machine-learned bidding algorithms. Cisneros Interactive provides unique digital marketing solutions representing major global publishers and ad-tech platforms in Latin America, while also managing the leading digital audio network and solutions player Audio.Ad. MediaDonuts provides digital marketing performance and branding services in the Southeast Asia region and maintains unique commercial partnerships with some of the world’s leading digital publishers and social media platforms. 365 Digital is a digital advertising solutions provider that offers exclusive sales representations with major global platforms in South Africa. Beyond digital, Entravision has 53 television stations and is the largest affiliate group of the Univision and UniMás television networks. Entravision also manages 46 primarily Spanish-language radio stations that feature nationally recognized, Emmy award-winning talent. Shares of Entravision Class A Common Stock trade on the NYSE under ticker: EVC. Learn more about all of our marketing, media, and technology offerings at entravision.com or connect with us on LinkedIn and Facebook.

Forward-Looking Statements

This press release contains certain forward-looking statements. These forward-looking statements, which are included in accordance with the safe harbor provisions of the Private Securities Litigation Reform Act of 1995, may involve known and unknown risks, uncertainties and other factors that may cause the Company’s actual results and performance in future periods to be materially different from any future results or performance suggested by the forward-looking statements in this press release. Although the Company believes the expectations reflected in such forward-looking statements are based upon reasonable assumptions, it can give no assurance that actual results will not differ materially from these expectations, and the Company disclaims any duty to update any forward-looking statements made by the Company. From time to time, these risks, uncertainties and other factors are discussed in the Company’s filings with the Securities and Exchange Commission.

Christopher T. Young
Chief Financial Officer
Entravision Communications Corporation
310-447-3870

Kimberly Esterkin
Addo Investor Relations
evc@addo.com
310-829-5400

Rogelio Osorio
CTV Business Sales Development
Entravision Communications Corporation
rogelio.osorio@entravision.com

Source: Entravision

Release – Voyager Digital Reports Revenue of US$164.8 Million for the Quarter Ended December 31 2021


Voyager Digital Reports Revenue of US$164.8 Million for the Quarter Ended December 31, 2021

Research, News, and Market Data on Voyager Digital


Voyager Digital Ltd. (“Voyager” or the “Company”) (TSX: VOYG; OTCQX: VYGVF; FRA: UCD2) one of the fastest-growing, publicly traded cryptocurrency platforms in the United States, today announced revenue and user metrics for the Fiscal 2022 Second Quarter ended December 31, 2021.

“I am excited to report our best quarter ever, doubling our revenue from the previous quarter, and highlighting Voyager’s positioning and revenue opportunity in active markets,” said Steve Ehrlich, CEO and Co-founder of Voyager.  Ehrlich continued, “More importantly, we delivered significant revenue growth and supported a marked increase in customer activity without any material system issues during the quarter, highlighting the steps we’ve taken to build out the scale and security of the Voyager platform in 2021, as we position Voyager for a series of product roll outs in calendar 2022.

“We are a product delivery organization and are taking the necessary steps to continue our revenue diversification strategy,” continued Mr. Ehrlich. “The launch of our Voyager Debit Card, which allows for payroll direct deposits, is the next step in revenue diversification.  We recently added engineering resources to our team which allowed us to add more tokens to the trading platform, and tokens available for staking. By the end of the March quarter, we expect our desktop platform and dark mode will be added to our product offering.  We are also building towards adding equities to the platform, expanding the platform to Europe and Canada, and offering an NFT product and wallet. All of these are significant opportunities for the Company; and with our NFT platform we intend to make the viewing, acquiring and custody of NFTs easy for consumers.”

The Company is pleased to announce the following Fiscal 2022 Second Quarter ended December 31, 2021 Financial and Operational Key Metrics:

  •  Revenue for the quarter is $164.8 million with $149.0 million for the historical business and $15.8 million from the Coinify merchant business. The $164.8 million in revenue is up over 4400% compared to $3.5 million for the quarter ended December 31, 2020.
  • Revenue for the calendar year ended December 31, 2021 is $415.8 million vs $6.6 million for the calendar year ended December 31, 2020.
  • Adjusted EBITDA is $17.4 million for the quarter vs $2.8 million for the quarter ended December 31, 2020.
  • Operating Income is $3.2 million for the quarter vs a loss of $2.9 million for the quarter ended December 31, 2020.
  • Total verified users on the platform stand at more than 3.2 million, up 49% from 2.15 million at the quarter ended September 30, 2021.
  • Total funded accounts exceed 1,074,000 as of December 31, 2021, up 25% from 860,000 at the quarter ended September 30, 2021.
  • Total Assets on Platform grew to $5.9 billion from $4.3 billion at September 30, 2021.
  • Our headcount increased to 250 as of December 31, 2021, from 231 at September 30, 2021.

All figures are preliminary and unaudited and subject to final adjustment. All amounts are in U.S. dollars, unless otherwise indicated.
 
“I am truly excited about where we are and where we are going. Voyager’s business continues to grow every day and the company is well positioned as a pioneer in the digital asset space,” Ehrlich added.
 
Conference Call Details
Voyager will discuss its Fiscal 2022 Second Quarter results today, February 15, 2022, via a conference call at 8:00 a.m. Eastern Time. To access the webcast, please register by clicking here. A live webcast and a replay will be available on the Investor Relations section of the Company’s website at https://www.investvoyager.com/investorrelations/overview.  
 
 
About Voyager Digital Ltd.
Publicly traded Voyager Digital Ltd.’s (TSX: VOYG) (OTCQX: VYGVF) (FRA: UCD2) US subsidiary, Voyager Digital, LLC, is a fast-growing, cryptocurrency platform in the United States founded in 2018 to bring choice, transparency, and cost efficiency to the marketplace. Voyager offers a secure way to trade over 85 different cryptocurrency assets using its easy-to-use mobile application and earn rewards up to 12% annually on more than 35 cryptocurrencies. Through its subsidiary Coinify ApS, Voyager provides cryptocurrency payment solutions for both consumers and merchants around the globe. To learn more about the company, please visit https://www.investvoyager.com.
 
The TSX has not approved or disapproved of the information contained herein.
 
Forward Looking Statements
Certain information in this press release, including, but not limited to, statements regarding future growth and performance of the business, momentum in the businesses, future adoption of digital assets, and the Company‘s anticipated results may constitute forward looking information (collectively, forward-looking statements), which can be identified by the use of terms such as “may,” “will,” “should,” “expect,” “anticipate,” “project,” “estimate,” “intend,” “continue” or “believe” (or the negatives) or other similar variations. Forward-looking statements involve known and unknown risks, uncertainties and other factors that may cause Voyager’s actual results, performance or achievements to be materially different from any of its future results, performance or achievements expressed or implied by forward-looking statements. Moreover, we operate in a very competitive and rapidly changing environment. New risks emerge from time to time. It is not possible for our management to predict all risks, nor can we assess the impact of all factors on our business or the extent to which any factor, or combination of factors, may cause actual results to differ materially from those contained in any forward-looking statements we may make. In light of these risks, uncertainties, and assumptions, the future events and trends discussed in this press release may not occur and actual results could differ materially and adversely from those anticipated or implied in the forward-looking statements. Forward looking statements are subject to the risk that the global economy, industry, or the Company’s businesses and investments do not perform as anticipated, that revenue or expenses estimates may not be met or may be materially less or more than those anticipated, that trading momentum does not continue or the demand for trading solutions declines, customer acquisition does not increase as planned, product and international expansion do not occur as planned, risks of compliance with laws and regulations that currently apply or become applicable to the business or the interpretation or application of laws and regulations by regulatory authorities, and those other risks contained in the Company’s public filings, including in its Management Discussion and Analysis and its Annual Information Form (AIF). Factors that could cause actual results of the Company and its businesses to differ materially from those described in such forward-looking statements include, but are not limited to, a decline in the digital asset market or general economic conditions; changes in laws or approaches to regulation, regulatory investigations, enforcement actions or other regulatory action or sanction, the failure or delay in the adoption of digital assets and the blockchain ecosystem by institutions; changes in the volatility of crypto currency, changes in demand for Bitcoin and Ethereum, changes in the status or classification of cryptocurrency assets, cybersecurity breaches, a delay or failure in developing infrastructure for the trading businesses or achieving mandates and gaining traction; failure to grow assets under management, an adverse development with respect to an issuer or party to the transaction or failure to obtain a required regulatory approval. In connection with the forward-looking statements contained in this press release, the Company has made assumptions that no significant events occur outside of the Company’s normal course of business and that current trends in respect of digital assets continue. Readers are cautioned that the key metrics disclosed in this press release, including, without limitation,  Assets Under Management and trading volumes fluctuate and may increase and decrease from time to time and that such fluctuations are beyond the Company’s control. Forward-looking statements, past and present performance and trends are not guarantees of future performance, accordingly, you should not put undue reliance on forward-looking statements, current or past performance, or current or past trends. Information identifying assumptions, risks, and uncertainties relating to the Company are contained in its filings with the Canadian securities regulators available at www.sedar.com. The forward-looking statements in this press release are applicable only as of the date of this release or as of the date specified in the relevant forward-looking statement and the Company undertakes no obligation to update any forward-looking statement to reflect events or circumstances after that date or to reflect the occurrence of unanticipated events. The Company assumes no obligation to provide operational updates, except as required by law. If the Company does update one or more forward-looking statements, no inference should be drawn that it will make additional updates with respect to those or other forward-looking statements, unless required by law. Readers are cautioned that past performance is not indicative of future performance and current trends in the business and demand for digital assets may not continue and readers should not put undue reliance on past performance and current trends.  Refer to definition of certain Non-IFRS terms in Management’s Discussion and Analysis including Assets On Platform, Adjusted EBITDA and Adjusted Working Capital.  All figures are in U.S. dollars unless otherwise noted.
 
SOURCE Voyager Digital, Ltd.

Press Contacts
 
Voyager Digital, Ltd.
Michael Legg
Chief Communications Officer
(212) 547-8807
mlegg@investvoyager.com

Voyager Public Relations Team
pr@investvoyager.com


Release – Aurania Signs New Access Agreement and Provides Update on Operations


Aurania Signs New Access Agreement and Provides Update on Operations

Research, News, and Market Data on Aurania Resources


Toronto, Ontario, February 15, 2022 – Aurania Resources Ltd. (TSXV: ARU) (OTCQB: AUIAF) (Frankfurt: 20Q) (“Aurania” or the “Company”) announces that an important access agreement has been signed with the community of “Kim” at its Lost Cities-Cutucu project in southeastern Ecuador and provides an update on operations.

The Company yesterday signed an access agreement with the community of “Kim”, in the southern part of the block of concessions.  This is the first time the Company has been granted access to this important area.   At the community meeting there were a large number of artisanal gold miners.  The Kim community is located near where Metron (see press release dated September 26, 2019) forecasted the potential position of one of the “Lost Cities”.

Metron Inc. of Reston, Virginia, USA, used Bayesian data analysis to generate probability maps of the position of “Logroño de los Caballeros”, a gold mining settlement that was founded circa 1562 by the Spanish conquistadors, and abandoned circa 1605.  The location has been lost.  Numerous expeditions have been carried out over the intervening years to relocate it.  Metron incorporated historical documents, and clues from geography and geology into a “search matrix”, and then through statistical algorithms produced a map with statistical likelihoods the settlement would be in specific areas.  Kim will be a focus of work going forward.

Ms. Carolina Lasso Amaya has replaced the former Head of Corporate Social Responsibility for Aurania.  Ms. Lasso has been the Director of the Step Forward Foundation (Dar el Paso Adelante) in Ecuador for over two years and has extensive knowledge of the communities in the Cordillera de Cutucu.  Her first act has been to successfully negotiate access to Kim.

Prior to joining the Foundation in 2019, Ms. Lasso worked from 2011 to 2017 for the Ministry of Foreign Affairs in Colombia, primarily working in the border areas of Amazonia with indigenous groups.  During this period, she also dealt with elements of the FARC, the Colombian Paramilitaries, cocaine growers, persons recruiting child soldiers and other difficult and potentially dangerous groups.  She developed post-conflict models to integrate communities into the social fabric.  During her time with the Foundation, she has initiated a number of clean water projects, nutritional projects, and the extremely popular “Warastai” soccer tournament between villages.  Such activities are important in gaining and maintaining social license to operate with Aurania’s stakeholders.  Ms. Lasso is an Ecuadorian resident and is fluent in both English and Spanish.

The number of daily new COVID-19 infected cases in the Province of Morona-Santiago where Aurania’s Project is located has now dropped in half from a month ago.  The Red Alert in Ecuador has not yet been lifted but there is optimism the pandemic is abating.


About Aurania

Aurania is a mineral exploration company engaged in the identification, evaluation, acquisition and exploration of mineral property interests, with a focus on precious metals and copper in South America.  Its flagship asset, The Lost Cities – Cutucu Project, is located in the Jurassic Metallogenic Belt in the eastern foothills of the Andes mountain range of southeastern Ecuador.

Information on Aurania and technical reports are available at www.aurania.com and www.sedar.com, as well as on Facebook at https://www.facebook.com/auranialtd/, Twitter at  https://twitter.com/auranialtd, and LinkedIn at https://www.linkedin.com/company/aurania-resources-ltd-.

For further information, please contact:

Carolyn Muir

VP Investor Relations

Aurania Resources Ltd.

(416) 367-3200

carolyn.muir@aurania.com

Neither the TSX Venture Exchange nor its Regulation Services Provider (as that term is defined in the policies of the TSX Venture Exchange) accepts responsibility for the adequacy or accuracy of this release.


Forward-Looking Statements

This news release may contain forward-looking information that involves substantial known and unknown risks and uncertainties, most of which are beyond the control of Aurania. Forward-looking statements include estimates and statements that describe Aurania’s future plans, objectives or goals, including words to the effect that Aurania or its management expects a stated condition or result to occur. Forward-looking statements may be identified by such terms as “believes”, “anticipates”, “expects”, “estimates”, “may”, “could”, “would”, “will”, or “plan”. Since forward-looking statements are based on assumptions and address future events and conditions, by their very nature they involve inherent risks and uncertainties. Although these statements are based on information currently available to Aurania, Aurania provides no assurance that actual results will meet management’s expectations. Risks, uncertainties and other factors involved with forward-looking information could cause actual events, results, performance, prospects and opportunities to differ materially from those expressed or implied by such forward-looking information. Forward looking information in this news release includes, but is not limited to Aurania’s objectives, goals or future plans, statements, exploration results, potential mineralization, the corporation’s portfolio, treasury, management team and enhanced capital markets profile, the estimation of mineral resources, exploration, timing of the commencement of operations and estimates of market conditions. Factors that could cause actual results to differ materially from such forward-looking information include, but are not limited to, failure to identify mineral resources, failure to convert estimated mineral resources to reserves, the inability to complete a feasibility study which recommends a production decision, the preliminary nature of metallurgical test results, delays in obtaining or failures to obtain required governmental, regulatory, environmental or other project approvals, political risks, inability to fulfill the duty to accommodate indigenous peoples, uncertainties relating to the availability and costs of financing needed in the future, changes in equity markets, inflation, changes in exchange rates, fluctuations in commodity prices, delays in the development of projects, capital and operating costs varying significantly from estimates and the other risks involved in the mineral exploration and development industry, the effects of COVID-19 on the business of the Company including but not limited to the effects of COVID-19 on the price of commodities, capital market conditions, restrictions on labour and international travel and supply chains, and those risks set out in Aurania’s public documents filed on SEDAR. Although Aurania believes that the assumptions and factors used in preparing the forward-looking information in this news release are reasonable, undue reliance should not be placed on such information, which only applies as of the date of this news release, and no assurance can be given that such events will occur in the disclosed time frames or at all. Aurania disclaims any intention or obligation to update or revise any forward-looking information, whether as a result of new information, future events or otherwise, other than as required by law.