Image Credit: 3126 Fishery (Flickr)
Small-Cap Stocks Could Enter the New Year with a Large Tailwind
As measured by the S&P 600, small-cap stocks are trading cheaper than they have since the early 2000s during the burst of the dot.com bubble – at least when compared to large-cap stocks. This could indicate that the investment trend to follow momentum rather than value is providing investors many overlooked opportunities in stocks with lower capitalizations.
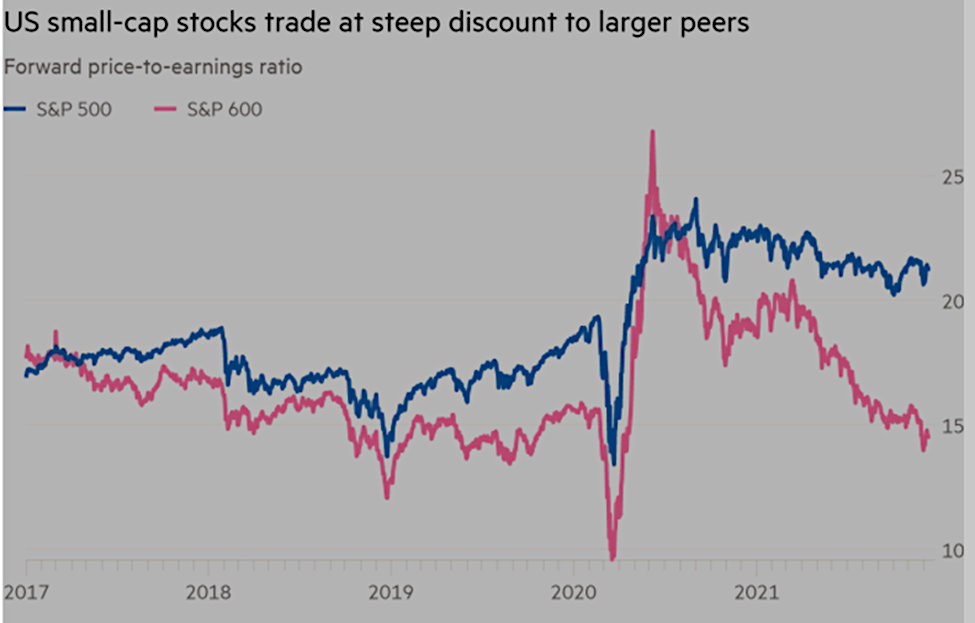
The S&P Small-Cap 600 is an index that measures the small-cap segment of U.S. equities. When compared to the more often quoted S&P 500, which measures large-cap companies, the large-cap index stocks are on average far more expensive. As proof, the S&P 600 price-to-earnings ratio, which was on par five years ago, is now 68% of the S&P 500. The last time the gap had been this wide was 20 years ago, as the tech bubble burst putting small companies out of favor.

Source: FactSet
As shown in the chart above, the S&P 600 index is now priced at 14.5 times expected earnings over the next year. The valuation is well below historical norms and 21.3 times the large-cap S&P 500 index, which includes FAANG stocks among others.
With smaller U.S. listed companies are priced at a steep discount to larger ones, the small-cap sector could still be considered inexpensive despite the rally they both experienced since April 2020. This disparity begs the question, “when will fund managers with full discretion look for better values?” The answer may be “soon.” It could occur after year-end window dressing subsides and equity managers are less prone to need to show the year’s biggest winners in their holdings.
The other question is, “when will the gap shrink to a more historical norm?” The answer may be, early in the first quarter of next year. The reason is this. Many fund managers are inclined toward holding stocks that have performed well during the year to show those holdings on their year-end statements. This “window dressing” is not at all uncommon in the fund management industry. Once these securities are reported on statements as part of a portfolio’s holdings (after 12/31), the fund manager may feel freer to invest using basic fundamentals and less on appearances.
Take-Away
The Price Earnings disparity between large-cap stocks and small-cap stocks (as measured by the S&P indexes) is glaring. The trend toward chasing stocks that have spiked up over the past 18 months, causing them to move even higher, will end one day. That day may be soon as the new year provides a clean slate for fund managers to prove themselves. The playbook that works next year will likely be different from the Covid related trading that worked this year. In the meantime, shares of companies that have done well will look appealing on a fund managers’ year-end holdings reports.
Channelchek is an investor resource for small and microcap stocks. No-cost registration allows users access to premium research and provides daily information straight to their inbox.
Sources:
https://www.macrotrends.net/2577/sp-500-pe-ratio-price-to-earnings-chart
https://www.ft.com/content/a894adff-7ca2-4fdc-bc85-c43bc2c53491
https://www.spglobal.com/spdji/en/indices/equity/sp-600/#overview
Stay up to date. Follow us:

|

