M2 is Fuel for Inflation, How Much Money Must the Fed Drain to Achieve 2 Percent?
U.S. Money Supply, measured as M2, is an important consideration when forecasting inflation. A decline in immediately available cash in the economy has a downward effect on price levels. At the same time, less cash available to consumers also cools economic growth. With the Federal Open Market Committee’s (FOMC) interest rate decision coming the first week in May, the updated report this week (for March) will give investors a look see at how successful the Fed has been draining funds from the system while trying to maintain some growth.
M2 Shrinking
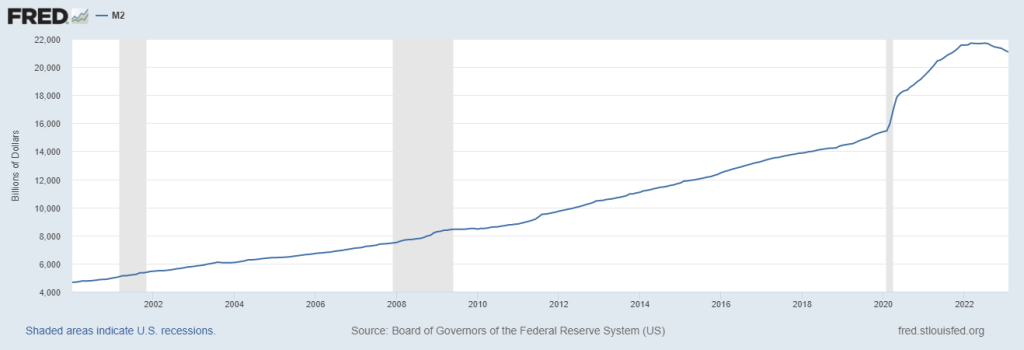
The Federal Reserve will update stock and bond markets Tuesday afternoon on the total amount of currency, coins, bank savings deposits, and money-market funds held in March. This broader measure, officially M2SL, referred to as M2, gained renewed focus after contracting for the first time ever in December 2022, then contracting even further in January and February. January’s 1.75% decline and February’s 2.4% drop to $21.1 trillion, are the steepest drops so far in M2.

A fourth consecutive decline in M2 would provide more evidence that inflation can be expected to continue to come down and weigh into the FOMC decision when the Fed meets to adjust monetary policy at its May 2-3 meeting. While the chart above shows the recent declines are significant, it is still far higher than the trend line that was established decades ago. So while a decline of similar magnitude as the first two months would be welcome by inflation hawks, there is still a great deal more cash in the system than there was pre-pandemic. But it would be a huge positive and may cause the Fed to pause or slow draining money from the system.
Inflation
Consumer price inflation is well off its 8.6% average for all of 2022. Inflation since rose 5% in March 2023 (annual basis), decelerating from February’s 6% pace. While this slowdown in price increases is substantial, the Fed doesn’t want to declare “mission accomplished” until it is ranging near 2%. Its work is not yet finished.
How close is the Fed from finished is what investors will try to discern from M2. Highly regarded analysts and Fed watchers anticipate that there is a lag of about a year when the money supply shrinks. However, as indicated above, it has never come down on an annualized basis, and January and February were the largest declines to date. So even the best analysts have little history to point to.
Financial Sector
The data is for March, so it is the first look at M2 since the banking sector showed trouble early that month. A part of the difficulty banks are currently experiencing is that the reduction in cash has caused a need for them to liquidate U.S. Treasuries and other bonds to fund withdrawals. A further huge reduction in M2 could be shown to be challenging more banks as bonds and other interest rate-sensitive assets had lost considerable value as rates rose dramatically over the past year.
Using the most recent data, the Federal Reserve reported bank deposits were down 6% for the week ending April 12 versus a year ago. Deposits have been falling year-over-year since November, off slightly at $17.2 trillion compared to the highest-ever $18.2 trillion level seen in April last year.
Further declines in deposits should lead to fewer loans written, fewer loans slows economic growth. This in part, accounts for why there is a lag between when the Fed drains and when it has an impact on inflationary pressures.
Take Away
M2 is an important gauge of future inflation. Because of this, the release of data may cause economists to change their May FOMC meeting forecast. A large decline may cause the Fed to pause, if M2 resumed its path upward the Fed may become more hawkish. Efforts to help the banking system last month, may have reinflated money supply, this will be a very interesting report.
Managing Editor, Channelchek
Sources
https://www.federalreserve.gov/mediacenter/files/FOMCpresconf20230322.pdf
https://fred.stlouisfed.org/series/M2SL#
https://rationalreasoning.substack.com/p/on-the-feds-discontinuation-of-the
https://www.barrons.com/articles/fundamental-reason-interest-rates-will-come-down-444ab9c