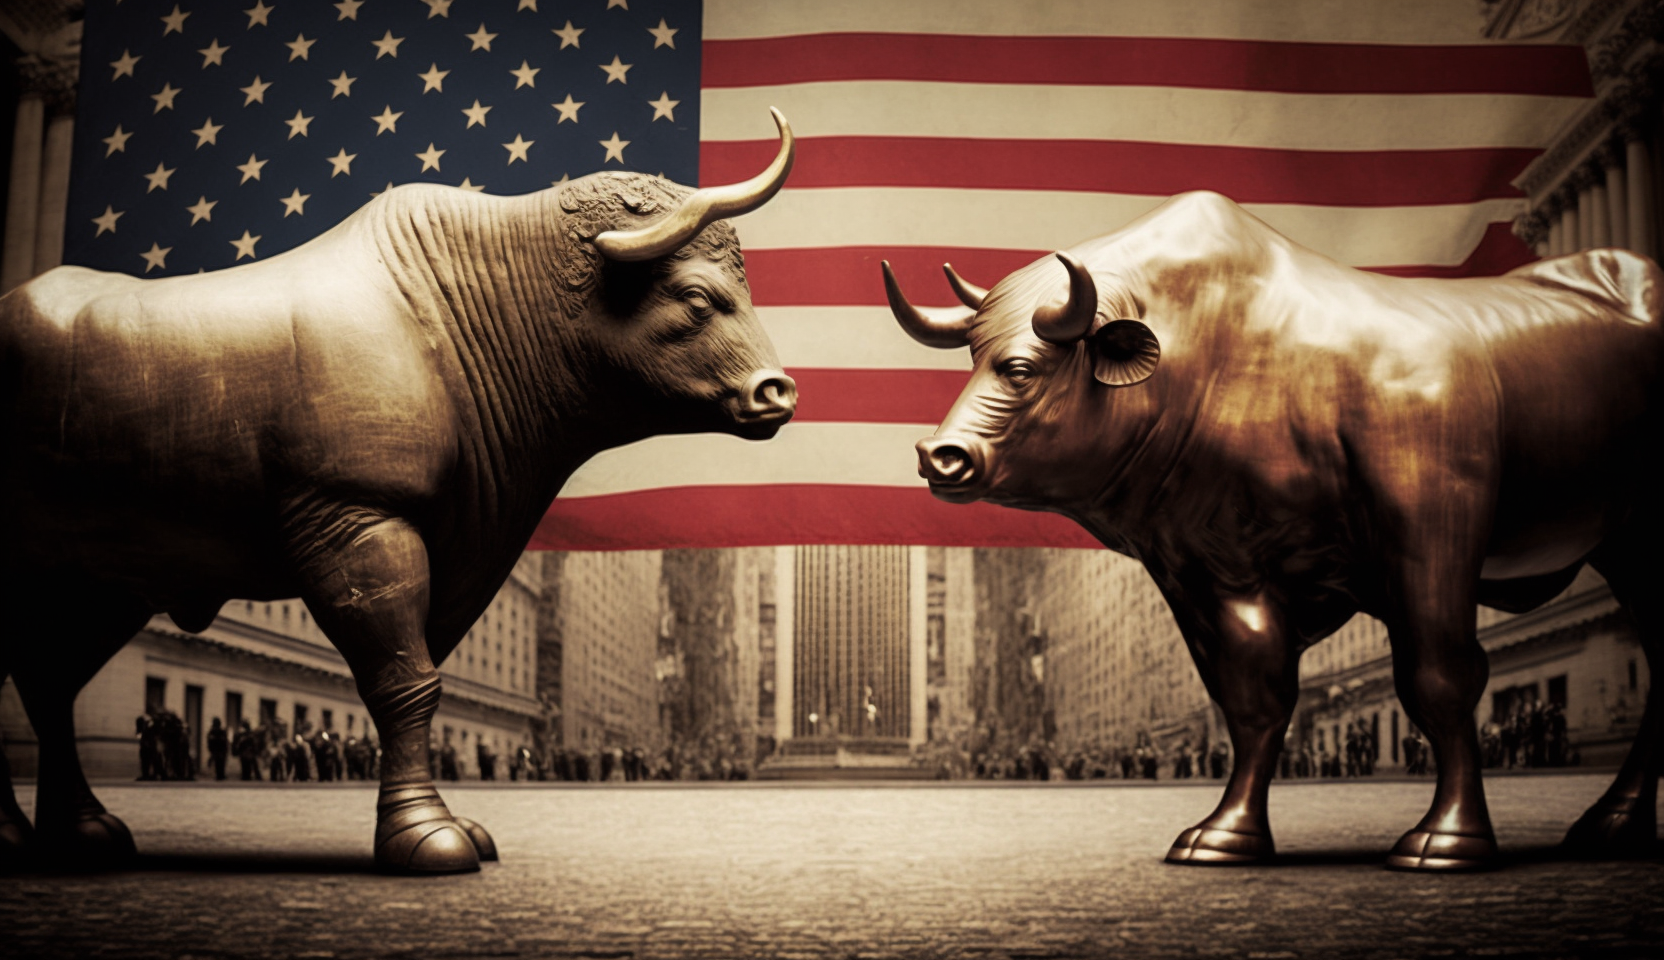
Elections and the Stock Market: Navigating the 2024 US Presidential Race

Key Points:
– The 2024 US election may increase market volatility
– Policy proposals could impact various economic sectors
– Long-term investment strategies remain crucial despite short-term political events

As the 2024 US presidential election approaches, investors are keenly watching how the political landscape might influence their portfolios. With election day set for November 5, 2024, understanding the potential impacts of this specific election cycle on the financial markets is crucial for informed decision-making.

The 2024 election is particularly significant as it follows a period of economic uncertainty, including high inflation and interest rates. Investors are closely monitoring how candidates’ policies might address these issues and shape the economic landscape moving forward.

Several key policy areas are under scrutiny. Proposals for corporate tax rates and capital gains taxes could significantly impact company profits and investor returns. Potential changes in regulatory frameworks, especially in sectors like technology, finance, and energy, may affect industry leaders and emerging companies alike. Government spending plans, including infrastructure initiatives, healthcare reforms, and climate policies, could influence various sectors of the economy. Additionally, stances on international trade, particularly regarding relationships with China and other major economic partners, may affect global markets and supply chains.

As we move closer to November, expect increased market volatility. The VIX index, often called the “fear gauge” of the market, typically rises during election years, and 2024 is likely to follow this pattern. However, it’s crucial to remember that while short-term fluctuations can be unsettling, they often have little bearing on long-term market trends.

Current polls and predictions should be taken with a grain of salt. The 2016 and 2020 elections demonstrated that unexpected outcomes are possible, and markets can react swiftly to surprises. Investors should be prepared for potential market movements in either direction as election day approaches and results unfold.

Specific sectors to watch in this election cycle include healthcare, energy, technology, and financial services. Healthcare proposals could significantly impact insurance companies, pharmaceutical firms, and hospital operators. Energy policies on fossil fuels, renewable energy, and climate change may cause shifts in the sector. In technology, discussions around data privacy, antitrust measures, and AI regulation could affect tech giants and emerging companies. Financial services may see changes due to potential shifts in banking regulations and monetary policy approaches.

For investors navigating this election season, several strategies are worth considering. Reviewing your asset allocation ensures your portfolio is well-diversified and aligned with your long-term goals, regardless of the election outcome. While staying informed is important, avoid overreacting to polls or predictions. If you’re concerned about volatility, focusing on defensive sectors like utilities and consumer staples can provide more stability during uncertain times.

Market overreactions to political news can sometimes create buying opportunities for long-term investors. It’s also crucial to maintain a global perspective, remembering that many US companies derive significant revenue from overseas, potentially mitigating the impact of domestic policy changes.

As November 5 approaches, it’s natural to feel uncertainty about the markets. However, historical data shows that elections typically have a limited long-term impact on market performance. Regardless of the outcome, the fundamentals of sound investing remain the same: focus on your long-term goals, stay diversified, and avoid making emotional decisions based on short-term political events.

In conclusion, while the 2024 US presidential election will undoubtedly create some market waves, it’s crucial to maintain perspective. By staying informed, prepared, and focused on your long-term investment strategy, you can navigate this election season with confidence. Remember that beyond the election cycle, factors such as economic growth, corporate earnings, and technological advancements continue to be significant drivers of market performance in the long run.

Global Market Turmoil: VIX Spikes to Pandemic-Era Highs as Recession Fears Intensify

Key Points:
– The VIX spiked to its highest level since March 2020, indicating high market volatility.
– Major indices, including the Dow and Nasdaq, suffered significant losses amid recession fears.
– Experts urged the Federal Reserve to consider emergency rate cuts to stabilize the economy.

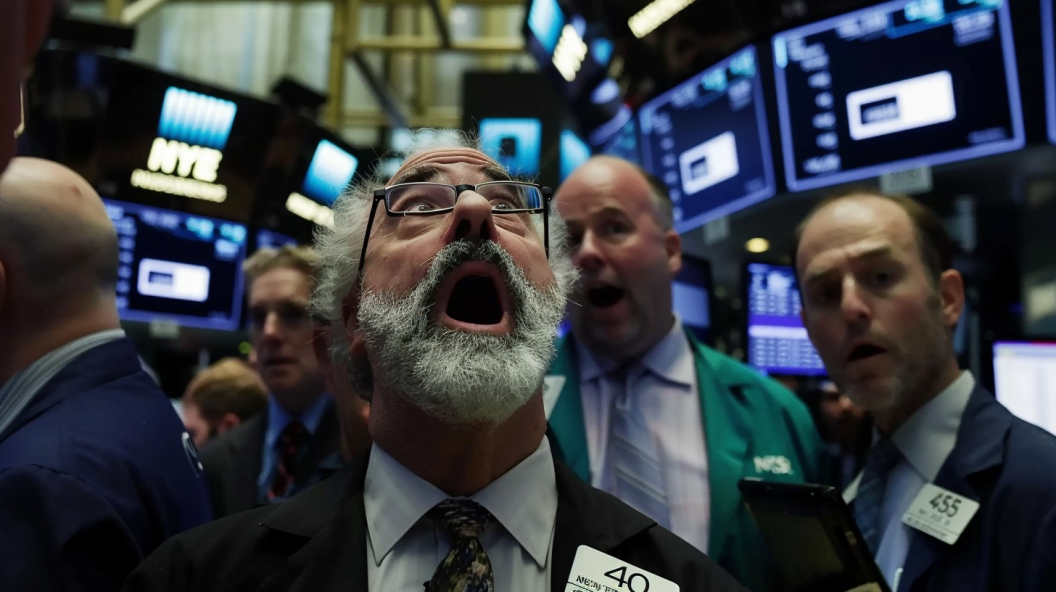
In a significant development for global financial markets, the Cboe Volatility Index (VIX), commonly known as Wall Street’s “fear gauge,” surged to its highest level since the pandemic-driven market plunge in March 2020. This increase in volatility comes amid a sharp sell-off in equities, driven by mounting concerns about a potential U.S. recession and disappointing economic data.

The VIX briefly soared above 65 on Monday morning, a dramatic rise from about 23 on Friday and roughly 17 just a week ago. It later cooled to about 42 shortly after 10 a.m. ET, reflecting ongoing market turbulence. The last time the VIX reached such heights was in March 2020, when it climbed as high as 85.47 following the Federal Reserve’s emergency actions during the Covid-19 pandemic.

The VIX is calculated based on market pricing for options on the S&P 500 and is designed to measure expected volatility over the next 30 days. It is often used as an indicator of investor fear and market uncertainty. Historically, spikes in the VIX have coincided with significant market sell-offs, although they can also precede swift recoveries.

Monday’s market rout saw the Dow Jones Industrial Average drop 854 points, or 2.1%, while the Nasdaq Composite lost 3.1%, and the S&P 500 slid 2.5%. The decline was part of a broader global sell-off, with Japan’s Nikkei 225 plunging 12%, marking its worst day since the 1987 Black Monday crash.

The sell-off was triggered by a combination of factors, including fears of a U.S. recession, disappointing July jobs data, and concerns that the Federal Reserve is not acting quickly enough to cut interest rates to support the economy. The Fed recently chose to keep rates at their highest levels in two decades, exacerbating investor anxiety about economic growth.

Tech stocks were among the hardest hit, with Nvidia falling more than 5%, Apple dropping nearly 4.6% after Warren Buffett’s Berkshire Hathaway halved its stake in the company, and Tesla down 10%. Other major losers included Broadcom and Super Micro Computer, down 7% and 12%, respectively.

The bond market also reflected heightened fears, with U.S. Treasury yields tumbling as investors sought safe havens. The yield on the benchmark 10-year note fell to 3.7%. Meanwhile, Bitcoin experienced a sharp decline, falling from nearly $62,000 on Friday to around $52,000 on Monday.

In Asia, the Nikkei 225’s 12.4% loss underscored the global nature of the sell-off. The index closed at 31,458.42, its worst day since 1987, with a record point drop of 4,451.28. The decline was exacerbated by the Bank of Japan’s decision to raise interest rates, which ended the yen “carry trade” and increased the yen’s value against the U.S. dollar.

The sharp increase in the VIX and the corresponding market declines have prompted calls for urgent action. Jeremy Siegel, Wharton professor emeritus and chief economist at Wisdom Tree, urged the Federal Reserve to implement an emergency 75 basis point cut in the federal funds rate and to consider another cut at the September meeting. Chicago Fed President Austan Goolsbee also acknowledged that current interest rates might be too restrictive and suggested that the central bank would take necessary actions if economic conditions deteriorate further.

As markets continue to digest these developments, investors are closely monitoring economic data and Federal Reserve communications for signs of stability. The interplay between economic indicators, Fed policy, and market reactions will be crucial in determining the trajectory of the financial markets in the coming weeks. With three more Fed meetings scheduled for this year, there remains ample opportunity for the central bank to adjust its policy stance in response to evolving economic conditions.

The dramatic rise in the VIX serves as a stark reminder of the market’s vulnerability to economic uncertainties and the importance of vigilant policy responses to maintain stability and investor confidence.

Traders Vexed by VIX – Should They Be?

As the Fear Index Screams Upward, It’s Worth Noting It is Still Near It’s 2023 Low

Suddenly, the Volatility Index or VIX, is trending. While the month of June showed extremely low volatility in stocks, the FOMC Minutes on July 5th lit a fuse on investors during a relatively low-volume holiday trading week. Whether the VIX level increases or remains elevated from here remains to be seen, but it is important to understand what it usually indicates, what it does not, and how traders use the CBOE’s Volatility Index.

The VIX, short for the Chicago Board Options Exchange Volatility Index, is a measure of market volatility. It is calculated based on the prices of S&P 500 index options, and it is often referred to as the “fear index” because it tends to rise when investors are feeling more fearful about the market. It reached its low point of the year (-40%) on June 22nd as volatility has been trending down since the start of Spring. While it bounced in dramatic fashion this week, it is important to note that this is a thinly traded week, and the index is still -29% YTD.

The Vix is Up Over 13% in Less Than a Week

Source: Koyfin

What is the VIX that is So Important?

The VIX index is a derivative instrument that is widely traded. By some, to hedge portfolio risk, by others to speculate on the direction of stock market volatility. According to the CBOE, it is “a real-time index that represents the market’s expectations for the relative strength of near-term price changes of the S&P 500 Index (SPX).” The CBOE uses prices in the SPX Index (S&P 500) with short expiration dates, then it generates a 30 day projection of how quickly prices may change, which is volatility. It is often called the “fear index” as volatility shows a more erratic market that both stems from fear and produces fear.

The Index is not a perfect predictor of market activity, but it can be a useful tool for investors. It is important to remember that the VIX index is based on options prices, and options prices can be volatile themselves. As a result, the VIX index can sometimes give false signals.

How is it Used

Investors use the VIX index in a number of ways. Some investors use it to gauge the overall level of risk in the market. Others use it to help them decide whether to buy or sell stocks. And still others use it to hedge their portfolios against market volatility.

To gauge the overall level of risk in the market. The VIX index is a good way to get a sense of how worried investors are about the market. A high VIX index indicates that investors are feeling more fearful, while a low VIX index indicates that investors are feeling more confident.

Some investors use the VIX index to help them decide whether to buy or sell stocks. If the VIX index is high, they may be more likely to sell stocks, as they believe that the market is likely to be volatile. If the VIX index is low, they may be more likely to buy stocks, as they believe that the market is likely to be stable.

Investors can use the VIX index to hedge their portfolios against market volatility. For example, they can buy VIX futures or options to smooth returns or protect themselves from losses if the market becomes more volatile.

It is important to remember that the VIX index is not a perfect predictor of market activity. It is based on options prices, and options prices can be volatile themselves. As a result, the VIX index can sometimes give false signals. However, the VIX index can be a useful tool for investors who are looking to get a sense of the overall level of risk in the market and to help them make informed investment decisions.

Take Away

The Vix Index is off its low for the year,  it was reached in late June. The speed at which it rose this week may caused fear, but the move could be exaggerated by a holiday-shortened thinly traded week in the markets. There does however seem to have been a change in thinking among the securities markets. U.S. Treasury rates out in the longer periods rose after the FOMC minutes were released. The stock market for months has been viewing good economic news as bad and bad economic news as good. The minutes, coupled with an employment report this week indicate a still strong economy. The stock market was wishing for weak economic reports as participants feared higher Fed induced interest rates.

Whether the new sentiment among bond traders holds remains to be seen. If it does, the yield curve will take on a normal slope. Will a positively sloping curve be viewed by stock market investors and those that believed the inverted curve indicated a recession as bullish? Time will tell.

Paul Hoffman

Managing Editor, Channelchek