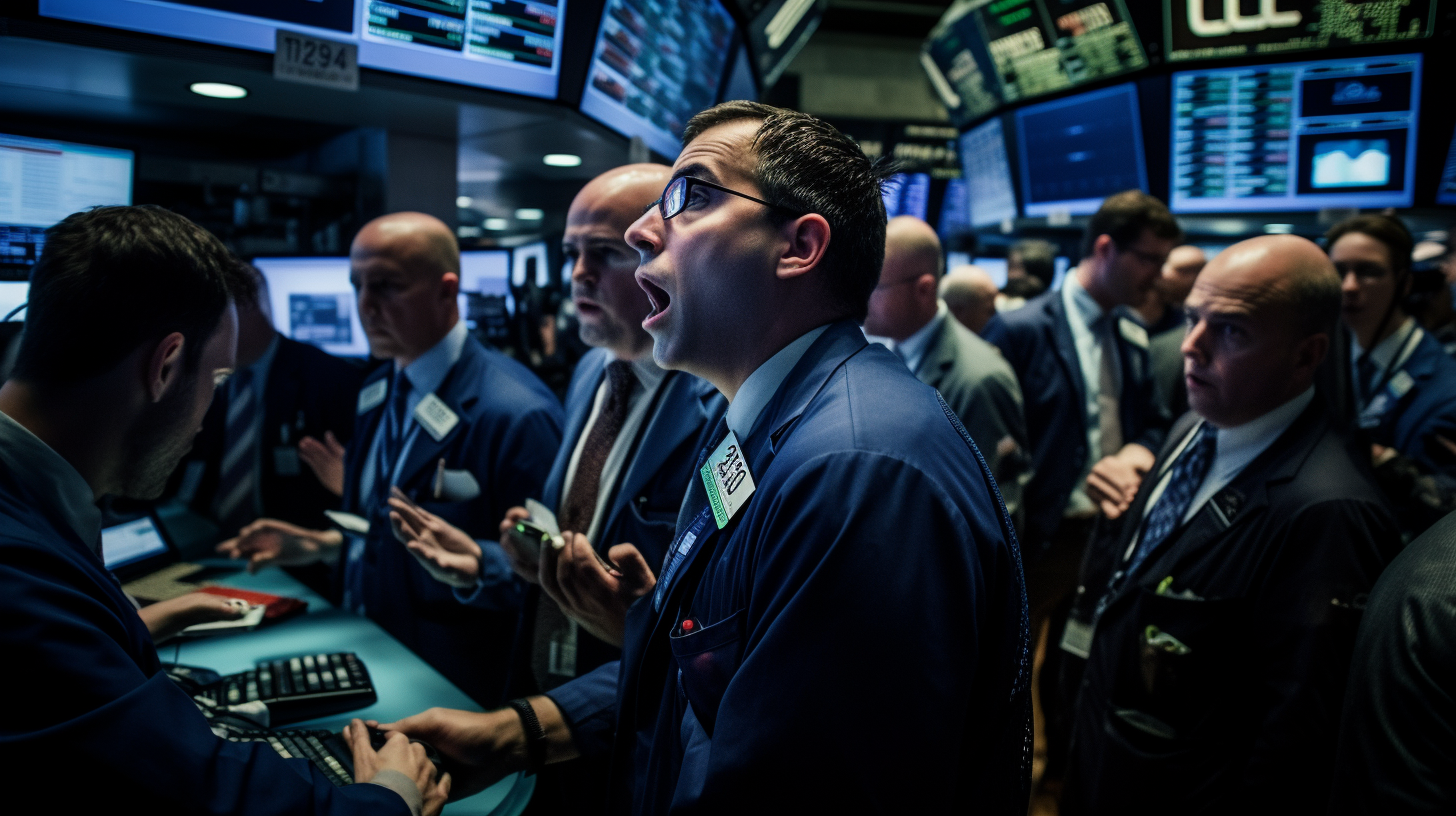
Tech Sell-Off Hits Broader Stock Market

After a torrid five-week run higher, Wall Street took its foot off the gas this week as investors moved to book some profits. The S&P 500 dropped 1.8% over the last five sessions, ending an impressive stretch that saw the broad index rally over 6% since late April.

At the core of this week’s pullback was a cooldown in red-hot technology stocks benefiting from the artificial intelligence frenzy. Semiconductor giant Nvidia, whose blowout earnings last week turbocharged the AI trade, shed over 9% this week as traders moved to cash in some of those monster gains.

Other mega cap tech leaders like Microsoft, Amazon, and Alphabet also gave back ground, contributing to a 2.4% weekly slide for the Nasdaq Composite. With Big Tech serving as a weight on the market’s shoulders, the venerable Dow Jones Industrial Average wasn’t spared either – the blue-chip index dropped over 2% itself.

The downshift marked an overdue pause that refreshed for the often overly-exuberant market. After storming nearly 15% off the lows over the previous seven weeks, a little air had to come out of the balloon, even with economic data continuing to hold up.

On the economic front, the core Personal Consumption Expenditures (PCE) reading rose 2.8% year-over-year in April, slightly exceeding estimates. While inflation remains stubbornly high, the lack of a major upside surprise helped soothe fears of the Fed needing to pivot towards an even more aggressive policy stance.

The underlying commodity and service costs feeding into the PCE suggest inflation could start to moderate in the second half of 2023. That aligns with current Fed forecasts projecting two more 25 basis point rate hikes before calling it quits on this tightening cycle.

Assuming the Fed can stick the landing without snuffing out economic growth, conditions could remain conducive for further equity upside. History shows the S&P 500 tends to bottom around six months before the end of a tightening cycle – and rally sharply in the following 12 months.

This week’s dip may have seemed like an ominous turn, but it really just returned the major indexes back in line with the performance of other segments of the market. The Russell 2000 small-cap index and Russell 3000 representing the entire U.S. equity market have been lagging the S&P 500’s advance.

Over the past month, the Russell 3000 is up a more modest 2.8% versus a 5.2% gain for the big-cap dominated S&P 500. Small-caps as represented by the Russell 2000 have fared even worse with a 1.4% advance over that span.

Analysts pointed out small-caps have struggled to sustain upside momentum. Despite bouncing back from October’s lows, the Russell 2000 is still down 6% year-to-date versus a 10% rise for the large-cap Russell 1000.

Higher financing costs, softer economic growth prospects, and the fading benefits of 2022’s rally could continue to weigh on smaller stocks in the second half.

If large-cap tech remains under pressure, it could help narrow the performance gap – with the Russell mega-caps ceding some of their market-leading gains. But for now, most of Wall Street appears comfortable viewing this week’s pullback as simply clearing the way for the next move higher.

After all, some long-overdue profit-taking and consolidation can ultimately be healthy, helping reset overbought conditions and set the stage for sustained upside.

Choppy Waters: S&P 500 Faces Longest Slump Since the 2020 Crash

The S&P 500 is staring down a dubious milestone – its first 3-month losing streak since the COVID-19 pandemic upended markets back in early 2020.

Barring a dramatic turnaround this week, the index will log declines in August, September and October. That hasn’t happened since a brutal 5-month free fall ended in March 2020.

The benchmark index has sunk over 10% from peaks hit in late July. After four straight down weeks, the S&P 500 dipped into correction territory last Friday.

That marks a ten percent drop from all-time highs reached just three months ago in July. However, the index remains up around 8% year-to-date.

The S&P 500, and What It Represents

For context, the S&P 500 represents the broader U.S. stock market across major sectors of the economy. It tracks the stocks of 500 large American companies selected by a committee at S&P Dow Jones Indices.

The index covers around 80% of available market capitalization. Exposure spans mega-cap technology leaders like Apple, Microsoft and Amazon to energy giants like Exxon and Chevron.

The S&P 500 functions as a barometer for the country’s economic health. The performance and reactions within the index drive news cycles and often dictate investor sentiment.

Trillions in assets are benchmarked to the S&P 500. That includes huge passive funds like those offered by Vanguard and BlackRock’s iShares. The index is also a favorite benchmark for active managers trying to beat the market.

Given its stature and ubiquity, sustained declines in the S&P 500 raise investor fears and make headlines. Its ongoing slide has been driven largely by surging inflation, rising interest rates, and recession worries.

History of Late-Year Rebounds

While unpleasant, the S&P 500’s current slump isn’t out of the ordinary from a historical perspective. The index has averaged a 14% peak-to-trough decline in intra-year pullbacks since 1950 according to data from Carson Group’s Ryan Detrick.

And when the index falters during the late summer and early fall months, strong year-end rebounds have usually followed.

In the 5 prior years where August, September and October saw declines, the S&P 500 rose 4.5% on average over November and December. The lone exception was 1957 when it managed a slight loss.

So despite growing skittishness on Wall Street, historical trends bode decently for markets to close 2023 on a high note.

Drivers of the Current Decline

Like most substantial sell-offs, fears of slowing economic growth and a hawkish Federal Reserve have driven the current slide.

Surging inflation led the Fed to rapidly raise interest rates in order to cool down demand. Higher rates pressure different areas of the market like long-duration tech stocks.

Meanwhile, recession odds have climbed as housing and manufacturing data weakened. The strong U.S. dollar has also impacted multinational corporate earnings.

Geopolitical turmoil surrounding Russia’s war in Ukraine coupled with US-China tensions exacerbated volatility. It amounted to a deteriorating backdrop that sent the S&P 500 downhill fast.

Now with consumer prices potentially peaking, Fed rate hikes slowing, and earnings holding up, optimism is regrowing. Valuations also look more attractive after the steep pullback.

Many strategists see the negativity as overdone and expect a rally into year-end. However, tests likely remain until concrete evidence of an inflation or economic slowdown emerge.

S&P 500 Outlook and Implications

While disconcerting on the surface, the S&P 500’s bout of weakness isn’t unprecedented. The question is whether it represents a normal correction or the start of a bear market.

Broadly, analysts think major indices will close out 2023 with mid-single digit gains. But forecasts vary widely from low single digits to returns over 10% above current levels.

If historic trends repeat, odds favor a recovery once the calendar flips to November. Although with midterm elections ahead, politics could play an outsized role in market swings.

Regardless, the S&P 500 ending its 3-month rut would be welcomed by investors. Sustained declines often signal greater worries about the economy and corporate profits.

Given the importance of consumer and business confidence, ending 2023 on an upswing would bode well for preventing a deeper downturn. But the Fed’s moves to squash inflation will remain an overhang into 2024.