Should We Be Bullish on Small Caps?

Powell’s Right About the Resilient Economy, How it May Affects Some Stocks

One can generalize and say small cap companies are more sensitive to recessions than large caps – and they would be correct. In his speech in Jackson Hole, Fed Chair Jerome Powell said, “But we are attentive to signs that the economy may not be cooling as expected. So far this year, GDP growth has come in above expectations and above its longer-run trend, and recent readings on consumer spending have been especially robust.” His words sound like a soft landing, no landing, or puts any hard landing far off into the future. Over the past few years, the performance of small-cap stocks has not held its own relative to the performance of large caps when highly weighting the stratospheric performance of mega caps. 

After the most recent year and a half of both business news and investors expressing recession concerns, the newer conversation is one of an economic soft landing. Those mentioning the inverted yield curve “proof” has been silenced as rates out on the curve have begun to move steadily higher. The conversation has now been replaced with expectations of increased economic activity. Even if expectations don’t fully come to fruition, it is expectations that move markets – just look at last year’s down stock market which was the result of investors expecting a recession was imminent. 

Will Small Caps Finally Run With the Bulls?
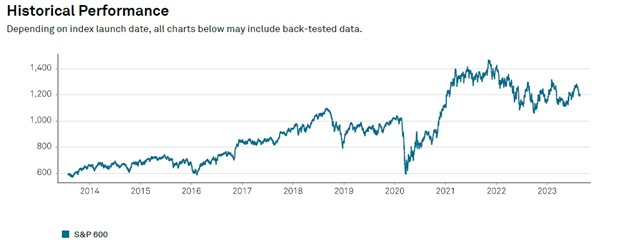
The S&P 600 Small Cap Index is is at the same level as December 2020
(Source: S&P Dow Jones Indices)

The S&P 600 small cap index is up by nearly a third as much as the S&P 500 this year (4.40% versus 13.98%) and trades at only 15 times earnings. BofA Securities using Russell Index numbers for its analysis of Russell 1000 large cap and Russell 200 small cap indexes, calculated that small companies are 30% cheaper than usual in comparison to big ones. Over the next decade, according to BoA Securities estimates, small caps are poised to gain an average of 11% a year versus 4% for large caps.

Source: S&P Dow Jones Indices

The S&P 600 Small Cap Index has underperformed the S&P Large Cap Index by nearly 10% over the past year. Another well-respected firm, T. Rowe Price, takes the expectations in small-caps a step further in its August insight report titled: The Outlook for U.S. Smaller Companies Looks Increasingly Compelling (Now is not the time to wait on the sidelines). The report highlights additional factors supporting the increased probabilities of small-cap performance.

T. Rowe Price discussed how smaller companies are more oriented towards U.S. economic activity. The author,  Curt Organt, the portfolio manager of the firms smaller company equity strategy, also pointes to the many bills in Congress that support capital spending projects in the U.S., explaining this will also provide a tailwind.

•             “While the U.S. equity market has become increasingly concentrated at the top end over the past decade, smaller‑company valuations are at their most compelling levels in decades.”

•             “History shows that as high concentration in the S&P 500 Index begins to unwind, a new cycle of small‑cap outperformance usually begins.”

•             “Shifting trends in the U.S. economy are particularly supportive of smaller companies, providing a potential catalyst for higher earnings growth.”

The portfolio manager discussed how, through history, investors in small-cap stocks ordinarily command higher relative valuations compared to their larger counterparts. At present, as mentioned before, small-cap stocks are currently trading at a substantial discount in relation to large-cap stocks.

Downside protection is also seen as a positive in small-caps, whether compared to its own history, or to today’s large cap valuations. The low valuations in the smaller companies do offer a degree of downside protection during market downturns.

Take Away

 At the conclusion of his Jackson Hole speech, Powell said, “As is often the case, we are navigating by the stars under cloudy skies. In such circumstances, risk-management considerations are critical.” Although he was talking about U.S. monetary policy, the words apply equally well if applied to a portfolio’s investment policy. One can never be completely sure of what is around the corner that can either accelerate returns or set the portfolio back. But, placing probabilities on your side, over time, is good practice.

One can never have too much information when selecting companies to invest in. Small company information is particularly challenging for investors to find. Creating a login to Channelchek allows access to data on 6,000 small and microcap companies; this may be the key to further placing investment probabilities on your side. And, if you’d like to take your exploration for the ideal smaller companies to invest in to a higher level, join Noble Capital Markets and Channelchek at its annual investment conference, NobleCon19, this fall.

Paul Hoffman

Managing Editor, Channelchek

Sources

https://advantage.factset.com/hubfs/Website/Resources%20Section/Research%20Desk/Earnings%20Insight/EarningsInsight_080423.pdf

https://www.spglobal.com/spdji/en/indices/equity/sp-600/?utm_source=pdf_commentary#overview

https://www.spglobal.com/spdji/en/indices/equity/sp-600/#overview

https://www.spglobal.com/spdji/en/indices/equity/sp-500/#overview

https://www.troweprice.com/content/dam/gdx/pdfs/2023-q3/the-outlook-for-us-smaller-companies-looks-increasingly-compelling.pdf

Signs We May Be Witnessing the End to the Indexed-Fund Stranglehold

Dominance of Indexed Funds May Be Giving Way to a Preference for Diversification

Not many years ago, the most widely followed stock market index was the Dow Jones Industrial Average, or Dow 30 (DJIA). This practice slowly changed and a broader benchmark, the S&P 500, became the new gauge of market moves. Both have the same purpose, to provide a big-picture view of whether stock prices generally are moving up, down, or sideways over a period – and by how much. The DJIA has fallen out of favor as investors grew more sophisticated and came to realize the Dow only tracks 30 stocks. So it was considered not representative of the entire stock market – which includes thousands of different companies. With only 30 stocks impacting its price, it was not disperse enough to be the preferred stock market index. After all, the DJIA’s performance can be significantly influenced by the performance of the 30 stocks, which at times can veer far from indicative of the broad market.

The S&P 500, which is weighted by market capitalization, is beginning to feel the impact of its own loss of diversity. As of June 2023, the top 10 companies in the S&P 500 account for over 25% of the index’s total market capitalization. That is, the weight of 25% of market moves impacting the index comes from just 10 stocks and these can all be considered technology stocks. For portfolios it means that investors who believe the S&P 500 reflects the market, might actually be more accurate if they went back to the index with 30 stocks in a wider array of industries.

I’m not suggesting that we should all start following the Dow. Instead, I am suggesting that there is risk to index investors that are looking to participate in the overall market and are using the S&P 500. Portfolio managers looking to spread risk may want to purposefully add diversity to their holdings.

In contrast to the upper 25%, the lower 25% of the S&P 500 is a diverse group of industries, with no single industry accounting for more than 20% of the weight. This means that the performance of the lower 25% of the S&P 500 is not as dependent on the performance of any single industry. From “stock market 101,” we know that the risk (not necessarily return) is greater in the top 25%. Focusing on risk-adjusted return is how most managing their portfolio do well over time.

Over the past several years, including last year’s down draft, tech has, on average, been the leader. Carrying companies that make up the top 25% in large cap indexes, MSFT, AAPL, META, GOOGL, etc. have been additive to performance. This has helped, as not only has it lifted large-cap indexed funds returns, but it sent more money into these indexed funds, which served to further increase the perfomranc of the funds including ETFs.

Ongoing, above-average growth in one sector, even tech, or a market cap segment (megacap), is as unsustainable as a Ponzi scheme. So while activity is sustaining movement into these stocks, performance is satisfying. But investor money is finite and investor behavior is fickle. So the above average performance must at some point should give way to these stocks being a drag on performance.

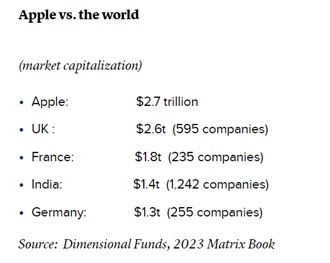
Apple’s market capitalization exceeds that of all the publicly traded companies on these stock markets; where would growth in share price come from?

Are We Seeing the End?

According to data from Morningstar Direct through June 20, actively managed stock mutual funds and exchange-traded funds beat their passive peers across categories, except in the large blend category, which is less heavily weighted to one sector. The report data shows that as we reach mid-year 2023, small- and large-cap stock pickers had a strong first half of 2023. As reported by Barron’s, “The next six months may prove favorable for active managers if dispersion—the spread of returns in an index—or market breadth—which reflects how many stocks participate in a rally—increase, allowing other sectors and stocks to catch up to the mega-caps.” Stockpickers are beginning to win, as a wider dispersion of selected investments, on average, beat the “just buy the index” investment style.

Active managers’ improving performance versus index funds is building on 2022, which was the best year for active U.S. equity fund managers since 2009. Anu Ganti, senior director of index investment strategy at S&P Dow Jones Indices, said while S&P doesn’t yet have midyear performance data, one potential tailwind for active managers this year was high dispersion. “If you’re a stockpicker, and if you have skill, and if you make the call right, there’s greater potential to add value from stock selection when dispersion is higher,” she said. “What we saw in May is that the S&P 500 stock level dispersion rose to its highest level since March 2020.” 

The Investment Advisors Association (IAA) Active Managers Council advocates for a more balanced narrative on passive versus active portfolio management among advisors. “Active and passive management are critical and play different roles in a broader portfolio,” said Apurva Schwartz, a member of the Active Managers Council’s research task force and a portfolio specialist at Harding Loevner. “Active management allows investors to navigate complexity, customize portfolios, manage risks, capitalize on specific skills, or try to profit from market inefficiencies. Passive management can help reduce costs and that’s important, especially in efficient market segments.” Over the years, there has been an overriding emphasis on passive funds among advisors, the Council seeks, through statistics and education, to provide a more balanced view.

Take Away

Over any period of time one sector or another may outperform. The one style of management that has provided solid performance is a diversified portfolio with an eye on risk-adjusted return. This style has faded as investors placed money in a large-cap indexed fund, believing the underlying assets were well diversified and had a positive risk/reward potential.

So far in 2023, large-cap indexed funds are underperforming managed funds. This outcome follows on top of late last year when managed money’s comparative performance improved. The underperformance is even highere when one nets out the higher fees associated with managed money.

Obviously there is no way to track non-professional, self-directed stock picker’s performance the way Morningstar ranks funds by category. But it is not a stretch to expect that a carefully selected portfolio with the help of  high-quality research and basic diversification across market-cap and industry characteristics, could do even better than just paying fees and parking assets in a fund.

Paul Hoffman

Managing Editor, Channelchek

Source

https://www.barrons.com/articles/active-managers-outperform-passive-index-funds-23723641?mod=hp_LEAD_1

https://www.cnbc.com/2023/05/10/apple-vs-the-world-apples-bigger-than-entire-overseas-stock-markets-.html

https://investmentadviser.org/active-managers-council/

Goldman’s Model Shows 14% Growth In Small-Caps Coming

On the One Hand, the Russell 2000 Should Outperform, on the Other Hand…

A Goldman Sachs report released Wednesday, June 28 projects that the Russell 2000 should gain 14% over the next 12 months and could outperform the S&P 500 in the coming year. The economic headwinds that companies represented in the index would have to overcome were discussed in the report. Each should come as no surprise. The forecast is based on Goldman’s research using expected economic growth and current valuations.

Based on US economic growth and a model built on initial valuations, the small-cap index should gain 14% over the next 12 months, according to Goldman. This looks even more favorable compared to the reports projection that  the S&P 500 is expected to climb 9% over the same period.

The research note said this would mark a position change as the S&P 500 has been outperforming the Russell 2000 Small Cap index.

Goldman outlined three near-term macro headwinds facing the Russell 2000 Index:

Rising Interest Rates

The index is more sensitive to monetary tightening because listed companies tend to have a higher debt burden than the S&P 500. As interest rates continue to rise, the cost of servicing debt could gradually put pressure on small caps, as about one-third of Russell 2000’s debt is floating rate.

This could become a complication through the remainder of the year, as the Federal Reserve has signaled the possibility of two more hikes. For its part, Goldman expects another hike in July, and predicts a cut for 2024.

Economic Development

Compared to the S&P 500, the Russell 2000 is more sensitive to US economic performance, wrote Goldman. Even if a recession has been avoided, small-cap stocks struggle to outperform in the later stages of the business cycle as investors turn to companies with larger balance sheets.

The note recognized another possible bump in the road suggesting it appears that the market has already priced in the GDP forecasts, and growth looks unlikely to pick up any further as long as the Fed continues to tighten to tame inflation.

Sector Composition

Goldman said the Russell 2000’s high exposure to cyclical stocks, regional banks, real estate and biotech makes it more vulnerable to slowing growth, rising rates and the re-emergence of financial stability fears.

This means there could be further cuts in earnings forecasts. The note recognized that while earnings revisions among S&P 500 companies have mostly been flat, Russell 2000 revisions are continuing.

Take Away

Goldman’s basic analysis shows the propensity for the small cap sector to begin to outperform in a big way. As is the case with market forecasters, the story starts out “on the one hand this could happen,” and then transitions with, “but on the other hand…”. It is standard to look out into the future and see where a sector could be headed, but also recognize where there may be trouble along the way.

The report did not lay out a scenario where the report may have underestimated where the Russell Small Cap index may be in 12 months, but with all the less-than-knowns surrounding this year, and an election year, it is safe to presume that the analyst could also have undershot where actual performance will be 12 months into the future.

Paul Hoffman

Managing Editor, Channelchek

Source

https://www.cnbc.com/2023/06/28/goldman-sees-small-cap-stocks-up-14percent-in-year-ahead-etfs-to-capture-that-return.html

Capitalizing on Less Certainty

The Market Averages Suggest this Move

Different investment timelines call for different investments.

Have you ever looked at a chart of a company you were interested in, let’s say year-to-date, and thought, wow, this company has just dipped to where it could be expected to start to bring in buyers and go up? Then you look at a five-year chart, and the same stock has been trending down for years, and is actually close to where, from a longer-term perspective, a technical analyst would view it as more likely to weaken. Based on time perspective, both expectations can coincide with each other. This is why it is important to understand your own investment time frame before pulling the trigger on a stock.

The big question that needs to be answered first is, are you expecting the trade to work out in minutes, weeks, or years? Often this is based on any future needs of your invested capital.

If a trader is trying to make incremental income, they may use a five-minute chart. An investor looking to gain by holding weeks or months may use a one or three-year chart. Longer-term investors, those that are looking to put to bed what they hope will be the next Apple or Tesla in terms of performance, may look at charts using 20 years, or the “Max” time period.

Those that are longer-term investors can be less cautious about the exact timing on most investments, or less concerned about deciding if this is the ideal timing. This is especially relevant today in light of recession talk, rate increases, global risk, and other possible disruptions.

In fact, last year’s downward market direction was a wake up call for a lot of less seasoned investors, coming off so many so many positive years before. And this years retracement back up, is a good reminder that over time, markets have always broken new highs.

As mentioned above, when times are less certain, the investor that is looking to hold for an extended period, is the investor less likely to question their decision; many actually average into a position based on calendar buys, not price targets.

Having the long view, or deciding uncertain markets has dictated a longer view, would likely steer the investor to include smaller companies. Smaller companies have had the best long-term performance. It’s a category that may be more volatile but over time, has served investors better.

Over the past few years, small cap stocks have participated far less in the upward trend. That is less than larger companies (on average) and far less than they have versus their own historical average relative to large caps.

Source: Koyfin

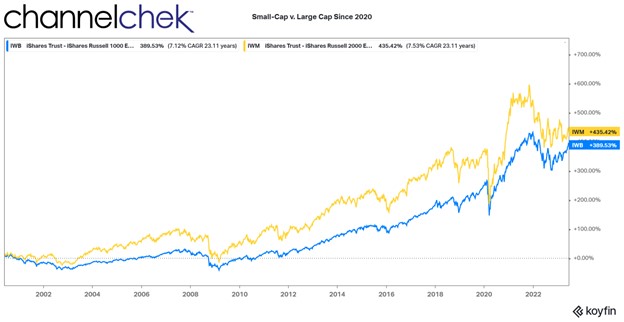
The chart above compares performance since the beginning of the decade of the Russell 2000 Large Cap performance (blue) to the Russell 2000 Small Cap index (gold). One thing that is evident immediately is the small cap stocks outperformed large caps long term by a large margin over time. The second is the trend is up. If you’d like, add a third which is there has been a significant dip in value (last year’s bear market).

“From our perspective, the uncertain present offers a highly opportune time to invest in small caps for the long run.” —Francis Gannon, Co-CIO Gannon Investment Partners (June 13. 2023)

Long term investors looking at this scenario could easily make a case for getting involved knowing that small caps historically overperform large caps. So if an investor is looking to maximize return, large caps may not have the highest probabilities. The above graph makes both points clear.

Source: Koyfin  

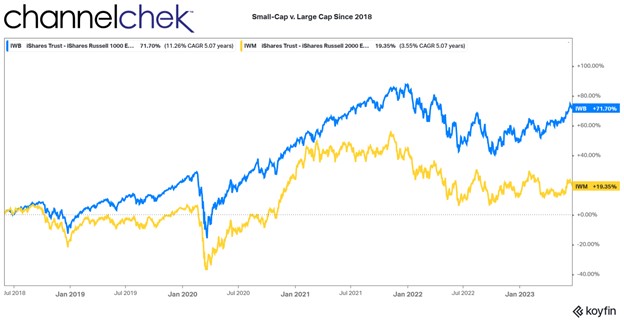
This second chart begins only five year ago. If one was to look at it by itself, the trendline over the years is upward, with gains in both large cap and small cap . But the large caps have a steeper upward pace. On the other hand, small caps are noticeably flat since the beginning of 2022.

Source: Koyfin  

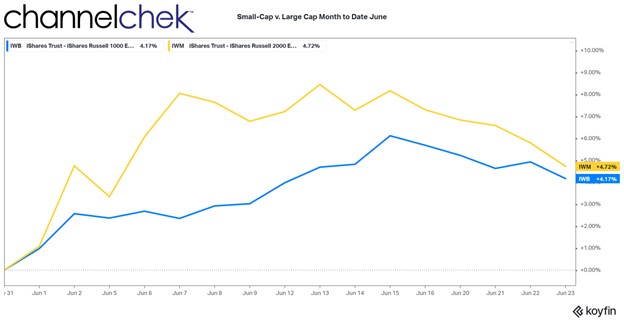
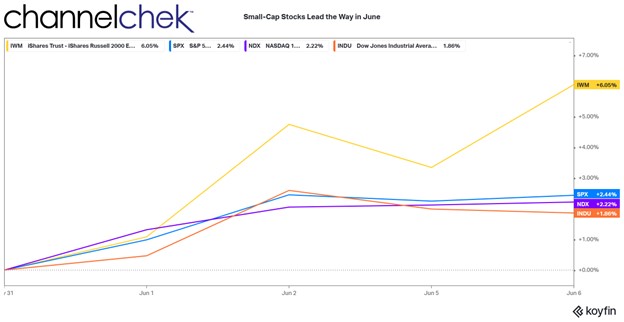
The last chart is just since the beginning of this month. Small cap stocks seem to finally have caught their tailwind, going up by more on most up days, and coming down by less on down days. Time will tell if this is a trend that will continue.

The small cap stock index won’t catch the large caps over night. If it happens, it will be months or years before investors that have been in small caps catch and pass those that have been in large cap stocks. Those investing now will outperform those that got in earlier. Of course, long-term investors are cautioned to also be diversified across many industries and of even market cap sectors.

Perhaps rebalancing the allocation after so many periods of small cap underperformance is a strategy that fits all the basic tenets that have been true of long-term investing.

They are:

Over time the stock market goes up and breaks new records.

Diversified portfolios spread risk and are less volatile.

Rebalance so allocations in sectors that have done well are not now undermining your asset mix.

Take Away

One can look at the same stock, over different time periods and see completely different trends. Those investing longer term, providing the company or industry isn’t in a decades long tailspin, reduce the risk of loss by letting time iron out the ups and downs.

Small cap stocks over time have outperformed larger companies. Assuming this hasn’t changed, when the volatility is “ironed out” small caps have a lot of catching up to do before they pass. This argues that they will return even greater comparative performance than if they were already ahead in recent years.

Paul Hoffman

Managing Editor, Channelchek

Sources

Why the Time Looks Right for Small Caps —Royce (royceinvest.com)

This Year’s Russell Rebalance May Accelerate Market-Cap Sector Rotation

Investors Already Wary of Big Tech’s Dizzying Heights May Deviate Away From Swelling Large Cap Weightings

What’s different about this year’s Russell Index Reconstitution?

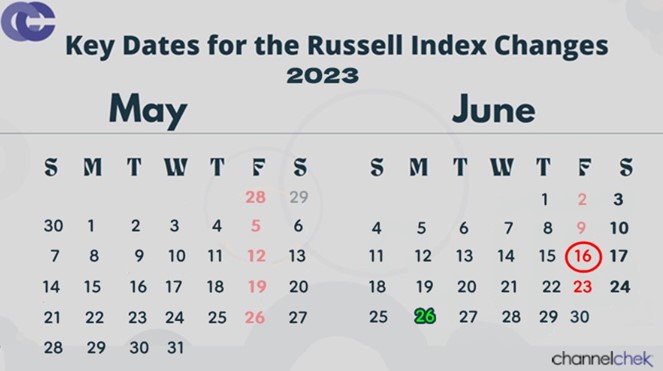
When the market closes on Friday, June 23rd , the overall FTSE Russell 3000 index and the other indexes that it impacts, including the Russell 1000 Large-cap and Russell 2000 Small-cap index, will be rebalanced to reflect current market-cap size. When the bell rings on Monday June 26th, the indexes will have different members and adjusted weighting of those constituents. Some market watchers and analysts expect this year to be a “headache” for active portfolio managers. Here’s why.

The new FTSE Russell makeup is already known. There is only a small chance a change in that might occur between now and Friday, it is largely assured that the reconstitution will increase the concentration of the top ten biggest companies in the large-cap Russell 1000 Index to a historical high of 29%. Active managers that are already underweighted mega-caps and big tech represented in the large-cap indexes will have to decide if they are going to increase holdings or be even more underweighted in comparison to an index that investors are likely to compare them to.

Additionally, while active fund managers are freer to weight their portfolios (within the boundaries of the fund’s prospectus), investors tend to compare the returns of index funds to the performance of managed funds when investing. This would increase the size of the bet in terms of fund percentage for managed funds, some already underweighted in tech. They’ll have a decision to make.

Further confusing things on the large-cap side is that the wisdom of diversification is being tested. If ten of the largest company’s make up 29% of an index, one that financial advisors and mom-and-pop investors are comparing them to, then roughly mimicking its concentrations would reduce diversification. Investing in a fund with a more even balance of stocks had once been the primary driver of mutual funds’ growth in popularity.

The rebalancing will heap a higher weighting to mega-cap names, including those referred to as FAANG stocks. This group of companies have already had tremendous gains this year, a pace that history would indicate is not sustainable.

Just look at the numbers, as we near the mid-year mark in 2023.

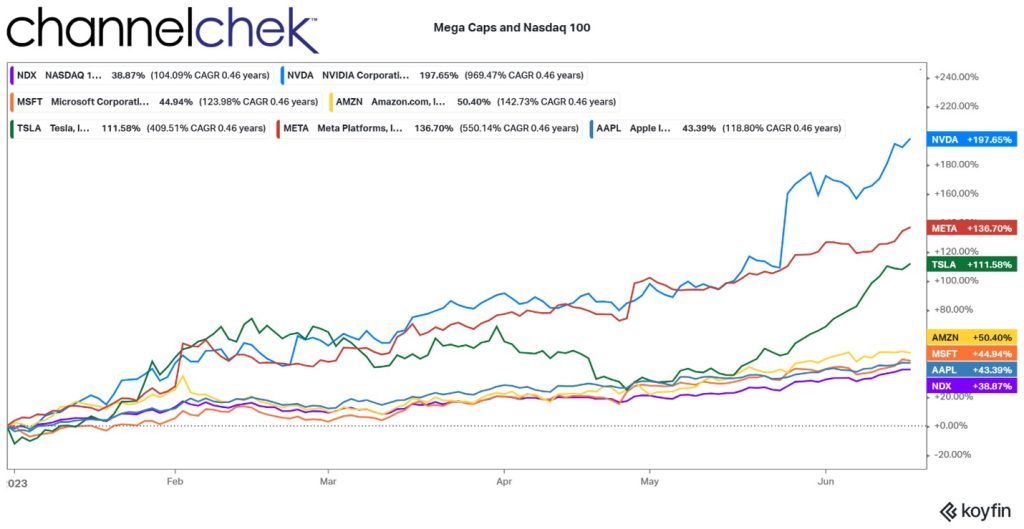
To date the top 100 stocks in the Nasdaq, heavily weighted with mega-caps and large-cap tech, has increased 38.87%. Using historical returns, most would forecast that these topstocks have much more downside for the next six months than upside. Yet, to stay on the same playing field with index funds, managed money would have to bet against stock market history.

The largest of stocks, as demonstrated below, are pulling a lot of weight. Nvidia (NVDA) is up nearly 200%, Meta (META) returned 137%, Tesla (TSLA) is also up over 100%. A fund manager with flexibility could be torn; on the one hand, afraid to bet against such momentum, on the other, historical probabilities suggest they should.

Source: Koyfin

There’s recent evidence that portfolio managers are looking for value away from the mega-cap stocks that have had the kind of run that in some cases made them twice as expensive. The Russell Small-cap Index, which is part of the June rebalancing is made up of the lowest 2,000 companies in terms of market cap of the broader Russell 3000. June has been a great month for the index so far. The index month-to-date is up 7.75% compared to the Nasdaq 100’s 6.56%. This beats June’s returns for Microsoft (MSFT), Apple (AAPL), and Amazon, among others. The performance, which includes an increase of 3.6% and a 2.8% jump on June 6th indicates investors are rotating away from large-cap stocks that have become historically expensive and into smaller companies that are cheap by historical standards.

The reconstitution also provides investors in the weeks and hours leading up to the rebalance to speculate on how the rebalance will impact individual stocks. Since the preliminary list of changes was announced last month, companies expected to be added to the Russell 1000 Index have gained 4.9%, while the those that moved to a smaller-cap index have grown 11.3%, according to data compiled by Wells Fargo (6/14/23).

Take Away

The Russell Reconstitution elevates the percentage weighting of mega-cap tech stocks that usually trade in rough tandem. Mutual fund managers, and other managed money will have to rethink their weighting of a sector that has already skyrocketed on speculation of future growth.

There has already been signs of a slowdown of interest in mega-tech, compared to a significant increase in attention to small-caps that are cheap by most measures. If the rotation continues, money managers that adhere to tried and true wisdom related to diversification, and metrics like P/E ratios, may wind up the year outperforming the indexed funds they tend to be compared to.

Paul Hoffman

Managing Editor, Channelchek

Sources

https://www.ft.com/content/01ad3636-f15c-42c2-ab2c-81418f8160be

https://www.forbes.com/sites/jjkinahan/2023/06/16/stocks-looking-to-keep-the-party-going/?sh=4e85e4c86067

Which Stocks are Most Impacted by Changing Interest Rates?

Why Interest Rates Impact Large and Small Company Profits Differently

Small-cap stocks are less sensitive to interest rate changes than large-cap stocks. Generally, when interest rates rise, it can create a bigger drag on larger companies for a number of reasons. Meanwhile, companies with small market caps are unaffected or less affected on average. While there are many factors that impact stock prices, interest rates are certainly on the list – depending on company size, rates will impact them differently.

Interest rates have moved quite a bit over the past 18 months, and they aren’t expected to stabilize now. Here are some of the stock market dynamics at play.

Revenues and Costs

Small-cap companies typically have less debt than large-cap companies. This means that they are less sensitive to changes in interest rates, as the cost of borrowing does not affect them as much as  big borrowers when rates rise.

The main reason for lower debt levels is they typically have less ability to borrow through the capital markets. Smaller or less established companies in general find the cost of issuing a public market note as being behigher than the benefits. And since rising interest rates, increase the cost of borrowing, small-cap companies are not rolling large amounts of debt at the new interest rate levels. Whereas debt is often a much larger part of big company’s overall strategy and cost of capital.

It also helps that small market-cap companies are often in industries that are less sensitive to the overall economy. If rates are rising, fears of a recession often creep into investor’s mindsets. For example, smaller technology and life sciences companies are, by comparison, less sensitive to economic cycles than cyclical industries such as large manufacturing and big oil. Put another way, many smaller companies are more focused on discovery, innovation and growth, these are not as dependent on economic conditions.

However, small-cap investors should be aware that small-caps are often more volatile than large-caps. So the investor can experience larger swings in price, both up and down. This can make this investment sector more attractive to investors who are looking for growth potential, but it can also make them more risky. If they have lower trade volume, there are fewer buyers and sellers, making it more likely for prices to move up or down.

Larger companies tend to be international in their business dealings, compared to domestic small-cap companies which more commonly transact within their home-base country. For the US, an increase in interest rates relative to other nations, is likely to lead to a stronger $US dollar. A stronger US dollar makes the cost of goods sold overseas more expensive to buyers. This could lower sales expectations as overseas buyers find other suppliers. Small companies operating domestically do not have to worry about foreign exchange rates and how they are impacted by interest rate movements.

It is important to note that interest rate changes can impact all stocks, regardless of their size. The impact of interest rate changes on a particular stock will depend on a number of factors, including the company’s debt load, its industry, and its overall financial health. Overall, small-cap stocks are less sensitive to interest rate changes than large-cap stocks, but investors can expect more volatility.

Market-cap Sector Rotation

Sector rotation is the process of money moving from one stock market sector to another, based on expectations of which sectors will perform better in the future. This could be industry, types of securities (ie: bonds, real estate), or market cap.

As it relates to market cap, an investor might sell large-cap stocks and buy small-cap stocks if they believe that small-cap stocks are undervalued and are poised to outperform large-cap stocks in the future.

It can help you to stay ahead of the market. By monitoring sector performance and making changes to your portfolio accordingly, you can stay ahead of the market and make sure that your money is invested in the sectors that are most likely to perform well.

Take Away

There are many different groupings of stocks (market-cap, industry, international, region, etc.) and factors that can impact the group. One factor that has historically played a part in price discovery of small versus large-cap stocks is interest rate movements. Interest rates impact the cost of doing business and also sales. Investors add this into the myriad of other factors they try to be aware of when selecting stocks.

Paul Hoffman

Managing Editor, Channelchek

Will 2023 Be the Summer of Small-Cap Stocks?

The Mid-Year Sector Rotation is Benefitting Small-Cap Investors

“This time is different” is a saying often used in investing, usually just before the investor does something that they will soon regret. I say “regret” because, although the timing of patterns that have repeated themselves time and time again may change, well-entrenched investment rules very rarely change.

Over the past year, what I have perceived as undervalued stocks – coincidentally, all companies with a small market cap – have been prominently placed on my stocks watchlist.   While last year was a bad year for most of the market, these underperformed during that down market. So, they became even cheaper. I fully expected the stocks to eventually get investor attention and begin to move upwaard – in fact, I have had reason to believe this for a while of the small-cap sector in general.

While these watchlist stocks, in my mind, became even better values, I never told myself the market may have fundamentally changed, which would mean small caps will no longer be the relied-upon outperformers over time, as they have been historically. I did not think that “this time it might be different.”

Based on the two major small-cap indexes stellar performance so far this June, and a couple of my watchlist stock’s movements, my long wait may have been worthwhile and may soon be replaced by action.

Source: Koyfin

S&P 600 & Russell 2000 Indexes

Small-cap stocks have certainly turned up the heat so far in June. What’s more, is the larger indexes would seem to be losing steam as they have run so far for so long that, unless this time is different, they may be due for a retrenchment.

The renewed enthusiasm for the smaller and perhaps riskier stocks, over large caps, with businesses that tend to be more diversified, have deeper pockets, and more overall resources, is likely based on a number of normal factors. Smaller companies tend to operate leaner, so a higher percentage of revenue can flow to the bottom line in a growing economy. The two-week-old rally comes as many cyclical stocks, and industries that do best in a growing economy are springing to life, especially since the debt ceiling negotiations have been resolved, the banking system is seen as out of trouble, and the Fed has broken records in its tightening pace yet still unemployment is low.

The reduced clouds on the horizon and higher multiples of large-cap stocks seem to have given investors motivation to move to small cap stocks with lower multiples, and with less fear of the economy falling apart any time soon.

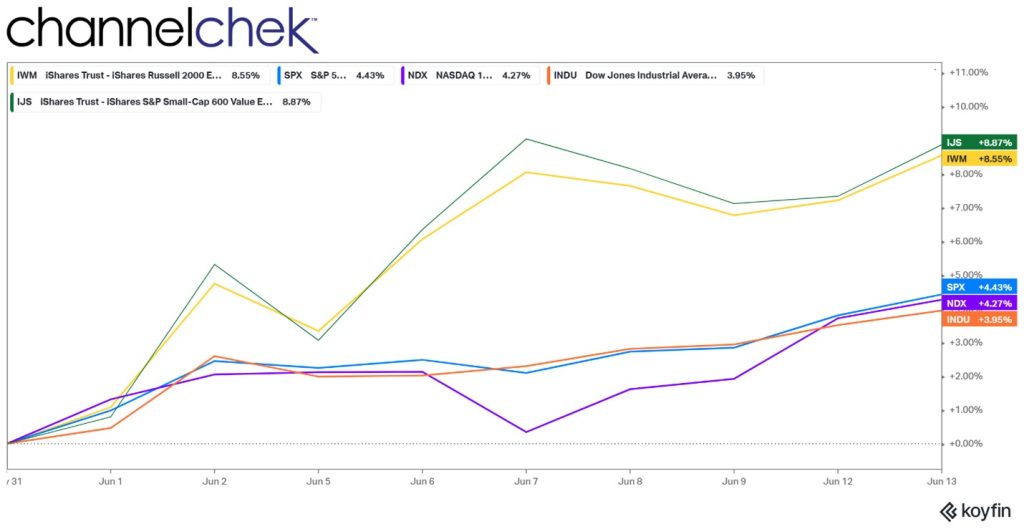
Investors are rotating into companies with lower market caps. Looking above at the two small-cap indexes, the S&P 600 (IJS as a proxy) is low in tech stocks that are heavily weighted in the worse-performing indexes. Financials and industrials make up 34% (tech is just 14%) of the S&P 600 Small-caps. The S&P 600 is up 8.87% so far in June compared to the large cap S&P 500 which only gained half as much. The Russell 2000 Small-cap Index is up 8.55% so far in June. This is also the month when investors watch the Russell Reconstitution, which is the rebalancing of the Russell 3000, Russell 1000, and Russell 2000 index based on remeasuring market-caps on the top 3000 stocks. There will be a great deal of attention to the reshuffling come the last Friday of the month.

Take Away

Is it different this time? Are small cap stocks going to play catch up as investors, hungry for value, and growing concerned that larger companies may be overvalued, and an overall increased comfort level that fewer dangers loom on the economic horizon, rotate some assets there? They have whetted their appetite, if the outperformance continues, I suspect they may go back for seconds, then others might join.

Paul Hoffman

Managing Editor, Channelchek

Sources

https://www.economist.com/media/pdf/this-time-is-different-reinhart-e.pdf

https://www.barrons.com/articles/small-cap-stocks-apple-big-tech-9d3b5669

Why Small Cap Stocks Started to Attract Mega Cap Investors

Small Cap Companies Making June 2023 a Whole New Race

June is shaping up to be the month when small-cap stocks are the stocks to watch. This investment news is based on the huge lead they have taken since the opening bell on Friday June 2nd. The Russell 2000 index tracks U.S. small-cap stocks. While the index is up less than 3% in 2023, and the S&P 500 is up nearly 12%, and Nasdaq is up almost 27%, historically, the average return over time is expected to be greater for small-caps. In order for the averages to come back in line with historical norms, the large-cap stocks either have to begin trending down, the small-caps upward, or maybe a little of both. There is new reason to believe that now is the time that small-caps are finally getting back into the race.

The Russell Small-Cap Index, which is made up of the lowest 2,000 companies in terms of market cap of the broader Russell 3000, was up 3.6% on Friday, June 2nd; it gave up 1.1% on the following Monday, then rallied on Tuesday, June 6th by 2.8%. Meanwhile, the other indexes stalled. Friday’s gains were its largest one-day increase in six months, and Tuesday represents its biggest gain since early March.

Both large-cap indexes attribute their gains to the high-flying mega-cap tech stocks. Much of the non-tech portions of these indexes are not contributing to the year’s great performance. Some analysts are beginning to express concern that Nasdaq valuations are stretched. In contrast, price/earnings ratios on many small-cap stocks are below historical norms.

What’s more, is the earnings per share (EPS) is beginning to be revised upward, “small caps are finally starting to participate in the EPS revisions recovery,” said Lori Calvasina, head of U.S. equity strategy at RBC Capital Markets, in a research note Monday. “The rate of upward EPS estimate revisions has moved up to 50% for the Russell 2000,” she said, adding that more than half the sectors in the index are “now in positive revisions territory for both EPS and revenues.”

Source: Koyfin


Calvarisa highlighted these sectors: utilities, consumer staples, healthcare, industrials, communications services, information technology, and TIMT (technology, internet, media and telecommunications), saying they have both positive EPS and revenue revisions among the small-caps.

Another interesting reason for the promise of small-caps stealing the show in June, according to the RBC research, small-cap stocks usually bottom three to six months before EPS forecasts start rising again.

The introduction of artificial intelligence (AI), from primarily small market cap companies and how the new technology can help with online research and creative inspiration, has placed investors in megacap stocks like Google and Microsoft on notice. They now know that a younger superior technology may disrupt a large part of these tech giants’ business. Not dissimilar to what they had done as small companies a few decades earlier.

Take Away

June is always an exciting month for companies with small market cap as the Russell 3000 index reconstitution also reshapes the small-cap Russell 2000 during June. Many self-directed investors try to front-run the institutions that are required to own or eliminate stocks from their portfolios. Price movements can be large.

The excitement is being compounded by the fear creeping in among large-cap investors, EPS revisions, and of course the reversion to mean average performance of large-cap stocks, to small-caps.  

Paul Hoffman

Managing Editor, Channelchek

Sources

https://www.morningstar.com/news/marketwatch/20230606265/small-cap-stocks-are-surging-tuesday-as-broader-us-market-sleeps-heres-why

https://www.morningstar.com/news/marketwatch/20230605260/small-cap-stocks-lag-in-2023-but-heres-where-theyre-finally-starting-to-see-positive-earnings-revisions

https://www.cnbc.com/video/2023/06/02/small-caps-are-benefitting-from-the-value-trade-catchup-says-rbcs-lori-calvasina.html?__source=iosappshare%7Ccom.apple.UIKit.activity.CopyToPasteboard

https://app.koyfin.com/share/09d4d3eaad

The Key Consideration to Any Investing Strategy

Image Credit: Jordan Benton (Pexels)

Short Changing Investment Returns By Ignoring Time Horizon

Time horizon is part of every investor’s buy decision, or at least it ought to be. For example, in 2022 the 60/40 investment portfolio had its worst performance since 2008. This is despite a 5.3% increase in value during the fourth quarter of that year. Many headlines had read that the classic 60% stocks and 40% bonds portfolio is “broken.” After it’s stellar performance during Q4 2022, the first quarter of 2023 brought even higher performance – again compounding by an additional 5.9%. This example can highlight that time horizon is dependent on the investment goals proving 60/40 probably is not dead after all. The 60/40 diversification is considered conservative, it’s often implemented for retirement portfolios, typically portfolios with a lot of lead time to achieve its goal of historical returns. Goals should dictate investment strategy and they should include a realistic time horizon.

To Be Patient or Not to Be Patient

Entering the second quarter of 2023, economic trends, including commodity prices, interest rates, political power, inflation, and even peace between nations, all seem to be sending off mixed signals on future trends. A clear market read is far more difficult today than most years. This leaves a lot of questions on what to do with one’s money. If you leave it in the bank, inflation is likely to erode your purchasing power. If you move it to the U.S. government-backed treasury market, a rise in rates (as promised by the Fed) can leave you hurting like a few banks that saw their assets value plummet. Should stocks take a leading role – even if holdings wind up moving sideways or even down for the rest of this year?

As mentioned, this depends on your goal. If you can be patient and have a time horizon to achieve performance of more than a year, the tendency for reversion to mean suggests the answer is probably yes. However, if during the next six to 12 months, this money may need to be deployed for a purchase, it may be best to continually roll treasuries maturing in under a year.

For investments expected to be held longer than a year, there is the lazy way and a more hands-on approach that takes a little more digging. The lazy way says you plop a large percentage of your portfolio in an index fund and earn market returns. A more involved management approach of one’s portfolio would suggest that you’d prefer to avoid stocks considered overvalued or in a weakening industry. If, instead, one can achieve adequate diversity by owning many companies in different industries, and do enough evaluation (i.e., exploring trusted research) to have a sense of whether holding them would suit your needed time horizon, then the stocks selected as your holdings may avoid expected dogs weighing it down. It would make sense that this argues for patience, with expectations that not only will stocks follow history and go up over time, but your holdings have a reasonable expectation to outperform the market.

Time Horizon

Time horizon is a critical factor in investing. It refers to the length of time an investor is willing to hold onto their investments. The time horizon can range from a few months to several decades, depending on an investor’s goals, risk tolerance, and investment strategy. Most benchmarks are viewed daily, quarterly, and monthly. If your time horizon is five years, the quarterly or even annual returns should be a low consideration. Cathie Wood, CEO and founder of Ark Invest, says she invests on a five-year time horizon, considering the speculative growth names her funds have invested in, such as Tesla (TSLA), Roku (ROKU), Zoom Video Communications (ZM), Exact Sciences (EXAS), etc. she could not manage her funds properly if she looked shorter in term.

At least each quarter Portfolio Manager Chuck Royce and Co-CIO Francis Gannon of Royce Funds publish text of a “conversation” between the two. The subject is usually past market performance, expectations of the future, and even stocks that they believe, with the appropriate time horizon, will pay off.  

In the discussion between the two, Francis Gannon covered the case for more extended time horizon investors to explore the small-cap sector. His expectation is that various sectors (viewed by market cap) will fall in line with historical performance averages. “The stocks that performed best under the previous decade’s regime of zero interest rates, low inflation, and low nominal growth—which were mega-caps and small-cap growth—are unlikely to lead going forward, regardless of what direction the U.S. economy ultimately takes. Conversely, those areas of the equity market that lagged during this long period are likely, in our view, to capture long-term leadership,” said Gannon. This is when Chuck Ross very clearly explained the importance of knowing one’s time horizon for maximum potential gain.

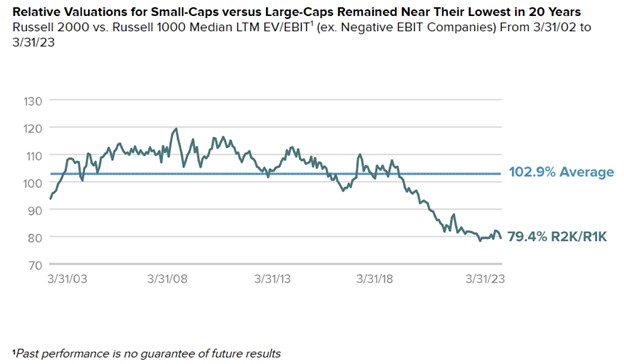
“We think small cap is ready to roll and expect the next three to five years to be strong on both an absolute and relative basis.” Said Mr. Royce. He explained that rising rates could help companies that can that don’t need to borrow from the outside.   “Equally important, the Russell 2000’s valuation remained near its lowest rate in 20 years compared to the Russell 1000’s, based on our preferred valuation metric of the median last 12 months’ enterprise value to earnings before taxes (LTM EV/EBIT).” Royce explained.

Source: Royce Invest

The chart above shows that the 20-year performance of small-cap stocks averages 102.9% above that of large-cap equities. The underperformance began five years ago, and the current 20-year low in relative performance in small-caps could play out to be a long lag. With a long enough time horizon, one might expect that small-cap investors get rewarded for the additional risk and reduced liquidity in the sector.

Investment Strategy

While not everyone has five years or more to wait for performance to improve, intentional stock selection among small-caps could help those who do. A recent Barron’s article argued that “Small-Cap Stocks Look Ready to Rally,” the investment publication also believed that stock selection within the sector could pay off. The author wrote that as of March 31, “the Russell 2000 was at 44% of the S&P 500’s level, a ratio the index touched in early 2020 when the advent of Covid-19 had left the economy in perilous waters.”  The publication then reported that the level is a technical low point, a support that wasn’t even breached with pandemic concerns and skyrocketing large-cap tech stocks. Expressed in the within the April 3 article was to a methodology of filtering stocks by reviewing companies with market caps of at least $200 million and free cash flow minimum of 4.5% of the share price. This would put them in line with the overall Russell 2000.

Then look at the consensus earnings forecasts among analyst, have they risen? A high short interest in the stock could also be part of the screening process for possible buys.

Take Away

The importance of time horizon in investing lies in the fact that different investment opportunities have different risk and return profiles over different time periods. Short-term investments tend to have lower risk but lower returns, while long-term investments tend to have higher risk but potentially higher returns. By understanding your time horizon, you can choose investments that align with your investment goals and risk tolerance.

For investors that can span many years holding and waiting for scenarios to play out, but don’t, perhaps are leaving long-term return on the table by investing as though their time horizon is short. Investible cash sitting in a bank will be eroded by inflation, the Fed with its deep pockets has said it is resolved to instigate a further bear market in bonds.  Longer term, stocks outperform, what’s more, well-selected companies can outperform stock indixes that only promise to match the average of good and bad companies.

If you aren’t receiving equity research in your daily email, sign up here now.

Paul Hoffman

Managing Editor, Channelchek

Sources

https://www.barrons.com/articles/small-cap-stocks-rally-cheap-russell-2000-5b35f854

https://www.royceinvest.com/insights/small-cap-interview?utm_source=royce-mktg&utm_medium=email&utm_campaign=insights-interview&utm_content=button-1

https://www.wsj.com/articles/the-60-40-investment-strategy-is-back-after-tanking-last-year-b4892aac?mod=hp_lead_pos5

A 100% of the Time Probability is Rare, We’ll See if Markets in 2023 Retain the Streak

Image Credit: Burak the Weekender (Pexels)

The Data Supporting Small-Caps Should Attract Money from Former Mega-Cap-Only Investors

When I see an investment statistic that reads, “in the past, this has happened 100% of the time,” I not only take note for my own portfolio consideration, I share it with my more risk-averse investment friends. It’s now mid-January, and like many investors, I have read dozens of 2023 forecasts and projections. I value the ones where the forecaster likely has skin in the game (i.e.: not many economists), and I am more highly interested in those that support forecasts with stats (ie: most economists). I came across a stat of ‘100% of the time’ from a trusted source that has skin in the game – this is certainly share-worthy.  

Source

Each month Royce Investment Partners publishes an interview-style update between founder Chuck Royce and Co-CIO Frank Gannon. It’s always full of statistics and probability analysis. It never fails to be interesting and very often worthwhile. Investment decisions based on hard data from the past are less speculative, this doesn’t always make the investment a win, but it lowers the need for guessing. And if the stats are based on a large enough sample period, confidence to act overrides underlying opinion or emotions. The most recent publication from Royce Associates, LLC offers very compelling data.  

The update includes a look at the stock market trends of late last year and why they’re confident small-cap stocks can achieve a positive return that could outpace larger-cap sectors. Especially for those companies whose underlying data meet criteria that they also explain.

Rear Looking View

The two were able to put the challenges for many investors last year in context by first talking about how infrequently bonds and stocks have gone down in the same year. This left 60/40 investors without anything to be happy about. Then they switched to small cap versus large cap, which they say was the third worst year for both the small-cap Russell 2000 Index, which fell 20.4%, and the Russell 1000 Index, which declined 19.1%. The third worst since each index’s inception at the end of 1978. According to the Royce update, “only two years had lower returns—and it was the same two years for both indexes—2008 during the Financial Crisis and 2002 through the worst year of the Internet Bubble.”

Forward-Looking View

As indicated above, Royce Associates believes small-cap is well positioned for positive returns and long-term comparative performance. The argument is hinged mainly on valuation but also on past behavior.

Valuation, they explain, even after last year’s sell-off, “remained near its lowest rate in 20 years compared to large-cap’s, based on our preferred valuation metric of the median last 12 months’ enterprise value to earnings before taxes (LTM EV/EBIT).” Royce recognized that accompanying the worldwide equity sell-off, many small-cap stocks were taken lower unrelated to financial fundamentals and/or operational expertise. “We have often been struck by the contrast between the more confident—albeit cautious—outlooks from the many management teams we’ve met with and the fatalistic headlines we see almost every day,” they explain.

A High Probability of Positive Small-Cap Performance Ahead?
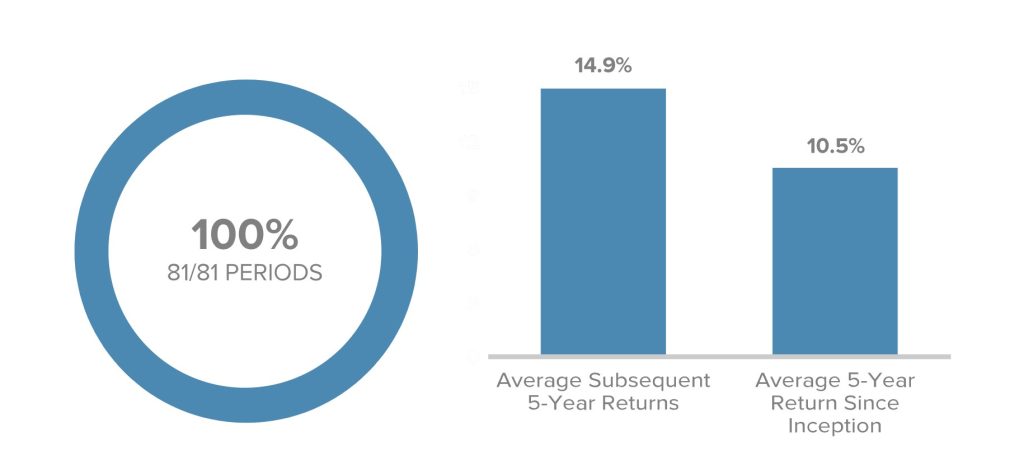
Average Subsequent Five-Year Annualized Performance for the Russell 2000 in Trailing Five-Year Return Ranges of less than 5% from 12/31/83 through 12/31/22:

Source: Royce Investment Partners (Past performance is no guarantee of future results).

Frank Gannon says, “small-cap’s historical performance patterns show that below-average longer-term return periods have been followed by those with above-average longer-term returns—and the subsequent periods have enjoyed positive returns most of the time.” Drilling down to the numbers of the market’s current state, he says, “Subsequent annualized three-year returns from three-year entry points of less than 5% have been positive 99% of the time—that is, in 75 out of 76 three-year annualized periods—averaging 16.1% since the Russell 2000s 12/31/78 inception.”

Stretching the investment period out to five years had even higher probabilities and positive outcomes. “The Russell 2000 also had positive annualized five-year returns 100% of the time—that is, in all 81 five-year periods—and averaged an impressive 14.9% following five-year periods with annualized returns of 5% or less. We think this is especially relevant now because the respective three- and five-year annualized returns for the Russell 2000 as of 12/31/22 were 3.1% and 4.1%.”

On the subject of inflation, the Royce review was also positive. “Small-cap has beaten inflation in every decade going back to the 1930s—and is the only equity class to have done so.” Details of how this and other numbers are derived can be found in the article  (available here).

Take-Away

While Royce Investment Partners, a fund company that holds small-cap stocks as its specialty, is not affiliated with Channelchek, or Noble Capital Markets, the monthly and quarterly newsletter/blog is always looked forward to. New readers should be ready for numbers and details backing up their stated positions. This is something not always found in public forecasts by other investment officers or portfolio managers. It’s more longwinded than some, but this is good because sound bites are not very helpful when one investor is trying to understand the thoughts of another.  

To find data on ‘less-followed’ stocks, sign- up here for Channelchek and get immediate, no-cost access to information on over 6,000 small and microcap companies.

Paul Hoffman

Managing Editor, Channelchek

Sources

https://www.royceinvest.com/insights/small-cap-interview

One Way to Play Small Cap Stocks

Image Credit: Eleanor (Flickr)

The Small Cap Effect Suggests Oversized Gains if You Weed Out Certain Stocks

According to a June 5th article in the Wall Street Journal, “small-cap stocks are priced for jumbo gains.” The Journal explains that small-caps have experienced lower average volatility than large-caps during periods of market stress. Examples are the 2013 “taper tantrum,” when investors turned bearish after the Federal Reserve said that it would reduce bond purchases; also the United Kingdom’s Brexit referendum in 2016; and the Covid-19 pandemic. This fact is counter-intuitive to what investors expect from what are considered the riskier securities.

The Journal reports that one prominent money manager predicts that the smaller companies will outshine large-caps by close to four percentage points a year over the next five years. They also report a large investment bank is even more bullish on small-caps for the coming decade.

What are Small-Caps?

Small-caps are most commonly defined as companies with lower-than-average market capitalizations. This is most often defined as between $300 million and $2 billion. However, the index that is often quoted to reflect small-cap stocks overall performance is the Russell 2000 Small-cap Index (RUT). The stocks represented in the RUT have a median market cap of $1 billion and the largest stands near $13 billion. Well outside of the range of the more common definition.

Small-Cap Effect

The small-cap effect was documented decades ago and demonstrates the propensity of small companies to produce higher average returns than companies over extended holding periods. The thought process includes the idea that small companies are riskier, so additional expected return is necessary to compensates investors for taking extra risk.

But the past decade has left the small caps with a lot of catching up to do. The large-company Russell 1000 (RUI) has beaten the small-company Russell 2000 by three points a year over the past decade, returning an average of 13.1%.

The lack of comparative performance is not because small-caps have been bad performers. Larger companies, particularly those at the very top, had a fantastic run during that decade. Now, there’s an ongoing debate over whether the small-cap effect is still valid, if it is, there is much catching up to do in terms of performance. Time will tell what direction and pace prices change moving forward. It is unknowable right now. What is knowable is that many small-caps are currently cheap.

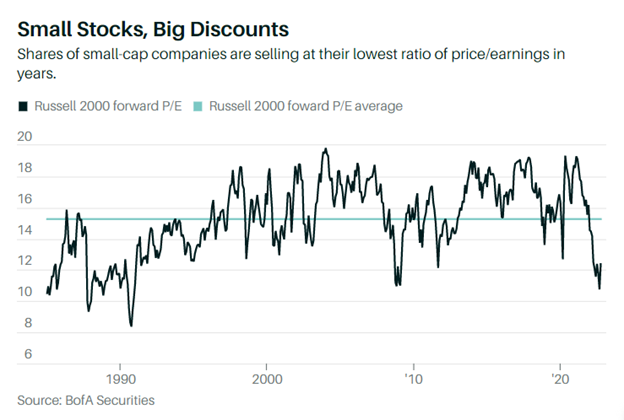
According to the Wall Street Journal, The Russell 2000 is flirting with 20 times earnings, a hair above its long-term average and certainly not deep value territory. But weed out the index’s unprofitable companies and statistical outliers, and the price/earnings ratio drops to about 12, versus a long-term average of 15.

This adjustment to the index make-up makes sense for two reasons. One is that 33% of Russell 2000 members today have negative earnings, up from 20% a decade ago, and at a record high.  But there’s a bigger reason to exclude unprofitable companies when sizing up the Russell 2000: The adjusted P/E has been a better predictor of future returns than the unadjusted one, (based on a B of A analysis of data going back to 1985. Right now, the adjusted P/E has B of A to predicting 12% annual returns for small-caps over the coming decade. That’s five points more than it sees for large-caps. The analysts calculate that small-caps are 30% cheaper than large-caps now. This would be the biggest discount since the dot-com stock bubble more than two decades ago.

What do Equity Analysts Think?

On December 15th, 2022 – 9:00am EST there will be a rare opportunity to hear from analysts covering different sectors of the small-cap space. 

At no cost for investors, the well-recognized veteran analysts will highlight how they set their price targets and market ratings. And the underlying fundamental reasons to consider an investment. As an attendee, you can get further involved by submitting your own questions. And learn which stocks the research analysts may favor.

This is the season to set your sites on maximizing returns in the coming year and the years that follow. This event is online and free, courtesy of Noble Capital Markets and Channelchek.

Get ahead of your investments in the coming year by attending this special event, learn how by going here now.

Paul Hoffman

Managing Editor, Channelchek

Sources

https://www.forbes.com/advisor/investing/small-cap-stocks/#:~:text=Small%2Dcap%20stocks%20are%20shares,pose%20higher%20risks%20to%20investors.

https://www.barrons.com/articles/small-cap-stocks-funds-51670023712?mod=hp_LEAD_1

https://www.channelchek.com/news-channel/wall-street-wish-list-an-investment-shopping-list-from-seasoned-analysts

Halloween Investment Strategy Recent Results

Image Credit: Pixabay (Pexels)

Is the Halloween Investment Strategy a Trick or a Treat?

What Is the Halloween Strategy? Is it statistically reliable? What have the results been?

The directive, “Always remember to buy in November,” has a few different names; the Halloween effect, the Halloween indicator, are among the more common. It answers the question, If I sell in May and walk away, when do I come back? This is because the “Halloween Strategy” and the “Sell in May” strategies are related — they are different ways of suggesting the same action. The results should be identical.

What Is It?

The Halloween strategy is over a century old. Buying when October ends is essentially a market-timing strategy based on the thought that the overall stock market performs better between Oct. 31st (Halloween) and May 1st than it performs from May through the end of October. The directive suggests first that market timing yields better results than buy and hold. Secondly, it says the probability of better results compared to buying and holding is increased, over this period. Those who subscribe to this approach recommend not investing at all during the summer months.

Evidence suggests this strategy does perform well over time, but despite many theories, there is no clear or agreed-upon reason. A famous study was done by Sven Bouman (AEGON Asset Mgmt.) and Ben Jacobsen (Erasmus University Rotterdam) and published in the American Economic Review December 2002. The study documents the existence of a strong seasonal effect in stock returns based on the Halloween indicator. They found the “inherited wisdom” to be true globally and useful in 36 of the 37 developed and emerging markets they studied. They reported the Sell in May effect tends to be particularly strong in European countries and is robust over time. Their sample evidence shows that in the UK the effect has been noticeable since 1694. They also reported, “While we have examined a number of possible explanations, none of these appears to explain the puzzle convincingly.”

Is it Reliable?

I didn’t go back as far as 1694 the way Sven and Ben did. And I didn’t collect data from emerging and developed markets around the globe. More pertinent to Channelchek readers is whether this strategy used on the U.S. markets has been worthwhile.

Data Source: Koyfin

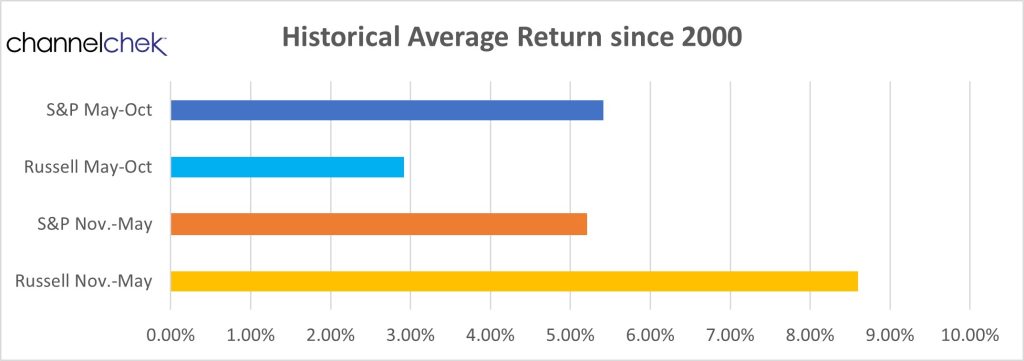
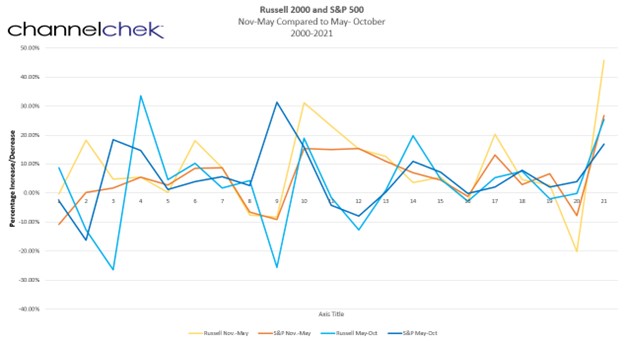
The above chart is a compilation of average results for two six-month periods, May through October and November through April. It also looks at two different indexes, the largest stocks in the S&P 500 (blue shades) index and small-cap stocks of the Russell 2000 (orange shades).

What was discovered is that during the period, investors in either of these indexes would have had positive earnings during either “season.” So it supports “buy and hold” wisdom or, at least, staying invested. During the Halloween through May period, the smallcap Russell returned 8.60%, while during the other six months, performance was a weaker 2.92%. The S&P 500 maintained consistent averages in the low 5% area for either period.

What Have the Results Been?

Since the turn of the century, investors would have fared better if they bought stocks represented in the small-cap average after Halloween, then moved to S&P 500 stocks in May. Below are the results of the 21 periods. The highest returns of either index occurred during the latest Halloween to May cycle. It was the small-cap index that measured a 45.76% gain. The index also measured the second-highest gain during the Sell in May 2004 measurement period. The Sell in May small-cap index also can claim the two lowest performance numbers.

Data Source: Koyfin

Take-Away

The Halloween strategy says that investors should be fully invested in stocks from November through April, and out of stocks from May through October. Variations of this strategy and its accompanying axioms have been around for over a century. Looking at the last 21 years, a deviation that would have paid off would have been moving to small-caps after Halloween.

Both “seasons,” for both measured indexes had positive average earnings. So the notion of staying fully invested is supported using recent data.

Paul Hoffman

Managing Editor, Channelchek