Patrick McCann, CFA, Research Analyst, Noble Capital Markets, Inc.
Michael Kupinski, Director of Research, Equity Research Analyst, Digital, Media & Technology , Noble Capital Markets, Inc.
Refer to the full report for the price target, fundamental analysis, and rating.
Milestone in Findhelp partnership. SelectQuote announced that it has referred more than 200,000 low-income seniors to Findhelp, with nearly 50,000 of those individuals accessing free or reduced-cost services. The milestone demonstrates SelectQuote’s role in addressing the needs of Medicare-eligible consumers.
Partnership connects consumers to critical support. Findhelp is a closed-loop referral management software platform that connects individuals with community resources such as food, housing, transportation, and financial aid. SelectQuote has partnered with Findhelp for several years, directing seniors to assistance programs. The initiative does not generate revenue, but it extends SelectQuote’s Medicare distribution model by providing tangible value to consumers.
Equity Research is available at no cost to Registered users of Channelchek. Not a Member? Click ‘Join’ to join the Channelchek Community. There is no cost to register, and we never collect credit card information.
This Company Sponsored Research is provided by Noble Capital Markets, Inc., a FINRA and S.E.C. registered broker-dealer (B/D).
*Analyst certification and important disclosures included in the full report. NOTE: investment decisions should not be based upon the content of this research summary. Proper due diligence is required before making any investment decision.
Patrick McCann, CFA, Research Analyst, Noble Capital Markets, Inc.
Michael Kupinski, Director of Research, Equity Research Analyst, Digital, Media & Technology , Noble Capital Markets, Inc.
Refer to the full report for the price target, fundamental analysis, and rating.
Fiscal Q4 beat. SelectQuote posted Q4 revenue of $345.1 million and adj. EBITDA of $2.7 million, beating expectations. Agent productivity improved with AI integration and workflow streamlining. The company navigated Medicare enrollment headwinds by reallocating resources efficiently, demonstrating continued operating discipline across its core platform.
SelectRx paying off. Healthcare Services revenue rose 49% year-over-year to $210.6 million with membership hitting 108,000, up from 82,000 the year prior. Notably segment adj. EBITDA margins of 5.5% are expected to improve throughout fiscal 2026 based on efficiency gains from the Kansas facility and customer maturity.
Equity Research is available at no cost to Registered users of Channelchek. Not a Member? Click ‘Join’ to join the Channelchek Community. There is no cost to register, and we never collect credit card information.
This Company Sponsored Research is provided by Noble Capital Markets, Inc., a FINRA and S.E.C. registered broker-dealer (B/D).
*Analyst certification and important disclosures included in the full report. NOTE: investment decisions should not be based upon the content of this research summary. Proper due diligence is required before making any investment decision.
Fourth Quarter of Fiscal Year 2025 – Consolidated Earnings Highlights
Revenue of $345.1 million
Net income of $12.9 million
Adjusted EBITDA* of $2.7 million
Fiscal Year 2026 Guidance Ranges:
Revenue expected in a range of $1.650 billion to $1.750 billion
Adjusted EBITDA* expected in a range of $120 million to $150 million
Fourth Quarter Fiscal Year 2025 – Segment Highlights
Senior
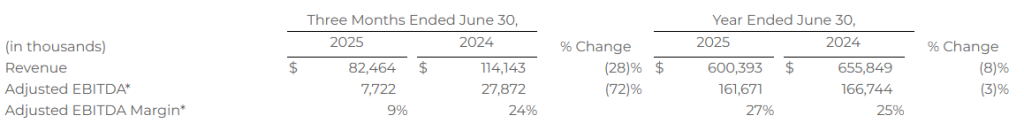
Revenue of $82.5 million
Adjusted EBITDA* of $7.7 million
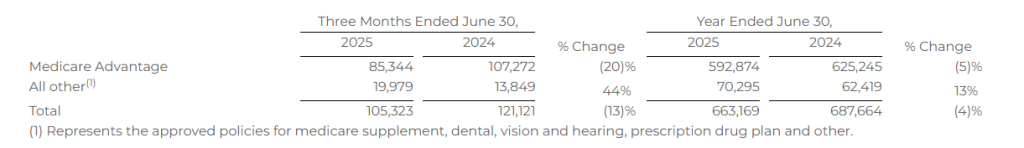
Approved Medicare Advantage policies of 85,344
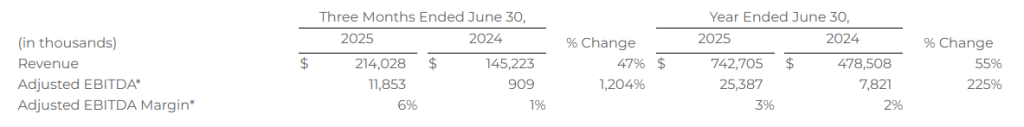
Healthcare Services
Revenue of $214.0 million
Adjusted EBITDA* of $11.9 million
108,018 SelectRx members
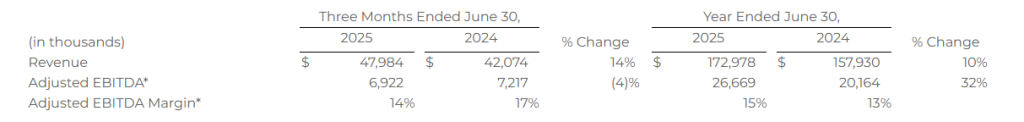
Life
Revenue of $48.0 million
Adjusted EBITDA* of $6.9 million
OVERLAND PARK, Kan.–(BUSINESS WIRE)– This press release is to correct and replace the previously issued press release to reflect the following:
On the Consolidated Statements of Comprehensive Income (Loss) for the three-month period ending June 30, 2025, the amount reported for the Selling, general and administrative line item is $41,591,000 and for the Technical development line item it is $9,594,000. In the prior version of the press release, these amounts were inadvertently transposed on the Consolidated Statements of Comprehensive Income (Loss). The correction has no impact on the reported Net Income or Adjusted EBITDA for the period presented.
The updated release reads:
SELECTQUOTE, INC. REPORTS FOURTH QUARTER OF FISCAL YEAR 2025 RESULTS
Fourth Quarter of Fiscal Year 2025 – Consolidated Earnings Highlights
Revenue of $345.1 million
Net income of $12.9 million
Adjusted EBITDA* of $2.7 million
Fiscal Year 2026 Guidance Ranges:
Revenue expected in a range of $1.650 billion to $1.750 billion
Adjusted EBITDA* expected in a range of $120 million to $150 million
Fourth Quarter Fiscal Year 2025 – Segment Highlights
Senior
Revenue of $82.5 million
Adjusted EBITDA* of $7.7 million
Approved Medicare Advantage policies of 85,344
Healthcare Services
Revenue of $214.0 million
Adjusted EBITDA* of $11.9 million
108,018 SelectRx members
Life
Revenue of $48.0 million
Adjusted EBITDA* of $6.9 million
SelectQuote, Inc. (NYSE: SLQT) reported consolidated revenue for the fourth quarter of fiscal year 2025 of $345.1 million compared to consolidated revenue for the fourth quarter of fiscal year 2024 of $307.2 million. Consolidated net income for the fourth quarter of fiscal year 2025 was $12.9 million compared to consolidated net loss for the fourth quarter of fiscal year 2024 of $31.0 million. Finally, consolidated Adjusted EBITDA* for the fourth quarter of fiscal year 2025 was $2.7 million compared to consolidated Adjusted EBITDA* for the fourth quarter of fiscal year 2024 of $14.4 million.
Tim Danker, SelectQuote Chief Executive Officer, commented “The strength of our holistic healthcare services model was broadly exhibited in fiscal 2025, and we firmly believe the years ahead will increasingly drive substantial value for each of our stakeholders. Policyholders and patients will continue to benefit from our information advantage through tailored advice and healthcare solutions, which ultimately result in better health outcomes. Our insurance and healthcare service partners benefit from better treatment fit and adherence, which eliminates waste and serves to ease the historical trend of rising healthcare costs for Americans. Additionally, we believe our shareholders will benefit as SelectQuote’s diverse breadth of revenues drive increasing cash flow, which will accelerate and compound with new growth initiatives in the future.”
Mr. Danker continued, “We are proud to have delivered financial results well in excess of our initial expectations for the 3rd consecutive year. Over that period, our Adjusted EBITDA results have outperformed our forecasts by more than 20% each year. Our leadership and workforce have accomplished these results through significant change in Medicare Advantage in each year. We credit the talent and hard work of our people and are exceedingly proud of the track record SelectQuote has built as an agile, innovative and reliable source of value for Americans seeking healthcare that best fits their needs.”
* See “Non-GAAP Financial Measures” below.
Segment Results
We currently have three reportable segments: 1) Senior, 2) Healthcare Services and 3) Life. The performance measures of the segments include total revenue and Adjusted EBITDA.* Costs of commissions and other services revenue, cost of goods sold-pharmacy revenue, marketing and advertising, selling, general, and administrative, and technical development operating expenses that are directly attributable to a segment are reported within the applicable segment. Indirect costs of revenue, marketing and advertising, selling, general, and administrative, and technical development operating expenses are allocated to each segment based on varying metrics such as headcount. Adjusted EBITDA is our segment profit measure to evaluate the operating performance of our business. We define Adjusted EBITDA as income (loss) before income tax expense (benefit) plus: (i) interest expense, net; (ii) depreciation and amortization; (iii) share-based compensation; (iv) goodwill, long-lived asset, and intangible assets impairments; (v) transaction costs; (vi) loss on disposal of property, equipment and software, net; (vii) other non-recurring expenses and income; (viii) changes in fair value of warrant liabilities. Adjusted EBITDA margin is calculated as Adjusted EBITDA divided by revenue.
Senior
Financial Results
The following table provides the financial results for the Senior segment for the periods presented:
Operating Metrics
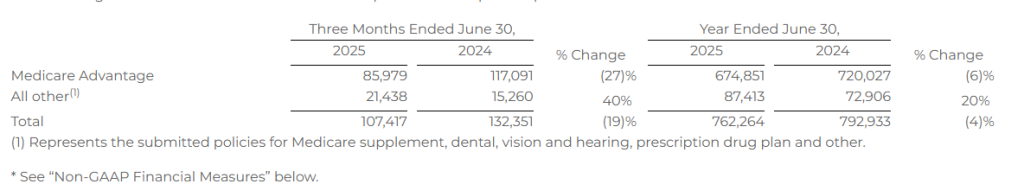
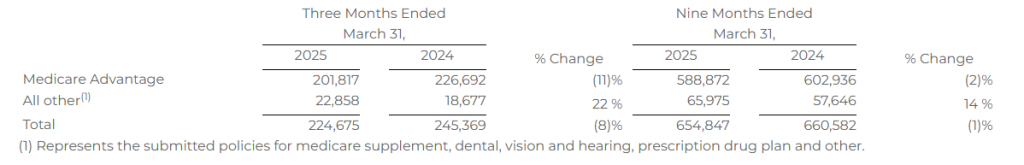
Submitted Policies
Submitted policies are counted when an individual completes an application with our licensed agent and provides authorization to the agent to submit the application to the insurance carrier partner. The applicant may have additional actions to take before the application will be reviewed by the insurance carrier.
The following table shows the number of submitted policies for the periods presented:
Approved Policies
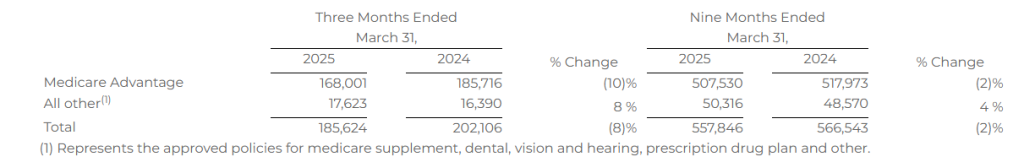
Approved policies represents the number of submitted policies that were approved by our insurance carrier partners for the identified product during the indicated period. Not all approved policies will go in force.
The following table shows the number of approved policies for the periods presented:
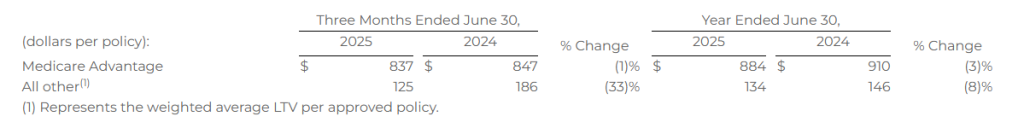
Lifetime Value of Commissions per Approved Policy
Lifetime value of commissions per approved policy represents commissions estimated to be collected over the estimated life of an approved policy based on multiple factors, including but not limited to, contracted commission rates, carrier mix and expected policy persistency with applied constraints. The lifetime value of commissions per approved policy is equal to the sum of the commission revenue due upon the initial sale of a policy, and when applicable, an estimate of future renewal commissions.
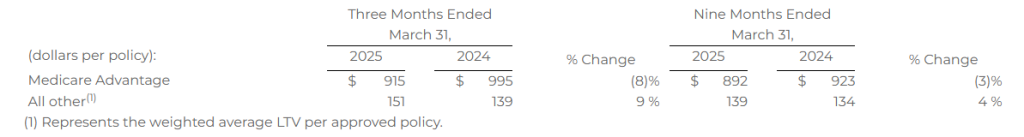
The following table shows the lifetime value of commissions per approved policy for the periods presented:
Healthcare Services
Financial Results
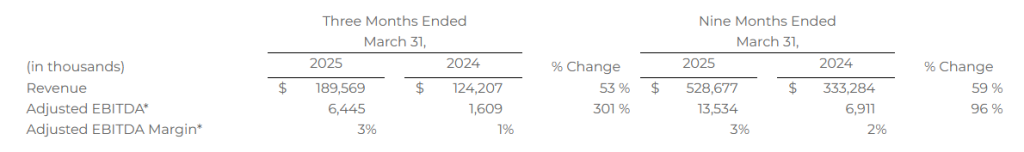
The following table provides the financial results for the Healthcare Services segment for the periods presented:
Operating Metrics
Members
The total number of SelectRx members represents the amount of active customers to which an order has been shipped and the prescriptions per day represents the total average prescriptions shipped per business day. These two metrics are the primary drivers of revenue for Healthcare Services.
* See “Non-GAAP Financial Measures” below.
The following table shows the total number of SelectRx members as of the periods presented:
The total number of SelectRx members increased by 31% as of June 30, 2025, compared to June 30, 2024, due to our strategy to grow SelectRx membership.
The following table shows the average prescriptions shipped per day for the periods presented:
Combined Senior and Healthcare Services – Consumer Per Unit Economics
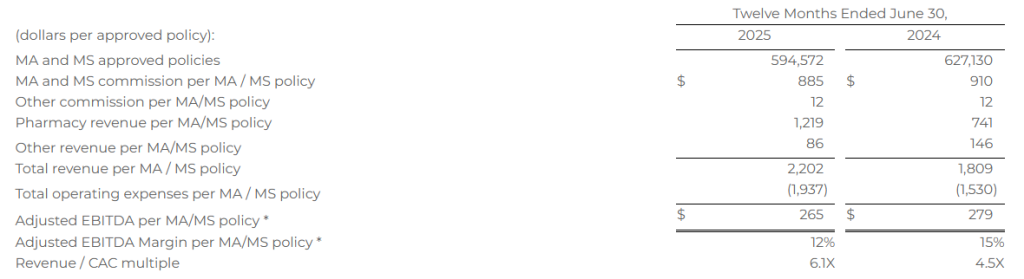
Combined Senior and Healthcare Services consumer per unit economics represents total MA and MS commissions; other product commissions; other revenues, including revenues from Healthcare Services; and operating expenses associated with Senior and Healthcare Services, each shown per number of approved MA and MS policies over a given time period. Management assesses the business on a per-unit basis to help ensure that the revenue opportunity associated with a successful policy sale is attractive relative to the marketing acquisition cost. Because not all acquired leads result in a successful policy sale, all per-policy metrics are based on approved policies, which is the measure that triggers revenue recognition.
The MA and MS commission per MA/MS policy represents the LTV for policies sold in the period. Other commission per MA/MS policy represents the LTV for other products sold in the period, including DVH prescription drug plan, and other products, which management views as additional commission revenue on our agents’ core function of MA/MS policy sales. Pharmacy revenue per MA/MS policy represents revenue from SelectRx, and other revenue per MA/MS policy represents revenue from Population Health, production bonuses, marketing development funds, lead generation revenue, and adjustments from the Company’s reassessment of its cohorts’ transaction prices. Total operating expenses per MA/MS policy represents all of the operating expenses within Senior and Healthcare Services. The revenue to customer acquisition cost (“CAC”) multiple represents total revenue as a multiple of total marketing acquisition cost, which represents the direct costs of acquiring leads. These costs are included in marketing and advertising expense within the total operating expenses per MA/MS policy.
The following table shows combined Senior and Healthcare Services consumer per unit economics for the periods presented. Based on the seasonality of Senior and the fluctuations between quarters, we believe that the most relevant view of per unit economics is on a rolling 12-month basis. All per MA/MS policy metrics below are based on the sum of approved MA/MS policies, as both products have similar commission profiles.
Total revenue per MA/MS policy increased 22% for the twelve months ended June 30, 2025, compared to the twelve months ended June 30, 2024, primarily due to the increase in pharmacy revenue. Total operating expenses per MA/MS policy increased 27% for the twelve months ended June 30, 2025, compared to the twelve months ended June 30, 2024, driven by an increase in cost of goods sold-pharmacy revenue for Healthcare Services due to the growth of the business.
Life
Financial Results
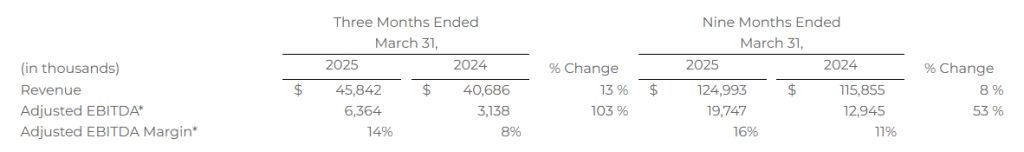
The following table provides the financial results for the Life segment for the periods presented:
Operating Metrics
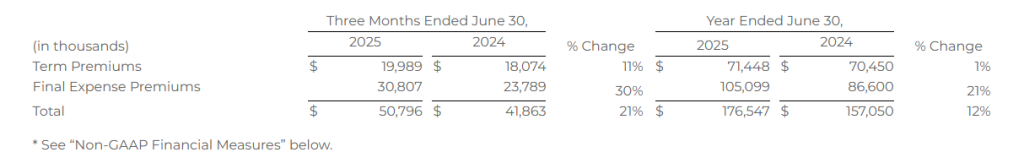
Life premium represents the total premium value for all policies that were approved by the relevant insurance carrier partner and for which the policy document was sent to the policyholder and payment information was received by the relevant insurance carrier partner during the indicated period. Because our commissions are earned based on a percentage of total premium, total premium volume for a given period is the key driver of revenue for our Life segment.
The following table shows term and final expense premiums for the periods presented:
Earnings Conference Call
SelectQuote, Inc. will host a conference call with the investment community on August 21, 2025, beginning at 8:30 a.m. ET. To register for this conference call, please use this link: https://registrations.events/direct/Q4I547808. After registering, a confirmation will be sent via email, including dial-in details and unique conference call codes for entry. Registration is open through the live call, but to ensure you are connected for the full call we suggest registering at least 10 minutes before the start of the call. The event will also be webcasted live via our investor relations website https://ir.selectquote.com/investor-home/default.aspx.
Non-GAAP Financial Measures
This release includes certain non-GAAP financial measures intended to supplement, not substitute for, comparable GAAP measures. To supplement our financial statements presented in accordance with GAAP and to provide investors with additional information regarding our GAAP financial results, we have presented in this release Adjusted EBITDA, which is a non-GAAP financial measure. This non-GAAP financial measure is not based on any standardized methodology prescribed by GAAP and is not necessarily comparable to any similarly titled measure presented by other companies. We define Adjusted EBITDA as net income (loss) before income tax expense (benefit), plus interest expense, depreciation and amortization, changes in fair value of warrant liabilities, and certain add-backs for non-cash or non-recurring expenses, including restructuring and share-based compensation expenses. The most directly comparable GAAP measure is net income (loss) before income tax expense (benefit). We monitor and have presented in this release Adjusted EBITDA because it is a key measure used by our management and Board of Directors to understand and evaluate our operating performance, establish budgets, and develop operational goals for managing our business. In particular, we believe that excluding the impact of these expenses in calculating Adjusted EBITDA can provide a useful measure for period-to-period comparisons of our core operating performance.
Reconciliations of net income (loss) before income tax expense (benefit) to Adjusted EBITDA are presented below beginning on page 12. The Company is unable to provide a quantitative reconciliation of forward-looking Adjusted EBITDA to its most directly comparable GAAP measure without unreasonable effort because it is not possible to predict certain information included in the calculation of such GAAP measure, including the fair value of outstanding warrants to purchase shares of the Company’s common stock. The unavailable information could have a significant impact on the Company’s GAAP financial results.
Forward Looking Statements
This release contains forward-looking statements. These forward-looking statements reflect our current views with respect to, among other things, future events and our financial performance. These statements are often, but not always, made through the use of words or phrases such as “may,” “should,” “could,” “predict,” “potential,” “believe,” “will likely result,” “expect,” “continue,” “will,” “anticipate,” “seek,” “estimate,” “intend,” “plan,” “projection,” “would” and “outlook,” or the negative version of those words or other comparable words or phrases of a future or forward-looking nature. These forward-looking statements are not historical facts and are based on current expectations, estimates and projections about our industry, management’s beliefs and certain assumptions made by management, many of which, by their nature, are inherently uncertain and beyond our control. Accordingly, we caution you that any such forward-looking statements are not guarantees of future performance and are subject to risks, assumptions and uncertainties that are difficult to predict. Although we believe that the expectations reflected in these forward-looking statements are reasonable as of the date made, actual results may prove to be materially different from the results expressed or implied by the forward-looking statements.
There are or will be important factors that could cause our actual results to differ materially from those indicated in these forward-looking statements, including, but not limited to, the following: our reliance on a limited number of insurance carrier partners and any potential termination of those relationships or failure to develop new relationships; existing and future laws and regulations affecting the health insurance market; changes in health insurance products offered by our insurance carrier partners and the health insurance market generally; insurance carriers offering products and services directly to consumers; changes to commissions paid by insurance carriers and underwriting practices; competition with brokers, exclusively online brokers and carriers who opt to sell policies directly to consumers; competition from government-run health insurance exchanges; developments in the U.S. health insurance system; our dependence on revenue from carriers in our senior segment and downturns in the senior health as well as life, automotive and home insurance industries; our ability to develop new offerings and penetrate new vertical markets; risks from third-party products; failure to enroll individuals during the Medicare annual enrollment period; our ability to attract, integrate and retain qualified personnel; our dependence on lead providers and ability to compete for leads; failure to obtain and/or convert sales leads to actual sales of insurance policies; access to data from consumers and insurance carriers; accuracy of information provided from and to consumers during the insurance shopping process; cost-effective advertisement through internet search engines; ability to contact consumers and market products by telephone; global economic conditions, including inflation and tariffs; disruption to operations as a result of future acquisitions; significant estimates and assumptions in the preparation of our financial statements; impairment of goodwill; existing or potential litigation and other legal proceedings or inquiries, including the Department of Justice action alleging violations of the federal False Claims Act; our existing and future indebtedness; our ability to maintain compliance with our debt covenants; access to additional capital; failure to protect our intellectual property and our brand; fluctuations in our financial results caused by seasonality; accuracy and timeliness of commissions reports from insurance carriers; timing of insurance carriers’ approval and payment practices; factors that impact our estimate of the constrained lifetime value of commissions per policyholder; changes in accounting rules, tax legislation and other legislation; disruptions or failures of our technological infrastructure and platform; failure to maintain relationships with third-party service providers; cybersecurity breaches or other attacks involving our systems or those of our insurance carrier partners or third-party service providers; our ability to protect consumer information and other data; failure to market and sell Medicare plans effectively or in compliance with laws; and other factors related to our pharmacy business, including manufacturing or supply chain disruptions, access to and demand for prescription drugs, contractual reimbursement rates, and regulatory changes or other industry developments that may affect our pharmacy operations. For a further discussion of these and other risk factors that could impact our future results and performance, see the section entitled “Risk Factors” in our Annual Report on Form 10-K for the fiscal year ended June 30, 2025 (the “Annual Report”) and subsequent periodic reports filed by us with the Securities and Exchange Commission. Accordingly, you should not place undue reliance on any such forward-looking statements. Any forward-looking statement speaks only as of the date on which it is made, and, except as otherwise required by law, we do not undertake any obligation to publicly update or review any forward-looking statement, whether as a result of new information, future developments or otherwise..
About SelectQuote:
Founded in 1985, SelectQuote (NYSE: SLQT) pioneered the model of providing unbiased comparisons from multiple, highly-rated insurance companies, allowing consumers to choose the policy and terms that best meet their unique needs. Two foundational pillars underpin SelectQuote’s success: a strong force of highly-trained and skilled agents who provide a consultative needs analysis for every consumer, and proprietary technology that sources and routes high-quality leads. Today, the Company operates an ecosystem offering high touchpoints for consumers across insurance, pharmacy, and virtual care.
With an ecosystem offering engagement points for consumers across insurance, Medicare, pharmacy, and value-based care, the company now has three core business lines: SelectQuote Senior, SelectQuote Healthcare Services, and SelectQuote Life. SelectQuote Senior serves the needs of a demographic that sees around 10,000 people turn 65 each day with a range of Medicare Advantage and Medicare Supplement plans. SelectQuote Healthcare Services is comprised of the SelectRx Pharmacy, a Patient-Centered Pharmacy Home™ (PCPH) accredited pharmacy, SelectPatient Management, a provider of chronic care management services, and Healthcare Select which proactively connects consumers with a wide breadth of healthcare services supporting their needs.
OVERLAND PARK, Kan.–(BUSINESS WIRE)– SelectQuote, Inc. (NYSE: SLQT), a leading distributor of Medicare insurance policies and owner of a rapidly growing Healthcare Services platform, today announced it will release its fourth quarter and full year 2025 financial results before market open on Thursday, August 21, 2025. Chief Executive Officer, Tim Danker, and Chief Financial Officer, Ryan Clement, will host a conference call on the day of the release (August 21, 2025) at 8:30 am ET to discuss the results.
After registering, a confirmation will be sent via email, including dial in details and unique conference call codes for entry. Registration is open through the live call, but to ensure you are connected for the full call, we suggest registering a day in advance or at minimum 10 minutes before the start of the call. The event will also be webcasted live via our investor relations website https://ir.selectquote.com/investor-home/default.aspx or via this link.
About SelectQuote:
Founded in 1985, SelectQuote (NYSE: SLQT) pioneered the model of providing unbiased comparisons from multiple, highly-rated insurance companies, allowing consumers to choose the policy and terms that best meet their unique needs. Two foundational pillars underpin SelectQuote’s success: a strong force of highly-trained and skilled agents who provide a consultative needs analysis for every consumer, and proprietary technology that sources and routes high-quality leads. Today, the Company operates an ecosystem offering high touchpoints for consumers across insurance, pharmacy, and virtual care.
With an ecosystem offering engagement points for consumers across insurance, Medicare, pharmacy, and value-based care, the company now has three core business lines: SelectQuote Senior, SelectQuote Healthcare Services, and SelectQuote Life. SelectQuote Senior serves the needs of a demographic that sees around 10,000 people turn 65 each day with a range of Medicare Advantage and Medicare Supplement plans. SelectQuote Healthcare Services is comprised of the SelectRx Pharmacy, a Patient-Centered Pharmacy Home™ (PCPH) accredited pharmacy, SelectPatient Management, a provider of chronic care management services, and Healthcare Select, which proactively connects consumers with a wide breadth of healthcare services supporting their needs.
OVERLAND PARK, Kan.–(BUSINESS WIRE)– SelectQuote, Inc. (NYSE: SLQT) (the “Company”), a leading distributor of Medicare insurance policies and owner of a rapidly-growing healthcare services platform, today announced the expanded launch of their innovative concierge-like service designed to specifically improve medication adherence for Medicare beneficiaries managing multiple chronic conditions and complex medication regimens. SelectQuote’s SelectRx pharmacy recently trialed a new approach with a regional health plan that demonstrated over 90% adherence, strengthening HEDIS Star ratings across the triple-weighted cholesterol, diabetes and hypertension measures. The Company plans to expand to additional payers this calendar year and will roll out across SelectRx’s pharmacy platform in 2026.
This program further demonstrates SelectQuote’s deep commitment to driving better health outcomes and greater value for both patients and payer partners. This high-touch solution is purpose-built to address the critical challenge of medication non-adherence, which often leads to preventable hospitalizations, adverse drug interactions, and escalating healthcare costs for the Medicare system.
SelectRx designed the program to proactively identify and engage high- and medium-risk patients, prioritizing those with a higher likelihood of adherence gaps. These beneficiaries stand to benefit most from enhanced support in managing their complex medication schedules. SelectQuote aims to help patients overcome adherence barriers through escalations to its clinical pharmacist team, who can provide specialized intervention. The Company also plans to launch a complementary program for lower risk members to support their continued medication adherence.
“We are incredibly excited about this initiative and its potential to significantly improve medication management for our most vulnerable Medicare beneficiaries,” said Bob Grant, President of SelectQuote. “Our SelectRx pharmacy offering already dramatically improves medication adherence and other health measures through timely, convenient delivery and easy-to-use packaging. We believe this new concierge-like program underscores that we are much more than a traditional Medicare broker helping beneficiaries find the right health plan. The program now takes our foundational commitment to improving Medicare patient outcomes to the next level. It embodies our mission to provide ongoing, personalized support that directly impacts patient health and well-being, significantly reducing costly acute episodes and improving quality of life.”
Forward Looking Statements
This release contains forward-looking statements. These forward-looking statements reflect our current views with respect to, among other things, future events and our financial performance. These statements are often, but not always, made through the use of words or phrases such as “may,” “should,” “could,” “predict,” “potential,” “believe,” “will likely result,” “expect,” “continue,” “will,” “anticipate,” “seek,” “estimate,” “intend,” “plan,” “projection,” “would” and “outlook,” or the negative version of those words or other comparable words or phrases of a future or forward-looking nature. These forward-looking statements are not historical facts, and are based on current expectations, estimates and projections about our industry, management’s beliefs and certain assumptions made by management, many of which, by their nature, are inherently uncertain and beyond our control. Accordingly, we caution you that any such forward-looking statements are not guarantees of future performance and are subject to risks, assumptions and uncertainties that are difficult to predict. Although we believe that the expectations reflected in these forward-looking statements are reasonable as of the date made, actual results may prove to be materially different from the results expressed or implied by the forward-looking statements.
There are or will be important factors that could cause our actual results to differ materially from those indicated in these forward-looking statements, including, but not limited to, the following: our reliance on a limited number of insurance carrier partners and any potential termination of those relationships or failure to develop new relationships; existing and future laws and regulations affecting the health insurance market; changes in health insurance products offered by our insurance carrier partners and the health insurance market generally; insurance carriers offering products and services directly to consumers; changes to commissions paid by insurance carriers and underwriting practices; competition with brokers, exclusively online brokers and carriers who opt to sell policies directly to consumers; competition from government-run health insurance exchanges; developments in the U.S. health insurance system; our dependence on revenue from carriers in our senior segment and downturns in the senior health as well as life, automotive and home insurance industries; our ability to develop new offerings and penetrate new vertical markets; risks from third-party products; failure to enroll individuals during the Medicare annual enrollment period; our ability to attract, integrate and retain qualified personnel; our dependence on lead providers and ability to compete for leads; failure to obtain and/or convert sales leads to actual sales of insurance policies; access to data from consumers and insurance carriers; accuracy of information provided from and to consumers during the insurance shopping process; cost-effective advertisement through internet search engines; ability to contact consumers and market products by telephone; global economic conditions, including inflation; disruption to operations as a result of future acquisitions; significant estimates and assumptions in the preparation of our financial statements; impairment of goodwill; potential litigation and other legal proceedings or inquiries; our existing and future indebtedness; our ability to maintain compliance with our debt covenants; access to additional capital; failure to protect our intellectual property and our brand; fluctuations in our financial results caused by seasonality; accuracy and timeliness of commissions reports from insurance carriers; timing of insurance carriers’ approval and payment practices; factors that impact our estimate of the constrained lifetime value of commissions per policyholder; changes in accounting rules, tax legislation and other legislation; disruptions or failures of our technological infrastructure and platform; failure to maintain relationships with third-party service providers; cybersecurity breaches or other attacks involving our systems or those of our insurance carrier partners or third-party service providers; our ability to protect consumer information and other data; failure to market and sell Medicare plans effectively or in compliance with laws; and other factors related to our pharmacy business, including manufacturing or supply chain disruptions, access to and demand for prescription drugs, and regulatory changes or other industry developments that may affect our pharmacy operations. For a further discussion of these and other risk factors that could impact our future results and performance, see the section entitled “Risk Factors” in the most recent Annual Report on Form 10-K (the “Annual Report”) and subsequent periodic reports filed by us with the Securities and Exchange Commission. Accordingly, you should not place undue reliance on any such forward-looking statements. Any forward-looking statement speaks only as of the date on which it is made, and, except as otherwise required by law, we do not undertake any obligation to publicly update or review any forward-looking statement, whether as a result of new information, future developments or otherwise.
About SelectQuote:
Founded in 1985, SelectQuote (NYSE: SLQT) pioneered the model of providing unbiased comparisons from multiple, highly-rated insurance companies, allowing consumers to choose the policy and terms that best meet their unique needs. Two foundational pillars underpin SelectQuote’s success: a strong force of highly-trained and skilled agents who provide a consultative needs analysis for every consumer, and proprietary technology that sources and routes high-quality leads. Today, the Company operates an ecosystem offering high touchpoints for consumers across insurance, pharmacy, and virtual care.
With an ecosystem offering engagement points for consumers across insurance, Medicare, pharmacy, and value-based care, the company now has three core business lines: SelectQuote Senior, SelectQuote Healthcare Services, and SelectQuote Life. SelectQuote Senior serves the needs of a demographic that sees around 10,000 people turn 65 each day with a range of Medicare Advantage and Medicare Supplement plans. SelectQuote Healthcare Services is comprised of the SelectRx Pharmacy, a Patient-Centered Pharmacy Home™ (PCPH) accredited pharmacy, SelectPatient Management, a provider of chronic care management services, and Healthcare Select, which proactively connects consumers with a wide breadth of healthcare services supporting their needs.
Patrick McCann, CFA, Research Analyst, Noble Capital Markets, Inc.
Michael Kupinski, Director of Research, Equity Research Analyst, Digital, Media & Technology , Noble Capital Markets, Inc.
Refer to the full report for the price target, fundamental analysis, and rating.
Setting up fiscal 2026. We are adjusting our fiscal Q4 estimates to reflect updated expectations for the Medicare Advantage market, with a particular focus on recent regulatory changes affecting Special Needs Plans (SNPs). While these developments introduce near-term challenges, we believe SelectQuote is well-positioned heading into fiscal 2026. We expect the company to rebuild agent capacity ahead of the next Annual Enrollment Period (AEP), to support a trajectory of sustained revenue growth and adj. EBITDA margin expansion.
Special Needs changes. Our revised Q4 outlook is primarily driven by recent changes implemented by CMS that restructure Special Needs Plan switching rights. The policy shift narrows mid-year enrollment flexibility for a significant portion of dual-eligible consumers (those enrolled in non-integrated D-SNPs), leading to the prospect of a smaller pool of shopping beneficiaries during the middle of calendar 2025. In addition, we are accounting for SelectQuote’s reduced year-over-year agent count, which entered fiscal 2025 approximately 22% below the prior-year level due to capital constraints at the time. These factors combined create a more muted backdrop for near-term Medicare Advantage performance.
Equity Research is available at no cost to Registered users of Channelchek. Not a Member? Click ‘Join’ to join the Channelchek Community. There is no cost to register, and we never collect credit card information.
This Company Sponsored Research is provided by Noble Capital Markets, Inc., a FINRA and S.E.C. registered broker-dealer (B/D).
*Analyst certification and important disclosures included in the full report. NOTE: investment decisions should not be based upon the content of this research summary. Proper due diligence is required before making any investment decision.
Patrick McCann, CFA, Research Analyst, Noble Capital Markets, Inc.
Michael Kupinski, Director of Research, Equity Research Analyst, Digital, Media & Technology , Noble Capital Markets, Inc.
Refer to the full report for the price target, fundamental analysis, and rating.
FY Q3 results. The company reported fiscal Q3 revenue of $408.2 million, largely in line with our estimate of $417.0 million. Adj. EBITDA of $37.7 million was 10% lower than our estimate of $41.8 million, the variance largely due to higher cost of revenue.
Focusing on Pharmacy efficiency. In April, the company opened its new fulfillment center in Kansas, which is expected to drive higher profitability in the Healthcare Services segment over the long-term through newer technology and machinery. We expect the new facility to be a drag on profitability over the next quarter or so, however, due to the investments the company is making in the facility. The launch of the new facility aligns with the company’s goal to focus more on Healthcare Service profitability, given the scale that the segment has already achieved (approx. 106k SelectRx members).
Equity Research is available at no cost to Registered users of Channelchek. Not a Member? Click ‘Join’ to join the Channelchek Community. There is no cost to register, and we never collect credit card information.
This Company Sponsored Research is provided by Noble Capital Markets, Inc., a FINRA and S.E.C. registered broker-dealer (B/D).
*Analyst certification and important disclosures included in the full report. NOTE: investment decisions should not be based upon the content of this research summary. Proper due diligence is required before making any investment decision.
Third Quarter of Fiscal Year 2025 – Consolidated Earnings Highlights
Revenue of $408.2 million
Net income of $26.0 million
Adjusted EBITDA* of $37.7 million
Fiscal Year 2025 Guidance Ranges:
Revenue expected in a range of $1.500 billion to $1.575 billion
Net income (loss) expected in a range of $(1) million to $28 million
Adjusted EBITDA* expected in a range of $115 million to $140 million
Third Quarter Fiscal Year 2025 – Segment Highlights
Senior
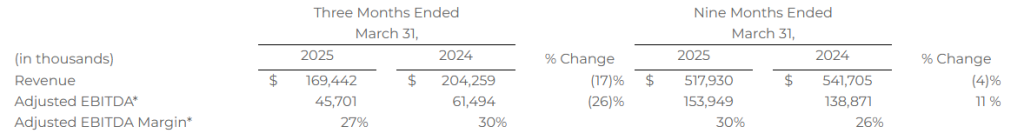
Revenue of $169.4 million
Adjusted EBITDA* of $45.7 million
Approved Medicare Advantage policies of 168,001
Healthcare Services
Revenue of $189.6 million
Adjusted EBITDA* of $6.4 million
105,523 SelectRx members
Life
Revenue of $45.8 million
Adjusted EBITDA* of $6.4 million
OVERLAND PARK, Kan.–(BUSINESS WIRE)– SelectQuote, Inc. (NYSE: SLQT) reported consolidated revenue for the third quarter of fiscal year 2025 of $408.2 million compared to consolidated revenue for the third quarter of fiscal year 2024 of $376.4 million. Consolidated net income for the third quarter of fiscal year 2025 was $26.0 million compared to consolidated net income for the third quarter of fiscal year 2024 of $8.6 million. Finally, consolidated Adjusted EBITDA* for the third quarter of fiscal year 2025 was $37.7 million compared to consolidated Adjusted EBITDA* for the third quarter of fiscal year 2024 of $46.6 million.
SelectQuote Chief Executive Officer, Tim Danker, remarked, “We are very proud of the service and value we delivered to America’s seniors over this past year’s highly unique Medicare Advantage season. SelectQuote’s agent-led model paired with our technology-enabled information advantage made our platform more valuable than ever to participants in the healthcare ecosystem. Policy features changed materially and plan termination activity from carriers was significantly higher than historical averages. Through that volatility and confusion, SelectQuote’s agents again delivered remarkable and efficient service, highlighted by a 15% increase in year-over-year policy close rates. SelectQuote is organized to help each and every customer as an individual and despite significant change, our agents were able to help a higher percentage of them this year than last. Strong execution in our Senior business paired with continued performance in Healthcare Services and our Life division all contributed to successful consolidated results for our fiscal 3rd quarter.”
* See “Non-GAAP Financial Measures” below.
Segment Results
We currently have three reportable segments: 1) Senior, 2) Healthcare Services and 3) Life. The performance measures of the segments include total revenue and Adjusted EBITDA.* Costs of commissions and other services revenue, cost of goods sold-pharmacy revenue, marketing and advertising, selling, general, and administrative, and technical development operating expenses that are directly attributable to a segment are reported within the applicable segment. Indirect costs of revenue, marketing and advertising, selling, general, and administrative, and technical development operating expenses are allocated to each segment based on varying metrics such as headcount. Adjusted EBITDA is our segment profit measure to evaluate the operating performance of our business. We define Adjusted EBITDA as income (loss) before income tax expense (benefit) plus: (i) interest expense, net; (ii) depreciation and amortization; (iii) share-based compensation; (iv) goodwill, long-lived asset, and intangible assets impairments; (v) transaction costs; (vi) loss on disposal of property, equipment and software, net; (vii) other non-recurring expenses and income; (viii) changes in fair value of warrant liabilities. Adjusted EBITDA Margin is calculated as Adjusted EBITDA divided by revenue.
Senior
Financial Results
The following table provides the financial results for the Senior segment for the periods presented:
Operating Metrics
Submitted Policies
Submitted policies are counted when an individual completes an application with our licensed agent and provides authorization to the agent to submit the application to the insurance carrier partner. The applicant may have additional actions to take before the application will be reviewed by the insurance carrier.
The following table shows the number of submitted policies for the periods presented:
Approved Policies
Approved policies represents the number of submitted policies that were approved by our insurance carrier partners for the identified product during the indicated period. Not all approved policies will go in force.
* See “Non-GAAP Financial Measures” below.
The following table shows the number of approved policies for the periods presented:
Lifetime Value of Commissions per Approved Policy
Lifetime value of commissions per approved policy represents commissions estimated to be collected over the estimated life of an approved policy based on multiple factors, including but not limited to, contracted commission rates, carrier mix and expected policy persistency with applied constraints. The lifetime value of commissions per approved policy is equal to the sum of the commission revenue due upon the initial sale of a policy, and when applicable, an estimate of future renewal commissions.
The following table shows the lifetime value of commissions per approved policy for the periods presented:
Healthcare Services
Financial Results
The following table provides the financial results for the Healthcare Services segment for the periods presented:
Operating Metrics
Members
The total number of SelectRx members represents the amount of active customers to which an order has been shipped and the prescriptions per day represents the total average prescriptions shipped per business day. These two metrics are the primary drivers of revenue for Healthcare Services.
* See “Non-GAAP Financial Measures” below.
The following table shows the total number of SelectRx members as of the periods presented:
The total number of SelectRx members increased by 41% as of March 31, 2025, compared to March 31, 2024, due to our strategy to grow SelectRx membership.
The following table shows the average prescriptions shipped per day for the periods presented:
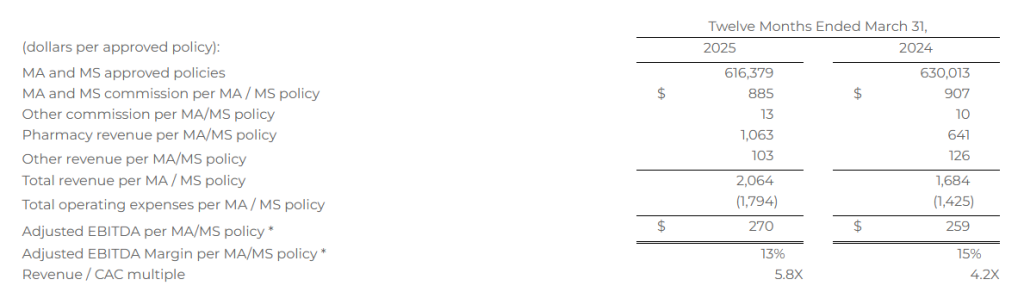
Combined Senior and Healthcare Services – Consumer Per Unit Economics
The opportunity to leverage our existing database and distribution model to improve access to healthcare services for our consumers has created a need for us to review our key metrics related to our per unit economics. As we think about the revenue and expenses for Healthcare Services, we note that they are primarily driven by the marketing acquisition costs associated with the sale of an MA or MS policy, some of which costs are allocated directly to Healthcare Services, and therefore determined that our per unit economics measure should include components from both Senior and Healthcare Services. See details of revenue and expense items included in the calculation below.
Combined Senior and Healthcare Services consumer per unit economics represents total MA and MS commissions; other product commissions; other revenues, including revenues from Healthcare Services; and operating expenses associated with Senior and Healthcare Services, each shown per number of approved MA and MS policies over a given time period. Management assesses the business on a per-unit basis to help ensure that the revenue opportunity associated with a successful policy sale is attractive relative to the marketing acquisition cost. Because not all acquired leads result in a successful policy sale, all per-policy metrics are based on approved policies, which is the measure that triggers revenue recognition.
The MA and MS commission per MA/MS policy represents the LTV for policies sold in the period. Other commission per MA/MS policy represents the LTV for other products sold in the period, including DVH prescription drug plan, and other products, which management views as additional commission revenue on our agents’ core function of MA/MS policy sales. Pharmacy revenue per MA/MS policy represents revenue from SelectRx, and other revenue per MA/MS policy represents revenue from Population Health, production bonuses, marketing development funds, lead generation revenue, and adjustments from the Company’s reassessment of its cohorts’ transaction prices. Total operating expenses per MA/MS policy represents all of the operating expenses within Senior and Healthcare Services. The revenue to customer acquisition cost (“CAC”) multiple represents total revenue as a multiple of total marketing acquisition cost, which represents the direct costs of acquiring leads. These costs are included in marketing and advertising expense within the total operating expenses per MA/MS policy.
The following table shows combined Senior and Healthcare Services consumer per unit economics for the periods presented. Based on the seasonality of Senior and the fluctuations between quarters, we believe that the most relevant view of per unit economics is on a rolling 12-month basis. All per MA/MS policy metrics below are based on the sum of approved MA/MS policies, as both products have similar commission profiles.
Total revenue per MA/MS policy increased 23% for the twelve months ended March 31, 2025, compared to the twelve months ended March 31, 2024, primarily due to the increase in pharmacy revenue. Total operating expenses per MA/MS policy increased 26% for the twelve months ended March 31, 2025, compared to the twelve months ended March 31, 2024, driven by an increase in cost of goods sold-pharmacy revenue for Healthcare Services due to the growth of the business.
Life
Financial Results
The following table provides the financial results for the Life segment for the periods presented:
Operating Metrics
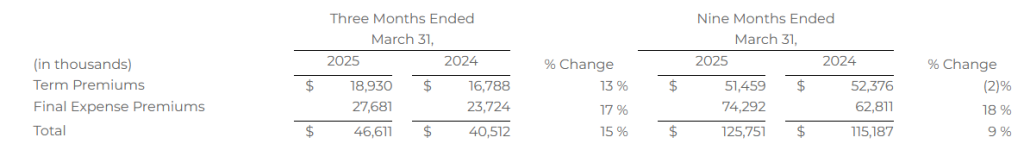
Life premium represents the total premium value for all policies that were approved by the relevant insurance carrier partner and for which the policy document was sent to the policyholder and payment information was received by the relevant insurance carrier partner during the indicated period. Because our commissions are earned based on a percentage of total premium, total premium volume for a given period is the key driver of revenue for our Life segment.
The following table shows term and final expense premiums for the periods presented:
* See “Non-GAAP Financial Measures” below.
Earnings Conference Call
SelectQuote, Inc. will host a conference call with the investment community on May 12, 2025, beginning at 8:30 a.m. ET. To register for this conference call, please use this link: https://registrations.events/direct/Q4I54780976. After registering, a confirmation will be sent via email, including dial-in details and unique conference call codes for entry. Registration is open through the live call, but to ensure you are connected for the full call we suggest registering at least 10 minutes before the start of the call. The event will also be webcasted live via our investor relations website https://ir.selectquote.com/investor-home/default.aspx.
Non-GAAP Financial Measures
This release includes certain non-GAAP financial measures intended to supplement, not substitute for, comparable GAAP measures. To supplement our financial statements presented in accordance with GAAP and to provide investors with additional information regarding our GAAP financial results, we have presented in this release Adjusted EBITDA and Adjusted EBITDA Margin, which are non-GAAP financial measures. These non-GAAP financial measures are not based on any standardized methodology prescribed by GAAP and are not necessarily comparable to similarly titled measures presented by other companies. We define Adjusted EBITDA as net income (loss) before income tax expense (benefit), plus interest expense, depreciation and amortization, changes in fair value of warrant liabilities, and certain add-backs for non-cash or non-recurring expenses, including restructuring and share-based compensation expenses. The most directly comparable GAAP measure is income (loss) before tax expense (benefit). We define Adjusted EBITDA Margin as Adjusted EBITDA divided by revenue. The most directly comparable GAAP measure is net income margin. We monitor and have presented in this release Adjusted EBITDA and Adjusted EBITDA Margin because they are key measures used by our management and Board of Directors to understand and evaluate our operating performance, to establish budgets, and to develop operational goals for managing our business. In particular, we believe that excluding the impact of these expenses in calculating Adjusted EBITDA can provide a useful measure for period-to-period comparisons of our core operating performance. We believe that these non-GAAP financial measures help identify underlying trends in our business that could otherwise be masked by the effect of the expenses that we exclude in the calculations of these non-GAAP financial measures. Accordingly, we believe that these financial measures provide useful information to investors and others in understanding and evaluating our operating results, enhancing the overall understanding of our past performance and future prospects. Reconciliations of net income (loss) before income tax expense (benefit) to Adjusted EBITDA are presented below beginning on page 12.
Forward Looking Statements
This release contains forward-looking statements. These forward-looking statements reflect our current views with respect to, among other things, future events and our financial performance. These statements are often, but not always, made through the use of words or phrases such as “may,” “should,” “could,” “predict,” “potential,” “believe,” “will likely result,” “expect,” “continue,” “will,” “anticipate,” “seek,” “estimate,” “intend,” “plan,” “projection,” “would” and “outlook,” or the negative version of those words or other comparable words or phrases of a future or forward-looking nature. These forward-looking statements are not historical facts, and are based on current expectations, estimates and projections about our industry, management’s beliefs and certain assumptions made by management, many of which, by their nature, are inherently uncertain and beyond our control. Accordingly, we caution you that any such forward-looking statements are not guarantees of future performance and are subject to risks, assumptions and uncertainties that are difficult to predict. Although we believe that the expectations reflected in these forward-looking statements are reasonable as of the date made, actual results may prove to be materially different from the results expressed or implied by the forward-looking statements.
There are or will be important factors that could cause our actual results to differ materially from those indicated in these forward-looking statements, including, but not limited to, the following: our reliance on a limited number of insurance carrier partners and any potential termination of those relationships or failure to develop new relationships; existing and future laws and regulations affecting the health insurance market; changes in health insurance products offered by our insurance carrier partners and the health insurance market generally; insurance carriers offering products and services directly to consumers; changes to commissions paid by insurance carriers and underwriting practices; competition with brokers, exclusively online brokers and carriers who opt to sell policies directly to consumers; competition from government-run health insurance exchanges; developments in the U.S. health insurance system; our dependence on revenue from carriers in our senior segment and downturns in the senior health as well as life, automotive and home insurance industries; our ability to develop new offerings and penetrate new vertical markets; risks from third-party products; failure to enroll individuals during the Medicare annual enrollment period; our ability to attract, integrate and retain qualified personnel; our dependence on lead providers and ability to compete for leads; failure to obtain and/or convert sales leads to actual sales of insurance policies; access to data from consumers and insurance carriers; accuracy of information provided from and to consumers during the insurance shopping process; cost-effective advertisement through internet search engines; ability to contact consumers and market products by telephone; global economic conditions, including inflation; disruption to operations as a result of future acquisitions; significant estimates and assumptions in the preparation of our financial statements; impairment of goodwill; potential litigation and other legal proceedings or inquiries; our existing and future indebtedness; our ability to maintain compliance with our debt covenants; access to additional capital; failure to protect our intellectual property and our brand; fluctuations in our financial results caused by seasonality; accuracy and timeliness of commissions reports from insurance carriers; timing of insurance carriers’ approval and payment practices; factors that impact our estimate of the constrained lifetime value of commissions per policyholder; changes in accounting rules, tax legislation and other legislation; disruptions or failures of our technological infrastructure and platform; failure to maintain relationships with third-party service providers; cybersecurity breaches or other attacks involving our systems or those of our insurance carrier partners or third-party service providers; our ability to protect consumer information and other data; failure to market and sell Medicare plans effectively or in compliance with laws; and and other factors related to our pharmacy business, including manufacturing or supply chain disruptions, access to and demand for prescription drugs, and regulatory changes or other industry developments that may affect our pharmacy operations. For a further discussion of these and other risk factors that could impact our future results and performance, see the section entitled “Risk Factors” in the most recent Annual Report on Form 10-K (the “Annual Report”) and subsequent periodic reports filed by us with the Securities and Exchange Commission. Accordingly, you should not place undue reliance on any such forward-looking statements. Any forward-looking statement speaks only as of the date on which it is made, and, except as otherwise required by law, we do not undertake any obligation to publicly update or review any forward-looking statement, whether as a result of new information, future developments or otherwise.
About SelectQuote:
Founded in 1985, SelectQuote (NYSE: SLQT) pioneered the model of providing unbiased comparisons from multiple, highly-rated insurance companies, allowing consumers to choose the policy and terms that best meet their unique needs. Two foundational pillars underpin SelectQuote’s success: a strong force of highly-trained and skilled agents who provide a consultative needs analysis for every consumer, and proprietary technology that sources and routes high-quality leads. Today, the Company operates an ecosystem offering high touchpoints for consumers across insurance, pharmacy, and virtual care.
With an ecosystem offering engagement points for consumers across insurance, Medicare, pharmacy, and value-based care, the company now has three core business lines: SelectQuote Senior, SelectQuote Healthcare Services, and SelectQuote Life. SelectQuote Senior serves the needs of a demographic that sees around 10,000 people turn 65 each day with a range of Medicare Advantage and Medicare Supplement plans. SelectQuote Healthcare Services is comprised of the SelectRx Pharmacy, a Patient-Centered Pharmacy Home™ (PCPH) accredited pharmacy, SelectPatient Management, a provider of chronic care management services, and Healthcare Select which proactively connects consumers with a wide breadth of healthcare services supporting their needs.
For over 40 years, SelectQuote has helped millions of Americans find the right insurance coverage to meet their healthcare needs. Our steadfast commitment to integrity, compliance and customer service is foundational to our business.
OVERLAND PARK, Kan.–(BUSINESS WIRE)– SelectQuote, Inc. (NYSE: SLQT), a leading distributor of Medicare insurance policies and owner of a rapidly-growing healthcare services platform, strongly disagrees with the allegations made by the Department of Justice (DoJ) complaint filed against multiple participants in the Medicare Advantage industry last week. SelectQuote believes the allegations are incorrect and lack a clear understanding of the overall industry and SelectQuote’s business model.
As we have previously disclosed, we have cooperated with the DoJ’s inquiries since 2022. We firmly reject these allegations and will defend our reputation as a compliant and fair-dealing standard bearer in the Medicare Advantage industry.
SelectQuote’s mission remains as it always has been: to connect our customers to the best insurance plans to meet their unique needs. We look forward to continuing our 40-year legacy as customer-focused, value-enhancing broker in the Medicare Advantage sector.
Over the past four decades, we have served over 8 million Americans, helping them find the right insurance coverage for their needs. We are particularly proud of our Senior health work, which helps some of the most underserved communities in every corner of our country, including many seniors in small towns, rural areas, and urban areas.
The beneficiary population we serve also skews toward seniors who are both lower income and less healthy than the U.S. average. The percent of our customers who qualify for dual special needs plans based upon their income level is more than twice the national average. Our policy sales also represent a much higher portion of individuals with severe and chronic diseases than the national average.
Throughout our history, we have worked hard to build a culture based on values of integrity and compliance, and we require and prioritize adherence to all applicable laws, rules and regulations.
SelectQuote will defend itself against the allegations in the DoJ’s complaint, and we are confident that once the facts are presented, there will be a positive resolution to this matter.
About SelectQuote:
Founded in 1985, SelectQuote (NYSE: SLQT) pioneered the model of providing unbiased comparisons from multiple, highly-rated insurance companies, allowing consumers to choose the policy and terms that best meet their unique needs. Two foundational pillars underpin SelectQuote’s success: a strong force of highly-trained and skilled agents who provide a consultative needs analysis for every consumer, and proprietary technology that sources and routes high-quality leads. Today, the Company operates an ecosystem offering high touchpoints for consumers across insurance, pharmacy, and virtual care.
With an ecosystem offering engagement points for consumers across insurance, Medicare, pharmacy, and value-based care, the company now has three core business lines: SelectQuote Senior, SelectQuote Healthcare Services, and SelectQuote Life. SelectQuote Senior serves the needs of a demographic that sees around 10,000 people turn 65 each day with a range of Medicare Advantage and Medicare Supplement plans. SelectQuote Healthcare Services is comprised of the SelectRx Pharmacy, a Patient-Centered Pharmacy Home™ (PCPH) accredited pharmacy, SelectPatient Management, a provider of chronic care management services, and Healthcare Select which proactively connects consumers with a wide breadth of healthcare services supporting their needs.
OVERLAND PARK, Kan.–(BUSINESS WIRE)– SelectQuote, Inc. (NYSE: SLQT), a leading distributor of Medicare insurance policies and owner of a rapidly growing Healthcare Services platform, today announced it will release its third quarter 2025 financial results before market open on Monday, May 12, 2025. Chief Executive Officer, Tim Danker, and Chief Financial Officer, Ryan Clement, will host a conference call on the day of the release (May 12, 2025) at 8:30 am ET to discuss the results.
After registering, a confirmation will be sent via email, including dial in details and unique conference call codes for entry. Registration is open through the live call, but to ensure you are connected for the full call, we suggest registering a day in advance or at minimum 10 minutes before the start of the call. The event will also be webcasted live via our investor relations website https://ir.selectquote.com/investor-home/default.aspx or via this link.
About SelectQuote:
Founded in 1985, SelectQuote (NYSE: SLQT) pioneered the model of providing unbiased comparisons from multiple, highly-rated insurance companies, allowing consumers to choose the policy and terms that best meet their unique needs. Two foundational pillars underpin SelectQuote’s success: a strong force of highly-trained and skilled agents who provide a consultative needs analysis for every consumer, and proprietary technology that sources and routes high-quality leads. Today, the Company operates an ecosystem offering high touchpoints for consumers across insurance, pharmacy, and virtual care.
With an ecosystem offering engagement points for consumers across insurance, Medicare, pharmacy, and value-based care, the company now has three core business lines: SelectQuote Senior, SelectQuote Healthcare Services, and SelectQuote Life. SelectQuote Senior serves the needs of a demographic that sees around 10,000 people turn 65 each day with a range of Medicare Advantage and Medicare Supplement plans. SelectQuote Healthcare Services is comprised of the SelectRx Pharmacy, a Patient-Centered Pharmacy Home™ (PCPH) accredited pharmacy, SelectPatient Management, a provider of chronic care management services, and Healthcare Select which proactively connects consumers with a wide breadth of healthcare services supporting their needs.
OVERLAND PARK, Kan.–(BUSINESS WIRE)– SelectQuote, Inc. (NYSE: SLQT) (the “Company”), a leading distributor of Medicare insurance policies and owner of a rapidly-growing healthcare services platform, today announced that the Company closed and received the proceeds from the $350 million strategic investment on February 28, 2025. The Company originally announced a binding agreement on the transaction with funds managed by Bain Capital, Morgan Stanley Private Credit, and Newlight Partners on February 10th.
The Company used $260 million of proceeds to pay down its outstanding term loan. The Company now has more than $100 million of available liquidity as it continues to focus on its industry-leading insurance distribution businesses and rapidly expanding healthcare services business.
With the completion of this transaction, SelectQuote also appointed Chris Wolfe of Bain Capital Insurance and Srdjan Vukovic of Newlight Partners to the Board of Directors, each bringing over 20 years of investing and healthcare sector experience to the Company.
Founded in 1985, SelectQuote (NYSE: SLQT) pioneered the model of providing unbiased comparisons from multiple, highly-rated insurance companies, allowing consumers to choose the policy and terms that best meet their unique needs. Two foundational pillars underpin SelectQuote’s success: a strong force of highly-trained and skilled agents who provide a consultative needs analysis for every consumer, and proprietary technology that sources and routes high-quality leads. Today, the Company operates an ecosystem offering high touchpoints for consumers across insurance, pharmacy, and virtual care.
With an ecosystem offering engagement points for consumers across insurance, Medicare, pharmacy, and value-based care, the company now has three core business lines: SelectQuote Senior, SelectQuote Healthcare Services, and SelectQuote Life. SelectQuote Senior serves the needs of a demographic that sees around 10,000 people turn 65 each day with a range of Medicare Advantage and Medicare Supplement plans. SelectQuote Healthcare Services is comprised of the SelectRx Pharmacy, a Patient-Centered Pharmacy Home™ (PCPH) accredited pharmacy, SelectPatient Management, a provider of chronic care management services, and Healthcare Select which proactively connects consumers with a wide breadth of healthcare services supporting their needs.
OVERLAND PARK, Kan.–(BUSINESS WIRE)– SelectQuote, Inc. (NYSE: SLQT) (the “Company”), a leading distributor of Medicare insurance policies and owner of a rapidly-growing healthcare services platform, today announced that the Company signed a $350 million strategic investment from funds managed by Bain Capital, Morgan Stanley Private Credit, and Newlight Partners.
The transaction positions the Company to continue growing its healthcare services business, deepening its relationship with carrier partners and providing choice and value for consumers. This investment will allow the Company to recapitalize its balance sheet, to lower its annual cash debt service, and to provide liquidity and increase operating flexibility to fund growth initiatives. The Company’s successful renegotiation of its Senior Secured Credit Facility provides a lower interest rate on the remaining balance.
This investment will accelerate the Company’s effort to optimize its capital structure as it continues to explore accretive, strategic solutions with its insurance carrier partners and to grow its rapidly expanding healthcare services business.
Additionally, SelectQuote is appointing Chris Wolfe of Bain Capital and Srdjan Vukovic of Newlight Partners to the Board of Directors, each bringing over 20 years of investing and healthcare sector experience to the Company. SelectQuote anticipates Mr. Wolfe and Mr. Vukovic will join the Board upon the closing of the transaction, expected to be on February 28, 2025.
SelectQuote CEO Tim Danker commented, “This strategic investment provides the financing we need to capitalize on the robust growth opportunities we foresee in both the senior health insurance and healthcare services marketplaces. While we have more work to do, this deal, on the heels of our 2024 receivables securitization, marks the second meaningful milestone toward our ultimate goal of refinancing the business and significantly deleveraging the balance sheet.”
Mr. Danker continued, “We look forward to benefitting from Chris’s and Srdjan’s valuable growth-oriented healthcare expertise to help augment the Company’s mission to drive long-term value creation.”
Mr. Wolfe is a Managing Director at Bain Capital Insurance, the dedicated insurance investing unit of Bain Capital. Previously, he was a partner at Capital Z Partners and a principal in a series of special purpose acquisition vehicles focused on health insurance and services. Mr. Wolfe has more than 20 years of experience in healthcare and insurance private equity investing.
“SelectQuote pioneered the way consumers approach shopping for insurance by removing barriers and introducing transparency and choice,” added Mr. Wolfe. “I am excited to partner with my fellow board members and the Company’s management team to drive continued growth of its robust insurance sales and healthcare services solutions, which play a crucial role in safeguarding and enhancing the financial well-being and health of its customers.”
Mr. Vukovic is a Partner at Newlight Partners, where he focuses on investments in the healthcare industry. Representative investments include Oak Street Health (acquired by CVS Health) and Zing Health. He has over 20 years of private equity investing experience.
Ashwin Krishnan, Managing Director and Co-Head of North America Private Credit at Morgan Stanley Investment Management stated, “We are pleased to partner with SelectQuote and lead this financing alongside our partners Bain Capital and Newlight. We believe this investment, along with the Company’s recent operating momentum, sets the business up for continued long-term success.”
Jefferies served as Exclusive Financial Advisor to SelectQuote in the transaction. Wachtell, Lipton, Rosen & Katz served as legal advisor to SelectQuote.
Forward Looking Statements
This release contains forward-looking statements. These forward-looking statements reflect our current views with respect to, among other things, future events and our financial performance. These statements are often, but not always, made through the use of words or phrases such as “may,” “should,” “could,” “predict,” “potential,” “believe,” “will likely result,” “expect,” “continue,” “will,” “anticipate,” “seek,” “estimate,” “intend,” “plan,” “projection,” “would” and “outlook,” or the negative version of those words or other comparable words or phrases of a future or forward-looking nature. These forward-looking statements are not historical facts, and are based on current expectations, estimates and projections about our industry, management’s beliefs and certain assumptions made by management, many of which, by their nature, are inherently uncertain and beyond our control. Accordingly, we caution you that any such forward-looking statements are not guarantees of future performance and are subject to risks, assumptions and uncertainties that are difficult to predict. Although we believe that the expectations reflected in these forward-looking statements are reasonable as of the date made, actual results may prove to be materially different from the results expressed or implied by the forward-looking statements.
There are or will be important factors that could cause our actual results to differ materially from those indicated in these forward-looking statements, including, but not limited to, the following: our reliance on a limited number of insurance carrier partners and any potential termination of those relationships or failure to develop new relationships; existing and future laws and regulations affecting the health insurance market; changes in health insurance products offered by our insurance carrier partners and the health insurance market generally; insurance carriers offering products and services directly to consumers; changes to commissions paid by insurance carriers and underwriting practices; competition with brokers, exclusively online brokers and carriers who opt to sell policies directly to consumers; competition from government-run health insurance exchanges; developments in the U.S. health insurance system; our dependence on revenue from carriers in our senior segment and downturns in the senior health as well as life, automotive and home insurance industries; our ability to develop new offerings and penetrate new vertical markets; risks from third-party products; failure to enroll individuals during the Medicare annual enrollment period; our ability to attract, integrate and retain qualified personnel; our dependence on lead providers and ability to compete for leads; failure to obtain and/or convert sales leads to actual sales of insurance policies; access to data from consumers and insurance carriers; accuracy of information provided from and to consumers during the insurance shopping process; cost-effective advertisement through internet search engines; ability to contact consumers and market products by telephone; global economic conditions, including inflation; disruption to operations as a result of future acquisitions; significant estimates and assumptions in the preparation of our financial statements; impairment of goodwill; potential litigation and other legal proceedings or inquiries; our existing and future indebtedness; our ability to maintain compliance with our debt covenants; access to additional capital; failure to protect our intellectual property and our brand; fluctuations in our financial results caused by seasonality; accuracy and timeliness of commissions reports from insurance carriers; timing of insurance carriers’ approval and payment practices; factors that impact our estimate of the constrained lifetime value of commissions per policyholder; changes in accounting rules, tax legislation and other legislation; disruptions or failures of our technological infrastructure and platform; failure to maintain relationships with third-party service providers; cybersecurity breaches or other attacks involving our systems or those of our insurance carrier partners or third-party service providers; our ability to protect consumer information and other data; failure to market and sell Medicare plans effectively or in compliance with laws; and other factors related to our pharmacy business, including manufacturing or supply chain disruptions, access to and demand for prescription drugs, and regulatory changes or other industry developments that may affect our pharmacy operations. For a further discussion of these and other risk factors that could impact our future results and performance, see the section entitled “Risk Factors” in the most recent Annual Report on Form 10-K (the “Annual Report”) and subsequent periodic reports filed by us with the Securities and Exchange Commission. Accordingly, you should not place undue reliance on any such forward-looking statements. Any forward-looking statement speaks only as of the date on which it is made, and, except as otherwise required by law, we do not undertake any obligation to publicly update or review any forward-looking statement, whether as a result of new information, future developments or otherwise.
About SelectQuote:
Founded in 1985, SelectQuote (NYSE: SLQT) pioneered the model of providing unbiased comparisons from multiple, highly-rated insurance companies, allowing consumers to choose the policy and terms that best meet their unique needs. Two foundational pillars underpin SelectQuote’s success: a strong force of highly-trained and skilled agents who provide a consultative needs analysis for every consumer, and proprietary technology that sources and routes high-quality leads. Today, the Company operates an ecosystem offering high touchpoints for consumers across insurance, pharmacy, and virtual care.
With an ecosystem offering engagement points for consumers across insurance, Medicare, pharmacy, and value-based care, the company now has three core business lines: SelectQuote Senior, SelectQuote Healthcare Services, and SelectQuote Life. SelectQuote Senior serves the needs of a demographic that sees around 10,000 people turn 65 each day with a range of Medicare Advantage and Medicare Supplement plans. SelectQuote Healthcare Services is comprised of the SelectRx Pharmacy, a Patient-Centered Pharmacy Home (PCPH) accredited pharmacy, SelectPatient Management, a provider of chronic care management services, and Healthcare Select which proactively connects consumers with a wide breadth of healthcare services supporting their needs.
About Bain Capital:
Founded in 1984, Bain Capital is one of the world’s leading private investment firms. We are committed to creating lasting impact for our investors, teams, businesses, and the communities in which we live. As a private partnership, we lead with conviction and a culture of collaboration, advantages that enable us to innovate investment approaches, unlock opportunities, and create exceptional outcomes. Our global platform invests across five focus areas: Private Equity, Growth & Venture, Capital Solutions, Credit & Capital Markets, and Real Assets. In these focus areas, we bring deep sector expertise and wide-ranging capabilities. We have 24 offices on four continents, more than 1,850 employees, and approximately $185 billion in assets under management. To learn more, visit www.baincapital.com. Follow @BainCapital on LinkedIn and X (Twitter).
About Newlight Partners:
Newlight Partners LP is a growth-focused private equity firm that builds businesses in partnership with exceptional founders and management teams. Newlight’s thematic investment approach focuses on identifying and addressing marketplace opportunities in rapidly growing subsectors. Areas of focus include digital transformation, decarbonization, financial services, and healthcare.
About Morgan Stanley Private Credit:
Morgan Stanley Private Credit, part of Morgan Stanley Investment Management, is a private credit platform focused on direct lending and opportunistic private credit investment in North America and Western Europe. The Morgan Stanley Private Credit team invests across the capital structure, including senior secured term loans, unitranche loans, junior debt, structured equity and common equity co-investments. For further information, please visit the website: morganstanley.com/im/private-credit
Second Quarter of Fiscal Year 2025 – Consolidated Earnings Highlights
Revenue of $481.1 million
Net income of $53.2 million
Adjusted EBITDA* of $87.5 million
Fiscal Year 2025 Guidance Ranges:
Revenue expected in a range of $1.500 billion to $1.575 billion
Net income (loss) expected in a range of $(24) million to $11 million
Adjusted EBITDA* expected in a range of $115 million to $140 million
Second Quarter Fiscal Year 2025 – Segment Highlights
Senior
Revenue of $255.6 million
Adjusted EBITDA* of $100.5 million
Approved Medicare Advantage policies of 247,849
Healthcare Services
Revenue of $183.4 million
Adjusted EBITDA* of $2.2 million
96,695 SelectRx members
Life
Revenue of $39.9 million
Adjusted EBITDA* of $7.4 million
OVERLAND PARK, Kan.–(BUSINESS WIRE)– SelectQuote, Inc. (NYSE: SLQT) reported consolidated revenue for the second quarter of fiscal year 2025 of $481.1 million compared to consolidated revenue for the second quarter of fiscal year 2024 of $405.4 million. Consolidated net income for the second quarter of fiscal year 2025 was $53.2 million compared to consolidated net income for the second quarter of fiscal year 2024 of $19.4 million. Finally, consolidated Adjusted EBITDA* for the second quarter of fiscal year 2025 was $87.5 million compared to consolidated Adjusted EBITDA* for the second quarter of fiscal year 2024 of $67.4 million.
SelectQuote Chief Executive Officer, Tim Danker, remarked, “SelectQuote delivered impressive results during our fiscal second quarter despite a historically disruptive Annual Enrollment Period. Our strong policy volume and Senior Adjusted EBITDA margin of 39%, up approximately 750 basis points year-over-year, are additional proof points of our differentiated, high-touch, agent-led model. American Seniors faced an unprecedented level of plan terminations and benefit changes this season, and we take great pride in that fact that consumers sought out SelectQuote as they navigated such a challenging market backdrop. As we’ve said before, SelectQuote wins when our customers win, and this quarter is evidence of that.”
Mr. Danker continued, “SelectQuote also delivered another quarter of strong results within our Healthcare Services segment, led by SelectRx. We now have over 96,000 members, which represents growth of 54% compared to a year ago. Importantly, we expanded our global Revenue to CAC to 5.3X, which demonstrates our continued ability to generate attractive returns as a comprehensive healthcare services provider.”
“Additionally, we took another large step to improve our capital structure with today’s announcement of a $350 million strategic investment led by Bain Capital and Morgan Stanley Private Credit. The transaction provides improved liquidity and operating flexibility to grow within our Senior and Healthcare Services businesses. We are excited to have Bain Capital and Morgan Stanley Private Credit as strategic partners as we pursue the tremendous growth opportunity provided by our unique platform within the healthcare ecosystem.”
* See “Non-GAAP Financial Measures” below.
Segment Results
We currently have three reportable segments: 1) Senior, 2) Healthcare Services and 3) Life. The performance measures of the segments include total revenue and Adjusted EBITDA.* Costs of commissions and other services revenue, cost of goods sold-pharmacy revenue, marketing and advertising, selling, general, and administrative, and technical development operating expenses that are directly attributable to a segment are reported within the applicable segment. Indirect costs of revenue, marketing and advertising, selling, general, and administrative, and technical development operating expenses are allocated to each segment based on varying metrics such as headcount. Adjusted EBITDA is our segment profit measure to evaluate the operating performance of our business. We define Adjusted EBITDA as income (loss) before income tax expense (benefit) plus: (i) interest expense, net; (ii) depreciation and amortization; (iii) share-based compensation; (iv) goodwill, long-lived asset, and intangible assets impairments; (v) transaction costs; (vi) loss on disposal of property, equipment and software, net; (vii) other non-recurring expenses and income; (viii) changes in fair value of warrant liabilities. Adjusted EBITDA Margin is calculated as Adjusted EBITDA divided by revenue.