Key Points: – U.S. East Coast port workers are poised to strike, potentially halting container traffic from Maine to Texas. – The strike could cost the U.S. economy an estimated $5 billion a day, directly impacting shipping and transportation stocks. – Companies in logistics, shipping, and transportation sectors could face stock volatility due to supply chain disruptions.
In what could become the largest port disruption in decades, U.S. East and Gulf Coast port workers are set to strike, posing a significant threat to the nation’s economy and potentially shaking up transportation and shipping stocks. The International Longshoremen’s Association (ILA), representing 45,000 workers, has not reached an agreement with the United States Maritime Alliance (USMX), and with no talks scheduled, a strike appears imminent. The last coast-wide ILA strike was in 1977, and this impending strike could have far-reaching consequences.
This labor dispute could cost the U.S. economy as much as $5 billion per day, halting the flow of goods in and out of the nation’s busiest ports, from Maine to Texas. As retail businesses prepare for the holiday season, the strike threatens to create major supply chain bottlenecks, increasing the pressure on companies that depend on timely shipping and logistics to meet demand.
For transportation and shipping stocks, the impact could be immediate. Stocks of companies like FedEx, UPS, XPO Logistics, and JB Hunt Transport Services could see increased volatility as the strike unfolds. Container shipping companies such as Matson, ZIM Integrated Shipping Services, and Danaos Corporation are also likely to face challenges due to disruptions in port activity. With nearly 100,000 containers expected to be stuck at the ports of New York and New Jersey alone, delays in deliveries could result in higher costs, slower operations, and potentially reduced earnings for logistics and transportation companies.
The strike could also have a ripple effect across transportation stocks beyond just those involved in logistics. Companies in industries dependent on port activity, such as retailers, manufacturers, and automotive suppliers, may see disruptions in their supply chains. This could create downward pressure on stock prices across a variety of sectors, further compounding the economic damage.
The broader shipping sector is also vulnerable to sudden shifts in stock value, particularly if delays cause shipping costs to rise. Companies with heavy exposure to East Coast and Gulf Coast ports may face increased operational costs as they are forced to reroute goods through alternative ports or transport modes, impacting their bottom line. Analysts are watching shipping stocks closely, and any prolonged strike could lead to earnings downgrades for several transportation companies.
As the labor dispute remains unresolved, investors in transportation and shipping stocks will need to monitor developments closely. Prolonged disruptions could have a significant effect on quarterly earnings, stock performance, and overall sector sentiment. With no negotiations planned, the situation is on a knife’s edge, and any news about progress—or the lack thereof—will likely trigger swift movements in related stocks.
Euroseas Ltd. was formed on May 5, 2005 under the laws of the Republic of the Marshall Islands to consolidate the ship owning interests of the Pittas family of Athens, Greece, which has been in the shipping business over the past 140 years. Euroseas trades on the NASDAQ Capital Market under the ticker ESEA. Euroseas operates in the container shipping market. Euroseas’ operations are managed by Eurobulk Ltd., an ISO 9001:2008 and ISO 14001:2004 certified affiliated ship management company, which is responsible for the day-to-day commercial and technical management and operations of the vessels. Euroseas employs its vessels on spot and period charters and through pool arrangements.
Mark Reichman, Managing Director, Equity Research Analyst, Natural Resources, Noble Capital Markets, Inc.
Refer to the full report for the price target, fundamental analysis, and rating.
M/V Joanna charter. Euroseas Ltd. executed a new time charter contract for its 1,732 twenty-foot equivalent (teu) feeder containership, M/V Joanna, for a minimum period of 23 months to a maximum period of 25 months at an average gross daily rate of $16,500. The rate is higher than its current charter rate of $13,500 per day which ends in August. The charter for M/V Joanna will commence at the end of October 2024. The charter is expected to contribute EBITDA of ~$6.4 million during the minimum contracted period and increases the company’s remaining 2024 and 2025 charter coverage to 92% and 40%, respectively.
M/V Pepi Star charter. The company executed a time charter contract for the M/V Pepi Star, an 1,800 teu feeder containership currently under construction, for a minimum period of 23 to a maximum period of 25 months at a gross daily rate of $24,250. The time charter contract rate is higher than what we had previously forecast. The new charter will commence in mid-July upon delivery of the vessel from the shipyard. The charter is expected to contribute EBITDA in the amount of ~$12.3 million during the minimum contracted period.
Equity Research is available at no cost to Registered users of Channelchek. Not a Member? Click ‘Join’ to join the Channelchek Community. There is no cost to register, and we never collect credit card information.
This Research is provided by Noble Capital Markets, Inc., a FINRA and S.E.C. registered broker-dealer (B/D).
*Analyst certification and important disclosures included in the full report. NOTE: investment decisions should not be based upon the content of this research summary. Proper due diligence is required before making any investment decision.
Euroseas Ltd. was formed on May 5, 2005 under the laws of the Republic of the Marshall Islands to consolidate the ship owning interests of the Pittas family of Athens, Greece, which has been in the shipping business over the past 140 years. Euroseas trades on the NASDAQ Capital Market under the ticker ESEA. Euroseas operates in the container shipping market. Euroseas’ operations are managed by Eurobulk Ltd., an ISO 9001:2008 and ISO 14001:2004 certified affiliated ship management company, which is responsible for the day-to-day commercial and technical management and operations of the vessels. Euroseas employs its vessels on spot and period charters and through pool arrangements.
Michael Heim, Senior Vice President, Equity Research Analyst, Energy & Transportation, Noble Capital Markets, Inc.
Refer to the full report for the price target, fundamental analysis, and rating.
Euroseas reported results below expectations mainly due to higher drydocking costs. Vessel utilization and shipping rates were near expectations. With ship repairs completed and new vessels on the way, the company is well positioned to take advantage of an improved shipping rate environment. While the existing fleet is largely chartered out, the addition of four newbuild vessels increases the company’s leverage to shipping rates.
Management expects some shipping rate softness in 2025 due to the large number of vessel additions industry wide year to date. Shipping rates have benefitted from the conflict in the Red Sea, which has caused ships to take longer routes. Should conflicts abate, rates could weaken as decreased demand for ships is met with additional vessel supply. We would not be surprised to see management increase its 2025 charter position ahead of any weakness.
Equity Research is available at no cost to Registered users of Channelchek. Not a Member? Click ‘Join’ to join the Channelchek Community. There is no cost to register, and we never collect credit card information.
This Research is provided by Noble Capital Markets, Inc., a FINRA and S.E.C. registered broker-dealer (B/D).
*Analyst certification and important disclosures included in the full report. NOTE: investment decisions should not be based upon the content of this research summary. Proper due diligence is required before making any investment decision.
In a transaction that could reshape the landscape of domestic energy transportation, private transportation titan Saltchuk Resources is acquiring publicly-traded Overseas Shipholding Group (OSG) for $950 million. The deal will see OSG, one of the leading providers of liquid bulk transportation services for crude oil and petroleum products in the U.S., become a subsidiary of the diversified Saltchuk group.
The acquisition crowns months of corporate maneuvering and deal-making. It began in late January when Saltchuk, already a significant OSG shareholder, made public its non-binding indication of interest to buy the shipowner outright at $6.25 per share. OSG’s board undertook a review of strategic alternatives, engaging with not just Saltchuk but other potential suitors.
That process culminated in Saltchuk’s winning bid of $8.50 per share – a hefty 61% premium to OSG’s price before word of Saltchuk’s initial approach leaked out. Unanimously approved by both companies’ boards, the cash tender offer values OSG’s equity at $653 million.
For Saltchuk, the deal represents a lucrative double down on the Jones Act shipping sector that ensures American crew, boats and resources are utilized for shipping between U.S. ports. OSG boasts a sizable fleet of U.S.-flagged vessels including shuttle tankers, ATBs, and Suezmax crude carriers serving energy industry customers.
“OSG, our nation’s leading domestic marine transporter of energy, has a strong cultural fit with Saltchuk and shares our commitment to operational safety, reliability, and environmental stewardship,” remarked Mark Tabbutt, Saltchuk’s Chairman.
Acquiring OSG significantly expands Saltchuk’s marine services footprint to complement its existing freight transportation and energy distribution operations under brands like TOTE Maritime, Foss Maritime, NorCal Van & Stor, and Hawaii Petroleum. With over $5 billion in consolidated annual revenues, the private Seattle-based holding company gains increased exposure to the lucrative end markets for moving and handling oil, gas and refined products.
From OSG’s perspective, the sale unlocks a premium acquisition price while providing long-term operational stability by tucking into Saltchuk’s family of companies. OSG President and CEO Sam Norton expressed enthusiasm about “soon joining the Saltchuk family of companies” and gaining access to its resources.
However, the deal must first clear customary closing conditions and regulatory approvals. The tender offer is expected to be completed within the next few months, after which any remaining shares will be acquired in a second-step merger. While the acquisition enjoys board support, OSG shareholders will ultimately determine whether to tender their stakes.
If successful, the combination of OSG’s expertise in Jones Act petroleum shipping with Saltchuk’s scale and diversification could create a new domestic energy shipping powerhouse. But questions remain whether the lofty valuation and integration will pay off for the private buyers in an industry facing headwinds from the transition to cleaner fuels. Regardless, this megadeal indicates the importance both parties place on securing reliable domestic shipping services to keep U.S. energy production on the move.
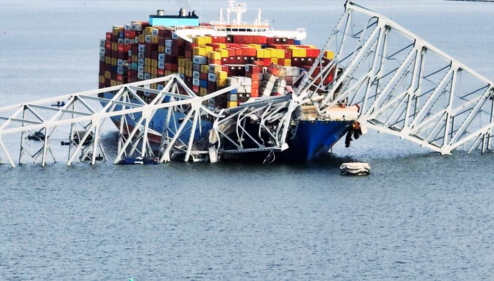
In a shocking incident early Tuesday morning, the Francis Scott Key Bridge in Baltimore collapsed after being struck by a large container ship. The bridge carried Interstate 695 over the Patapsco River, a critical transportation artery southeast of the Baltimore metropolitan area. Up to seven people may have fallen into the water after vehicles on the bridge were impacted, with two rescued so far.
This catastrophic event has wide-ranging implications, not just for the tragic loss of life and regional transportation, but also for the shipping and logistics industry. The container ship involved has been identified as the Singapore-flagged DALI, a 948-foot vessel chartered by shipping giant Maersk and operated by Synergy Marine Group.
While the cause is still under investigation, the incident starkly highlights the risks and vulnerabilities faced by the shipping industry and supply chains. A single accident can bring a vital port and transportation hub to a standstill. The U.S. Coast Guard has already suspended all vessel traffic in and out of the Port of Baltimore until further notice.
This is likely to cause significant disruptions and delays, not just for Baltimore but rippling across global shipping routes and supply chains that rely on the port. The Port of Baltimore handled over 15 million tons of foreign cargo in 2021 and is a critical gateway for international trade on the U.S. East Coast.
Investors in the shipping and logistics sectors will be watching developments closely. Major players like Maersk could face legal liabilities, higher insurance costs, reputational damage, and loss of business from prolonged port closures. Smaller shipping companies that rely on the Baltimore port may be even more heavily impacted operationally and financially.
The incident also casts a harsh spotlight on the state of U.S. infrastructure. Despite the Biden administration’s efforts through the Bipartisan Infrastructure Law, incidents like this underscore the costs and risks of deficient transportation infrastructure. According to the American Road & Transportation Builders Association, over 43,000 bridges across the U.S. are classified as structurally deficient.
This could spur renewed focus on infrastructure spending and improvements, creating potential opportunities for companies involved in construction, engineering, and building materials. However, it also highlights risks for industries like trucking and logistics that depend heavily on safe and reliable transportation networks.
In the small cap space, companies with localized operations around the Baltimore area could face disruptions to business activity and supply chains. This may create trading opportunities for investors watching the impacts closely. Conversely, small caps that provide solutions for infrastructure monitoring, maintenance and security may see increased interest.
Overall, while the human toll is the primary tragedy, this incident is likely to have significant ripple effects across the economy, policy landscape and investment markets in the weeks and months ahead. Investors would be wise to closely monitor developments and reassess potential risks and opportunities across sectors like shipping, infrastructure, and industrial small caps.
The escalating crisis in the Red Sea is creating chaos in global supply chains and sending container shipping rates skyrocketing. Liners like Maersk have indefinitely suspended all Red Sea transits after a U.S. military strike killed Houthi rebels who attacked container ships. This geopolitical turmoil means sharply higher costs for cargo shippers and potential volatility for investors in container shipping stocks.
The extensive rerouting of container ships around Africa’s Cape of Good Hope is severely disrupting global supply chains. But for investors focused on rates, the diversions are fueling optimism about 2024 profits for liner companies.
Various spot rate indexes show Asia-Europe rates have more than doubled since early December, with some lanes even tripling. Rates for routes to the U.S. East Coast have jumped 65-86% amid the intensifying military action and indefinite Red Sea suspensions. This promises to keep rates elevated through the first quarter of 2024.
However, while spot rates spike, rerouting ships increases voyage lengths by weeks and fuel consumption by tons. Military action also raises insurance costs. And delayed arrivals mean lower cargo volumes per quarter. Investors must weigh the benefits of higher rates against the headwinds of higher costs and reduced volumes.
Zim’s stock price has been on a rollercoaster, plunging 18% in late December on hopes Red Sea transits would resume, then surging 23% in early January after the new suspensions were announced. This extreme volatility highlights the risks from geopolitical unpredictability.
With rates rising rapidly, heavily-shorted stocks like Zim could unleash violent short squeezes, forcing bearish speculators to cover positions at a loss. The jump in borrow fees for Zim shares signals the mounting risks for short sellers.
If Houthi attacks continue regardless of U.S. warnings, coalition airstrikes in Yemen become more probable. A major ground war would endanger oil supplies, increasing fuel costs for shipping companies. Investors need to assess escalation risks and potential fallout.
Despite the short-term chaos, long-term tailwinds like fleet capacity control, recovering demand, and infrastructure constraints still favor strong rates over the long run. Red Sea tensions don’t negate those structural positives.
The Red Sea emergency amplifies rate momentum but countervailing uncertainties persist. Investors should prepare for liner stock volatility, scrutinize rate indexes closely, and focus on carriers with cost discipline and contracted volumes. While geopolitical mayhem won’t disrupt long-term shipping tailwinds, it may bring choppy near-term waters for investors.
Dry bulk shipping company Eagle Bulk Shipping (EGLE) announced Sunday night that it has agreed to an all-stock merger with sector peer Star Bulk Carriers Corp. (SBLK). The deal will create one of the world’s premiere owners of dry bulk vessels with a combined fleet of 169 ships worth over $2 billion.
Under the terms of the agreement, Eagle shareholders will receive 2.6211 shares of Star Bulk for each Eagle share they currently hold. With Star Bulk shares closing at $19.95 on Monday, December 11, this values Eagle stock at $52.29 per share. Compared to Eagle’s actual close of $46.19 on Monday, this deal premium comes out to 13%.
Powerhouse in Making
The merger brings together two already sizable dry bulk fleets under one umbrella to better compete on costs and provide customers integrated solutions. For example, the combined entity can offer both Capesize vessels ideal for long haul bulk transport as well as Supramax ships designed for flexibility.
With over 150 million deadweight tonnage (DWT), the new entity will rank among the top five largest publicly-traded dry bulk owners globally. Management estimates at least $50 million per year in cost savings through operational synergies, consolidated corporate overhead, and improved purchasing leverage with suppliers.
And the company will maintain an industry-leading balance sheet with net debt of $1.4 billion equaling a reasonable 37% of its $2.1 billion capitalization. The merger therefore sets up the new Star Bulk as a dominant player in dry bulk shipping both in scale and efficiency. Noble Capital Markets Senior Research Analyst Michael Heim states in his latest research report that “the combined market capitalization of $2.1 billion and fleet of 159 ships makes it one of the largest in the world.”
Modern, Eco-Friendly Fleet
Critically, Star Bulk inherits an even more modern and environmentally-friendly fleet from Eagle. The average vessel age will drop to 11 years versus 14 years currently. Eagle’s ships were built at top-tier Asian shipyards known for quality and efficiency.
Just as important, Eagle has been an early and enthusiastic adopter of exhaust gas scrubbers which reduce harmful emissions. In fact, 97% of the combined fleet will now have these scrubbers installed well positioning the company for impending environmental regulations.
Maintaining a modern, eco-friendly fleet is increasingly important to winning business from customers like commodities giants Glencore and Trafigura who value corporate responsibility. So the transaction gives Star Bulk key competitive advantages on this front.
Market Perform on Limited Remaining Upside
With significant strategic rationale behind the merger, the analyst still downgraded Eagle stock to a Market Perform with limited additional upside. Specifically, they dropped their price target to $52 simply reflecting the implicit deal price.
So while the merger appears to make industrial sense and places fair long-term value on Eagle, investors shouldn’t expect much added price appreciation from current levels. Of course, there is a small chance the merger fails to close as anticipated allowing shares to diverge back downward.
But assuming smooth sailing through the expected close in 1H 2024, Eagle shareholders can take comfort in the 13% premium and exciting combined company outlook. This sets up Eagle owners to become owners in the industry’s next dry bulk titan.
Eagle Bulk Shipping Inc. (“Eagle”) is a US-based drybulk owner-operator focused on the Supramax/Ultramax mid-size asset class, which ranges from 50,000 and 65,000 deadweight tons in size; these vessels are equipped with onboard cranes allowing for the self-loading and unloading of cargoes, a feature which distinguishes them from the larger classes of drybulk vessels and provides for greatly enhanced flexibility and versatility- both with respect to cargo diversity and port accessibility. The Company transports a broad range of major and minor bulk cargoes around the world, including coal, grain, ore, pet coke, cement, and fertilizer. Eagle operates out of three offices, Stamford (headquarters), Singapore, and Hamburg, and performs all aspects of vessel management in-house including: commercial, operational, technical, and strategic.
Michael Heim, Senior Vice President, Equity Research Analyst, Energy & Transportation, Noble Capital Markets, Inc.
Refer to the full report for the price target, fundamental analysis, and rating.
Eagle will get a 13% premium. Eagle shareholders will receive 2.6211 shares of Star Bulk for each share owned worth $52.29 per share based on Star Bulks Monday night close of $19.95. The implied price represents a 13% premium based on Monday night’s close and a 17% premium based on Friday’s close. The combined company will retain the Star Bulk name. Star Bulk management will take over most management positions including Chairman and CEO with certain Eagle management joining the team. The transaction is expected to close in the first half of 2024.
The combined company will be a leading dry bulk shipper. The combined market capitalization of $2.1 billion and fleet of 169 ships makes it one of the largest in the world. The fleet includes both small and large ships with 97% equipped with scrubbers and an average age of 11 years. The company is a low-cost operator, a position that should improve with an estimated $50 million in cost savings. Combined net debt of $1.4 billion represents a reasonable 37% of capitalization.
Equity Research is available at no cost to Registered users of Channelchek. Not a Member? Click ‘Join’ to join the Channelchek Community. There is no cost to register, and we never collect credit card information.
This Research is provided by Noble Capital Markets, Inc., a FINRA and S.E.C. registered broker-dealer (B/D).
*Analyst certification and important disclosures included in the full report. NOTE: investment decisions should not be based upon the content of this research summary. Proper due diligence is required before making any investment decision.
STAMFORD, Conn., Nov. 02, 2023 (GLOBE NEWSWIRE) — Eagle Bulk Shipping Inc. (NYSE: EGLE) (“Eagle” or the “Company”), one of the world’s largest owner-operators within the midsize drybulk vessel segment, today reported financial results for the quarter ended September 30, 2023.
Quarter Highlights:
Generated Revenues, net of $82.6 million
Achieved TCE(1) of $11,482 based on TCE Revenue(1) of $54.1 million
Incurred a net loss of $5.2 million, or $0.55 per basic share
Adjusted net loss(1) of $2.9 million, or $0.31 per basic share(1)
Generated Adjusted EBITDA(1) of $15.6 million
Completed the sale of the Sankaty Eagle, a non-core, non-scrubber-fitted Supramax bulkcarrier
Declared a quarterly dividend of $0.10 per share for the third quarter of 2023
Dividend is payable on November 22, 2023 to shareholders of record at the close of business on November 14, 2023
1These are non-GAAP financial measures. A reconciliation of GAAP to non-GAAP financial measures has been provided in the financial tables included in this press release. An explanation of these measures and how they are calculated are also included below under the heading “Supplemental Information – Non-GAAP Financial Measures.”
Recent Developments:
Coverage position for the fourth quarter of 2023 is as follows:
68% of owned available days fixed at an average TCE of $15,655
Eagle’s CEO Gary Vogel commented, “Although our financial results for the third quarter are reflective of the headwinds faced by the broader industry, we were able to once again outperform the BSI (Baltic Supramax Index) by 14%, achieving a net TCE of $11,482. Specifically, market fundamentals remained challenging during the quarter, with the BSI averaging just over $10,000 for the period.
Freight rates bottomed as we moved through the quarter, with September benefiting from a strong rally as the index reached almost $15,000. The Atlantic market was the main driver for this recovery in rates, catalyzed by robust exports of soybeans and corn out of Brazil following this season’s record crop. Looking ahead to the fourth quarter, spot rates have come off from their recent highs, but remain supported with the BSI averaging approximately $13,700 quarter-to-date. Further, as of today, we have fixed approximately 68% of our owned available days, at a net TCE of $15,655.
During the quarter, we continued to focus on operational efficiencies and improvements. Our OPEX costs were down sequentially for the third quarter in a row and Eagle’s entire fleet is now leveraging SoFar Ocean’s advanced voyage optimization system achieving meaningful fuel and emissions reductions.
We remain positive about the medium-term prospects for the drybulk industry, particularly given strong supply side fundamentals, macroeconomic risks notwithstanding. With a fully modern fleet of 52, predominately scrubber-fitted vessels, and approximately $170 million in total liquidity, Eagle is well-positioned to continue to take advantage of opportunities for the benefit of our stakeholders.”
Fleet Operating Data
Three Months Ended
Nine Months Ended
September 30, 2023
September 30, 2022
September 30, 2023
September 30, 2022
Ownership Days
4,808
4,831
14,425
14,424
Owned Available Days
4,708
4,588
13,791
13,599
Fleet Development
Sankaty Eagle, a 2011-built Supramax (58k DWT)
Sold in second quarter of 2023 for $16.4 million and delivered to new owners in third quarter of 2023
Owned fleet totals 52 vessels (96% scrubber-fitted) with an average age of 10.0 years
Results of Operations for the three and nine months ended September 30, 2023 and 2022
For the three months ended September 30, 2023, the Company reported a net loss of $5.2 million, or basic and diluted net loss per share of $0.55. In the comparable quarter of 2022, the Company reported net income of $77.2 million, or basic and diluted net income per share of $5.94 and $4.77, respectively.
For the three months ended September 30, 2023, the Company reported an adjusted net loss of $2.9 million, which excludes net unrealized losses on FFAs and bunker swaps of $2.2 million, or basic and diluted adjusted net loss per share of $0.31. In the comparable quarter of 2022, the Company reported adjusted net income of $74.3 million, which excludes net unrealized gains on FFAs and bunker swaps of $7.1 million and a loss on debt extinguishment of $4.2 million, or basic and diluted adjusted net income per share of $5.72 and $4.58, respectively.
For the nine months ended September 30, 2023, the Company reported net income of $16.1 million, or basic and diluted net income per share of $1.38 and $1.36, respectively. For the nine months ended September 30, 2022, the Company reported net income of $224.7 million, or basic and diluted net income per share of $17.31 and $13.86, respectively.
For the nine months ended September 30, 2023, the Company reported adjusted net income of $17.2 million, which excludes net unrealized losses on FFAs and bunker swaps of $0.4 million and impairment of operating lease right-of-use assets of $0.7 million, or basic and diluted adjusted net income per share of $1.47 and $1.44, respectively. For the nine months ended September 30, 2022, the Company reported adjusted net income of $220.4 million, which excludes net unrealized gains on FFAs and bunker swaps of $8.5 million and a loss on debt extinguishment of $4.2 million, or basic and diluted adjusted net income per share of $16.97 and $13.59, respectively.
Revenues, net
Revenues, net for the three months ended September 30, 2023 were $82.6 million compared to $185.3 million for the comparable quarter of 2022. Revenues, net decreased $102.7 million primarily due to lower rates on both time and voyage charters, driven by a decline in the drybulk market.
Revenues, net for the nine months ended September 30, 2023 were $289.2 million compared to $568.4 million for the nine months ended September 30, 2022. Revenues, net decreased $279.2 million primarily due to lower rates on both time and voyage charters, driven by a decline in the drybulk market.
Voyage expenses
Voyage expenses for the three months ended September 30, 2023 were $23.8 million compared to $40.8 million for the comparable quarter of 2022. Voyage expenses decreased $17.0 million primarily due to a $15.0 million reduction in bunker consumption expenses primarily due to decreases in voyage charters and bunker prices and a $1.2 million decrease in broker commissions due to lower freight rates driven by a decline in the drybulk market.
Voyage expenses for the nine months ended September 30, 2023 were $82.7 million compared to $120.7 million for the nine months ended September 30, 2022. Voyage expenses decreased $38.0 million primarily due to a $25.4 million reduction in bunker consumption expenses due to decreases in voyage charters and bunker prices, a $9.1 million reduction in port expenses due to a decrease in voyage charters and a $3.5 million decrease in broker commissions due to lower freight rates driven by a decline in the drybulk market.
Vessel operating expenses
Vessel operating expenses for the three months ended September 30, 2023 were $28.8 million compared to $33.1 million for the comparable quarter of 2022. Vessel operating expenses decreased $4.3 million primarily due to a $2.6 million decrease in repair costs, a $0.8 million decrease in lube costs driven by lower purchase volume and a $0.5 million decrease in the cost of stores and spares driven by lower purchases.
Vessel operating expenses for the nine months ended September 30, 2023 were $91.1 million compared to $88.2 million for the nine months ended September 30, 2022. Vessel operating expenses increased $2.9 million primarily due to a $3.2 million increase in crewing costs driven by higher compensation and increased crew changes as a result of crewing manager transitions and a $1.4 million increase in costs driven by certain repairs and discretionary spending on upgrades to six vessels, including newly acquired ships, partially offset by a $1.3 million decrease in lube costs driven by lower purchase volume and a $0.4 million decrease in the cost of stores and spares driven by lower purchases.
Adjusted vessel operating expenses(2), which excludes one-time, non-recurring expenses related to vessel acquisitions, charges relating to a change in the crewing manager on some of the Company’s vessels and discretionary hull and hold upgrades for the three months ended September 30, 2023 were $28.5 million compared to $31.7 million for the comparable quarter in 2022. Adjusted vessel operating expenses decreased $3.2 million primarily due to a $1.5 million decrease in repair costs, a $0.8 million decrease in lube costs driven by lower purchase volume and a $0.5 million decrease in the cost of stores and spares driven by lower purchases. Average daily adjusted vessel operating expenses(1) (“Adjusted DVOE”) for the three months ended September 30, 2023 were $5,922 compared to $6,566 for the comparable quarter in 2022.
Adjusted vessel operating expenses(2), which excludes one-time, non-recurring expenses related to vessel acquisitions, charges relating to a change in the crewing manager on some of the Company’s vessels and discretionary hull and hold upgrades for the nine months ended September 30, 2023 were $87.5 million compared to $86.4 million for the nine months ended September 30, 2022. Adjusted vessel operating expenses increased $1.1 million primarily due to a $2.6 million increase in crewing costs driven by higher compensation, a $1.3 million increase in repair costs, partially offset by a $1.6 million decrease in lube costs driven by lower purchase volume and a $0.4 million decrease in the cost of stores and spares driven by lower purchases. Adjusted DVOE for the nine months ended September 30, 2023 were $6,068 compared to $5,991 for the nine months ended September 30, 2022.
2This is a non-GAAP financial measure. A reconciliation of GAAP to non-GAAP financial measures has been provided in the financial tables included in this press release. An explanation of this measure and how it is calculated is also included below under the heading “Supplemental Information – Non-GAAP Financial Measures.”
Charter hire expenses
Charter hire expenses for the three months ended September 30, 2023 were $6.9 million compared to $19.8 million for the comparable quarter of 2022. Charter hire expenses decreased $12.9 million primarily due to decreases in both charter hire rates as a result of a decline in the drybulk market and chartered-in days.
Charter hire expenses for the nine months ended September 30, 2023 were $31.0 million compared to $63.8 million for the nine months ended September 30, 2022. Charter hire expenses decreased $32.8 million primarily due to decreases in both charter hire rates as a result of a decline in the drybulk market and chartered-in days.
Chartered-in days, which is the aggregate number of days in a period during which the Company chartered-in vessels, for the three months ended September 30, 2023 and 2022 were 589 and 1,000, respectively. Chartered-in days for the nine months ended September 30, 2023 and 2022 were 2,315 and 3,102, respectively.
Depreciation and amortization
Depreciation and amortization for the three months ended September 30, 2023 was $15.5 million compared to $15.4 million for the comparable quarter of 2022. Depreciation and amortization increased $0.1 million primarily due to a $0.8 million increase in depreciation from the net impact of vessels acquired and sold during the respective periods and a $0.1 million increase in deferred drydocking cost amortization due to higher drydocking expenditures, partially offset by $0.9 million decrease in depreciation due to a change in our estimated vessel scrap value from $300 per lwt to $400 per lwt, effective January 1, 2023.
Depreciation and amortization for the nine months ended September 30, 2023 was $45.0 million compared to $45.2 million for the nine months ended September 30, 2022. Depreciation and amortization decreased $0.2 million primarily due to a $2.9 million decrease in depreciation due to a change in our estimated vessel scrap value from $300 per lwt to $400 per lwt, effective January 1, 2023, partially offset by a $1.6 million increase in depreciation from the net impact of vessels acquired and sold during the respective periods, a $0.7 million increase in deferred drydocking cost amortization due to higher drydocking expenditures and a $0.3 million increase in depreciation from an increase in installed vessel improvements.
General and administrative expenses
General and administrative expenses for the three months ended September 30, 2023 were $10.7 million compared to $9.7 million for the comparable quarter of 2022. Excluding stock-based compensation expense of $1.7 million and $1.4 million for the three months ended September 30, 2023 and 2022, respectively, general and administrative expenses for the three months ended September 30, 2023 were $9.0 million compared to $8.2 million for the comparable quarter of 2022. General and administrative expenses increased $1.0 million primarily due to a $0.6 million increase in professional fees and a $0.2 million increase in stock-based compensation expense.
General and administrative expenses for the nine months ended September 30, 2023 were $32.9 million compared to $29.6 million for the nine months ended September 30, 2022. Excluding stock-based compensation expense of $5.7 million and $4.5 million for the nine months ended September 30, 2023 and 2022, respectively, general and administrative expenses for the nine months ended September 30, 2023 were $27.2 million compared to $25.1 million for the nine months ended September 30, 2022. General and administrative expenses increased $3.3 million primarily due to a $1.1 million increase in stock-based compensation expense, a $1.1 million increase in employee-related costs and other small increases across professional fees, corporate travel and office expenses.
Other operating expense
Other operating expense for the three months ended September 30, 2023 and 2022 was $0.7 million and $2.5 million, respectively. Other operating expense for the three months ended September 30, 2023 was primarily comprised of costs related to a 2021 U.S. government investigation into an allegation that one of our vessels may have improperly disposed of ballast water that entered the engine room bilges during a repair. Other operating expense for the three months ended September 30, 2022 was primarily comprised of costs associated with a corporate transaction that did not materialize.
Other operating expense for each of the nine months ended September 30, 2023 and 2022 was $0.9 million and $2.6 million, respectively. Other operating expense for the nine months ended September 30, 2023 was primarily comprised of costs related to a 2021 U.S. government investigation into an allegation that one of our vessels may have improperly disposed of ballast water that entered the engine room bilges during a repair. Other operating expense for the nine months ended September 30, 2022 was primarily comprised of costs associated with a corporate transaction that did not materialize.
Gain on sale of vessels
For the three months ended September 30, 2023, the Company recorded a gain on the sale of the vessel Sankaty Eagle of $4.9 million. For the three months ended September 30, 2022, the Company recorded a gain on the sale of the vessel Cardinal of $9.3 million.
For the nine months ended September 30, 2023, the Company recorded a gain on the sale of the vessels Jaeger, Montauk Eagle, Newport Eagle and Sankaty Eagle of $19.7 million. For the nine months ended September 30, 2022, the Company recorded a gain on the sale of the vessel Cardinal of $9.3 million.
Interest expense
Interest expense for the three months ended September 30, 2023 and 2022 was $7.7 million and $4.2 million, respectively. Interest expense increased $3.5 million due to the impact of increased amounts outstanding under the Global Ultraco Debt Facility and higher interest rates.
Interest expense for the nine months ended September 30, 2023 and 2022 was $16.0 million and $13.0 million, respectively. Interest expense increased $3.0 million primarily due to the impact of increased amounts outstanding under the Global Ultraco Debt Facility and higher interest rates.
Interest income
Interest income for the three months ended September 30, 2023 and 2022 was $1.5 million and $0.9 million, respectively. Interest income increased primarily due to higher interest rates on the Company’s cash balances.
Interest income for the nine months ended September 30, 2023 and 2022 was $5.1 million and $1.1 million, respectively. Interest income increased primarily due to higher interest rates on the Company’s cash balances.
Realized and unrealized loss/(gain) on derivative instruments, net
Realized and unrealized loss/(gain) on derivative instruments, net for the three months ended September 30, 2023 was a loss of $0.1 million compared to a gain of $11.3 million for the comparable quarter of 2022. The $11.4 million decrease was due to market movements as well as lower FFA and bunker swap activity.
Realized and unrealized loss/(gain) on derivative instruments, net for the nine months ended September 30, 2023 was a gain of $2.3 million compared to a gain of $13.3 million for the nine months ended September 30, 2022. The $11.0 million decrease was due to market movements as well as lower FFA and bunker swap activity.
A summary of outstanding FFAs as of September 30, 2023 is as follows:
FFA Period
Average FFA Contract Price
Number of Days Hedged
Quarter ending December 31, 2023 – Buy Positions
$
14,196
(345
)
Quarter ending December 31, 2023 – Sell Positions
$
12,922
1,380
Liquidity and Capital Resources
Nine Months Ended
($ in thousands)
September 30, 2023
September 30, 2022
Net cash provided by operating activities
$
35,965
$
242,491
Net cash (used in)/provided by investing activities
(27,831
)
4,090
Net cash used in financing activities
(81,434
)
(135,198
)
Net (decrease)/increase in cash, cash equivalents and restricted cash
(73,300
)
111,383
Cash, cash equivalents and restricted cash at beginning of period
189,754
86,222
Cash, cash equivalents and restricted cash at end of period
$
116,454
$
197,605
Net cash provided by operating activities for the nine months ended September 30, 2023 was $36.0 million, compared to $242.5 million for the nine months ended September 30, 2022. The decrease is primarily due to a decrease in net income driven by lower freight rates.
Net cash used in investing activities for the nine months ended September 30, 2023 was $27.8 million, compared to net cash provided by investing activities of $4.1 million for the nine months ended September 30, 2022. During the nine months ended September 30, 2023, the Company paid (i) $81.8 million to purchase three vessels and other vessel improvements, (ii) $2.1 million to purchase BWTS and (iii) $0.7 million to purchase other fixed assets. These uses of cash were partially offset by $56.6 million in net proceeds from the sale of four vessels. During the nine months ended September 30, 2022, the Company received net proceeds of $14.9 million from the sale of one vessel and paid (i) $5.7 million to purchase BWTS, (ii) $4.1 million as an advance for the purchase of a vessel, (iii) $0.8 million to purchase vessel improvements and (iv) $0.3 million to purchase other fixed assets.
Net cash used in financing activities for the nine months ended September 30, 2023 was $81.4 million, compared to $135.2 million for the nine months ended September 30, 2022. During the nine months ended September 30, 2023, the Company (i) paid $222.7 million to repurchase Common Stock, inclusive of fees, (ii) repaid $37.4 million of term loan under the Global Ultraco Debt Facility, (iii) paid $15.8 million in dividends and (iv) paid $2.0 million for taxes related to net share settlement of equity awards. These uses of cash were partially offset by (i) $123.4 million of proceeds, net of debt issuance costs, from the Revolving Facility under the Global Ultraco Debt Facility and (ii) $73.1 million of proceeds, net of debt issuance costs, from the Term Facility under the Global Ultraco Debt Facility. During the nine months ended September 30, 2022, the Company (i) paid $81.6 million in dividends, (ii) repaid $37.4 million of term loan under the Global Ultraco Debt Facility, (iii) paid $14.2 million to repurchase $10.0 million in aggregate principal amount of Convertible Bond Debt, and (iv) paid $2.4 million for taxes related to net share settlement of equity awards.
As of September 30, 2023, cash and cash equivalents including noncurrent restricted cash was $116.5 million compared to $189.8 million as of December 31, 2022.
A summary of the Company’s debt as of September 30, 2023 and December 31, 2022 is as follows:
September 30, 2023
December 31, 2022
($ in thousands)
Principal Amount Outstanding
Debt Discounts and Debt Issuance Costs
Carrying Value
Principal Amount Outstanding
Debt Discounts and Debt Issuance Costs
Carrying Value
Convertible Bond Debt
$
104,119
$
(328
)
$
103,791
$
104,119
$
(620
)
$
103,499
Global Ultraco Debt Facility – Term Facility
275,400
(5,778
)
269,622
237,750
(6,767
)
230,983
Global Ultraco Debt Facility – Revolving Facility
125,000
(2,941
)
122,059
—
—
—
Total debt
504,519
(9,047
)
495,472
341,869
(7,387
)
334,482
Less: Current portion – Convertible Bond Debt
(104,119
)
328
(103,791
)
—
—
—
Less: Current portion – Global Ultraco Debt Facility
(49,800
)
—
(49,800
)
(49,800
)
—
(49,800
)
Total long-term debt
$
350,600
$
(8,719
)
$
341,881
$
292,069
$
(7,387
)
$
284,682
(1
)
As of September 30, 2023 and December 31, 2022, the undrawn revolving facility under the Global Ultraco Debt Facility was $55 million and $100 million, respectively.
As of September 30, 2023, the effective conversion price of the Convertible Bond Debt equals $31.70 per share of Common Stock. If the market value of the Company’s Common Stock remains above this price, we would expect the holders of the Convertible Bond Debt to elect conversion prior to maturity. Upon conversion of the remaining Convertible Bond Debt, the Company will pay or deliver, as the case may be, either cash, shares of Common Stock or a combination of cash and shares of Common Stock, at the Company’s election, to the holder (subject to shareholder approval requirements in accordance with the indenture that governs the Convertible Bond Debt).
The Company continuously evaluates potential transactions that it expects to be accretive to earnings, enhance shareholder value or are in the best interests of the Company, including without limitation, business combinations, the acquisition of vessels or related businesses, repayment or refinancing of existing debt, the issuance of new securities, share and debt repurchases or other transactions.
Capital Expenditures and Drydocking
Our capital expenditures primarily relate to the purchase of vessels as well as regularly scheduled drydocking and other vessel improvements, which are expected to enhance their revenue earning capabilities, efficiency and/or safety and to comply with international shipping standards and environmental laws and regulations. Certain vessel improvement costs and costs incurred in connection with drydocking are necessary to comply with international shipping standards and environmental laws and regulations, while others are discretionary in nature and evaluated on a business case-by-case basis.
During the fourth quarter of 2022, the Company entered into a memorandum of agreement to acquire a high-specification 2015-built Ultramax bulkcarrier for total consideration of $24.3 million. The vessel was delivered to the Company during the first quarter of 2023.
On January 30, 2023, the Company entered into a memorandum of agreement to acquire a high-specification 2020-built scrubber-fitted Ultramax bulkcarrier for total consideration of $30.1 million. The vessel was delivered to the Company during the second quarter of 2023.
On February 28, 2023, the Company entered into a memorandum of agreement to acquire a high-specification 2020-built scrubber-fitted Ultramax bulkcarrier for total consideration of $30.1 million. The vessel was delivered to the Company during the second quarter of 2023.
Although the Company has some flexibility regarding the timing of vessel drydockings, the timing of costs are relatively predictable. In accordance with statutory requirements, we expect vessels less than 15 years old to be drydocked every 60 months and vessels older than 15 years to be drydocked every 30 months. We intend to fund drydocking costs with cash from operations, cash on hand or with amounts available under the Global Ultraco Debt Facility. In addition, drydocking typically requires us to reposition vessels from a discharge port to shipyard facilities, which will reduce our owned available days and revenues during that period.
Drydocking costs incurred are deferred and amortized through depreciation and amortization on the condensed consolidated statements of operations on a straight-line basis over the period through the date the next drydocking is required to become due. During the nine months ended September 30, 2023, five of our vessels completed drydock and we incurred $10.6 million for drydocking costs. During the nine months ended September 30, 2022, eight of our vessels completed drydock and we incurred $18.5 million for drydocking costs.
Vessel improvements generally include systems and equipment intended to enhance a vessel’s efficiency and revenue earning capability. We intend to fund these costs through cash from operations, cash on hand or amounts available under the Global Ultraco Debt Facility.
The following table provides certain information about the estimated costs for anticipated vessel drydockings and improvements in the next four quarters, along with the anticipated off-hire days:
Projected Costs (1) ($ in millions)
Quarters Ending
Off-hire Days(2)
Drydocks
Vessel Improvements(3)
December 31, 2023
224
$
4.1
$
1.8
March 31, 2024
232
$
4.7
$
0.8
June 30, 2024
143
$
2.0
$
0.4
September 30, 2024
165
$
2.4
$
—
(1
)
We intend to fund these costs with cash from operations, cash on hand or with amounts available under the Global Ultraco Debt Facility.
(2
)
Actual duration of off-hire days will vary based on the age and condition of the vessel, yard schedules and other factors. Projected off-hire days includes an allowance for unforeseen events.
(3
)
Projected costs for vessel improvements are primarily comprised of costs for ballast water treatment systems (“BWTS”).
SUMMARY CONSOLIDATED FINANCIAL AND OTHER DATA
The following table summarizes the Company’s selected condensed consolidated financial statements and other data for the periods indicated below.
CONDENSED CONSOLIDATED STATEMENTS OF OPERATIONS (Unaudited) (in thousands, except share and per share data)
Three Months Ended
Nine Months Ended
September 30, 2023
September 30, 2022
September 30, 2023
September 30, 2022
Revenues, net
$
82,606
$
185,313
$
289,210
$
568,406
Voyage expenses
23,791
40,792
82,737
120,710
Vessel operating expenses
28,822
33,091
91,077
88,213
Charter hire expenses
6,868
19,772
31,014
63,768
Depreciation and amortization
15,472
15,407
45,035
45,241
General and administrative expenses
10,652
9,666
32,871
29,611
Impairment of operating lease right-of-use assets
—
—
722
—
Other operating expense
677
2,469
860
2,643
Gain on sale of vessels
(4,855
)
(9,336
)
(19,731
)
(9,336
)
Total operating expenses, net
81,427
111,861
264,585
340,850
Operating income
1,179
73,452
24,625
227,556
Interest expense
7,714
4,236
16,005
13,021
Interest income
(1,488
)
(881
)
(5,139
)
(1,100
)
Realized and unrealized loss/(gain) on derivative instruments, net
104
(11,293
)
(2,318
)
(13,281
)
Loss on debt extinguishment
—
4,173
—
4,173
Total other expense/(income), net
6,330
(3,765
)
8,548
2,813
Net (loss)/income
$
(5,151
)
$
77,217
$
16,077
$
224,743
Weighted average shares outstanding:
Basic
9,313,051
12,993,450
11,686,433
12,985,329
Diluted
9,313,051
16,201,852
15,057,652
16,219,264
Per share amounts:
Basic net (loss)/income
$
(0.55
)
$
5.94
$
1.38
$
17.31
Diluted net (loss)/income
$
(0.55
)
$
4.77
$
1.36
$
13.86
CONDENSED CONSOLIDATED BALANCE SHEETS (Unaudited) (in thousands, except share data and par values)
September 30, 2023
December 31, 2022
ASSETS:
Current assets:
Cash and cash equivalents
$
113,879
$
187,155
Accounts receivable, net of a reserve of $2,933 and $3,169, respectively
24,594
32,311
Prepaid expenses
5,832
4,531
Inventories
26,881
28,081
Collateral on derivatives
4,380
909
Fair value of derivative assets – current
8,653
8,479
Other current assets
652
558
Total current assets
184,871
262,024
Noncurrent assets:
Vessels and vessel improvements, at cost, net of accumulated depreciation of $289,819 and $261,725, respectively
914,108
891,877
Advances for vessel purchases
—
3,638
Advances for BWTS and other assets
1,984
2,722
Deferred drydock costs, net
37,756
42,849
Other fixed assets, net of accumulated depreciation of $1,324 and $1,623, respectively
952
310
Operating lease right-of-use assets
10,892
23,006
Restricted cash – noncurrent
2,575
2,599
Fair value of derivative assets – noncurrent
5,435
8,184
Total noncurrent assets
973,702
975,185
Total assets
$
1,158,573
$
1,237,209
LIABILITIES & STOCKHOLDERS’ EQUITY:
Current liabilities:
Accounts payable
$
20,938
$
20,129
Accrued interest
2,092
3,061
Other accrued liabilities
19,198
24,097
Fair value of derivative liabilities – current
585
163
Current portion of operating lease liabilities
10,109
22,045
Unearned charter hire revenue
8,201
9,670
Current portion of long-term debt – Global Ultraco Debt Facility
49,800
49,800
Current portion of long-term debt – Convertible Bond Debt, net of debt discount and debt issuance costs
103,791
—
Total current liabilities
214,714
128,965
Noncurrent liabilities:
Long-term debt – Global Ultraco Debt Facility, net of debt discount and debt issuance costs
341,881
181,183
Convertible Bond Debt, net of debt discount and debt issuance costs
—
103,499
Fair value of derivative liabilities – noncurrent
444
—
Noncurrent portion of operating lease liabilities
2,766
3,173
Other noncurrent accrued liabilities
696
1,208
Total noncurrent liabilities
345,787
289,063
Total liabilities
560,501
418,028
Commitments and contingencies
Stockholders’ equity:
Preferred stock, $0.01 par value, 25,000,000 shares authorized, none issued as of September 30, 2023 and December 31, 2022
—
—
Common stock, $0.01 par value, 700,000,000 shares authorized, 9,319,177 and 13,003,702 shares issued and outstanding as of September 30, 2023 and December 31, 2022, respectively
93
130
Additional paid-in capital
746,898
966,058
Accumulated deficit
(162,418
)
(163,556
)
Accumulated other comprehensive income
13,499
16,549
Total stockholders’ equity
598,072
819,181
Total liabilities and stockholders’ equity
$
1,158,573
$
1,237,209
CONDENSED CONSOLIDATED STATEMENTS OF CASH FLOWS (Unaudited) (in thousands)
Nine Months Ended
September 30, 2023
September 30, 2022
Cash flows from operating activities:
Net income
$
16,077
$
224,743
Adjustments to reconcile net income to net cash provided by operating activities:
Depreciation
34,577
35,513
Noncash operating lease expense
17,890
21,083
Amortization of deferred drydocking costs
10,458
9,728
Amortization of debt discount and debt issuance costs
1,958
1,627
Loss on debt extinguishment
—
4,173
Impairment of operating lease right-of-use assets
722
—
Gain on sale of vessels
(19,731
)
(9,336
)
Unrealized loss/(gain) on derivative instruments, net
437
(8,517
)
Stock-based compensation expense
5,680
4,542
Drydocking expenditures
(10,562
)
(18,527
)
Changes in operating assets and liabilities:
Accounts payable
1,381
650
Accounts receivable
7,707
(5,098
)
Accrued interest
(969
)
(1,241
)
Inventories
1,199
(8,622
)
Operating lease liabilities current and noncurrent
(19,570
)
(21,076
)
Collateral on derivatives
(3,471
)
13,881
Fair value of derivatives, other current and noncurrent assets
(141
)
(183
)
Other accrued liabilities
(4,907
)
(2,332
)
Prepaid expenses
(1,301
)
(1,223
)
Unearned charter hire revenue
(1,469
)
2,706
Net cash provided by operating activities
35,965
242,491
Cash flows from investing activities:
Purchase of vessels and vessel improvements
(81,802
)
(781
)
Advances for vessel purchases
—
(4,125
)
Purchase of BWTS
(2,142
)
(5,695
)
Proceeds from hull and machinery insurance claims
174
—
Net proceeds from sale of vessels
56,609
14,944
Purchase of other fixed assets
(670
)
(253
)
Net cash (used in)/provided by investing activities
(27,831
)
4,090
Cash flows from financing activities:
Proceeds from Revolving Facility, net of debt issuance costs – Global Ultraco Debt Facility
123,361
—
Proceeds from Term Facility, net of debt issuance costs – Global Ultraco Debt Facility
73,125
—
Repayment of Term Facility – Global Ultraco Debt Facility
(37,350
)
(37,350
)
Repurchase of Common Stock and associated fees – related party
(222,688
)
—
Repurchase of Convertible Bond Debt
—
(14,188
)
Dividends paid
(15,790
)
(81,577
)
Debt issuance costs paid to lenders – Original Global Ultraco Debt Facility
—
(18
)
Cash paid for taxes related to net share settlement of equity awards
(1,989
)
(2,351
)
Other financing costs paid
(103
)
—
Cash received from exercise of stock options
—
85
Proceeds from equity offerings, net of issuance costs
—
201
Net cash used in financing activities
(81,434
)
(135,198
)
Net (decrease)/increase in cash, cash equivalents and restricted cash
(73,300
)
111,383
Cash, cash equivalents and restricted cash at beginning of period
189,754
86,222
Cash, cash equivalents and restricted cash at end of period
$
116,454
$
197,605
Cash paid for interest
$
22,064
$
12,861
Supplemental Information – Non-GAAP Financial Measures
This release includes various financial measures that are non-GAAP financial measures as defined under the rules of the Securities and Exchange Commission (“SEC”). We believe these measures provide important supplemental information to investors to use in evaluating ongoing operating results. We use these measures, together with accounting principles generally accepted in the United States (“GAAP” or “U.S. GAAP”) measures, for internal managerial purposes and as a means to evaluate period-to-period comparisons. However, we do not, and you should not, rely on non-GAAP financial measures alone as measures of our performance. We believe that non-GAAP financial measures reflect an additional way of viewing aspects of our operations, that when taken together with GAAP results and the reconciliations to corresponding GAAP financial measures that we also provide and provide a more complete understanding of factors and trends affecting our business. We strongly encourage you to review all of our financial statements and publicly-filed reports in their entirety and to not solely rely on any single non-GAAP financial measure.
Because non-GAAP financial measures are not standardized, it may not be possible to compare these financial measures with other companies’ non-GAAP financial measures, even if they have similar names.
Non-GAAP Financial Measures
Adjusted net (loss)/income and Basic and Diluted adjusted net (loss)/income per share
Adjusted net (loss)/income and Basic and Diluted adjusted net (loss)/income per share represent Net (loss)/income and Basic and Diluted net (loss)/income per share, respectively, as adjusted to exclude unrealized gains and losses on FFAs and bunker swaps, gains and losses on debt extinguishment, and impairment of operating lease right-of-use assets. The Company utilizes derivative instruments such as FFAs and bunker swaps to partially hedge against its underlying long physical position in ships (as represented by owned and third-party chartered-in vessels). As the Company does not apply hedge accounting to these derivative instruments, unrealized mark-to-market gains and losses on forward hedge positions impact current quarter results, causing timing mismatches in the Condensed Consolidated Statements of Operations. Additionally, we believe that gains and losses on debt extinguishment and impairment of operating lease right-of-use assets are not representative of our normal business operations. We believe that Adjusted net (loss)/income and Adjusted net (loss)/income per share are more useful to analysts and investors in comparing the results of operations and operational trends between periods and relative to other peer companies in our industry. Our Adjusted net (loss)/income should not be considered an alternative to net income/(loss), operating income/(loss), cash flows provided by/(used in) operating activities or any other measure of financial performance or liquidity presented in accordance with U.S. GAAP. As noted above, our Adjusted net (loss)/income and Adjusted net (loss)/income per share may not be comparable to similarly titled measures of another company because all companies may not calculate Adjusted net (loss)/income or Adjusted net (loss)/income per share in the same manner.
The following table presents the reconciliation of our Net (loss)/income to Adjusted net (loss)/income:
Reconciliation of GAAP Net (loss)/income to Adjusted net (loss)/income (in thousands, except share and per share data)
Three Months Ended
Nine Months Ended
September 30, 2023
September 30, 2022
September 30, 2023
September 30, 2022
Net (loss)/income
$
(5,151
)
$
77,217
$
16,077
$
224,743
Adjustments to reconcile net (loss)/income to adjusted net (loss)/income:
Unrealized loss/(gain) on FFAs and bunker swaps, net
2,222
(7,124
)
437
(8,517
)
Impairment of operating lease right-of-use assets
—
—
722
—
Loss on debt extinguishment
—
4,173
—
4,173
Adjusted net (loss)/income
$
(2,929
)
$
74,266
$
17,236
$
220,399
Weighted average shares outstanding:
Basic
9,313,051
12,993,450
11,686,433
12,985,329
Diluted (1)
9,313,051
16,201,852
15,057,652
16,219,264
Per share amounts:
Basic adjusted net (loss)/income
$
(0.31
)
$
5.72
$
1.47
$
16.97
Diluted adjusted net (loss)/income
$
(0.31
)
$
4.58
$
1.44
$
13.59
(1
)
Diluted weighted average shares outstanding for the three and nine months ended September 30, 2023 and 2022 includes dilutive potential common shares related to the Convertible Bond Debt based on the if-converted method and potential common shares related to stock awards and options based on the treasury stock method, unless to do so would have been anti-dilutive to Diluted adjusted net (loss)/income per share.
EBITDA and Adjusted EBITDA
We define EBITDA as Net (loss)/income under GAAP adjusted for interest, income taxes and depreciation and amortization.
Adjusted EBITDA is a non-GAAP financial measure that is used as a supplemental financial measure by our management and by external users of our financial statements, such as investors, commercial banks and others, to assess our operating performance as compared to that of other peer companies in our industry, without regard to financing methods, capital structure or historical costs basis. Our Adjusted EBITDA should not be considered an alternative to net income/(loss), operating income/(loss), cash flows provided by/(used in) operating activities or any other measure of financial performance or liquidity presented in accordance with U.S. GAAP. Our Adjusted EBITDA may not be comparable to similarly titled measures of another company because all companies may not calculate Adjusted EBITDA in the same manner. Adjusted EBITDA represents EBITDA adjusted to exclude certain non-cash, one-time and other items that the Company believes are not indicative of the ongoing performance of its core operations such as vessel impairment, gains and losses on sale of vessels, impairment of operating lease right-of-use assets, unrealized gains and losses on FFAs and bunker swaps, gains and losses on debt extinguishment and stock-based compensation expense.
The following table presents a reconciliation of our Net (loss)/income to EBITDA and Adjusted EBITDA:
Reconciliation of GAAP Net (loss)/income to EBITDA and Adjusted EBITDA (in thousands)
Three Months Ended
Nine Months Ended
September 30, 2023
September 30, 2022
September 30, 2023
September 30, 2022
Net (loss)/income
$
(5,151
)
$
77,217
$
16,077
$
224,743
Adjustments to reconcile net (loss)/income to EBITDA:
Interest expense
7,714
4,236
16,005
13,021
Interest income
(1,488
)
(881
)
(5,139
)
(1,100
)
Income taxes
—
—
—
—
EBIT
1,075
80,572
26,943
236,664
Depreciation and amortization
15,472
15,407
45,035
45,241
EBITDA
16,547
95,979
71,978
281,905
Non-cash, one-time and other adjustments to EBITDA(1)
(963
)
(10,838
)
(12,892
)
(9,138
)
Adjusted EBITDA
$
15,584
$
85,141
$
59,086
$
272,767
(1
)
One-time and other adjustments to EBITDA for the three and nine months ended September 30, 2023 and 2022 includes gains on sale of vessels, net unrealized losses/(gains) on FFAs and bunker swaps, impairment of operating lease right-of-use assets, loss on debt extinguishment and stock-based compensation expense.
TCE revenue and TCE
Time charter equivalent revenue (“TCE revenue”) and time charter equivalent (“TCE”) are non-GAAP financial measures that are commonly used in the shipping industry primarily to compare daily earnings generated by vessels on time charters with daily earnings generated by vessels on voyage charters, because charter hire rates for vessels on voyage charters are generally not expressed in per-day amounts while charter hire rates for vessels on time charters generally are expressed in such amounts. The Company defines TCE revenue as revenues, net less voyage expenses and charter hire expenses, adjusted for realized gains and losses on FFAs and bunker swaps and defines TCE as TCE revenue divided by the number of owned available days. Owned available days is the number of our ownership days less the aggregate number of days that our vessels are off-hire due to vessel familiarization upon acquisition, repairs, vessel upgrades or special surveys. The shipping industry uses available days to measure the number of days in a period during which vessels should be capable of generating revenues. TCE provides additional meaningful information in conjunction with Revenues, net, the most directly comparable GAAP measure, because it assists Company management in making decisions regarding the deployment and use of its vessels and in evaluating their performance. Our TCE revenue and TCE should not be considered alternatives to net income/(loss), operating income/(loss), cash flows provided by/(used in) operating activities or any other measure of financial performance or liquidity presented in accordance with U.S. GAAP. Our TCE revenue and TCE may not be comparable to similarly titled measures of another company because all companies may not calculate TCE revenue and TCE in the same manner.
The following table presents the reconciliation of our Revenues, net to TCE:
Reconciliation of Revenues, net to TCE (in thousands, except for Owned available days and TCE)
Three Months Ended
Nine Months Ended
September 30, 2023
September 30, 2022
September 30, 2023
September 30, 2022
Revenues, net
$
82,606
$
185,313
$
289,210
$
568,406
Less:
Voyage expenses
(23,791
)
(40,792
)
(82,737
)
(120,710
)
Charter hire expenses
(6,868
)
(19,772
)
(31,014
)
(63,768
)
Realized gain on FFAs and bunker swaps, net
2,118
4,169
2,755
4,764
TCE revenue
$
54,065
$
128,918
$
178,214
$
388,692
Owned available days
4,708
4,588
13,791
13,599
TCE
$
11,482
$
28,099
$
12,922
$
28,582
Adjusted vessel operating expenses and Adjusted DVOE
Adjusted vessel operating expenses and Adjusted DVOE are non-GAAP financial measures that are used as supplemental financial measures by our management and by external users of our financial statements to assess our operating performance as compared to that of other peer companies in our industry. The Company defines Adjusted vessel operating expenses as vessel operating expenses presented in accordance with U.S. GAAP, adjusted to exclude one-time, non-recurring expenses related to vessel acquisitions, charges relating to a change in the crewing manager on some of our vessels and discretionary spending associated with hull and hold upgrades and defines Adjusted DVOE as Adjusted vessel operating expenses divided by the number of ownership days. Ownership days is the aggregate number of days in a period during which each vessel in our fleet has been owned by us. Adjusted vessel operating expenses and Adjusted DVOE provide additional meaningful information in conjunction with Vessel operating expenses, the most directly comparable GAAP measure. Our Adjusted vessel operating expenses and Adjusted DVOE should not be considered alternatives to net income/(loss), operating income/(loss), cash flows provided by/(used in) operating activities or any other measure of financial performance or liquidity presented in accordance with U.S. GAAP. Our Adjusted vessel operating expenses and Adjusted DVOE may not be comparable to similarly titled measures of another company because all companies may not calculate Adjusted vessel operating expenses and Adjusted DVOE in the same manner.
The following table presents the reconciliation of our Vessel operating expenses to Adjusted vessel operating expenses and Adjusted DVOE:
Reconciliation of GAAP Vessel operating expenses to Adjusted vessel operating expenses and Adjusted DVOE (in thousands, except for Ownership days and Adjusted DVOE data)
Three Months Ended
Nine Months Ended
September 30, 2023
September 30, 2022
September 30, 2023
September 30, 2022
Vessel operating expenses
$
28,822
$
33,091
$
91,077
$
88,213
Less:
Adjustments to vessel operating expenses(1):
(347
)
(1,371
)
(3,548
)
(1,796
)
Adjusted vessel operating expenses
$
28,475
$
31,720
$
87,529
$
86,417
Ownership days
4,808
4,831
14,425
14,424
Adjusted DVOE
$
5,922
$
6,566
$
6,068
$
5,991
(1
)
Adjustments to vessel operating expenses includes one-time, non-recurring expenses related to vessel acquisitions, charges relating to a change in the crewing manager on some of our vessels and discretionary spending associated with hull and hold upgrades.
Glossary of Terms
Chartered-in days: We define chartered-in days as the aggregate number of days in a period during which we charter-in vessels under operating leases. The Company charters-in vessels on a long-term and short-term basis.
Owned available days: We define owned available days as the number of ownership days less the aggregate number of days that our owned vessels are off-hire due to vessel familiarization upon acquisition, repairs, vessel upgrades or special surveys and other reasons which prevent the vessel from performing under a charter party in a period. The shipping industry uses owned available days to measure the number of days in a period during which owned vessels should be capable of generating revenues.
Ownership days: We define ownership days as the aggregate number of days in a period during which each vessel in our fleet has been owned by us. Ownership days are an indicator of the size of our fleet over a period and affect both the amount of revenues and the amount of expenses that we record during a period.
Definitions of Capitalized Terms
Convertible Bond Debt: Convertible Bond Debt refers to 5.0% Convertible Senior Notes due 2024 issued by the Company on July 29, 2019 that will mature on August 1, 2024.
Global Ultraco Debt Facility: Global Ultraco Debt Facility refers to the senior secured credit facility entered into by Eagle Bulk Ultraco LLC (“Eagle Ultraco”), a wholly-owned subsidiary of the Company, along with certain of its vessel-owning subsidiaries as guarantors, with the lenders party thereto (the “Lenders”), Credit Agricole Corporate and Investment Bank (“Credit Agricole”) as security trustee, structurer, sustainability coordinator and facility agent. The Global Ultraco Debt Facility provides for an aggregate principal amount of $485.3 million, which consists of (i) a term loan facility in an aggregate principal amount of $300.3 million (the “Term Facility”) and (ii) a revolving credit facility in an aggregate principal amount of $185.0 million (the “Revolving Facility”). The Global Ultraco Debt Facility is secured by 52 of the Company’s vessels. As of September 30, 2023, $54.6 million remains undrawn under the Revolving Facility.
Conference Call Information
As previously announced, members of Eagle’s senior management team will host a teleconference and webcast at 8:00 a.m. ET on Friday, November 3, 2023, to discuss the third quarter results.
A live webcast of the call will be available on the Investor Relations page of the Company’s website at ir.eagleships.com. To access the call by phone, please register at https://register.vevent.com/register/BIee839edd63884046b37812fb660d9ebb and you will be provided with dial-in details. A replay of the webcast will be available on the Investor Relations page of the Company’s website.
About Eagle Bulk Shipping Inc.
The Company is a U.S.-based, fully integrated shipowner-operator, providing global transportation solutions to a diverse group of customers including miners, producers, traders and end users. Headquartered in Stamford, Connecticut, with offices in Singapore and Copenhagen, Eagle focuses exclusively on the versatile midsize drybulk vessel segment and owns one of the largest fleets of Supramax/Ultramax vessels in the world. The Company performs all management services in-house (strategic, commercial, operational, technical, and administrative) and employs an active management approach to fleet trading with the objective of optimizing revenue performance and maximizing earnings on a risk-managed basis. For further information, please visit our website: www.eagleships.com.
Website Information
We intend to use our website, www.eagleships.com, as a means of disclosing material non-public information and for complying with our disclosure obligations under Regulation FD. Such disclosures will be included in our website’s Investor Relations section. Accordingly, investors should monitor the Investor Relations portion of our website, in addition to following our press releases, filings with the SEC, public conference calls, and webcasts. To subscribe to our e-mail alert service, please click the “Investor Alerts” link in the Investor Relations section of our website and submit your email address. The information contained in, or that may be accessed through, our website is not incorporated by reference into or a part of this document or any other report or document we file with or furnish to the SEC, and any references to our website are intended to be inactive textual references only.
Disclaimer: Forward-Looking Statements
Matters discussed in this release may constitute forward-looking statements that may be deemed to be “forward-looking statements” within the meaning of Section 27A of the Securities Act of 1933, as amended, Section 21E of the Securities Exchange Act of 1934, as amended, and the Private Securities Litigation Reform Act of 1995, and are intended to be covered by the safe harbor provided for under these sections. These statements may include words such as “believe,” “estimate,” “project,” “intend,” “expect,” “plan,” “anticipate,” and similar expressions in connection with any discussion of the timing or nature of future operating or financial performance or other events. Forward-looking statements in this release reflect management’s current expectations and observations with respect to future events and financial performance. Where we express an expectation or belief as to future events or results, including future plans with respect to financial performance, the payment of dividends and/or repurchase of shares, or future actions of holders of the Convertible Bond Debt, including whether or not to elect to convert any portion of the Convertible Bond Debt prior to its maturity date, such expectation or belief is expressed in good faith and believed to have a reasonable basis. However, our forward-looking statements are subject to risks, uncertainties, and other factors, which could cause actual results to differ materially from future results expressed, projected, or implied by those forward-looking statements.
Where we express an expectation or belief as to future events or results, such expectation or belief is expressed in good faith and believed to have a reasonable basis. However, our forward-looking statements are subject to risks, uncertainties, and other factors, which could cause actual results to differ materially from future results expressed, projected or implied by those forward-looking statements. The principal factors that affect our financial position, results of operations and cash flows include market freight rates, which fluctuate based on various economic and market conditions, periods of charter hire, vessel operating expenses and voyage costs, which are incurred primarily in U.S. dollars, depreciation expenses, which are a function of the purchase price of our vessels and our vessels’ estimated useful lives and scrap value, general and administrative expenses, and financing costs related to our indebtedness. The accuracy of the Company’s assumptions, expectations, beliefs and projections depends on events or conditions that change over time and are thus susceptible to change based on actual experience, new developments and known and unknown risks. The Company gives no assurance that the forward-looking statements will prove to be correct, does not undertake any duty to update them and disclaims any intent or obligation to update publicly any forward-looking statements, whether as a result of new information, future events or otherwise, except as may be required under applicable securities laws. Our actual results may differ materially from those anticipated in these forward-looking statements as a result of certain factors which could include the following: (i) volatility of freight rates driven by changes in demand for seaborne transportation of drybulk commodities and in supply of drybulk shipping capacity; (ii) changes in drybulk carrier capacity driven by levels of newbuilding orders, scrapping rates or fleet utilization; (iii) changes in rules and regulations applicable to the drybulk industry, including, without limitation, regulations of the International Maritime Organization and the European Union (the “EU”), requirements of the Environmental Protection Agency and other governmental and quasi-governmental agencies; (iv) changes in U.S., United Kingdom, United Nations and EU economic sanctions and trade embargo laws and regulations as well as equivalent economic sanctions laws of other relevant jurisdictions; (v) actions taken by regulatory authorities including, without limitation, the U.S. Treasury Department’s Office of Foreign Assets Control (“OFAC”); (vi) changes in the typical seasonal variations in drybulk freight rates; (vii) changes in national and international economic and political conditions including, without limitation, the current conflicts between Russia and Ukraine and Israel and Hamas, the current economic and political environment in China and the environment in historically high-risk geographic areas such as the South China Sea, the Indian Ocean, the Gulf of Guinea and the Gulf of Aden; (viii) changes in the condition of the Company’s vessels or applicable maintenance or regulatory standards (which may affect, among other things, our anticipated drydocking costs); (ix) the duration and impact of the novel coronavirus (“COVID-19”) pandemic and measures implemented by governments of various countries in response to the COVID-19 pandemic; (x) volatility of the cost of fuel; (xi) volatility of costs of labor and materials needed to operate our business due to inflation; (xii) any legal proceedings which we may be involved from time to time; and (xiii) other factors listed from time to time in our filings with the Securities and Exchange Commission (the “SEC”).
We have based these statements on assumptions and analyses formed by applying our experience and perception of historical trends, current conditions, expected future developments and other factors we believe are appropriate in the circumstances. The Company’s future results may be impacted by adverse economic conditions, such as inflation, deflation, or lack of liquidity in the capital markets, that may negatively affect it or parties with whom it does business. Should one or more of the foregoing risks or uncertainties materialize in a way that negatively impacts the Company, or should the Company’s underlying assumptions prove incorrect, the Company’s actual results may vary materially from those anticipated in its forward-looking statements, and its business, financial condition and results of operations could be materially and adversely affected. Risks and uncertainties are further described in our Annual Report on Form 10-K for the year ended December 31, 2022, as filed with the SEC on March 10, 2023, as updated by those risks described in Part II, Item 1A of our Quarterly Report on Form 10-Q for the three months ended June 30, 2023, filed with the SEC on August 4, 2023.
CONTACT
Company Contact: Constantine Tsoutsoplides Chief Financial Officer Eagle Bulk Shipping Inc. Tel. +1 203-276-8100 Email: investor@eagleships.com
STAMFORD, Conn., Sept. 28, 2023 (GLOBE NEWSWIRE) — Eagle Bulk Shipping Inc. (NYSE: EGLE) (“Eagle Bulk”, “Eagle”, or the “Company”), one of the world’s largest owner-operators within the midsize drybulk vessel segment, announced today that it will report its financial results for the third quarter ending September 30, 2023, after the close of stock market trading on November 2, 2023. Members of Eagle’s senior management team will host a call at 8:00 a.m. ET on Friday, November 3, 2023 in order to discuss company results and provide an update on market fundamentals.
A live webcast of the call will be available on the Investor Relations page of the Company’s website at ir.eagleships.com. To access the call by phone, please register at https://register.vevent.com/register/BIee839edd63884046b37812fb660d9ebb and you will be provided with dial-in details. A replay of the webcast will be available on the Investor Relations page of Eagle’s website.
About Eagle Bulk Shipping Inc.
Eagle Bulk Shipping Inc. (“Eagle” or the “Company”) is a US-based, fully integrated shipowner-operator providing global transportation solutions to a diverse group of customers including miners, producers, traders, and end users. Headquartered in Stamford, Connecticut, with offices in Singapore and Copenhagen, Eagle focuses exclusively on the versatile midsize drybulk vessel segment and owns one of the largest fleets of Supramax / Ultramax vessels in the world. The Company performs all management services in-house (including strategic, commercial, operational, technical, and administrative) and employs an active-management approach to fleet trading with the objective of optimizing revenue performance and maximizing earnings on a risk-managed basis. For further information, please visit our website: www.eagleships.com.
Shares of FedEx jumped over 5% on Thursday after the shipping giant reported better-than-expected fiscal first quarter results. The stock rally comes amid a broader market selloff, with investors cheering FedEx’s improved profitability and outlook.
FedEx earned $4.55 per share last quarter, handily beating analyst forecasts of $3.70. Though revenue declined 6.5% year-over-year to $21.7 billion, the company boosted its operating margin to 7.3%, surpassing expectations.
The strong quarter was driven by effective cost-cutting under CEO Raj Subramaniam and higher shipping volumes as key rivals dealt with challenges. FedEx gained U.S. market share in recent months which it expects to retain.
Management raised full-year EPS guidance to a range of $17.00 to $18.50, up from prior outlook of $16.50 to $18.50. The company also announced new demand surcharges for the holiday peak season and a January rate increase.
FedEx continued benefiting from its DRIVE cost savings program which seeks $1.8 billion in total reductions. Steps like reducing flights, realigning staff and shifting to one daily delivery wave boosted efficiency.
The Ground segment was a standout with a 59% jump in operating income as volumes improved. The Express unit grew operating income 18% despite lower revenue. But the Freight division saw income drop 26% on reduced shipments.
The outperformance comes as labor negotiations weighed on service levels at rival UPS. UPS disclosed it lost 1 million packages daily to other carriers, which FedEx said it captured 400,000 of. The bankruptcy of trucking company Yellow also benefited FedEx.
Demand for logistics and shipping services remains resilient despite economic uncertainty. And challenges at competitors created an opening for FedEx to flex its network strength and snatch market share. It expects to maintain most new volumes.
The results suggest FedEx has turned a corner after recent struggles with costs and service issues. The company’s turnaround plan is clearly bearing fruit. And investors have taken notice, bidding the stock price higher after the earnings beat.
FedEx shares have now rebounded nearly 20% from 52-week lows hit in June. The stock remains down 25% year-to-date amid broader market volatility. But it has outpaced the S&P 500 recently.
Thursday’s post-earnings pop provides encouragement that FedEx may sustain its momentum if execution remains solid. But the company still faces macro uncertainty and must continue improving productivity.
The holiday quarter is crucial for delivery firms like FedEx. The company aims to avoid last year’s service shortfalls. Management expressed confidence its initiatives will enable strong peak season performance.
While risks remain, FedEx has proactively adapted its network for holiday demand spikes. And it should reap continued benefits from rival struggles if recent market share gains stick.
Ongoing cost discipline also remains key. As higher rates kick in, boosting revenue, FedEx must maintain focus on trimming unnecessary expenses. Investors want to see margins continue expanding.
The quarterly beat suggests the shipping titan is making strides in its turnaround bid under new leadership. If FedEx sustains stronger operational execution, its stock price could continue recovering lost ground.
But the company must keep innovating and finding efficiency gains in the rapidly evolving logistics arena. Satisfying customers and shareholders means continually improving services and profitability, even in a weakened economic climate.
GXO Logistics’ $181 million acquisition of ecommerce fulfillment provider PFSweb signals the immense growth runway ahead for logistics providers as online retail continues rapid expansion.
The deal provides GXO greater exposure to high-growth ecommerce categories like health, beauty, luxury goods, apparel and more where PFSweb has cultivated specialized omnichannel capabilities. GXO also gains PFSweb’s proprietary order management systems, fraud protection, customer care services and distribution technologies that will strengthen its end-to-end fulfillment offerings.
PFSweb serves over 100 prominent consumer brands, including L’Oreal, Pandora, Kendra Scott and others through its facilities across North America, the UK and Belgium. This expands GXO’s relationships in categories experiencing online growth thanks to shifting consumer preferences.
The transformational rise of ecommerce is reshaping logistics networks and fueling acquisitions across fulfillment, last-mile delivery and automation. According to Statista, global ecommerce sales are projected to reach $5.4 trillion in 2023, highlighting the seismic shift to online shopping.
As volumes accelerate, logistics providers aim to capture demand through robust delivery solutions tailor-made for ecommerce. Fulfillment and last-mile acquisitions have increased as giants like GXO, XPO Logistics, UPS and FedEx move to capitalize on the boom in digital orders.
GXO is making sizable investments in automation, AI and optimizing warehouse flows to cement itself as the leader in orchestrating complex ecommerce fulfillment. The PFSweb deal aligns with its focus on allocating capital to high-growth, high-return logistics verticals.
For GXO, the acquisition deepens its competitive moat and brand relationships in strategically important retail categories. PFSweb’s expertise in direct-to-consumer support across the customer journey helps expand GXO’s proposition.
The blockbuster deal also gives GXO access to PFSweb’s 21-year track record successfully servicing and retaining top tier brands. PFSweb has developed a strong reputation for customized branded experiences and excellence in omnichannel execution.
GXO’s chief executive Malcolm Wilson emphasized how PFSweb complements GXO with brand relationships in rapidly expanding ecommerce verticals. The combination cross-sells more comprehensive logistics solutions to each company’s customer base.
For investors, GXO’s move spotlights the immense potential for logistics providers to capitalize on the secular shift online. Ecommerce has fundamentally transformed fulfillment, shipping and reverse logistics processes, with orders that are more variable, faster and customized compared to store replenishment.
Logistics companies essential to ecommerce are primed for significant growth as this trend accelerates. GXO, XPO, UPS, FedEx and other leaders stand to benefit from the structural shift given their networks, expertise and new technology investments.
Already PFSweb’s stock price has jumped nearly 50% following the acquisition news, underscoring Wall Street’s positive perspective. With ecommerce projected to continue double-digit expansion, the logistics sector remains firmly positioned to thrive into the future.
Eagle Bulk Shipping Inc. (“Eagle”) is a US-based drybulk owner-operator focused on the Supramax/Ultramax mid-size asset class, which ranges from 50,000 and 65,000 deadweight tons in size; these vessels are equipped with onboard cranes allowing for the self-loading and unloading of cargoes, a feature which distinguishes them from the larger classes of drybulk vessels and provides for greatly enhanced flexibility and versatility- both with respect to cargo diversity and port accessibility. The Company transports a broad range of major and minor bulk cargoes around the world, including coal, grain, ore, pet coke, cement, and fertilizer. Eagle operates out of three offices, Stamford (headquarters), Singapore, and Hamburg, and performs all aspects of vessel management in-house including: commercial, operational, technical, and strategic.
Michael Heim, Senior Vice President, Equity Research Analyst, Energy & Transportation, Noble Capital Markets, Inc.
Refer to the full report for the price target, fundamental analysis, and rating.
Estimates adjusted downward to reflect shipping weakness. We are lowering our assumed shipping rates in response to shipping rate declines and company guidance. Although EGLE had locked in 65% of its available shipping days at a rate near $16,000/day, the rate it received for the other shipping days was closer to $10,000/day. As a result, the average TCE day rate for the fleet of 52.8 vessels was closer to $14,000/day.
Lower shipping rates and thus revenues are partially offset by lower vessel operating costs. Operating expense is running between $6,300-$6,600 per shipping day, a decline from the first quarter. The lower costs lessen the impact of lower revenues in our models.
Equity Research is available at no cost to Registered users of Channelchek. Not a Member? Click ‘Join’ to join the Channelchek Community. There is no cost to register, and we never collect credit card information.
This Research is provided by Noble Capital Markets, Inc., a FINRA and S.E.C. registered broker-dealer (B/D).
*Analyst certification and important disclosures included in the full report. NOTE: investment decisions should not be based upon the content of this research summary. Proper due diligence is required before making any investment decision.