FORT WAYNE, Ind., Aug. 09, 2023 (GLOBE NEWSWIRE) — Vera Bradley, Inc. (Nasdaq: VRA) (the “Company”) today announced that it plans to report results for the second quarter ended July 29, 2023 at 8:00 a.m. Eastern Time on Wednesday, August 30, 2023.
The Company will host a conference call to discuss its financial results at 9:30 a.m. Eastern Time that same day. A live webcast of the conference call will be available on the Investor Relations section of the Company’s website, www.verabradley.com. Alternatively, interested parties may dial into the call at (888) 394-8218, and enter the access code 1990839. A replay will be available shortly after the conclusion of the call and remain available through September 13, 2023. To access the recording, listeners should dial (844) 512-2921, and enter the access code 1990839.
ABOUT VERA BRADLEY, INC.
Vera Bradley, Inc. operates two unique lifestyle brands – Vera Bradley and Pura Vida. Vera Bradley and Pura Vida are complementary businesses, both with devoted, emotionally connected, and multi-generational female customer bases; alignment as causal, comfortable, affordable, and fun brands; positioning as “gifting” and socially-connected brands; strong, entrepreneurial cultures; a keen focus on community, charity, and social consciousness; multi-channel distribution strategies; and talented leadership teams aligned and committed to the long-term success of their brands.
Vera Bradley, based in Fort Wayne, Indiana, is a leading designer of women’s handbags, luggage and other travel items, fashion and home accessories, and unique gifts. Founded in 1982 by friends Barbara Bradley Baekgaard and Patricia R. Miller, the brand is known for its innovative designs, iconic patterns, and brilliant colors that inspire and connect women unlike any other brand in the global marketplace.
In July 2019, Vera Bradley, Inc. acquired a 75% interest in Creative Genius, Inc., which also operates under the name Pura Vida Bracelets (“Pura Vida”). Pura Vida, based in La Jolla, California, is a digitally native, highly engaging lifestyle brand founded in 2010 by friends Paul Goodman and Griffin Thall. Pura Vida has a differentiated and expanding offering of bracelets, jewelry, and other lifestyle accessories. The Company acquired the remaining 25% of Pura Vida in January 2023.
President and Chief Operating Officer Thomas Tedford Appointed Chief Executive Officer Effective October 1, 2023; Boris Elisman to Continue as Executive Chairman Before Retiring in the first half of 2024
LAKE ZURICH, Ill,–(BUSINESS WIRE)– ACCO Brands Corporation (NYSE: ACCO) (the “Company” or “ACCO Brands”), one of the world’s largest suppliers of select categories of branded academic, consumer and business products, today announced its Board of Directors has appointed the Company’s President and Chief Operating Officer, Thomas Tedford, as CEO effective October 1, 2023. Mr. Tedford has also been elected a member of the board effective that date. Mr. Tedford will succeed ACCO Brands current CEO, Boris Elisman, who will continue as Executive Chairman until his retirement in the first half of 2024. He has notified the Board that he will not stand for reelection at the 2024 stockholders’ meeting.
“The appointment of Tom as ACCO Brands next CEO is part of a succession plan that Boris and the Board have been preparing over the past few years,” stated Lead Independent Director, Thomas Kroeger. “We have worked closely with Tom and have full confidence in his commitment to creating value for our shareholders. He brings deep knowledge of our industry, our customers, the overall Company, and its operating segments to his new role. Tom has worked closely with Boris and the Board in developing and executing on the Company’s strategic transformation and will continue to do so, assuring a smooth and seamless transition of leadership and positioning us for profitable growth.”
“On behalf of everyone at ACCO Brands, we would like to thank Boris for his exemplary leadership and dedicated service as CEO. Boris’s innumerable contributions during his 18-year tenure, the last 10 leading the Company as CEO, have successfully expanded the growth opportunities for the Company,” Mr. Kroger concluded.
Mr. Elisman said, “During my tenure at ACCO Brands, the Company and the industry have undergone significant changes and I am proud of our teams’ accomplishments during this period. Having worked closely with Tom for many years, I know the company is in great hands to continue to progress and accelerate profitable growth. It has been my privilege to lead this great company, and I look forward to continuing to serve as Executive Chairman to ensure a smooth transition.”
Mr. Tedford commented, “It is an honor to have the opportunity to lead ACCO Brands and our talented team of dedicated employees as we build upon the current momentum in our business. Boris has been a great mentor and a tremendous leader. I have worked with him for more than a decade and appreciate his leadership and bold actions to transform ACCO Brands. I look forward to continuing to work closely with Boris to complete this leadership transition.”
“I am grateful for the support of our Board of Directors and am excited to work with them and our executive leadership team. I believe there are immense opportunities to enhance our leadership position in key categories, grow through share gains and new innovative product solutions, optimize our supply chain, and improve our margin profile as we remain focused on delivering shareholder value and customer satisfaction. Near-term we are committed to prioritizing our free cash flow towards supporting our dividend and debt reduction,” added Mr. Tedford.
Thomas Tedford Bio
Mr. Tedford joined ACCO Brands in 2010 and was named President and Chief Operating Officer in 2021. From 2011 to 2021, Mr. Tedford served first as Executive Vice President and President of ACCO Brands Americas ultimately becoming Executive Vice President and President, ACCO Brands, North America. During his tenure, he successfully led the operational, cultural and leadership integrations of key strategic acquisitions, the introduction of new products and the development of new markets. Prior to joining ACCO Brands, Mr. Tedford had 15 years of progressive sales, sales leadership, marketing, operational and executive management experience, operating in highly competitive and demanding industries. Mr. Tedford has expertise addressing complex challenges, optimizing performance, developing growth strategies, innovating product solutions, and building high-performing teams.
About ACCO Brands Corporation
ACCO Brands, the Home of Great Brands Built by Great People, designs, manufactures and markets consumer and end-user products that help people work, learn, play, and thrive. Our widely recognized brands include AT-A-GLANCE®, Five Star®, Kensington®, Leitz®, Mead®, PowerA®, Swingline®, Tilibra® and many others. More information about ACCO Brands Corporation (NYSE: ACCO) can be found at www.accobrands.com.
Reported net sales of $494 million, with gross margin expanding 450 basis points
Operating income of $55 million, flat to prior year; adjusted operating income of $66 million grew 14% year over year
EPS of $0.27; adjusted EPS of $0.38, above Company’s outlook
Net operating cash outflow improved $59 million year to date driven by improved working capital management
Maintains full year 2023 adjusted EPS outlook of $1.08 to $1.12
Raises full year 2023 free cash flow outlook to at least $110 million
Lowered end of year consolidated leverage ratio outlook
August 08, 2023 04:00 PM Eastern Daylight Time
LAKE ZURICH, Ill.–(BUSINESS WIRE)–ACCO Brands Corporation (NYSE: ACCO) today announced its second quarter and first six-month results for the period ended June 30, 2023.
“Our top priority entering 2023 was to restore our margin profile, and I’m pleased to report that we have made great progress on that front in the first half. Second quarter and year-to-date gross margin expanded 450 and 360 basis points, respectively, due to greater traction from our pricing, productivity and restructuring initiatives. This has yielded much better than expected adjusted EPS. The higher operating profits experienced through the first six months give us confidence in our full year 2023 outlook for adjusted EPS and free cash flow. While we are pleased with the strong start of the year, we are more cautious on the second half demand environment. With improved working capital management, we are well positioned to end the year with a lower leverage ratio than previously expected. We remain committed to supporting our quarterly dividend and reducing debt with our strong cash flow” said Boris Elisman, Chairman and Chief Executive Officer of ACCO Brands.
“Our results reflect the resilience of our brands and the transformative actions undertaken to expand our product categories, broaden our geographic reach, bring innovative new consumer-centric products to market and streamline our cost structure. We remain confident that our strategy has us positioned to deliver sustainable organic growth as global economies improve,” concluded Mr. Elisman.
Second Quarter Results
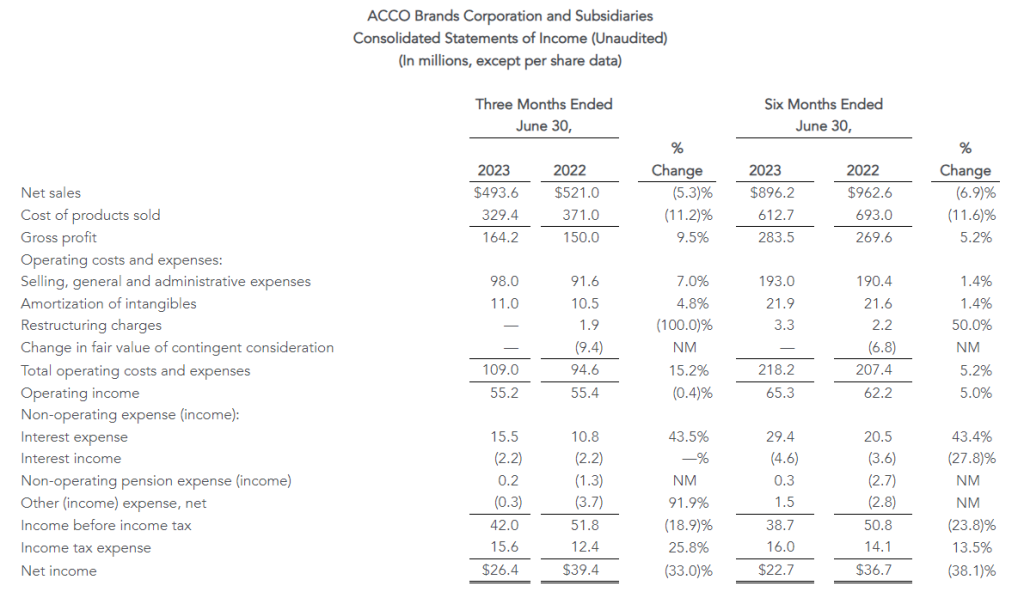
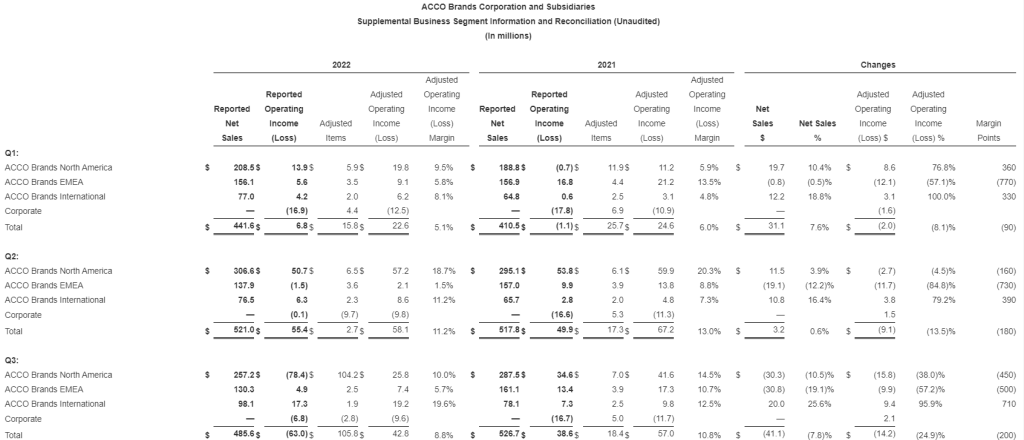
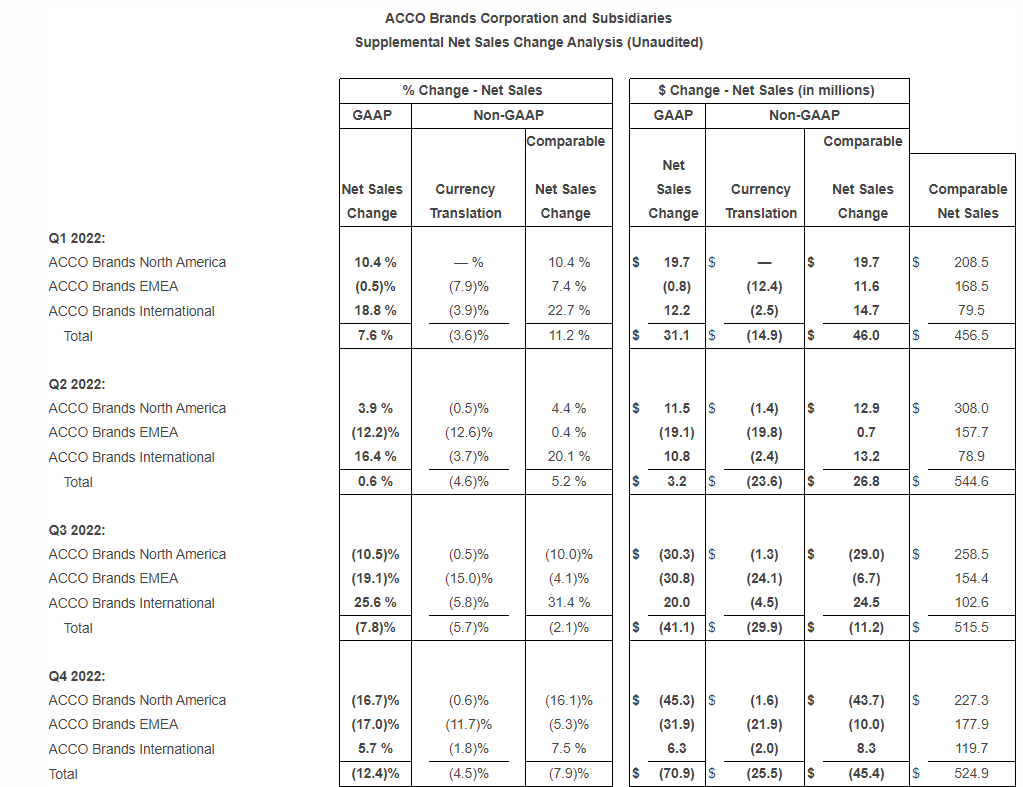
Net sales declined 5.3 percent to $493.6 million from $521.0 million in 2022. Adverse foreign exchange reduced sales by $0.8 million, or 0.2 percent. Comparable sales fell 5.1 percent. Both reported and comparable sales declines were due to reduced volume, reflecting a more challenging macroeconomic environment, especially in our EMEA segment, and weaker global sales of computer accessories.
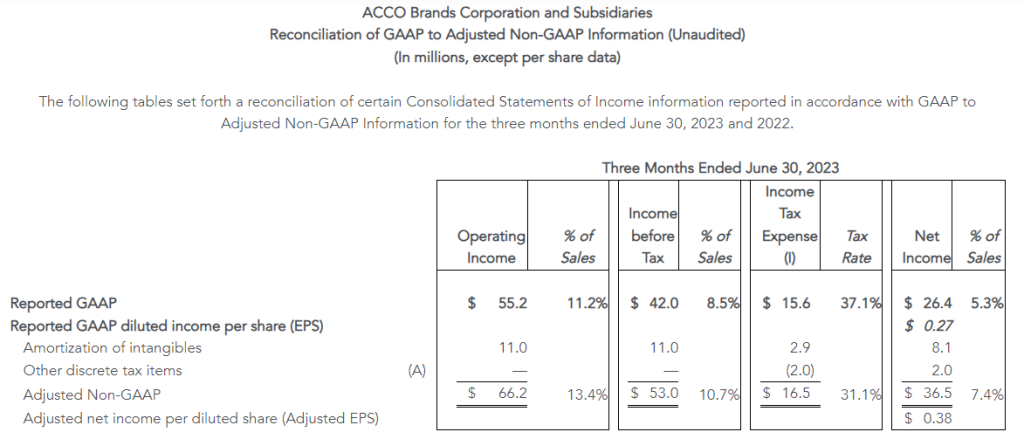
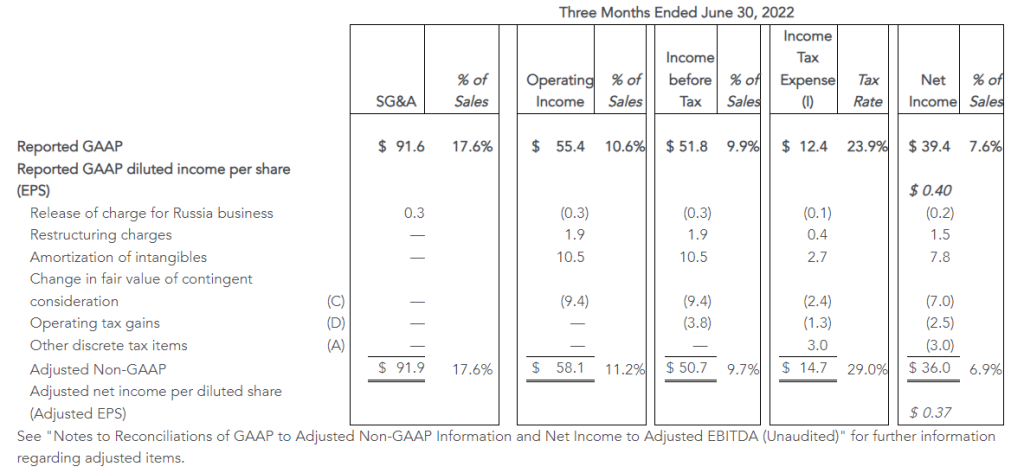
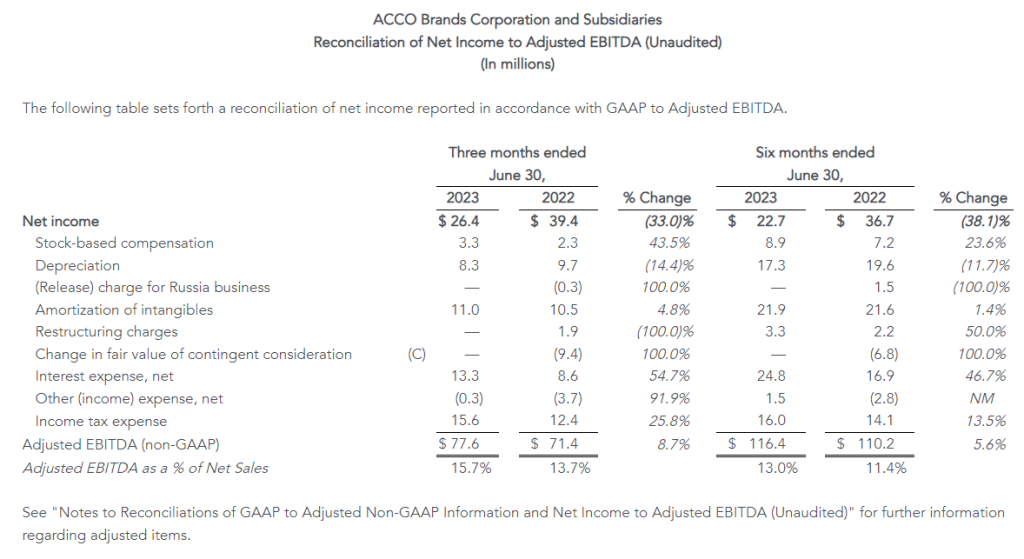
Operating income was $55.2 million versus $55.4 million in 2022. In 2022, operating income benefitted from income related to a change in the value of the PowerA contingent earnout of $9.4 million, partially offset by $1.9 million in restructuring charges. Adjusted operating income increased 14 percent to $66.2 million from $58.1 million in the prior year. This increase reflects improved gross margin from the effect of cumulative global pricing and cost reduction actions, partially offset by negative fixed cost leverage and higher SG&A expense primarily due to an increase in incentive compensation.
The Company reported net income of $26.4 million, or $0.27 per share, compared with prior year net income of $39.4 million, or $0.40 per share. Reported net income in 2023 reflects higher interest, tax and non-operating pension expenses. Reported net income in 2022 benefited from the items noted above in operating income. Adjusted net income was $36.5 million, or $0.38 per share, compared with $36.0 million, or $0.37 per share in 2022. Adjusted net income reflects the increase in adjusted operating income, partially offset by higher interest and non-operating pension expenses.
Business Segment Results
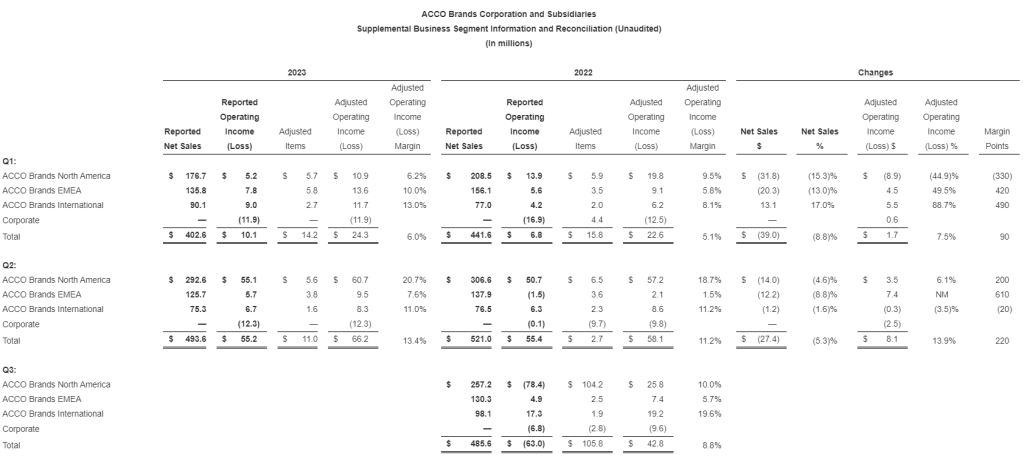
ACCO Brands North America – Secondquarter segment net sales of $292.6 million decreased 4.6 percent versus the prior year. Adverse foreign exchange reduced sales by 0.5 percent. Comparable sales of $294.2 million were down 4.1 percent. Both decreases reflect softer demand from business and retail customers due to a weaker macroeconomic environment and lower volumes for computer accessories. These factors more than offset stronger pricing, and volume growth in gaming accessories. Timing for some back-to-school sales was earlier than anticipated.
Second quarter operating income in North America was $55.1 million versus $50.7 million a year earlier, and adjusted operating income was $60.7 million compared to $57.2 million a year ago. Both increases reflect the benefit of pricing and cost actions and favorable mix, which more than offset the impact of lower sales and negative fixed cost leverage.
ACCO Brands EMEA – Secondquarter segment net sales of $125.7 million decreased 8.8 percent versus the prior year. Favorable foreign exchange increased sales by 0.3 percent. Comparable sales of $125.3 million decreased 9.1 percent versus the prior-year period. Both reported and comparable sales declines reflect reduced demand due to a weaker environment in the region and lower volumes for technology accessories. This more than offset the effect of cumulative pricing actions.
Second quarter operating income in EMEA was $5.7 million versus a loss of $1.5 million a year earlier, and adjusted operating income was $9.5 million compared to $2.1 million a year ago. The increases in both reported operating income and adjusted operating income reflect improved gross margins from the cumulative effect of price increases and cost savings actions more than offsetting negative fixed cost leverage.
ACCO Brands International – Secondquarter segment sales of $75.3 million decreased 1.6 percent versus the prior year. Favorable foreign exchange increased sales by 0.7 percent. Comparable sales of $74.8 million decreased 2.3 percent versus the year-ago period. Both sales decreases reflect lower volumes due to weaker economies in Asia and Australia, mostly offset by growth in Latin America.
Second quarter operating income in the International segment was $6.7 million versus $6.3 million a year earlier, with the increase due to lower restructuring expense. Adjusted operating income was $8.3 million compared to $8.6 million a year ago.
Six Month Results
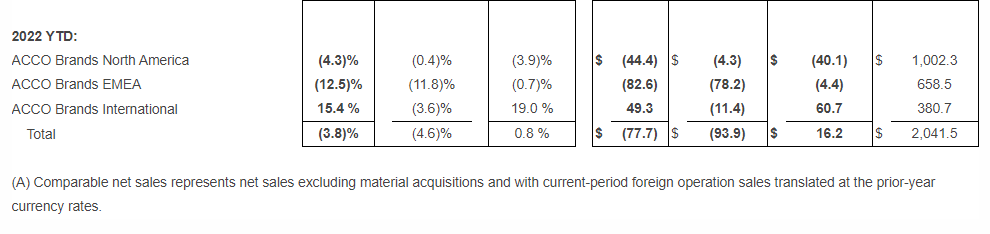
Net sales decreased 6.9 percent to $896.2 million from $962.6 million in 2022. Adverse foreign exchange reduced sales by $11.4 million, or 1.2 percent. Comparable sales decreased 5.7 percent. Both reported and comparable sales declines reflect lower volume, especially in EMEA and North America due to the challenging macroeconomic environment, lower sales of technology accessories, and the timing of back-to-school shipments and lower channel inventory compared to a year ago. These more than offset the benefit of price increases across all segments, and volume growth in Latin America.
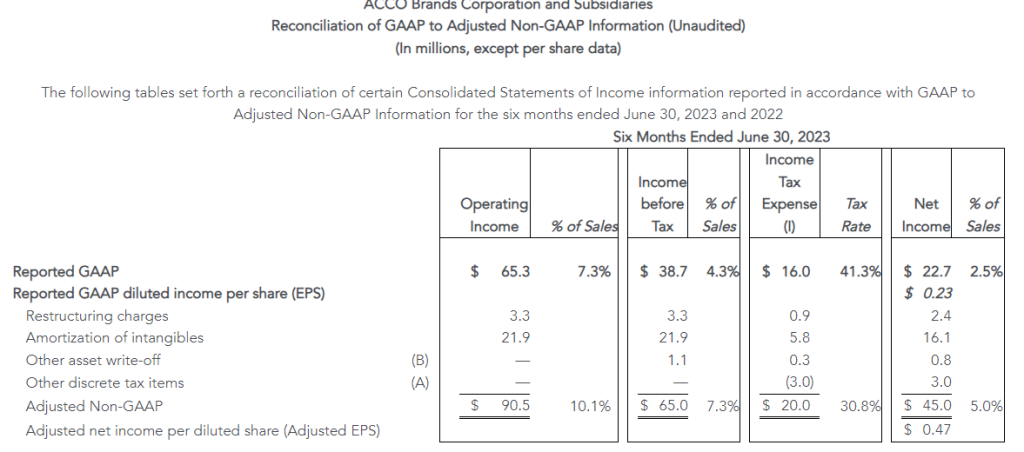
Operating income of $65.3 million compares to operating income of $62.2 million in 2022, which included a benefit of $6.8 million related to a change in the value of the PowerA contingent earnout. Adjusted operating income of $90.5 million increased from $80.7 million last year. Both reported and adjusted operating income increases reflect the benefit of global price increases and cost reduction initiatives, partially offset by higher SG&A expense primarily due to increased incentive compensation.
Net income was $22.7 million, or $0.23 per share, compared with net income of $36.7 million, or $0.37 per share, in 2022. Reported net income in 2023 reflects higher interest, tax and non-operating pension expenses. Reported net income in 2022 benefitted from the items noted above in operating income. Adjusted net income was $45.0 million, compared with $46.4 million in 2022, and adjusted earnings per share were $0.47 for both year periods. Adjusted net income reflects the increase in adjusted operating income offset by higher interest and non-operating pension expenses.
Capital Allocation and Dividend
Year to date, the Company improved its operating cash outflow by $58.6 million to $39.3 million versus $97.9 million in the prior year, driven primarily by improved working capital management. Adjusted free cash flow improved by $50.1 million and was an outflow of $45.4 million versus an outflow of $95.5 million a year earlier. Adjusted free cash flow in 2022 excludes the contingent earnout payment.
On August 1, 2023, ACCO Brands announced that its board of directors declared a regular quarterly cash dividend of $0.075 per share. The dividend will be paid on September 12, 2023, to stockholders of record at the close of business on August 22, 2023.
Full Year 2023 and Third Quarter Outlook
The Company is updating its full year 2023 outlook and providing a 3Q outlook. For the full year, reported sales are expected to be down 1 percent to 3 percent, including a 1.5 percent positive impact from foreign exchange. The Company is also maintaining its full year adjusted EPS outlook to be in the range of $1.08 to $1.12. Mid-teen growth in adjusted operating income is expected to be partially offset by higher interest and non-cash non-operating pension expenses. The Company is raising its 2023 free cash flow outlook to at least $110 million and expects to end the year with a consolidated leverage ratio of 3.3x to 3.5x, lower than previously expected.
In the third quarter, reported sales are expected to be flat to down 3 percent, which includes approximately a 4 percent positive impact from foreign exchange. Adjusted EPS is expected to be in the range of $0.21 to $0.24, which compares to $0.25 of adjusted EPS in the prior-year third quarter.
Webcast
At 8:30 a.m. ET on August 9, 2023, ACCO Brands Corporation will host a conference call to discuss the Company’s second quarter 2023 results. The call will be broadcast live via webcast. The webcast can be accessed through the Investor Relations section of www.accobrands.com. The webcast will be in listen-only mode and will be available for replay following the event.
About ACCO Brands Corporation
ACCO Brands, the Home of Great Brands Built by Great People, designs, manufactures and markets consumer and end-user products that help people work, learn, play and thrive. Our widely recognized brands include AT-A-GLANCE®, Five Star®, Kensington®, Leitz®, Mead®, PowerA®, Swingline®, Tilibra® and many others. More information about ACCO Brands Corporation (NYSE: ACCO) can be found at www.accobrands.com.
Non-GAAP Financial Measures
In addition to financial results reported in accordance with generally accepted accounting principles (GAAP), we have provided certain non-GAAP financial information in this earnings release to aid investors in understanding the Company’s performance. Each non-GAAP financial measure is defined and reconciled to its most directly comparable GAAP financial measure in the “About Non-GAAP Financial Measures” section of this earnings release.
Forward-Looking Statements
Statements contained herein, other than statements of historical fact, particularly those anticipating future financial performance, business prospects, growth, strategies, business operations and similar matters, results of operations, liquidity and financial condition, are “forward-looking statements” within the meaning of the Private Securities Litigation Reform Act of 1995. These statements are based on the beliefs and assumptions of management based on information available to us at the time such statements are made. These statements, which are generally identifiable by the use of the words “will,” “believe,” “expect,” “intend,” “anticipate,” “estimate,” “forecast,” “project,” “plan,” and similar expressions, are subject to certain risks and uncertainties, are made as of the date hereof, and we undertake no duty or obligation to update them. Because actual results may differ materially from those suggested or implied by such forward-looking statements, you should not place undue reliance on them when deciding whether to buy, sell or hold the Company’s securities.
Our outlook is based on certain assumptions, which we believe to be reasonable under the circumstances. These include, without limitation, assumptions regarding the impact of the war in Ukraine; the impact of inflation and global economic uncertainties, fluctuations in foreign currency exchange rates and acquisitions; and the other factors described below.
Among the factors that could cause our actual results to differ materially from our forward-looking statements are: our ability to successfully execute our restructuring plans and realize the benefits of our productivity initiatives; our ability to obtain additional price increases and realize longer-term cost reductions; the ongoing impact of the COVID-19 pandemic; a relatively limited number of large customers account for a significant percentage of our sales; issues that influence customer and consumer discretionary spending during periods of economic uncertainty or weakness; risks associated with foreign currency exchange rate fluctuations; challenges related to the highly competitive business environment in which we operate; our ability to develop and market innovative products that meet consumer demands and to expand into new and adjacent product categories that are experiencing higher growth rates; our ability to successfully expand our business in emerging markets and the exposure to greater financial, operational, regulatory, compliance and other risks in such markets; the continued decline in the use of certain of our products; risks associated with seasonality; the sufficiency of investment returns on pension assets, risks related to actuarial assumptions, changes in government regulations and changes in the unfunded liabilities of a multi-employer pension plan; any impairment of our intangible assets; our ability to secure, protect and maintain our intellectual property rights, and our ability to license rights from major gaming console makers and video game publishers to support our gaming accessories business; continued disruptions in the global supply chain; risks associated with inflation and other changes in the cost or availability of raw materials, transportation, labor, and other necessary supplies and services and the cost of finished goods; risks associated with outsourcing production of certain of our products, information technology systems and other administrative functions; the failure, inadequacy or interruption of our information technology systems or its supporting infrastructure; risks associated with a cybersecurity incident or information security breach, including that related to a disclosure of personally identifiable information; our ability to grow profitably through acquisitions; our ability to successfully integrate acquisitions and achieve the financial and other results anticipated at the time of acquisition, including planned synergies; risks associated with our indebtedness, including limitations imposed by restrictive covenants, our debt service obligations, and our ability to comply with financial ratios and tests; a change in or discontinuance of our stock repurchase program or the payment of dividends; product liability claims, recalls or regulatory actions; the impact of litigation or other legal proceedings; our failure to comply with applicable laws, rules and regulations and self-regulatory requirements, the costs of compliance and the impact of changes in such laws; our ability to attract and retain qualified personnel; the volatility of our stock price; risks associated with circumstances outside our control, including those caused by public health crises, such as the occurrence of contagious diseases, severe weather events, war, terrorism and other geopolitical incidents; and other risks and uncertainties described in “Part I, Item 1A. Risk Factors” in our Annual Report on Form 10-K for the year ended December 31, 2022, and in other reports we file with the Securities and Exchange Commission.
About Non-GAAP Financial Measures
We explain below how we calculate each of our non-GAAP financial measures and a reconciliation of our current period and historical non-GAAP financial measures to the most directly comparable GAAP financial measures follows.
We use our non-GAAP financial measures both to explain our results to stockholders and the investment community and in the internal evaluation and management of our business. We believe our non-GAAP financial measures provide management and investors with a more complete understanding of our underlying operational results and trends, facilitate meaningful period-to-period comparisons and enhance an overall understanding of our past and future financial performance.
Our non-GAAP financial measures exclude certain items that may have a material impact upon our reported financial results such as restructuring charges, transaction and integration expenses associated with material acquisitions, the impact of foreign currency exchange rate fluctuations and acquisitions, unusual tax items, goodwill impairment charges, and other non-recurring items that we consider to be outside of our core operations. These measures should not be considered in isolation or as a substitute for, or superior to, the directly comparable GAAP financial measures and should be read in connection with the Company’s financial statements presented in accordance with GAAP.
Our non-GAAP financial measures include the following:
Comparable Sales : Represents net sales excluding the impact of material acquisitions, if any, with current-period foreign operation sales translated at prior-year currency rates. We believe comparable sales are useful to investors and management because they reflect underlying sales and sales trends without the effect of material acquisitions and fluctuations in foreign exchange rates and facilitate meaningful period-to-period comparisons. We sometimes refer to comparable sales as comparable net sales.
Adjusted Selling, General and Administrative (SG&A) Expenses : Represents selling, general and administrative expenses excluding transaction and integration expenses related to material acquisitions. We believe adjusted SG&A expenses are useful to investors and management because they reflect underlying SG&A expenses without the effect of expenses related to acquiring and integrating acquisitions that we consider to be outside our core operations and facilitate meaningful period-to-period comparisons.
Adjusted Operating Income/Adjusted Income Before Taxes/Adjusted Net Income/Adjusted Net Income Per Diluted Share:Represents operating income, income before taxes, net income, and net income per diluted share excluding restructuring and goodwill impairment charges, the amortization of intangibles, the amortization of the step-up in value of inventory, the change in fair value of contingent consideration, transaction and integration expenses associated with material acquisitions, non-recurring items in interest expense or other income/expense such as expenses associated with debt refinancing, a bond redemption, or a pension curtailment, and other non-recurring items as well as all unusual and discrete income tax adjustments, including income tax related to the foregoing. We believe these adjusted non-GAAP financial measures are useful to investors and management because they reflect our underlying operating performance before items that we consider to be outside our core operations and facilitate meaningful period-to-period comparisons. Senior management’s incentive compensation is derived, in part, using adjusted operating income and adjusted net income per diluted share, which is derived from adjusted net income. We sometimes refer to adjusted net income per diluted share as adjusted earnings per share or adjusted EPS.
Adjusted Income Tax Expense/Rate:Represents income tax expense/rate excluding the tax effect of the items that have been excluded from adjusted income before taxes, unusual income tax items such as the impact of tax audits and changes in laws, significant reserves for cash repatriation, excess tax benefits/losses, and other discrete tax items. We believe our adjusted income tax expense/rate is useful to investors because it reflects our baseline income tax expense/rate before benefits/losses and other discrete items that we consider to be outside our core operations and facilitates meaningful period-to-period comparisons.
Adjusted EBITDA: Represents net income excluding the effects of depreciation, stock-based compensation expense, amortization of intangibles, the change in fair value of contingent consideration, interest expense, net, other (income) expense, net, and income tax expense, the amortization of the step-up in value of inventory, transaction and integration expenses associated with material acquisitions, restructuring and goodwill impairment charges, non-recurring items in interest expense or other income/expense such as expenses associated with debt refinancing, a bond redemption, or a pension curtailment and other non-recurring items. We believe adjusted EBITDA is useful to investors because it reflects our underlying cash profitability and adjusts for certain non-cash charges, and items that we consider to be outside our core operations and facilitates meaningful period-to-period comparisons.
Free Cash Flow/Adjusted Free Cash Flow: Free cash flow represents cash flow from operating activities less cash used for additions to property, plant and equipment. Adjusted free cash flow represents free cash flow, less cash payments made for contingent earnouts, plus cash proceeds from the disposition of assets. We believe free cash flow and adjusted free cash flow are useful to investors because they measure our available cash flow for paying dividends, funding strategic material acquisitions, reducing debt, and repurchasing shares.
Consolidated Leverage Ratio: Represents balance sheet debt, plus debt origination costs and less any cash and cash equivalents divided by adjusted EBITDA. We believe that consolidated leverage ratio is useful to investors since the company has the ability to, and may decide to use, a portion of its cash and cash equivalents to retire debt.
We also provide forward-looking non-GAAP comparable sales, adjusted earnings per share, free cash flow, adjusted free cash flow, adjusted EBITDA, and adjusted tax rate, and historical and forward-looking consolidated leverage ratio. We do not provide a reconciliation of these forward-looking and historical non-GAAP measures to GAAP because the GAAP financial measure is not currently available and management cannot reliably predict all the necessary components of such non-GAAP measures without unreasonable effort or expense due to the inherent difficulty of forecasting and quantifying certain amounts that are necessary for such a reconciliation, including adjustments that could be made for restructuring, integration and acquisition-related expenses, the variability of our tax rate and the impact of foreign currency fluctuation and material acquisitions, and other charges reflected in our historical results. The probable significance of each of these items is high and, based on historical experience, could be material.
Christopher McGinnis Investor Relations (847) 796-4320
LAKE ZURICH, Ill.–(BUSINESS WIRE)– ACCO Brands Corporation (NYSE: ACCO) today announced that it will release its second quarter 2023 earnings after the market close on August 8, 2023. The Company will host a conference call and webcast to discuss the results on August 9 at 8:30 a.m. EST. The webcast can be accessed through the Investor Relations section of www.accobrands.com and will be available for replay.
About ACCO Brands Corporation
ACCO Brands, the Home of Great Brands Built by Great People, designs, manufactures and markets consumer and end-user products that help people work, learn, play and thrive. Our widely recognized brands include AT-A-GLANCE®, Five Star®, Kensington®, Leitz®, Mead®, PowerA®, Swingline®, Tilibra® and many others. More information about ACCO Brands Corporation (NYSE: ACCO) can be found at www.accobrands.com.
Christopher McGinnis Investor Relations (847) 796-4320
The Company’s Start Proud!® Community Investment Program Empowers Students and Teachers to Start the New School Year Feeling Confident, Prepared and Proud
BOCA RATON, Fla.–(BUSINESS WIRE)–Jul. 24, 2023– The ODP Corporation (NASDAQ:ODP), a leading provider of products and services through an integrated business-to-business (B2B) distribution platform and omnichannel presence, today announced that over $2.5 million worth of educational supplies and equipment will be provided to students and teachers of Title I elementary schools across the country as a result of The ODP Corporation’s philanthropic program Start Proud!® and the generosity of our many vendor partners, including Boise Paper, Domtar and Crayola®.
Celebrating the sixth anniversary of the program, associate volunteers from The ODP Corporation—including Office Depot, ODP Business Solutions and VEYER—assembled 18,000 premium backpacks filled with over $2 million worth of school supplies—like notebooks, composition books, pencils, highlighters and more—to provide to students at nearly 30 Title I schools nationwide. Each backpack includes a box of Crayola® crayons as part of a donation valued at $50,000 from Crayola® to the Start Proud!® program.
The second portion of Start Proud!® kicks off in late September through October with a series of Title I teacher shopping sprees. With support from Domtar and Boise Paper, each school will also receive $20,000 in-store credit at Office Depot OfficeMax to benefit teachers by helping them with critical classroom essentials. This benefit helps alleviate the out-of-pocket purchases made by teachers, averaging $750–$1,000 each school year.1,2
“Caring for the communities in which we live and work is a huge component of our culture, which we’re demonstrating by supporting students, families and teachers each year,” said Gerry Smith, chief executive officer for The ODP Corporation. “As high inflation continues to impact families and teachers across the nation, our steadfast commitment to Start Proud!® enables students to start this school year confident, prepared and proud.”
The backpacks will be distributed at Start Proud!® signature on-campus school pep rallies throughout August and September, where school administrators, teachers and The ODP Corporation associates are teaming up to host the celebratory events, unveil the donations and welcome students back to school during their first week. Eighteen exemplary teachers will also be selected by their principals and surprised with an All-Star Teacher award in recognition of their dedication to education and extraordinary contributions to the students beyond the classroom. Each All-Star Teacher will be surprised with products including new technology, furniture and teaching supplies valued at over $2,000.
The continued commitment to leading philanthropic initiatives like Start Proud!® demonstrates The ODP Corporation’s dedication to supporting families and teachers nationwide.
1 Source: AdoptAClassroom.org, Teachers Spend $745 a Year on Supplies: The Cost of Distance Learning, June 15, 2020. 2 Source: NewsDirect, Teachers Spending More Out of Pocket on School Supplies Than Ever Before, August 18, 2021.
About The ODP Corporation The ODP Corporation (NASDAQ:ODP) is a leading provider of products and services through an integrated business-to-business (B2B) distribution platform and omnichannel presence, which includes world-class supply chain and distribution operations, dedicated sales professionals, a B2B digital procurement solution, online presence and a network of Office Depot and OfficeMax retail stores. Through its operating companies Office Depot, LLC; ODP Business Solutions, LLC; Veyer, LLC; and Varis, Inc., The ODP Corporation empowers every business, professional, and consumer to achieve more every day. For more information, visit theodpcorp.com.
ODP and ODP Business Solutions are trademarks of ODP Business Solutions, LLC. Office Depot is a trademark of The Office Club, LLC. OfficeMax is a trademark of OMX, Inc. Veyer is a trademark of Veyer, LLC. Varis is a trademark of Varis, Inc. Any other product or company names mentioned herein are the trademarks of their respective owners.
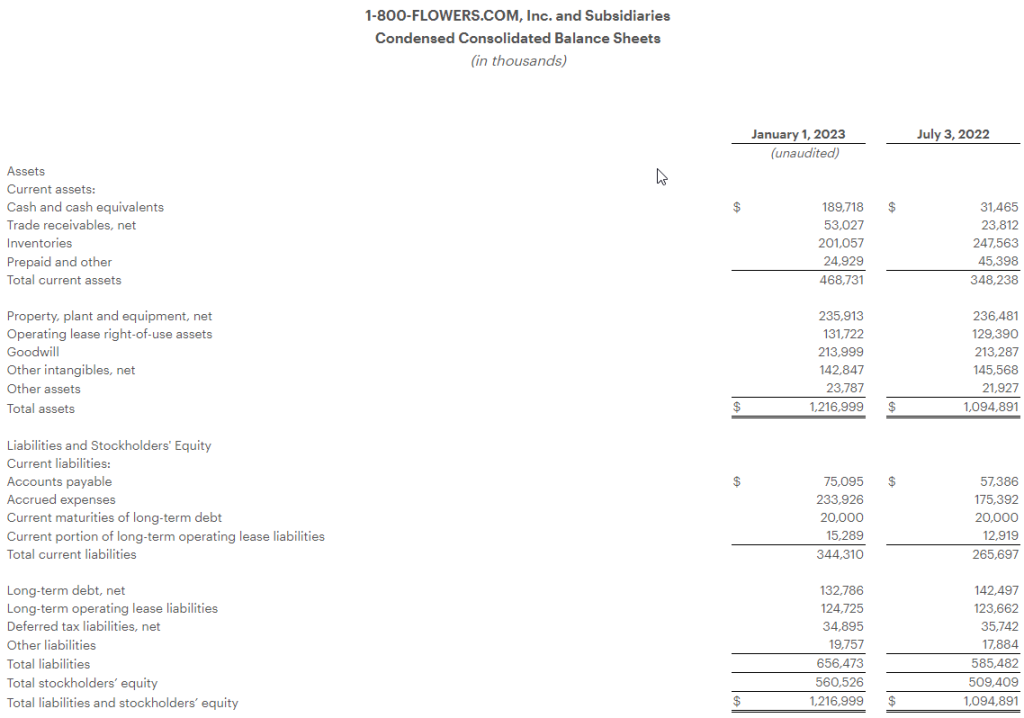
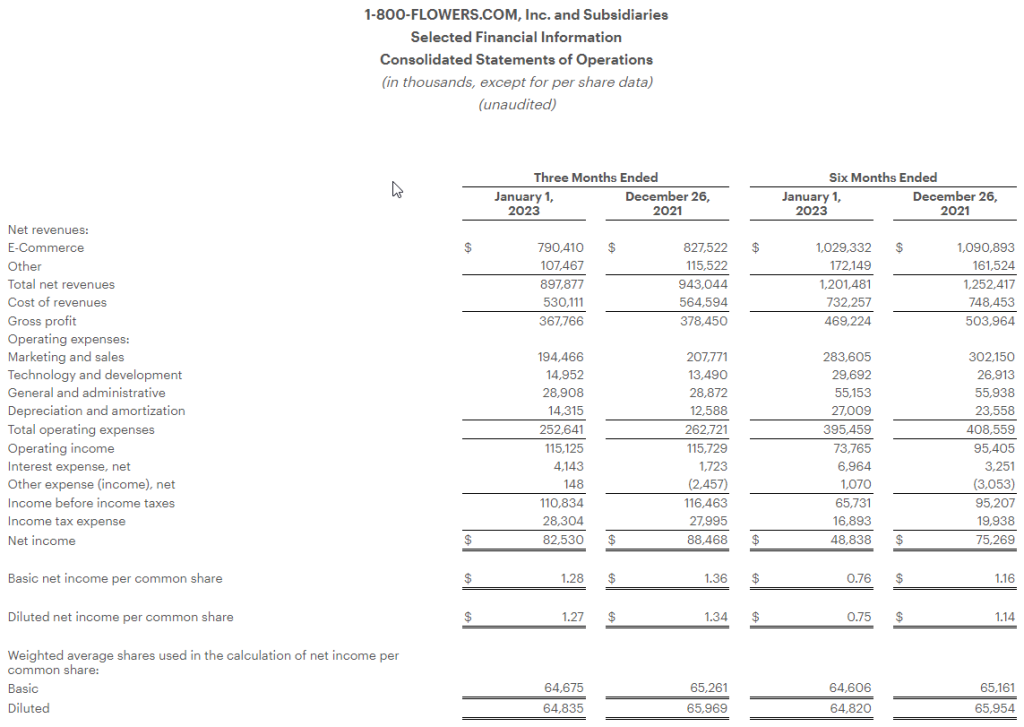
JERICHO, N.Y.–(BUSINESS WIRE)– 1-800-FLOWERS.COM, Inc. (NASDAQ: FLWS), a leading provider of gifts designed to help inspire customers to give more, connect more, and build more and better relationships, today announced CEO Christopher McCann will be stepping down for personal health reasons, effective July 3, 2023. To ensure continuity going forward, Jim McCann will resume his role as CEO and remain Chairman. Jim McCann served as CEO for the organization from inception through 2016. Christopher McCann will remain on the Company’s Board of Directors and continue to serve on the board and as an officer of various subsidiaries of the Company as he now serves.
“I want to thank Chris for all of his contributions to the company over the many years, as he played an integral role in overseeing our rapid growth and enhancing our market-leading position in the industry,” said Jim McCann, Chairman and Chief Executive Officer of 1-800-FLOWERS.COM, Inc.
Jim McCann continued, “Our rich history of innovation and embracing new technology will continue to play a vital role in solving the gifting needs of our millions of customers. As we look ahead, we have a talented management team and I look forward to working with them as we continue to execute our strategy to be a top destination for our customers’ celebratory and gifting occasions.”
Since its founding, 1-800-FLOWERS.COM, Inc. has continuously evolved its business. More recently it has transformed from a floral-based specialty retailer with multiple-brand add-ons into an Ecommerce gifting platform built for growth. From Fiscal 2019 through Fiscal 2022, the Company grew revenue by more than 75%, and it has a demonstrated ability to grow the company both organically and through acquisitions. 1-800-FLOWERS.COM, Inc. will continue to execute on its strategic plan that is centered on helping its customers build more and better relationships with all the important people in their lives.
About 1-800-FLOWERS.COM, Inc.
1-800-FLOWERS.COM, Inc. is a leading provider of gifts designed to help inspire customers to give more, connect more, and build more and better relationships. The Company’s e-commerce business platform features an all-star family of brands, including: 1-800-Flowers.com®, 1-800-Baskets.com®, Cheryl’s Cookies®, Harry & David®, PersonalizationMall.com®, Shari’s Berries®, FruitBouquets.com®, Things Remembered®, Moose Munch®, The Popcorn Factory®, Wolferman’s Bakery®, Vital Choice®, Stock Yards® and Simply Chocolate®. Through the Celebrations Passport® loyalty program, which provides members with free standard shipping and no service charge across our portfolio of brands, 1-800-FLOWERS.COM, Inc. strives to deepen relationships with customers. The Company also operates BloomNet®, an international floral and gift industry service provider offering a broad-range of products and services designed to help members grow their businesses profitably; Napco℠, a resource for floral gifts and seasonal décor; DesignPac Gifts, LLC, a manufacturer of gift baskets and towers; and Alice’s Table®, a lifestyle business offering fully digital livestreaming and on demand floral, culinary and other experiences to guests across the country. 1-800-FLOWERS.COM, Inc. was recognized among the top 5 on the National Retail Federation’s 2021 Hot 25 Retailers list, which ranks the nation’s fastest-growing retail companies, and was named to the Fortune 1000 list in 2022. Shares in 1-800-FLOWERS.COM, Inc. are traded on the NASDAQ Global Select Market, ticker symbol: FLWS. For more information, visit 1800flowersinc.com or follow @1800FLOWERSInc on Twitter.
LAKE ZURICH, Ill.–(BUSINESS WIRE)– ACCO Brands Corporation (NYSE: ACCO) today announced that its board of directors has declared a quarterly cash dividend of $0.075 per share. The dividend will be paid on June 9, 2023, to stockholders of record as of the close of business on May 19, 2023.
“This is the Company’s 22nd quarterly cash dividend since it began paying dividends in 2018. The Company’s dividend has become an important part of our capital allocation strategy and we remain committed to supporting our quarterly dividend with our robust free cash flow. At the current stock price, on an annualized basis, our shareholders are receiving an almost 7% yield on their investment,” said Boris Elisman, Chairman and Chief Executive Officer of ACCO Brands.
About ACCO Brands Corporation
ACCO Brands, the Home of Great Brands Built by Great People, designs, manufactures and markets consumer and end-user products that help people work, learn, play and thrive. Our widely recognized brands include AT-A-GLANCE®, Five Star®, Kensington®, Leitz®, Mead®, PowerA®, Swingline®, Tilibra® and many others. More information about ACCO Brands Corporation (NYSE: ACCO) can be found at www.accobrands.com.
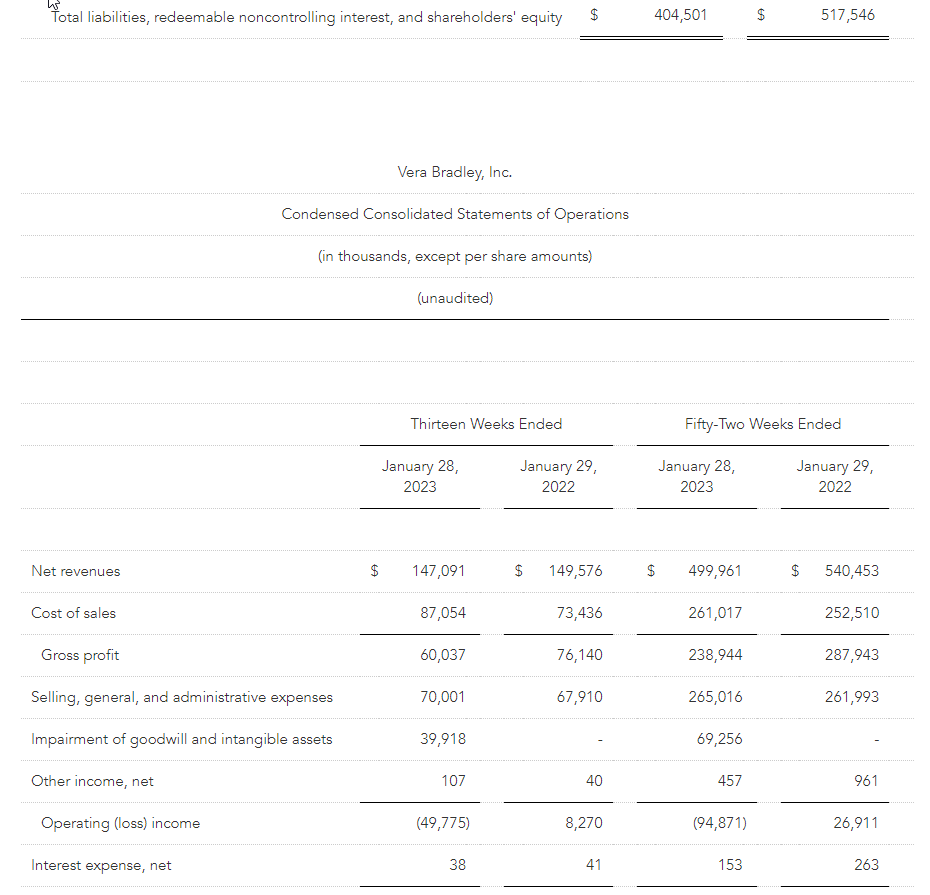
Net revenues totaled $500.0 million for the fiscal year
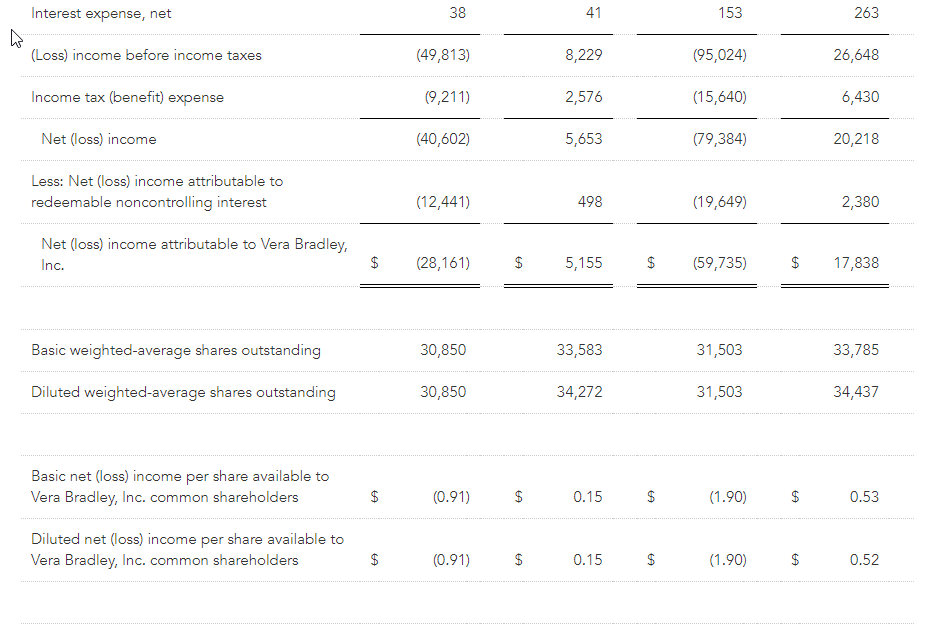
Net loss totaled ($59.7) million, or ($1.90) per diluted share, for fiscal year; excluding certain items, non-GAAP net income totaled $7.6 million, or $0.24 per diluted share
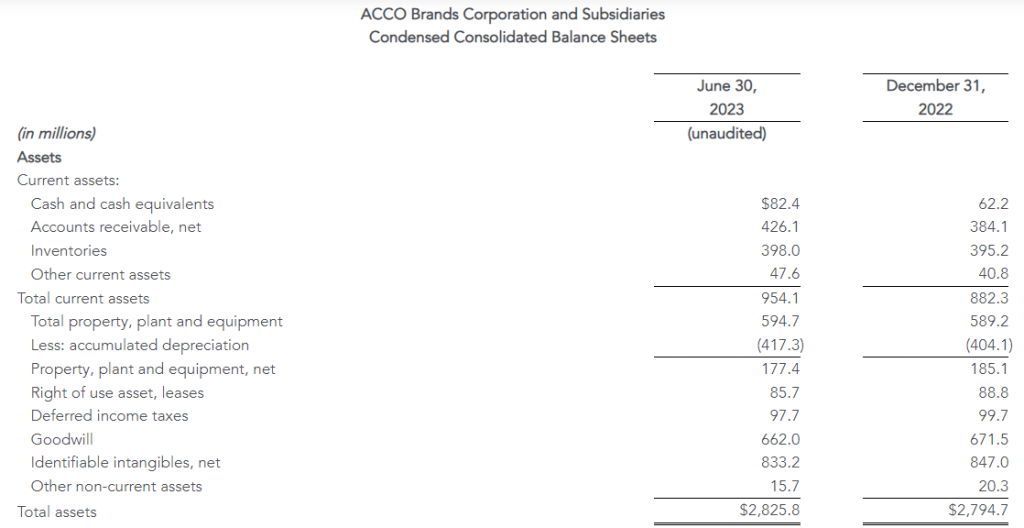
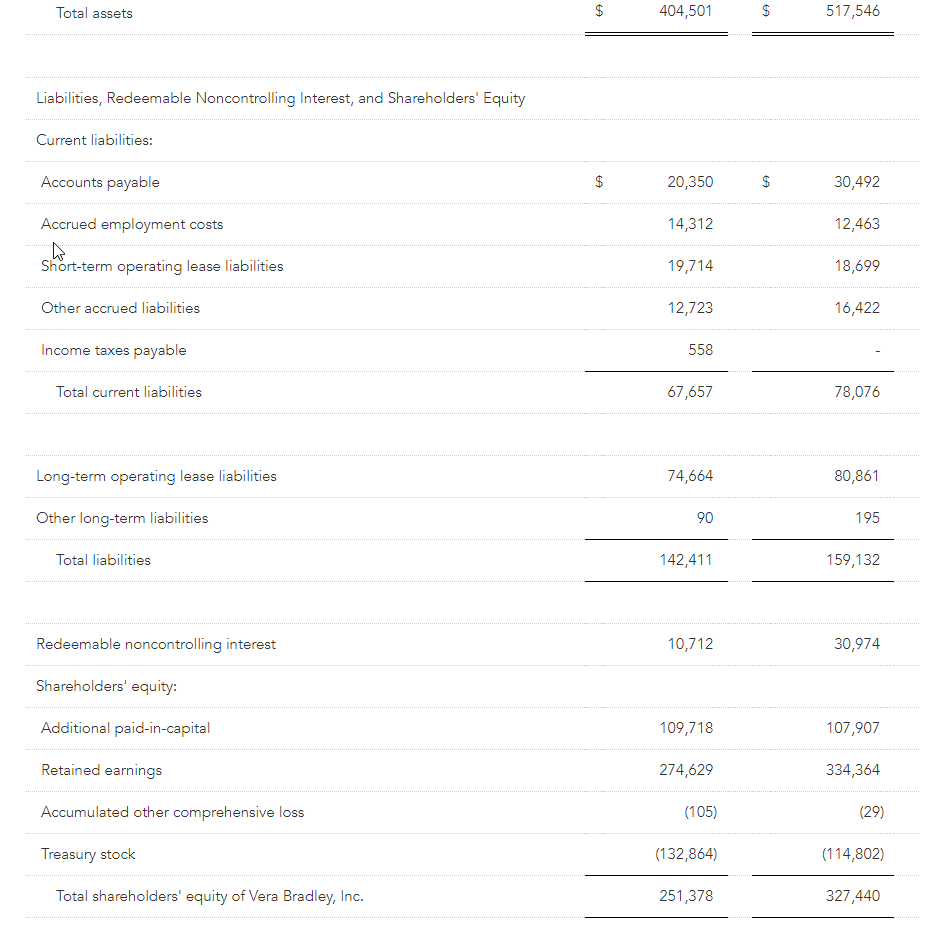
Balance sheet remains strong, with cash and cash equivalents of $46.6 million and no debt
Management provides guidance for fiscal year ending February 3, 2024
FORT WAYNE, Ind., March 08, 2023 (GLOBE NEWSWIRE) — Vera Bradley, Inc. (Nasdaq: VRA) (or the “Company”) today announced its financial results for the fourth quarter and fiscal year ended January 28, 2023 (“Fiscal 2023”).
In this release, Vera Bradley, Inc. or “the Company” refers to the entire enterprise and includes both the Vera Bradley and Pura Vida brands. “Vera Bradley” on a stand-alone basis refers only to the Vera Bradley brand.
Fourth Quarter and Fiscal Year Comments
Jackie Ardrey, Chief Executive Officer of the Company, noted, “We focused on driving revenues in the fourth quarter through targeted, strategic promotions on seasonal, giftable, and key items. As a result, total Company fourth quarter revenues outperformed our guidance, although gross margins remained under pressure. Diligent expense control enabled us to deliver fourth quarter non-GAAP diluted EPS of $0.16, which was nearly flat with last year.
“In the fourth quarter, sales trends at both Vera Bradley and Pura Vida improved over prior quarters, with Vera Bradley total sales down just 1% and Pura Vida sales down less than 5% on a year-over-year basis. For the fourth consecutive quarter, the Vera Bradley Indirect Channel experienced year-over-year revenue growth. Targeted customer retention efforts led to increased Vera Bradley e-commerce revenues, while Full-Line and Factory store revenues continued to be negatively affected by traffic levels, although trends improved throughout the quarter.”
Ardrey continued, “At Pura Vida, e-commerce trends improved over previous quarters due to strategic promotions; however, overall challenges continued to persist in our social and digital media effectiveness coupled with rising digital media costs. And, we experienced a year-over-year sales decline in our wholesale channel. On the plus side, Pura Vida Full-Line retail stores continued to perform ahead of our expectations, and they drove improved e-commerce traffic and revenues in their markets.
“We also took the opportunity in the fourth quarter to reset and appropriately position the Pura Vida business for the future, by recording goodwill and tradename impairments and necessary inventory write-offs.
“We ended the fiscal year with consolidated revenues of $500 million. During the year, we began to see stabilization in our supply chain, diligently controlled our expenses, and carefully managed our cash. During the fourth quarter, we meaningfully reduced our year-end inventory levels from the third quarter.”
Ardrey added, “Although Fiscal 2023 had its challenges, we took actions and laid the groundwork to position the Company for the future.
“On a corporate basis:
In mid-2022, we collaboratively identified $25 million in annualized cost-reduction initiatives and efficiency processes. The expense savings were derived across various areas of the Company, including payroll reductions, retail store efficiencies, marketing expenses, information technology contracts and projects, professional services, and logistics and operational costs. Many of the savings were realized in Fiscal 2023.
In January 2023, we further streamlined our corporate structure by eliminating the positions of Vera Bradley Brand President, Chief Creative Officer, and Chief Revenue Officer, and by adding the position of Chief Marketing Officer, designed to drive additional annual cost savings of approximately $2 million, add more focus on marketing and merchandising, and position the Company to deliver steady top- and bottom-line growth. These decisions were made in order to right-size our leadership team and cost structure for the size of our business, to address the continuing challenging macro environment, and to best position us to achieve our long-term strategic plans.
Subsequent to the end of Fiscal 2023, in January 2023, we acquired the remaining 25% interest in Pura Vida from founders Griffin Thall and Paul Goodman for $10 million.
We continued to make investments in customer data science, business analytics, and pricing optimization, allowing us to collect and analyze data and make fact-based decisions to more efficiently run our business.
“At the Vera Bradley brand:
We expanded our robust product innovation pipeline, including launching our Featherweight Collection; continued another year of iconic product collaborations, including with Disney, Harry Potter, and Crocs; and expanded our cozy, sleep, and outerwear collections.
We continued to strengthen and rationalize our store base. We opened five new Factory stores and closed 19 underperforming Full-Line stores and one Factory store, ending the fiscal year with 51 Full-Line and 79 Factory locations. We also continued to expand options for customers to shop, like enhancing our presence in third-party marketplaces and adding boutiques in select high-traffic airports.
“At the Pura Vida brand:
We entered into several high-profile product collaborations, with brands such as Hello Kitty, Disney, and Harry Potter, and expanded our product offerings by launching our demi-fine collection and expanding our assortment of engravable jewelry, all designed to bring new customers to our brand.
We focused on building a more diverse, innovative, effective, and performance-based marketing program to drive Pura Vida e-commerce sales. We began the process of implementing a comprehensive customer data platform to build a single, coherent, complete view of each Pura Vida customer so that we can better target and personalize marketing and become less reliant on third-party marketing. This project is scheduled for completion this spring. We continued to engage our micro influencers, significantly expanded our TikTok presence, launched impactful ads on connected TV, optimized SMS, and aggressively explored other methods to effectively reach our customers.
We opened three new Pura Vida Full-Line stores during the year, bringing our Full-Line store count to four, which collectively are exceeding our expectations. These four stores are playing a role in driving new customer acquisition as we continue to diversify our marketing platforms, and they demonstrate the power a retail presence can have in driving digital sales, omni-channel loyalty, and spending.”
Summary of Financial Performance for the Fourth Quarter
Consolidated net revenues totaled $147.1 million for the current year fourth quarter compared to $149.6 million in the prior year fourth quarter.
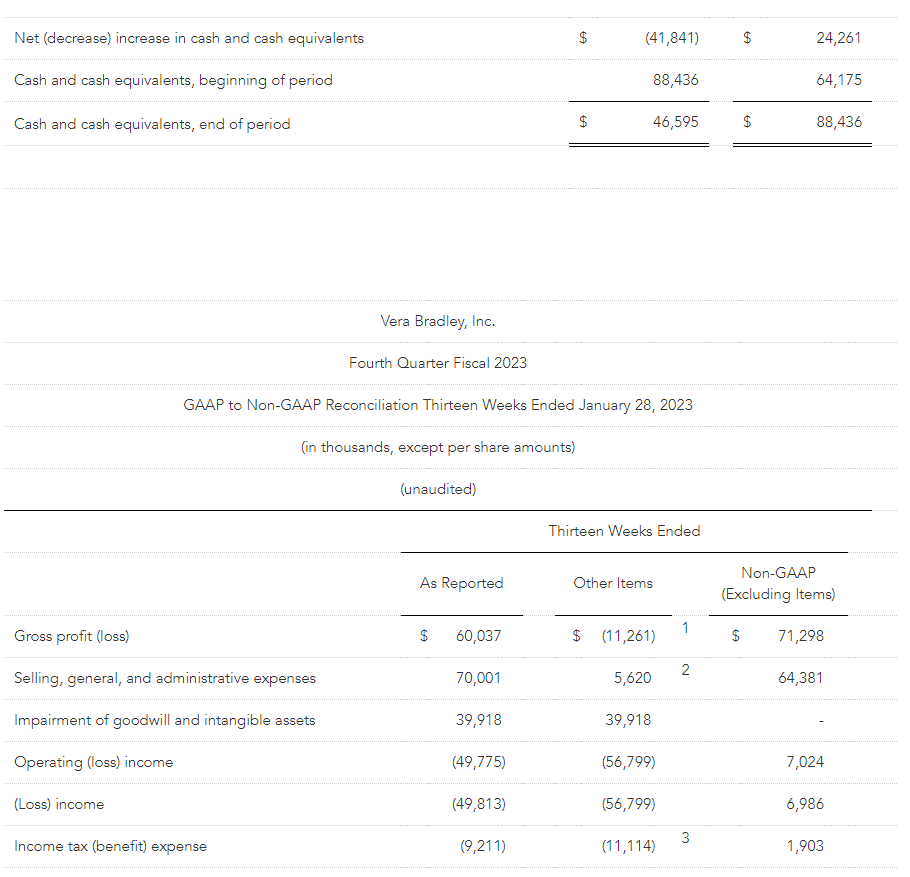
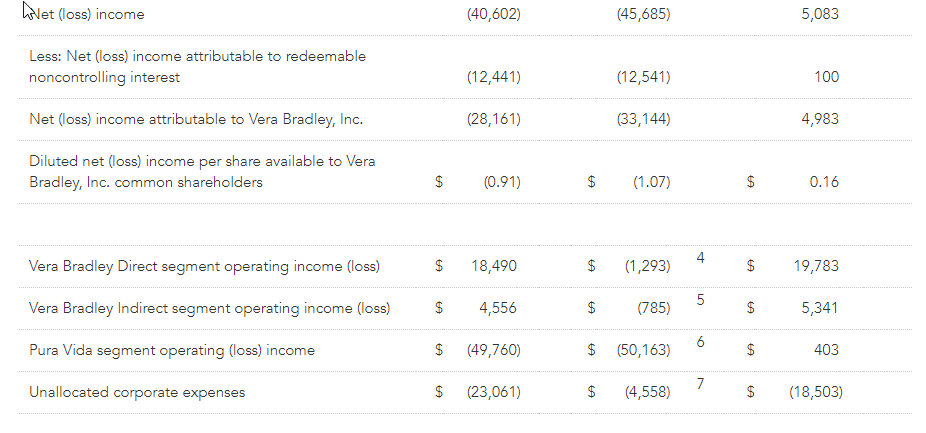
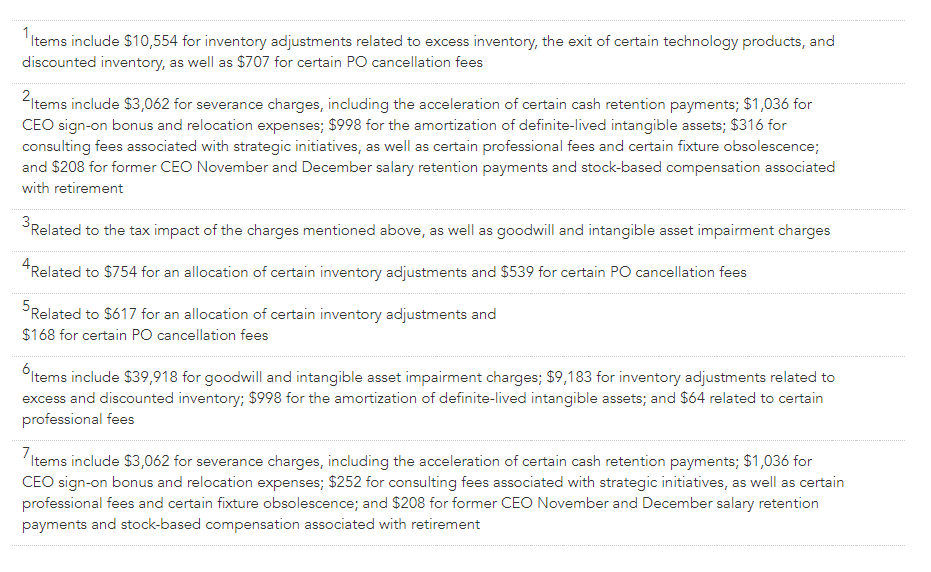
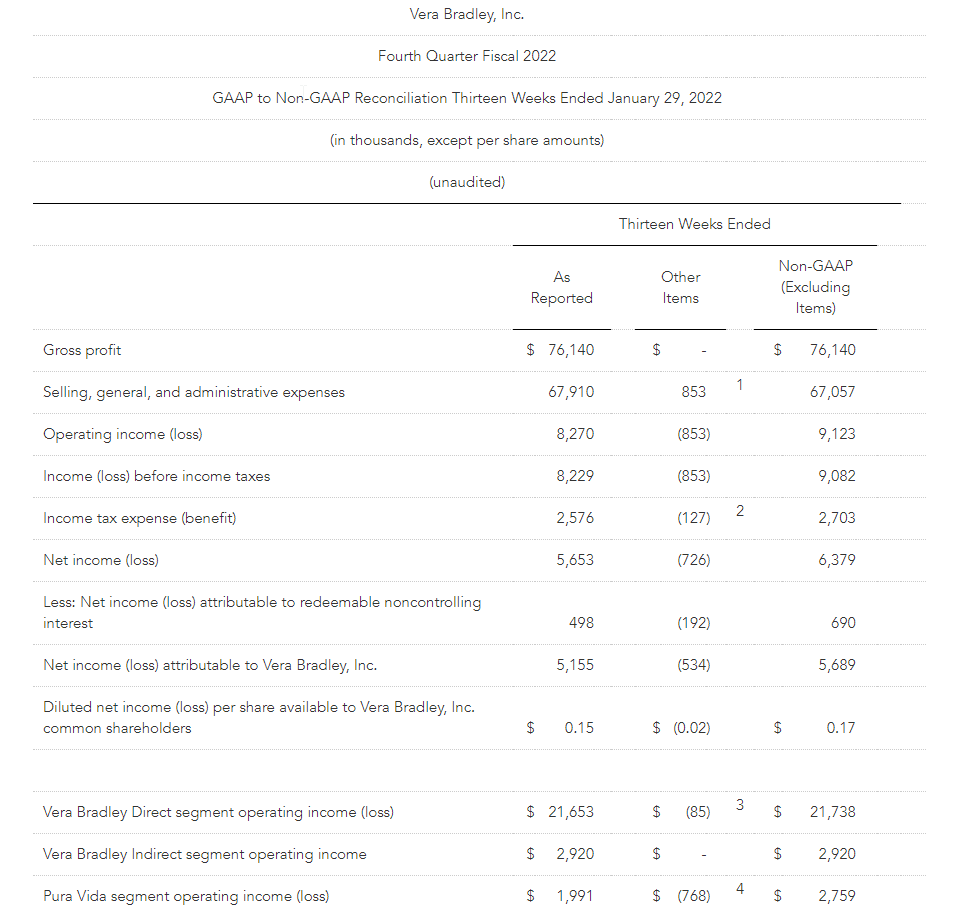
For the current year fourth quarter, Vera Bradley, Inc.’s consolidated net loss totaled ($28.2) million, or ($0.91) per diluted share. These results included $33.1 million of net after tax charges, comprised of $22.4 million of goodwill and intangible asset impairment charges; $6.7 million of net inventory and purchase order-related adjustments; $2.4 million of severance, retention, and stock-based retirement compensation charges; $0.8 million related to new CEO sign-on bonus and relocation expenses; $0.5 million for the amortization of definite-lived intangible assets; and $0.3 million of consulting and professional fees primarily associated with strategic initiatives. On a non-GAAP basis, Vera Bradley, Inc.’s consolidated fourth quarter net income totaled $5.0 million, or $0.16 per diluted share.
For the prior year fourth quarter, Vera Bradley, Inc. consolidated net income totaled $5.2 million, or $0.15 per diluted share. These results included $0.5 million of net after tax charges primarily related to intangible asset amortization. On a non-GAAP basis, excluding these charges, Vera Bradley, Inc.’s prior year consolidated fourth quarter net income totaled $5.7 million, or $0.17 per diluted share.
Summary of Financial Performance for the Fiscal Year
Consolidated net revenues totaled $500.0 million for Fiscal 2023 compared to $540.5 million for Fiscal 2022.
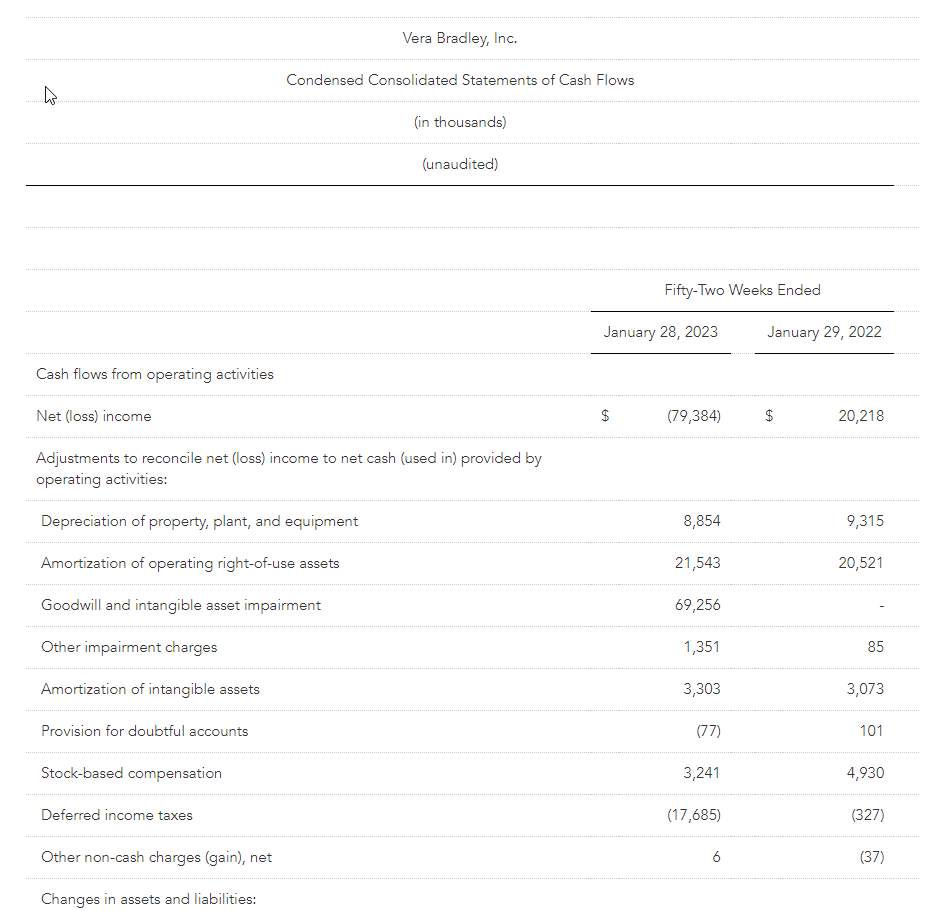
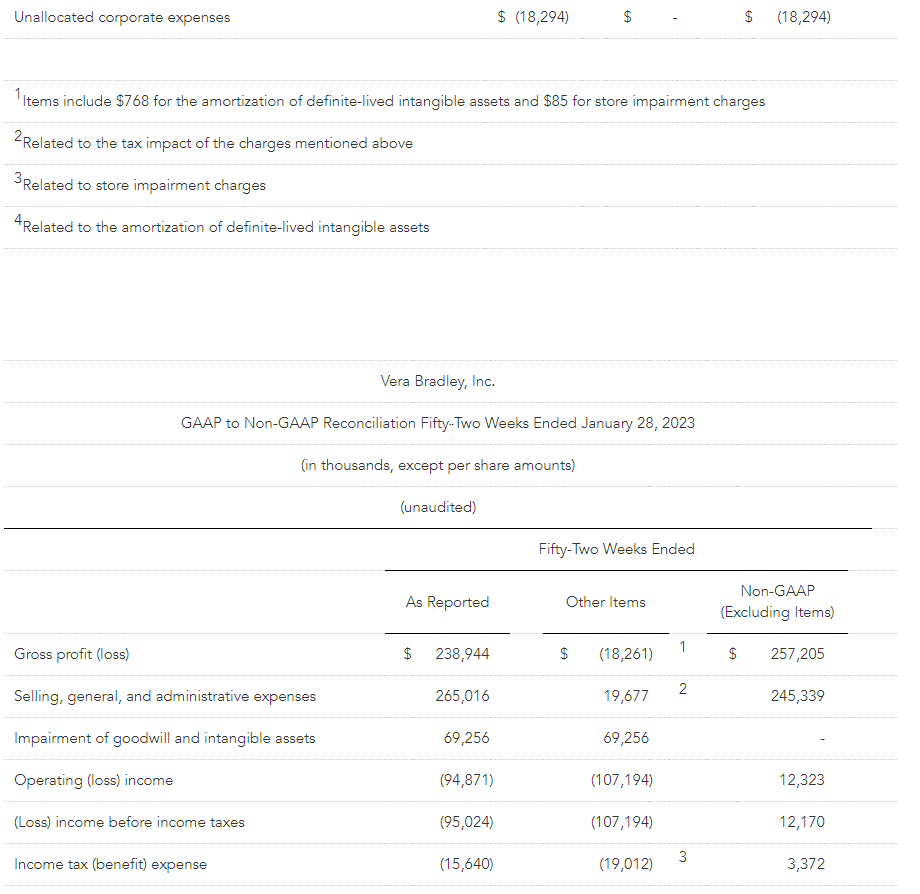
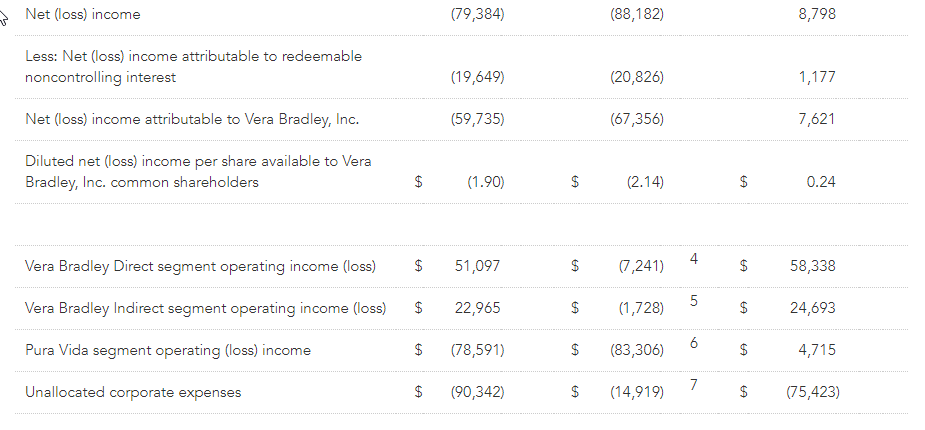
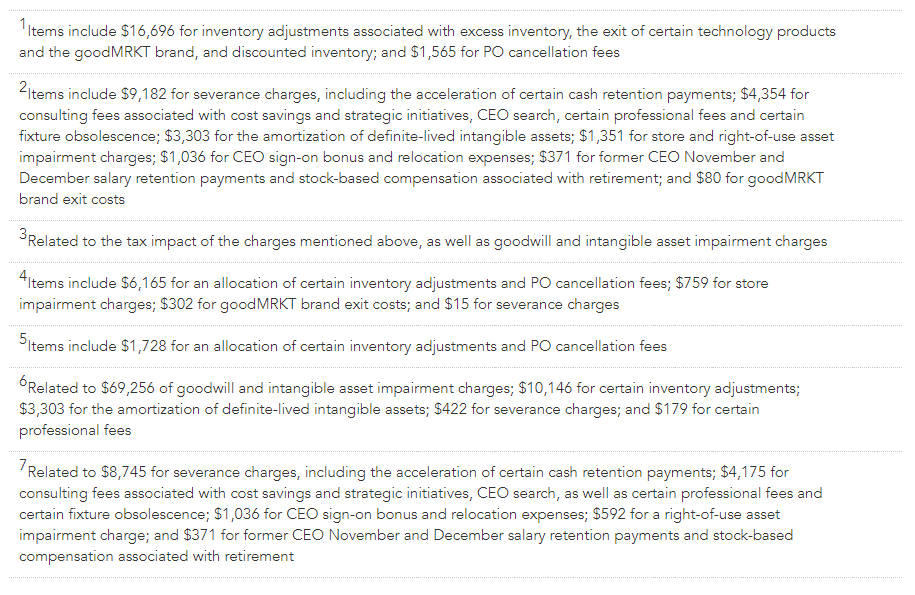
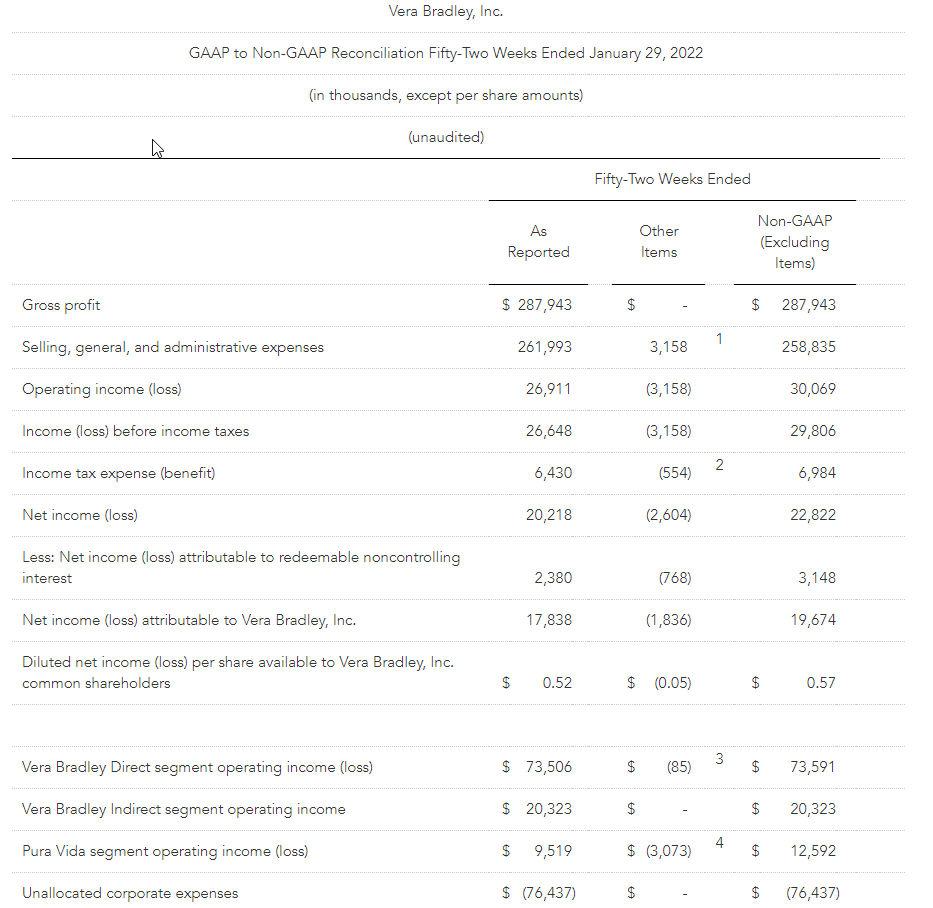
For the current fiscal year, Vera Bradley, Inc.’s consolidated net loss totaled ($59.7) million, or ($1.90) per diluted share. These results included $67.4 million of net after tax charges, comprised of $40.6 million of goodwill and intangible asset impairment charges; $12.2 million of net inventory and purchase order-related adjustments; $7.4 million of severance, retention, and stock-based retirement compensation charges; $3.3 million of consulting and professional fees primarily associated with cost savings initiatives, the CEO search, and strategic initiatives; $1.8 million for the amortization of definite-lived intangible assets; $1.0 million of store and right-of-use asset impairment charges; $0.8 million related to the new CEO sign-on bonus and relocation expenses; and $0.3 million of goodMRKT exit costs. On a non-GAAP basis, Vera Bradley, Inc.’s consolidated net income totaled $7.6 million, or $0.24 per diluted share.
For the prior fiscal year, Vera Bradley, Inc.’s consolidated net income totaled $17.8 million, or $0.52 per diluted share. These results included $1.8 million of net after tax charges primarily related to intangible asset amortization. On a non-GAAP basis, excluding these charges, Vera Bradley, Inc.’s prior year consolidated net income totaled $19.7 million, or $0.57 per diluted share.
Looking Ahead
Ardrey noted, “We are committed to returning Vera Bradley and Pura Vida to profitable growth and generating strong cash flow as a Company, which I believe will deliver value to our shareholders over the long term. Since joining the Company in November, I am more convinced than ever that both brands have enormous potential, and I am very excited about the future of Vera Bradley, Inc. We have a portfolio of two iconic, lifestyle brands; multi-generational customers with remarkable loyalty and devotion; impressive brand recognition; a solid balance sheet; and an extraordinary culture. We have some heavy lifting to do in fiscal 2024, but I am confident that we will emerge a stronger Company.”
Ardrey continued, “At both brands, we are embarking on Project Restoration and will focus on four key pillars – Consumer, Brand, Product, and Channel – to drive this long-term profitable growth.
“At Vera Bradley:
Consumer: We will focus on restoring brand relevancy, targeting casual and feminine 35 to 54 year old women who value both fashion and function.
Brand: We will strategically market our distinctive and unique position as a feminine, fashionable brand that connects with consumers on a deep, emotional level.
Product: We will refocus on core categories and items we are “best at,” by innovating and expanding within our core products. We will elevate our colorful feminine heritage, keeping it distinctive but more trend relevant through updated print and design. We also will innovate into strategic adjacent lifestyle item introductions that make sense for our customers.
Channel: We will accelerate our digital-first focus and online presence, build a balanced footprint that more clearly differentiates Full-Line from Factory stores, and target and/or strengthen relationships with strategically-aligned wholesale partners.
“At Pura Vida:
Consumer: We will sharpen our focus on the care-free 18 to 24 collegiate girl, who both those younger and older aspire to be.
Brand: We will recenter our brand ethos on “living life to the fullest,” with marketing authentically sharing real moments, places, and faces.
Product: We will focus on delivering unique, fun, playful designs that are affordable and accessible with a dominant emphasis on bracelets and jewelry, as well as other strategic, adjacent categories.
Channel: We will have a strong focus on restoring e-commerce growth; strategic growth of wholesale by pursuing larger, more strategic partnerships and expanding larger existing accounts; and refining our existing store model.”
“To support growth and development of our two brands, on a corporate basis, we will continue to make strategic investments in the right talent to help drive the transformation and diligently manage our supply chain, gross margin, SG&A expenses, and cash flow,” Ardrey concluded.
Non-GAAP Numbers
The current year non-GAAP fourth quarter income statement numbers referenced below exclude the previously outlined charges for goodwill and intangible asset impairment; net inventory and purchase order-related adjustments; severance, retention, and stock-based retirement compensation; new CEO sign-on bonus and relocation; amortization of definite-lived intangible assets; and consulting and professional fees primarily associated with strategic initiatives. The current year non-GAAP fiscal year income statement numbers also exclude the previously outlined charges for cost savings initiatives and the CEO search, store and right-of-use asset impairment charges, and goodMRKT exit costs. The prior year non-GAAP fourth quarter and fiscal year income statement numbers referenced below exclude the previously outlined intangible asset amortization and store impairment charges.
Fourth Quarter Details
Current year fourth quarter Vera Bradley Direct segment revenues totaled $99.5 million, a 4.6% decrease from $104.4 million in the prior year fourth quarter. Comparable sales decreased 4.5% from the prior year. The Company permanently closed 19 Full-Line stores and one Factory store and opened five Factory stores in the last twelve months.
Vera Bradley Indirect segment revenues totaled $16.7 million, a 28.5% increase over $13.0 million in the prior year fourth quarter. The increase was broad-based with both specialty and key accounts posting year-over-year sales gains.
Pura Vida segment revenues totaled $30.9 million, a 4.2% decrease from $32.2 million in the prior year fourth quarter. The decline was primarily related to lower wholesale sales, partially offset by new store openings.
Fourth quarter consolidated gross profit totaled $60.0 million, or 40.8% of net revenues, compared to $76.1 million, or 50.9% of net revenues, in the prior year fourth quarter. On a non-GAAP basis, current year consolidated gross profit totaled $71.3 million, or 48.5% of net revenues. The current year gross profit rate primarily was negatively affected by higher inbound and outbound freight expense and increased promotional activity, partially offset by price increases.
Consolidated SG&A expense totaled $70.0 million, or 47.6% of net revenues, compared to $67.9 million, or 45.4% of net revenues, in the prior year fourth quarter. On a non-GAAP basis, consolidated SG&A expense totaled $64.4 million, or 43.8% of net revenues, compared to $67.1 million, or 44.8% of net revenues, in the prior year fourth quarter. Vera Bradley’s SG&A current year expenses were lower than the prior year primarily due to cost reduction initiatives and a reduction in variable-related expenses due to the lower sales volume.
The Company’s fourth quarter consolidated operating loss totaled ($49.8) million, or (33.8%) of net revenues, compared to operating income of $8.3 million, or 5.5% of net revenues, in the prior year fourth quarter. On a non-GAAP basis, fourth quarter consolidated operating income totaled $7.0 million, or 4.8% of net revenues, compared to $9.1 million, or 6.1% of net revenues, in the prior year.
By segment:
Vera Bradley Direct fourth quarter operating income was $18.5 million, or 18.6% of Direct net revenues, compared to $21.7 million, or 20.7% of Direct net revenues, in the prior year. On a non-GAAP basis, current year Direct fourth quarter operating income was $19.8 million, or 19.9% of Direct net revenues, compared to $21.7 million, or 20.8% of Direct net revenues, in the prior year.
Vera Bradley Indirect fourth quarter operating income was $4.6 million, or 27.3% of Indirect net revenues, compared to $2.9 million, or 22.5% of Indirect net revenues, in the prior year. On a non-GAAP basis, current year Indirect fourth quarter operating income was $5.3 million, or 32.0% of Indirect net revenues.
Pura Vida’s current year fourth quarter operating loss was ($49.8) million, or (161.2%) of Pura Vida net revenues, compared to operating income of $2.0 million, or 6.2% of Pura Vida net revenues, in the prior year. On a non-GAAP basis, Pura Vida’s current year fourth quarter operating income was $0.4 million, or 1.3% of Pura Vida net revenues, compared to $2.8 million, or 8.6% of Pura Vida net revenues, in the prior year.
Details for the Fiscal Year
Vera Bradley Direct segment revenues for the current fiscal year totaled $328.2 million, 7.5% decrease from $354.9 million in the prior year. Comparable sales declined 9.5% for the fiscal year.
Vera Bradley Indirect segment revenues for the fiscal year totaled $73.3 million, an 11.1% increase over $66.0 million in the prior year, primarily reflecting an increase in certain key account orders.
Current year Pura Vida segment revenues totaled $98.4 million, a 17.7% decrease from $119.6 million in the prior year. Pura Vida’s e-commerce revenues continue to be negatively impacted by the shift in social and digital media effectiveness and rising digital media costs, and a decline in sales to wholesale accounts.
Consolidated gross profit for the current fiscal year totaled $238.9 million, or 47.8% of net revenues, compared to $287.9 million, or 53.3% of net revenues, last year. On a non-GAAP basis, gross profit for the current fiscal year totaled $257.2 million, or 51.4% of net revenues. The current year gross profit rate primarily was negatively affected by higher inbound and outbound freight expense and increased promotional activity, partially offset by price increases.
For the fiscal year, consolidated SG&A expense totaled $265.0 million, or 53.0% of net revenues, compared to $262.0 million, or 48.5% of net revenues, in the prior year. On a non-GAAP basis, SG&A expense totaled $245.3 million, or 49.1% of net revenues, in the current year, compared to $258.8 million, or 47.9% of net revenues, in the prior year. Vera Bradley’s SG&A current year expenses were lower than the prior year primarily due to cost reduction initiatives and a reduction in variable-related expenses due to the lower sales volume.
For the fiscal year, the Company’s consolidated operating loss totaled ($94.9) million, or (19.0%) of net revenues, compared to operating income of $26.9 million, or 5.0% of net revenues, in the prior year. On a non-GAAP basis, the Company’s consolidated operating income was $12.3 million, or 2.5% of net revenues, compared to $30.1 million, or 5.6% of net revenues, in the prior year.
By segment:
Vera Bradley Direct operating income was $51.1 million, or 15.6% of Direct net revenues, compared to $73.5 million, or 20.7% of Direct net revenues, in the prior year. On a non-GAAP basis, Direct operating income was $58.3 million, or 17.8% of Direct net revenues, for the current year, compared to $73.6 million, or 20.7% of Direct net revenues, in the prior year.
Vera Bradley Indirect operating income was $23.0 million, or 31.3% of Indirect net revenues, compared to $20.3 million, or 30.8% of Indirect net revenues, in the prior year. On a non-GAAP basis, current year Indirect operating income totaled $24.7 million, or 33.7% of Indirect net revenues.
Pura Vida’s operating loss was ($78.6) million, or (79.9%) of Pura Vida net revenues, compared to operating income of $9.5 million, or 8.0% of Pura Vida net revenues, in the prior year. On a non-GAAP basis, Pura Vida’s operating income was $4.7 million, or 4.8% of Pura Vida net revenues, compared to $12.6 million, or 10.5% of Pura Vida net revenues, in the prior year.
Balance Sheet
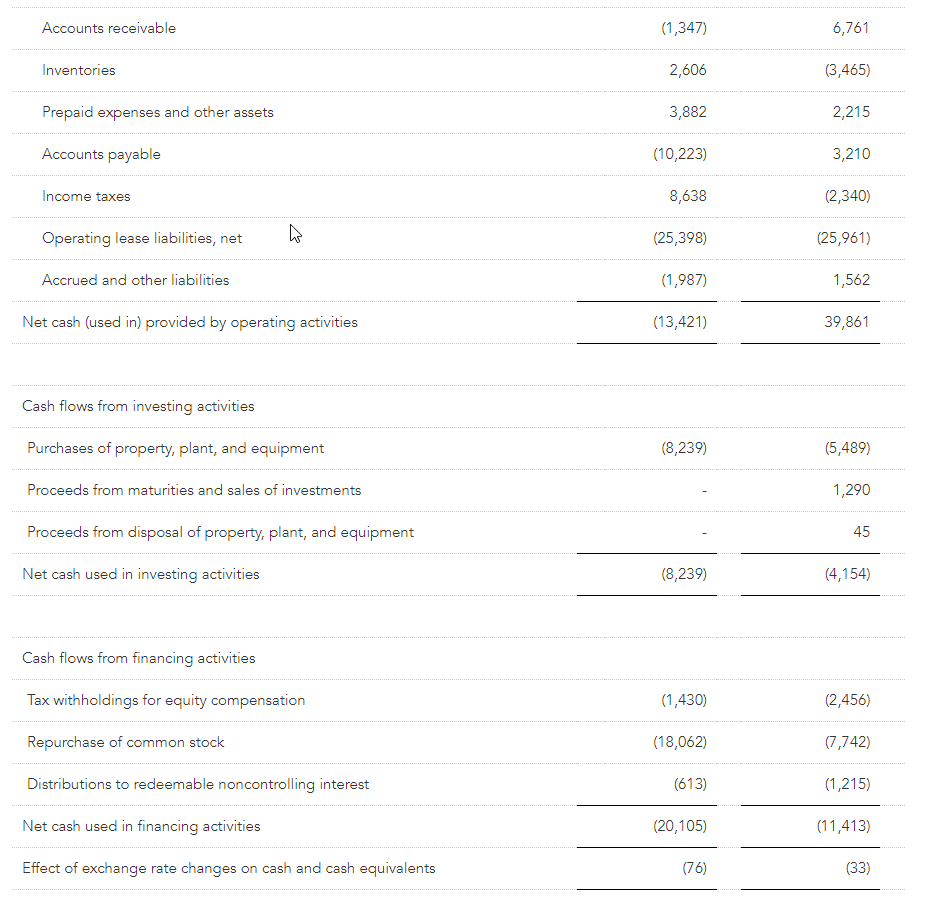
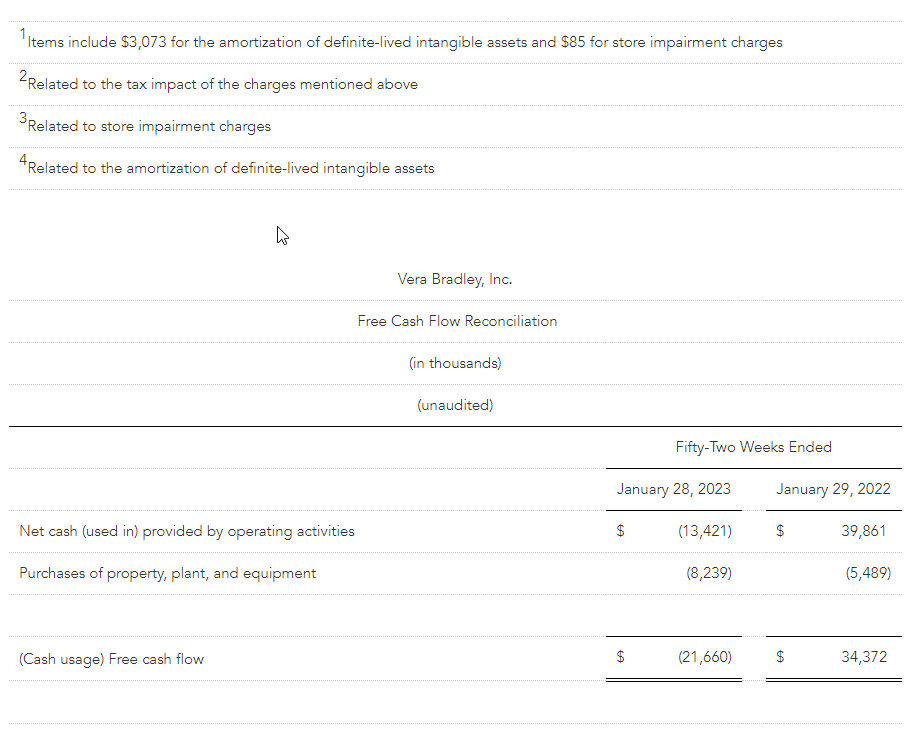
Net capital spending for the fiscal year totaled $8.2 million compared to $5.5 million in the prior year.
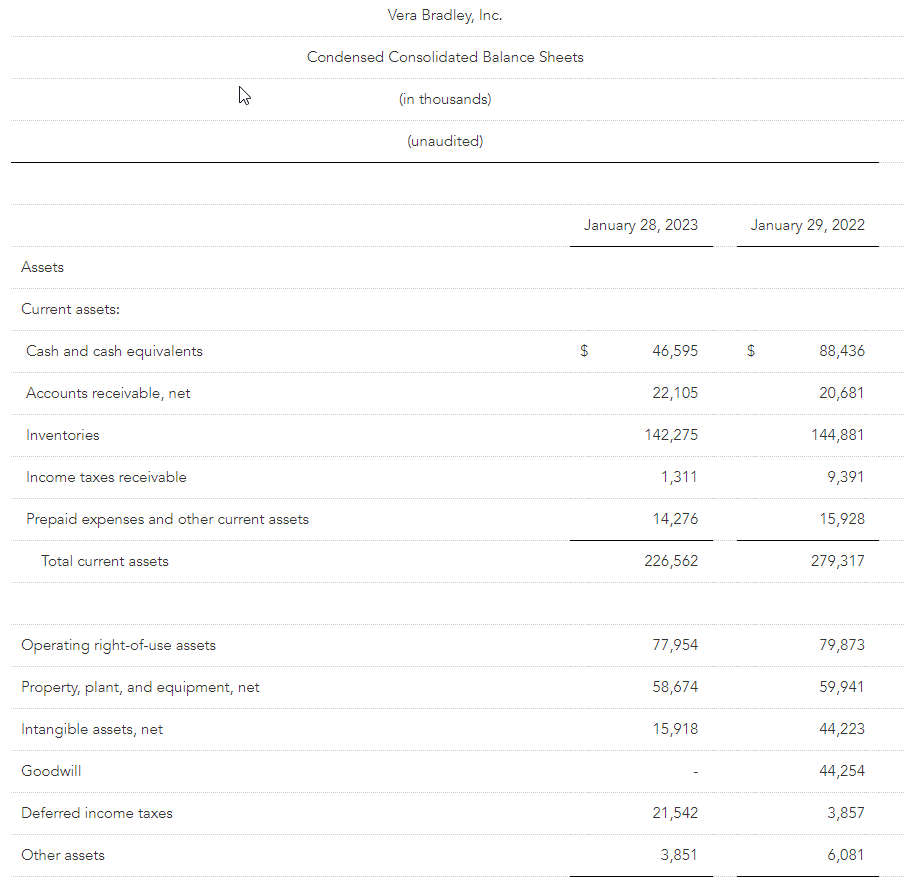
Cash and cash equivalents as of January 28, 2023 totaled $46.6 million compared to $88.4 million at the prior fiscal year end. The Company had no borrowings on its $75 million ABL credit facility at fiscal year end.
Total fiscal year-end inventory was $142.3 million, compared to $144.9 million at last fiscal year end. Total current year inventory was lower than the prior year primarily due to inventory adjustments associated with excess and discounted inventory, partially offset by incremental logistics costs burdening overall inventory.
During the fourth quarter, the Company repurchased approximately $0.8 million of its common stock (approximately 187,000 shares at an average price of $4.20), bringing the Company’s Fiscal 2023 purchases to $18.1 million (approximately 2.8 million shares at an average price of $6.40). The Company’s $50.0 million share repurchase authorization expires in December 2024. Since Fiscal 2015, the Company has repurchased $132.9 million, or approximately 12.1 million shares, of its common stock.
Forward Outlook
Management is providing estimates for the fiscal year ending February 3, 2024 (“Fiscal 2024”) based on current macroeconomic trends and expectations. Ardrey noted, “We anticipate the Fiscal 2024 macroeconomic environment to continue to be unpredictable and that this year will be a rebuilding year for both of our brands. We expect to take advantage of gross margin improvement opportunities and manage our expense structure diligently.”
The Company is not providing detailed guidance for the first fiscal quarter of 2024 but expects revenues and diluted loss per share to be approximately in line with the prior year. Ardrey stated, “In the first quarter, we will work to stabilize the business. We hope to see momentum build as the year progresses.”
Excluding net revenues, all forward-looking guidance numbers referenced below are non-GAAP. The prior year income statement numbers exclude the previously disclosed charges for goodwill and intangible asset impairment; net inventory and purchase order-related adjustments; severance, retention, and stock-based retirement compensation; consulting and professional fees primarily associated with cost savings initiatives, the CEO search, and strategic initiatives; amortization of definite-lived intangible assets; store and right-of-use asset impairment charges; new CEO sign-on bonus and relocation; and goodMRKT exit costs. Current year guidance excludes any similar charges.
For Fiscal 2024, the Company’s expectations are as follows:
Consolidated net revenues of $490 to $510 million. Net revenues totaled $500.0 million in Fiscal 2023. Both Vera Bradley and Pura Vida revenues are expected to be approximately flat on a year-over-year basis.
A consolidated gross profit percentage of 52.6% to 53.6% compared to 51.4% in Fiscal 2023. The expected year-over-year increase is primarily related to reduced inbound freight expense, partially offset by deleveraged overhead costs related to reduced inventory purchases.
Consolidated SG&A expense of $241 to $251 million compared to $245.3 million in Fiscal 2023. Year-over-year changes in SG&A expense primarily are being driven by restoring short-term and long-term incentive compensation to normal levels, offset by Company-wide cost reduction initiatives.
Consolidated operating income of $17.3 to $21.7 million compared to $12.3 million in Fiscal 2023.
Free cash flow of between $25 and $30 million compared to a cash usage of $21.7 million in Fiscal 2023.
Consolidated diluted EPS of $0.40 to $0.50 based on diluted weighted-average shares outstanding of 31.0 million and an effective tax rate of approximately 28%. Diluted EPS totaled $0.24 last year.
Net capital spending of approximately $5 million compared to $8.2 million in the prior year, reflecting investments associated with new Vera Bradley Factory stores and technology and logistics enhancements.
Disclosure Regarding Non-GAAP Measures
The Company’s management does not, nor does it suggest that investors should, consider the supplemental non-GAAP financial measures in isolation from, or as a substitute for, financial information prepared in accordance with accounting principles generally accepted in the United States (“GAAP”). Further, the non-GAAP measures utilized by the Company may be unique to the Company, as they may be different from non-GAAP measures used by other companies.
The Company believes that the non-GAAP measures presented in this earnings release, including (cash usage) free cash flow; cost of sales; gross profit; selling, general, and administrative expenses; impairment of goodwill and intangible assets; operating (loss) income; net (loss) income; net (loss) income attributable and available to Vera Bradley, Inc.; and diluted net (loss) income per share available to Vera Bradley, Inc. common shareholders, along with the associated percentages of net revenues, are helpful to investors because they allow for a more direct comparison of the Company’s year-over-year performance and are consistent with management’s evaluation of business performance. A reconciliation of the non-GAAP measures to the most directly comparable GAAP measures can be found in the Company’s supplemental schedules included in this earnings release.
Call Information
A conference call to discuss results for the fourth quarter and fiscal year is scheduled for today, Wednesday, March 8, 2023, at 9:30 a.m. Eastern Time. A broadcast of the call will be available via Vera Bradley’s Investor Relations section of its website, www.verabradley.com. Alternatively, interested parties may dial into the call at (888) 204-4368, and enter the access code 3761893. A replay will be available shortly after the conclusion of the call and remain available through March 22, 2023. To access the recording, listeners should dial (844) 512-2921, and enter the access code 3761893.
About Vera Bradley, Inc.
Vera Bradley, Inc. operates two unique lifestyle brands – Vera Bradley and Pura Vida. Vera Bradley and Pura Vida are complementary businesses, both with devoted, emotionally-connected, and multi-generational female customer bases; alignment as casual, comfortable, affordable, and fun brands; positioning as “gifting” and socially-connected brands; strong, entrepreneurial cultures; a keen focus on community, charity, and social consciousness; multi-channel distribution strategies; and talented leadership teams aligned and committed to the long-term success of their brands.
Vera Bradley, based in Fort Wayne, Indiana, is a leading designer of women’s handbags, luggage and other travel items, fashion and home accessories, and unique gifts. Founded in 1982 by friends Barbara Bradley Baekgaard and Patricia R. Miller, the brand is known for its innovative designs, iconic patterns, and brilliant colors that inspire and connect women unlike any other brand in the global marketplace.
In July 2019, Vera Bradley, Inc. acquired a 75% interest in Creative Genius, Inc., which also operates under the name Pura Vida Bracelets (“Pura Vida”). Pura Vida, based in La Jolla, California, is a digitally native, highly-engaging lifestyle brand founded in 2010 by friends Paul Goodman and Griffin Thall. Pura Vida has a differentiated and expanding offering of bracelets, jewelry, and other lifestyle accessories. The Company acquired the remaining 25% of Pura Vida in January 2023, subsequent to the end of Fiscal 2023.
The Company has three reportable segments: Vera Bradley Direct (“VB Direct”), Vera Bradley Indirect (“VB Indirect”), and Pura Vida. The VB Direct business consists of sales of Vera Bradley products through Vera Bradley Full-Line and Factory stores in the United States, www.verabradley.com, www.verabradley.ca, Vera Bradley’s online outlet site, and the Vera Bradley annual outlet sale in Fort Wayne, Indiana. The VB Indirect business consists of sales of Vera Bradley products to approximately 1,700 specialty retail locations throughout the United States, as well as select department stores, national accounts, third party e-commerce sites, and third-party inventory liquidators, and royalties recognized through licensing agreements related to the Vera Bradley brand. The Pura Vida segment consists of sales of Pura Vida products through the Pura Vida websites, www.puravidabracelets.com, www.puravidabracelets.eu, and www.puravidabracelets.ca; through the distribution of its products to wholesale retailers and department stores; and through its Pura Vida retail stores.
Website Information
We routinely post important information for investors on our website www.verabradley.com in the “Investor Relations” section. We intend to use this webpage as a means of disclosing material, non-public information and for complying with our disclosure obligations under Regulation FD. Accordingly, investors should monitor the Investor Relations section of our website, in addition to following our press releases, SEC filings, public conference calls, presentations and webcasts. The information contained on, or that may be accessed through, our webpage is not incorporated by reference into, and is not a part of, this document.
Investors and other interested parties may also access the Company’s most recent Corporate Responsibility and Sustainability Report outlining its ESG (Environmental, Social, and Governance) initiatives at https://verabradley.com/pages/corporate-responsibility.
Vera Bradley Safe Harbor Statement
Certain statements in this release are “forward-looking statements” made pursuant to the safe-harbor provisions of the Private Securities Litigation Reform Act of 1995. Such forward-looking statements reflect the Company’s current expectations or beliefs concerning future events and are subject to various risks and uncertainties that may cause actual results to differ materially from those that we expected, including: possible adverse changes in general economic conditions and their impact on consumer confidence and spending; possible inability to predict and respond in a timely manner to changes in consumer demand; possible loss of key management or design associates or inability to attract and retain the talent required for our business; possible inability to maintain and enhance our brands; possible inability to successfully implement the Company’s long-term strategic plans; possible inability to successfully open new stores, close targeted stores, and/or operate current stores as planned; incremental tariffs or adverse changes in the cost of raw materials and labor used to manufacture our products; possible adverse effects resulting from a significant disruption in our distribution facilities; or business disruption caused by pandemics. Risks, uncertainties, and assumptions also include the possibility that Pura Vida acquisition benefits may not materialize as expected and that Pura Vida’s business may not perform as expected. More information on potential factors that could affect the Company’s financial results is included from time to time in the “Risk Factors” and “Management’s Discussion and Analysis of Financial Condition and Results of Operations” sections of the Company’s public reports filed with the SEC, including the Company’s Form 10-K for the fiscal year ended January 29, 2022. We undertake no obligation to publicly update or revise any forward-looking statement. Financial schedules are attached to this release.
CONTACTS: Investors: Julia Bentley, VP of Investor Relations and Communications jbentley@verabradley.com (260) 207-5116
Net sales were $1.95 billion, down 4 percent; comparable sales up 1 percent
Gained market share across multiple product categories in North America in 2022
Achieved quarterly sequential margin improvement in EMEA as pricing actions took hold
Realized double-digit sales and profit growth in the International segment
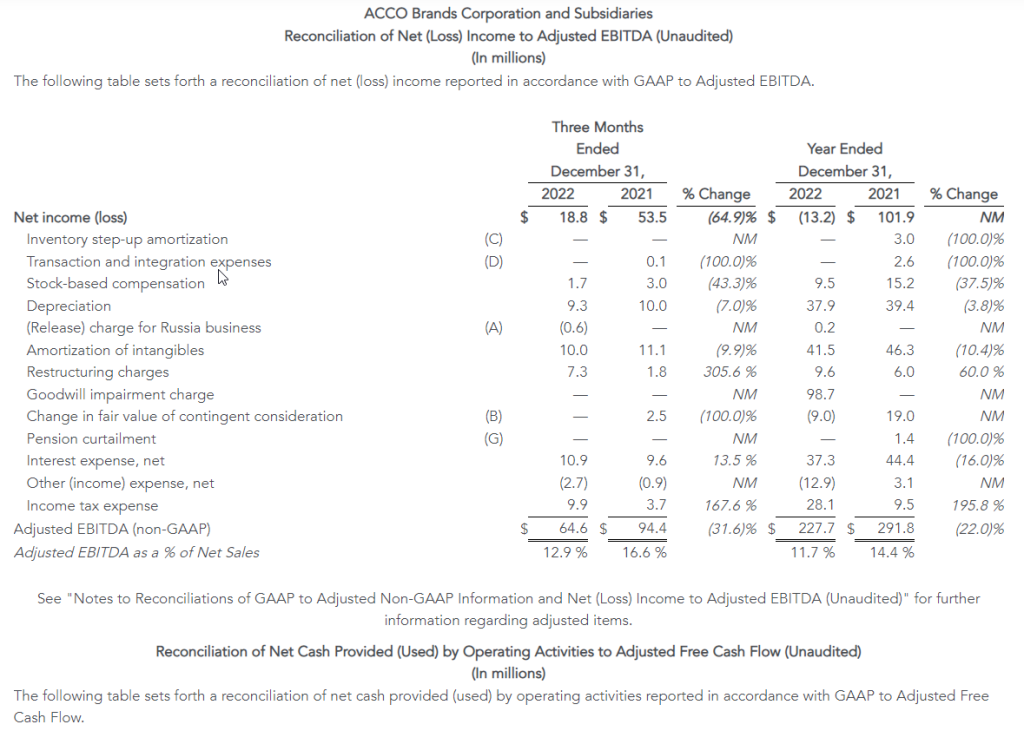
Generated $78 million of cash from operations; adjusted free cash flow of $78 million
During fourth quarter of 2022 actioned annual cost savings of $13 million from significant restructuring initiatives
Full year 2023 outlook anticipates margin expansion and profit growth
LAKE ZURICH, Ill.–(BUSINESS WIRE)– ACCO Brands Corporation (NYSE: ACCO) today announced its fourth quarter and full year results for the period ended December 31, 2022.
“We delivered 1% comparable sales growth in 2022 as we continue to execute on our strategic transformation, including expanding our product categories, broadening our geographic reach and bringing innovative new consumer-centric products to market. This enabled us to achieve market share gains with many of our brands, including Five Star®, Kensington®, Mead®, Quartet® and AT-A-GLANCE®. These successes give us confidence that our strategy of being a more consumer, brand and technology centric company and our portfolio of strong brands will position us to deliver sustainable organic growth over the long-term,” said Boris Elisman, Chairman and Chief Executive Officer of ACCO Brands.
“In 2023 our top priority is to restore our margin profile through incremental pricing actions implemented in January of 2023, the restructuring initiatives undertaken during the fourth quarter of 2022 and the additional productivity programs we will implement in 2023. We expect these actions will drive margin expansion and profit growth for the full year of 2023. With our expected continued strong cash flow in 2023, we will support our quarterly dividend, pay down debt and continue to invest in new product development and go-to-market initiatives, which we expect will better position us for future growth,” added Elisman.
Fourth Quarter Results
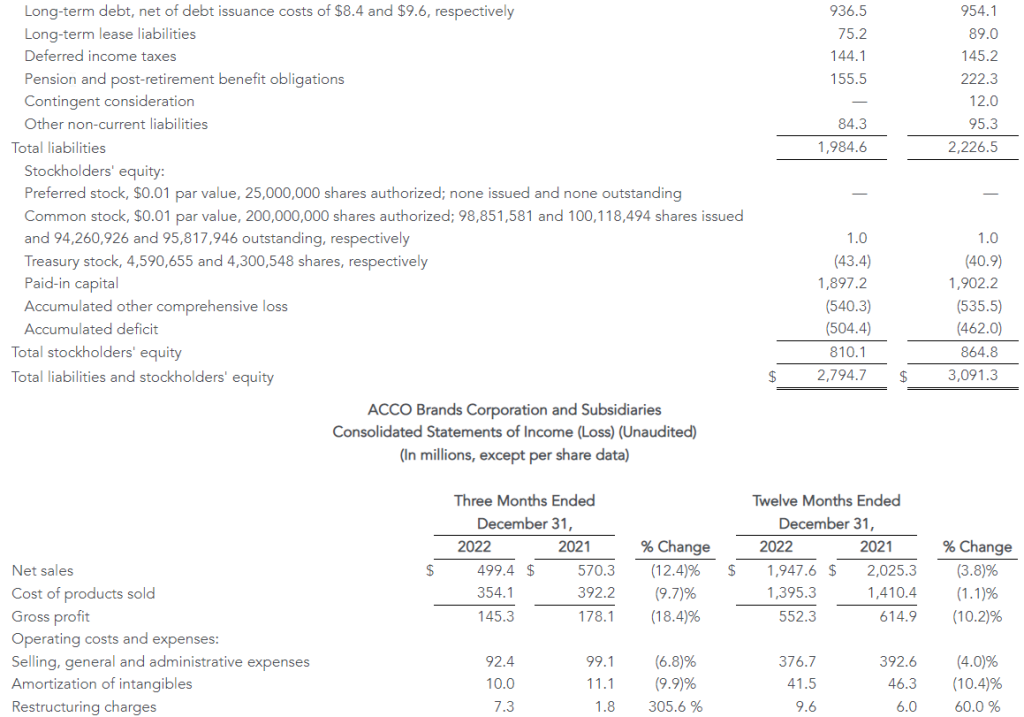
Net sales declined 12.4 percent to $499.4 million from $570.3 million in 2021. Adverse foreign exchange reduced sales $25.5 million, or 4.5 percent. Comparable sales fell 7.9 percent. Both reported and comparable sales declines were due to weaker sales of gaming accessories, lower inventory replenishment by our retailer customers and reduced volumes due to a deterioration in the macroeconomic environment. These more than offset global price increases.
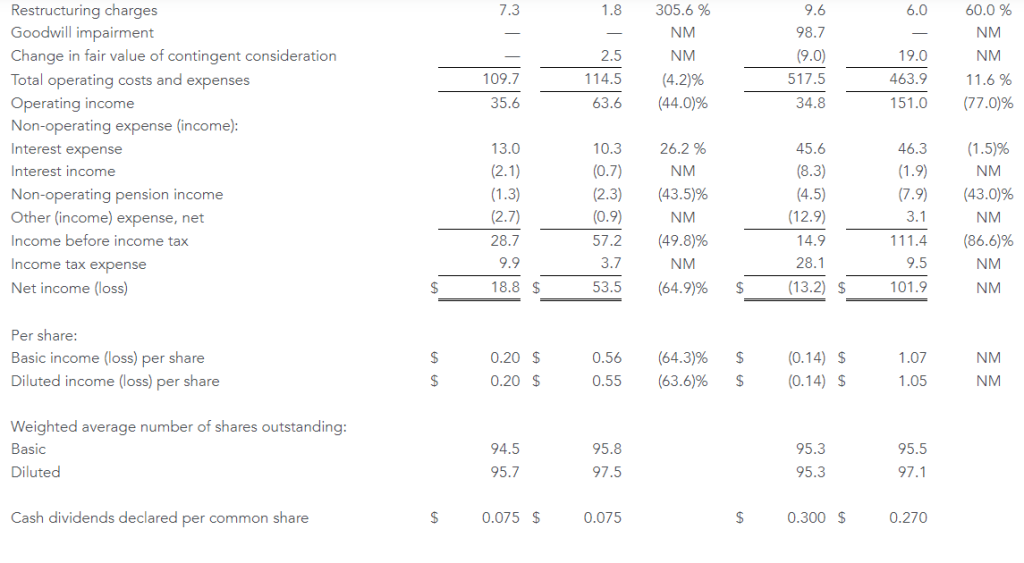
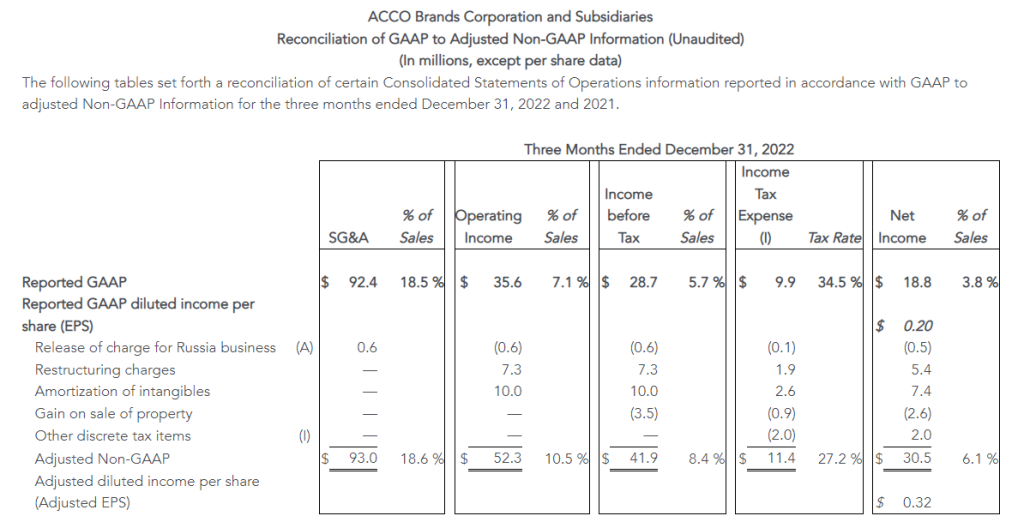
Operating income was $35.6 million versus $63.6 million in 2021, and adjusted operating income decreased to $52.3 million from $79.1 million in the prior year. Both reported and adjusted operating income reflect the impact of lower sales volumes and higher inflation on raw materials, finished goods and transportation costs, which was partially offset by price increases, and reduced SG&A expense due to lower incentive compensation expense. Adverse foreign exchange reduced operating income by $2.2 million.
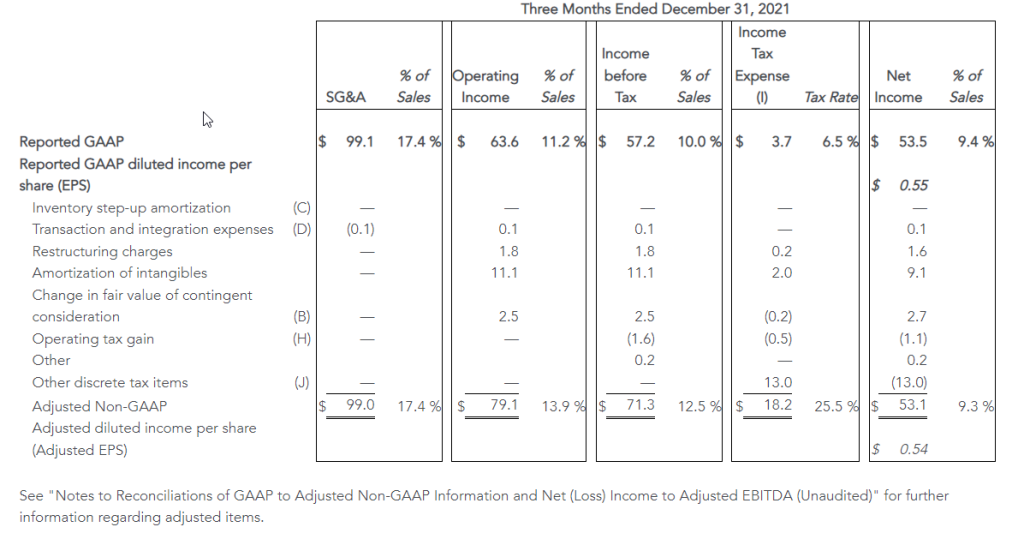
The Company reported net income of $18.8 million, or $0.20 per share, compared with prior year net income of $53.5 million, or $0.55 per share, which included $13.0 million of favorable discrete tax items. Adjusted net income was $30.5 million, or $0.32 per share, compared with $53.1 million, or $0.54 per share in 2021. The remaining declines in underlying reported net income, as well as adjusted net income were due to the items noted above in operating income.
Full Year Results
Net sales decreased 3.8 percent to $1.95 billion from $2.03 billion in 2021. The unfavorable impact of foreign exchange reduced sales by $93.9 million, or 4.6 percent. Comparable sales increased 0.8 percent. Both reported and comparable sales reflect the benefit of higher prices in all segments and strong volume growth in the International segment, partially offset by weaker sales of gaming accessories, and lower volumes in North America and EMEA due to the challenging macroeconomic environment.
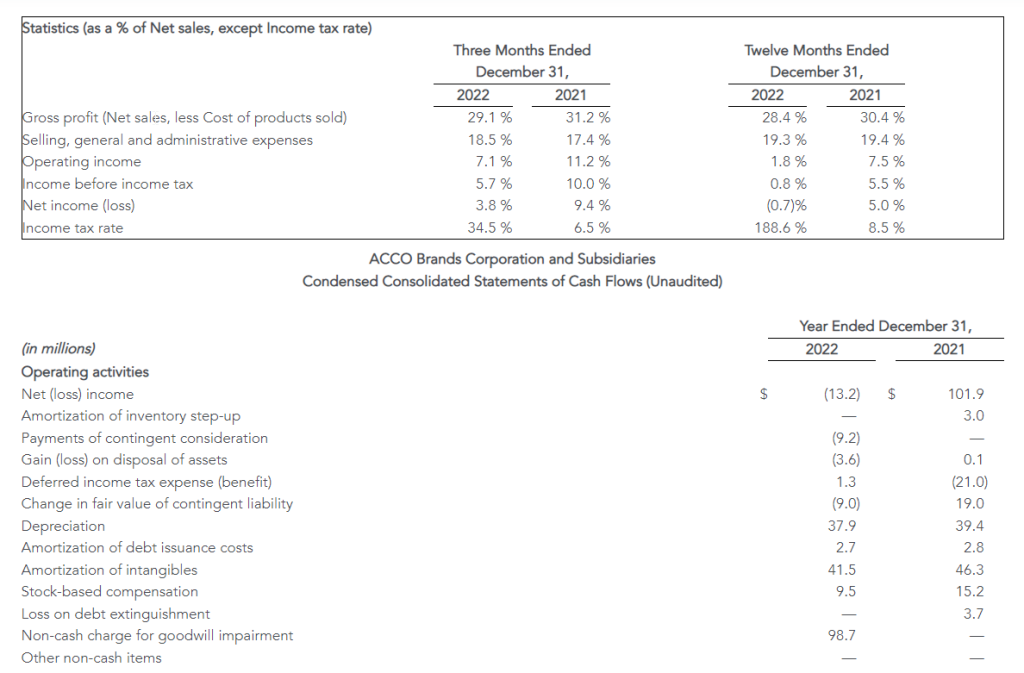
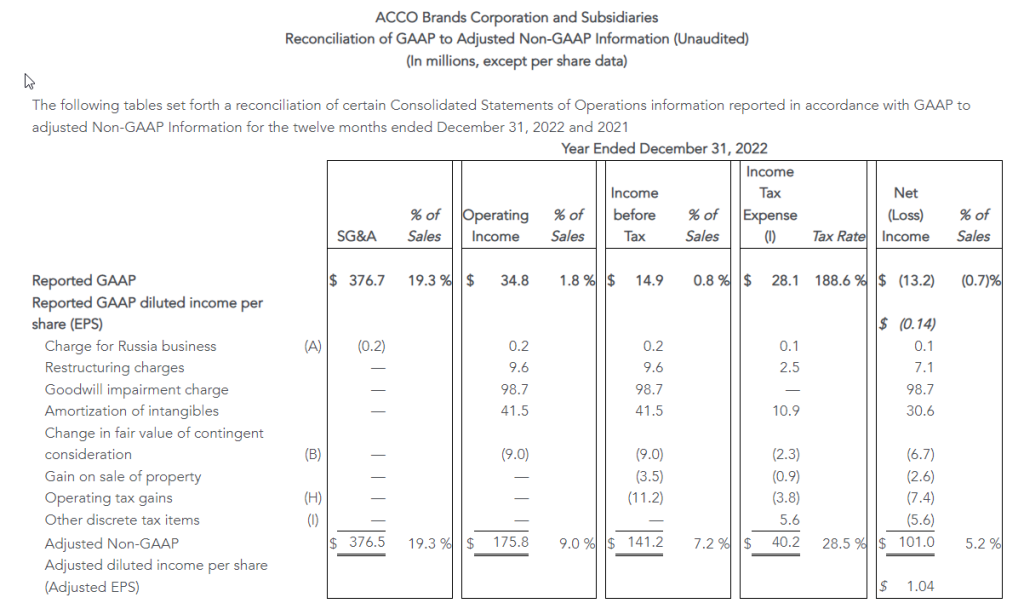
Operating income was $34.8 million compared to $151.0 million in 2021, with the decline primarily due to the non-cash goodwill impairment charge of $98.7 million, partially offset by the favorable change in fair value of $28.0 million related to the PowerA contingent earnout. Adjusted operating income declined to $175.8 million from $227.9 million in 2021. The declines in both reported and adjusted operating income also reflect the impact of inflation that exceeded the benefit of price increases, and reduced volumes, partially offset by reduced SG&A expense which includes lower incentive compensation expense. Unfavorable foreign exchange reduced operating income by $6.3 million.
Net loss was $13.2 million, or ($0.14) per share, compared with net income of $101.9 million, or $1.05 per share, in 2021. The current year net loss includes $98.7 million in non-cash goodwill impairment charges, mitigated by the favorable change in fair value of the contingent earnout consideration of $20.9 million. Prior year net income also included $19.7 million of additional favorable discrete tax items, partially offset by $9.9 million of expenses related to the debt refinancing. Adjusted net income was $101.0 million, compared with $136.8 million in 2021, and adjusted earnings per share were $1.04 compared with $1.41 in 2021. The remaining declines in reported net income and adjusted net income reflect the changes noted above for adjusted operating income, partially offset by higher interest income due to higher cash balances and increased interest rates in Brazil. Interest expense was similar to the prior year.
Capital Allocation and Dividend
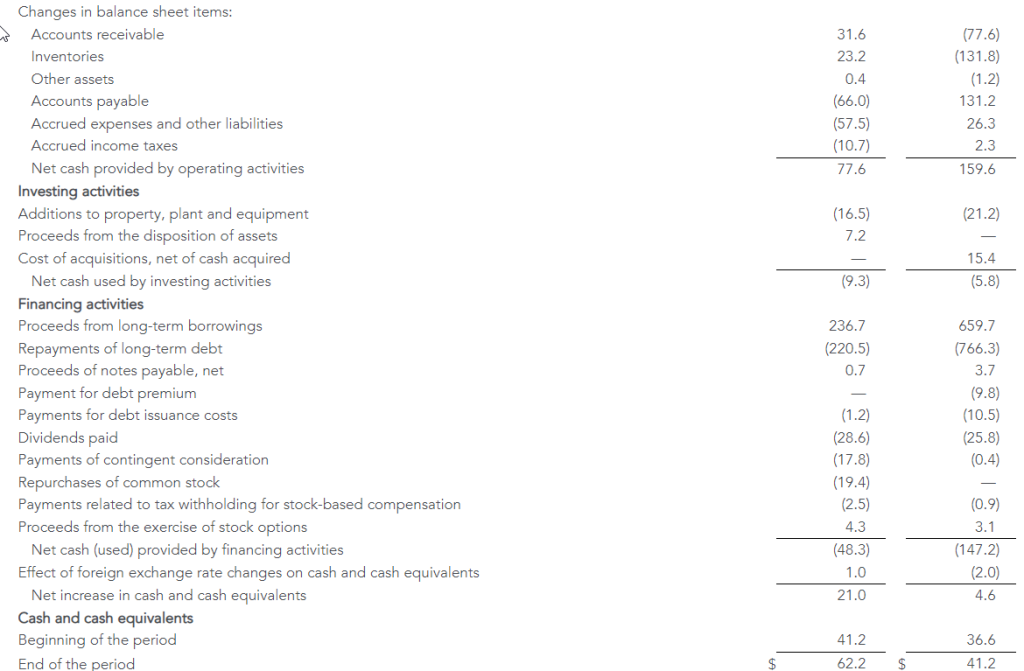
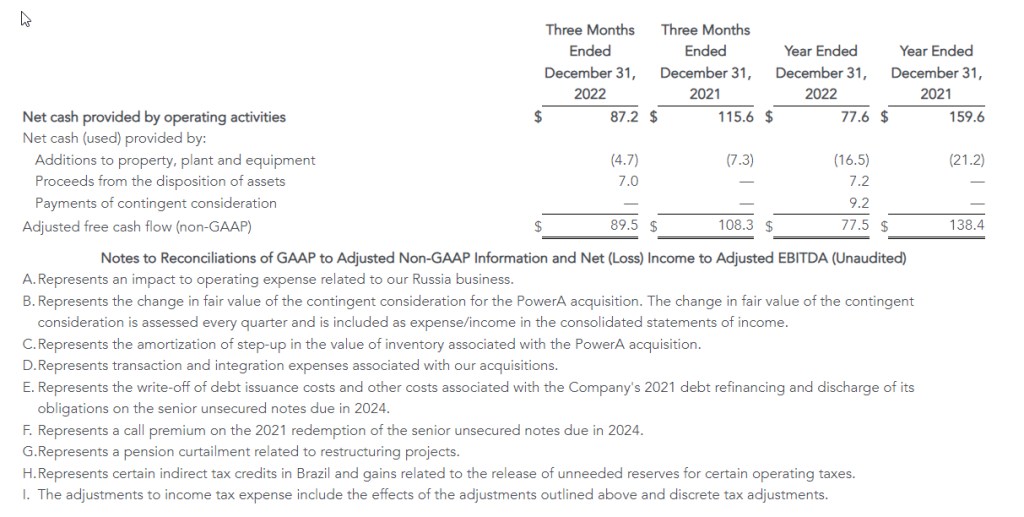
For the full year, the Company’s cash generated by operating activities was $77.6 million versus $159.6 million in the prior year. Adjusted free cash flow in 2022 was $77.5 million, reflecting net investing activity and excluding the operating component of the contingent earnout payment. In 2022 the Company paid $28.6 million in dividends, repurchased 2.7 million shares for $19.4 million and fully paid $27.0 million related to the 2021 PowerA contingent earnout.
ACCO Brands announced on February 17, 2023, that its board of directors declared a regular quarterly cash dividend of $0.075 per share. The dividend will be paid on April 5, 2023, to stockholders of record at the close of business on March 10, 2023.
Restructuring Actions
During the fourth quarter of 2022, the Company developed restructuring plans for both its North America and EMEA operating segments, intended to expand margins through initiatives focused on improving operating efficiency and reducing cost. In the Company’s North America segment, the plan is focused on consolidation of supply chain operations, SKU reduction, automating our sales support process, and sourcing optimization. In the Company’s EMEA segment, the focus is on reducing redundancy and enhancing productivity in its operations, SKU reduction, and sourcing initiatives. The Company anticipates these initiatives will create operating efficiencies and improve profitability, as well as provide for future growth investments. The Company has the following expectations for the restructuring plans:
Targeted annualized operating profit improvement of $13 million, with the vast majority of these savings delivered in 2023
Total profit improvements to be realized approximately 75% through lower SG&A costs and 25% through reduced cost of goods sold
Pre-tax restructuring charges of approximately $7 million were recorded in the fourth quarter, primarily comprised of severance and employee related costs
In addition, the Company has implemented plans to reduce inventory levels, increase inventory turns and improve cash flow and working capital.
Business Segment Results
ACCO Brands North America – Fourth quarter segment net sales of $225.7 million decreased 16.7 percent versus the prior year’s segment net sales of $271.0 million. Adverse foreign exchange reduced sales by 0.6 percent. Comparable sales of $227.3 million were down 16.1 percent. The decrease was primarily due to lower demand for gaming accessories and channel inventory destocking, more than offsetting price increases.
Fourth quarter operating income in North America was $8.9 million versus $34.2 million a year earlier, and adjusted operating income was $18.7 million compared to $41.9 million a year ago, with the decline in both primarily reflecting the impact of lower sales, reduced gross margin rates from negative fixed cost leverage and higher inflation on raw materials, finished goods and transportation costs. In addition, we incurred one-off items in the quarter of $7.8 million, reducing the margin rate by 340 basis points. We anticipate stabilization of product costs in select areas and improved ocean freight rates, which should benefit our margin profile in future periods.
For the full year, 2022 North America net sales of $998.0 million decreased 4.3 percent from $1,042.4 million in 2021, and comparable sales declined 3.9 percent. Higher sales and market share gains in many brands and product categories were more than offset by weaker demand for gaming accessories. Sales were stronger in the first half of 2022, driven by early demand for back-to-school products as retailers pulled their shipments to earlier in the year seeking to secure product for the selling season, while second half sales were challenged by both this pull forward, as well as inventory destocking and a slowdown in demand related to the macroeconomic environment.
In North America, the full year operating loss was $4.9 million versus operating income of $121.9 million in 2021. The loss was primarily due to the $98.7 million non-cash goodwill impairment charge. Adjusted operating income of $121.5 million decreased from $154.6 million in 2021. The decreases to reported operating loss/income and adjusted operating income reflect lower sales volumes and reduced gross margin from higher inflation on raw materials, finished goods and transportation costs.
ACCO Brands EMEA – Fourth quarter segment net sales of $156.0 million decreased 17.0 percent versus the prior year’s segment revenue of $187.9 million. Adverse foreign exchange reduced sales by 11.7 percent. Comparable sales of $177.9 million decreased 5.3 percent versus the prior-year period. Both reported and comparable sales declines were due to lower volumes which more than offset price increases. In Europe, the current energy crisis and significant inflation have created a challenging macroeconomic environment impacting sales.
Fourth quarter operating income in EMEA was $12.7 million versus $21.6 million a year earlier, and adjusted operating income was $18.4 million compared to $24.9 million a year ago. The decreases in both reported operating income and adjusted operating income were due primarily to lower sales and reduced gross margins reflecting negative fixed cost leverage and higher costs for finished goods, raw materials and freight due to significant inflation. In the fourth quarter, EMEA’s operating margin improved on a sequential basis benefiting from pricing actions and deflation in certain product and transportation costs.
Net sales for the full year in the EMEA segment of $580.3 million decreased 12.5 percent from $662.9 million in 2021. The impact of adverse foreign exchange reduced sales $78.2 million, or 11.8 percent. Comparable sales of $658.5 million decreased $4.4 million or 0.7 percent. Both reported and comparable sales declines reflect stronger sales volumes in early 2022 driven by computer accessories and business products, offset by persistent inflation and a challenging demand environment in the second half of the year, as well as the stoppage of sales to Russia.
The EMEA segment posted full-year operating income of $21.7 million compared with operating income of $61.7 million in 2021. Adjusted operating income was $37.0 million, down from $77.2 million in 2021. The declines in both reflects the impact of lower sales volumes and reduced gross margins reflecting higher costs for finished goods, raw materials and freight due to significant inflation and negative fixed cost leverage.
ACCO Brands International – Fourth quarter segment sales of $117.7 million increased 5.7 percent versus the prior year’s segment revenue of $111.4 million. Adverse foreign exchange reduced sales by 1.8 percent. Comparable sales of $119.7 million increased 7.5 percent versus the year-ago period. Both reported and comparable sales increased primarily due to price increases, more than offsetting lower volumes. Strong sales in Brazil benefited from a return to in-person education.
Fourth quarter operating income in the International segment was $22.7 million versus $20.9 million a year earlier, and adjusted operating income was $24.3 million compared to $22.9 million a year ago. The increases in both operating income and adjusted operating income were due primarily to price increases, and the strong performance in our Brazil business.
International segment sales of $369.3 million for the full year increased 15.4 percent from $320.0 million in 2021. Adverse foreign exchange reduced sales by $11.4 million. Comparable sales were $380.7 million, up 19.0 percent, due to increased volume and higher prices, primarily in Latin America from a return of in-person education and work.
Operating income of $50.5 million increased from $31.6 million in 2021. Adjusted operating income of $58.3 million increased from $40.6 million. The increases in both operating and adjusted operating income were primarily due to higher sales volumes, pricing and improved expense leverage.
Commentary and Outlook for 1Q and Full Year 2023
“Our priority in 2023 is to improve our operating profitability and free cash flow through pricing, productivity and restructuring initiatives and more efficient use of working capital. We anticipate that these actions, along with a moderating rate of inflation, will allow us to deliver margin expansion and profit and cash flow growth in 2023. We achieved comparable sales growth in 2022 and are confident in the long term sales potential of our business. Our proven business strategy, which includes geographic diversity, and our strong portfolio of brands and innovative products have us well positioned for continued long term profitable growth,” added Elisman.
“While the current economic environment remains fluid, we have an experienced management team with a proven track record of navigating periods of economic uncertainties. We are also well-capitalized, with no near-term debt maturities and generate consistent free cash flow. We remain confident in our strategic transformation and believe we have taken the right actions to drive long-term shareholder value,” Elisman concluded.
The Company is providing full year 2023 and 1Q outlook. For the full year, we expect comparable sales to be down 3 percent to flat, reflecting a challenging near-term demand environment. Foreign exchange is expected to be neutral to reported revenue. Full year adjusted EPS is expected to rise 4 percent to 8 percent, to $1.08 to $1.12, approaching low double-digit growth in adjusted operating income, partially offset by higher interest and non-cash non-operating pension expenses. 2023 free cash flow is expected to grow to at least $100 million.
Our quarterly sales and profit projection for 2023 will reflect a different cadence than last year. In 2022, the Company experienced good sales growth in the first half of the year reflecting strong demand from the post-pandemic economic recovery. In addition, North America sales benefited from the pull forward of purchases by retailers to ensure product availability for back-to-school. Concerns about the economy, the war in Ukraine and related energy crisis in EMEA challenged demand and our sales in the second half of 2022. In addition, our retail customers proactively curtailed purchases in the back half of the year to aggressively reduce their inventory levels. Against these comparisons, we are projecting our sales to be down in both the first quarter and first half of 2023, with growth anticipated in the second half of the year.
In the first quarter, we expect comparable sales to decline 10 percent to 7 percent, primarily due to the timing of back-to-school shipments and lower sales of gaming accessories in North America, partially offset by higher sales in our International segment. First quarter adjusted EPS is expected to be $0.05 to $0.07 with higher gross margins offset by sales deleveraging, higher interest and non-cash, non-operating pension expenses.
Webcast
At 8:30 a.m. ET on February 24, 2023, ACCO Brands Corporation will host a conference call to discuss the Company’s fourth quarter and full year 2022 results. The call will be broadcast live via webcast. The webcast can be accessed through the Investor Relations section of www.accobrands.com. The webcast will be in listen-only mode and will be available for replay following the event.
About ACCO Brands Corporation
ACCO Brands, the Home of Great Brands Built by Great People, designs, manufactures and markets consumer and end-user products that help people work, learn, play and thrive. Our widely recognized brands include AT-A-GLANCE®, Five Star®, Kensington®, Leitz®, Mead®, PowerA®, Swingline®, Tilibra® and many others. More information about ACCO Brands Corporation (NYSE: ACCO) can be found at www.accobrands.com.
Non-GAAP Financial Measures
In addition to financial results reported in accordance with generally accepted accounting principles (GAAP), we have provided certain non-GAAP financial information in this earnings release to aid investors in understanding the Company’s performance. Each non-GAAP financial measure is defined and reconciled to its most closely related GAAP financial measure in the “About Non-GAAP Financial Measures” section of this earnings release.
Forward-Looking Statements
Statements contained herein, other than statements of historical fact, particularly those anticipating future financial performance, business prospects, growth, strategies, business operations and similar matters, results of operations, liquidity and financial condition, are “forward-looking statements” within the meaning of the Private Securities Litigation Reform Act of 1995. These statements are based on the beliefs and assumptions of management based on information available to us at the time such statements are made. These statements, which are generally identifiable by the use of the words “will,” “believe,” “expect,” “intend,” “anticipate,” “estimate,” “forecast,” “project,” “plan,” and similar expressions, are subject to certain risks and uncertainties, are made as of the date hereof, and we undertake no duty or obligation to update them. Because actual results may differ materially from those suggested or implied by such forward-looking statements, you should not place undue reliance on them when deciding whether to buy, sell or hold the company’s securities.
Our outlook is based on certain assumptions, which we believe to be reasonable under the circumstances. These include, without limitation, assumptions regarding the impact of the COVID-19 pandemic and the war in Ukraine; the impact of inflation and global economic uncertainties, fluctuations in foreign currency exchange rates and acquisitions; and the other factors described below.
Among the factors that could cause our actual results to differ materially from our forward-looking statements are: our ability to successfully execute our restructuring plans and realize the benefits of our productivity initiatives; our ability to obtain additional price increases and realize longer-term cost reductions; the ongoing impact of the COVID-19 pandemic; a relatively limited number of large customers account for a significant percentage of our sales; issues that influence customer and consumer discretionary spending during periods of economic uncertainty or weakness; risks associated with foreign currency exchange rate fluctuations; challenges related to the highly competitive business environment in which we operate; our ability to develop and market innovative products that meet consumer demands and to expand into new and adjacent product categories that are experiencing higher growth rates; our ability to successfully expand our business in emerging markets and the exposure to greater financial, operational, regulatory, compliance and other risks in such markets; the continued decline in the use of certain of our products; risks associated with seasonality; the sufficiency of investment returns on pension assets, risks related to actuarial assumptions, changes in government regulations and changes in the unfunded liabilities of a multi-employer pension plan; any impairment of our intangible assets; our ability to secure, protect and maintain our intellectual property rights, and our ability to license rights from major gaming console makers and video game publishers to support our gaming business; continued disruptions in the global supply chain; risks associated with inflation and other changes in the cost or availability of raw materials, transportation, labor, and other necessary supplies and services and the cost of finished goods; the continued global shortage of microchips which are needed in our gaming and computer accessories businesses; risks associated with outsourcing production of certain of our products, information technology systems and other administrative functions; the failure, inadequacy or interruption of our information technology systems or its supporting infrastructure; risks associated with a cybersecurity incident or information security breach, including that related to a disclosure of personally identifiable information; our ability to grow profitably through acquisitions; our ability to successfully integrate acquisitions and achieve the financial and other results anticipated at the time of acquisition, including planned synergies; risks associated with our indebtedness, including limitations imposed by restrictive covenants, our debt service obligations, and our ability to comply with financial ratios and tests; a change in or discontinuance of our stock repurchase program or the payment of dividends; product liability claims, recalls or regulatory actions; the impact of litigation or other legal proceedings; our failure to comply with applicable laws, rules and regulations and self-regulatory requirements, the costs of compliance and the impact of changes in such laws; our ability to attract and retain qualified personnel; the volatility of our stock price; risks associated with circumstances outside our control, including those caused by public health crises, such as the occurrence of contagious diseases like COVID-19, severe weather events, war, terrorism and other geopolitical incidents; and other risks and uncertainties described in “Part I, Item 1A. Risk Factors” in our Annual Report on Form 10-K for the year ended December 31, 2021, “Part II, Item 1A Risk Factors” in our Quarterly Report on Form 10-Q for the quarter ended September 30, 2022 and in other reports we file with the Securities and Exchange Commission.
About Non-GAAP Financial Measures
We explain below how we calculate each of our non-GAAP financial measures and a reconciliation of our current period and historical non-GAAP financial measures to the most directly comparable GAAP financial measures follows.
We use our non-GAAP financial measures both to explain our results to stockholders and the investment community and in the internal evaluation and management of our business. We believe our non-GAAP financial measures provide management and investors with a more complete understanding of our underlying operational results and trends, facilitate meaningful period-to-period comparisons and enhance an overall understanding of our past and future financial performance.
Our non-GAAP financial measures exclude certain items that may have a material impact upon our reported financial results such as restructuring charges, transaction and integration expenses associated with material acquisitions, the impact of foreign currency exchange rate fluctuations and acquisitions, unusual tax items, goodwill impairment charges, and other non-recurring items that we consider to be outside of our core operations. These measures should not be considered in isolation or as a substitute for, or superior to, the directly comparable GAAP financial measures and should be read in connection with the Company’s financial statements presented in accordance with GAAP.
Our non-GAAP financial measures include the following:
Comparable Sales : Represents net sales excluding the impact of material acquisitions with current-period foreign operation sales translated at prior-year currency rates. We believe comparable sales are useful to investors and management because they reflect underlying sales and sales trends without the effect of acquisitions and fluctuations in foreign exchange rates and facilitate meaningful period-to-period comparisons. We sometimes refer to comparable sales as comparable net sales.
Adjusted Gross Profit : Represents gross profit excluding the effect of the amortization of the step-up in inventory from material acquisitions. We believe adjusted gross profit is useful to investors and management because it reflects underlying gross profit without the effect of inventory adjustments resulting from acquisitions that we consider to be outside our core operations and facilitates meaningful period-to-period comparisons.
Adjusted Selling, General and Administrative (SG&A) Expenses : Represents selling, general and administrative expenses excluding transaction and integration expenses related to material acquisitions. We believe adjusted SG&A expenses are useful to investors and management because they reflect underlying SG&A expenses without the effect of expenses related to acquiring and integrating acquisitions that we consider to be outside our core operations and facilitate meaningful period-to-period comparisons.
Adjusted Operating Income/Adjusted Income Before Taxes/Adjusted Net Income/Adjusted Net Income Per Diluted Share :Represents operating income, income before taxes, net income, and net income per diluted share excluding restructuring and goodwill impairment charges, the amortization of intangibles, the amortization of the step-up in value of inventory, the change in fair value of contingent consideration, transaction and integration expenses associated with material acquisitions, non-recurring items in interest expense or other income/expense such as expenses associated with debt refinancing, a bond redemption, or a pension curtailment, and other non-recurring items as well as all unusual and discrete income tax adjustments, including income tax related to the foregoing. We believe these adjusted non-GAAP financial measures are useful to investors and management because they reflect our underlying operating performance before items that we consider to be outside our core operations and facilitate meaningful period-to-period comparisons. Senior management’s incentive compensation is derived, in part, using adjusted operating income and adjusted net income per diluted share, which is derived from adjusted net income. We sometimes refer to adjusted net income per diluted share as adjusted earnings per share or adjusted EPS.
Adjusted Income Tax Expense/Rate :Represents income tax expense/rate excluding the tax effect of the items that have been excluded from adjusted income before taxes, unusual income tax items such as the impact of tax audits and changes in laws, significant reserves for cash repatriation, excess tax benefits/losses, and other discrete tax items. We believe our adjusted income tax expense/rate is useful to investors because it reflects our baseline income tax expense/rate before benefits/losses and other discrete items that we consider to be outside our core operations and facilitates meaningful period-to-period comparisons.
Adjusted EBITDA: Represents net income excluding the effects of depreciation, stock-based compensation expense, amortization of intangibles, the change in fair value of contingent consideration, interest expense, net, other (income) expense, net, and income tax expense, the amortization of the step-up in value of inventory, transaction and integration expenses associated with material acquisitions, restructuring and goodwill impairment charges, non-recurring items in interest expense or other income/expense such as expenses associated with debt refinancing, a bond redemption, or a pension curtailment and other non-recurring items. We believe adjusted EBITDA is useful to investors because it reflects our underlying cash profitability and adjusts for certain non-cash charges, and items that we consider to be outside our core operations and facilitates meaningful period-to-period comparisons.
Adjusted Free Cash Flow: Represents cash flow from operating activities, excluding cash payments made for contingent earnouts, less cash used for additions to property, plant and equipment, plus cash proceeds from the disposition of assets. We believe adjusted free cash flow is useful to investors because it measures our available cash flow for paying dividends, funding strategic material acquisitions, reducing debt, and repurchasing shares.
Consolidated Leverage Ratio: Represents balance sheet debt, plus debt origination costs and less any cash and cash equivalents divided by adjusted EBITDA. We believe that consolidated leverage ratio is useful to investors since the company has the ability to, and may decide to use a portion of its cash and cash equivalents to retire debt.
We also provide forward-looking non-GAAP comparable sales, adjusted earnings per share, adjusted free cash flow, adjusted EBITDA, and adjusted tax rate, and historical and forward-looking consolidated leverage ratio. We do not provide a reconciliation of these forward-looking and historical non-GAAP measures to GAAP because the GAAP financial measure is not currently available and management cannot reliably predict all the necessary components of such non-GAAP measures without unreasonable effort or expense due to the inherent difficulty of forecasting and quantifying certain amounts that are necessary for such a reconciliation, including adjustments that could be made for restructuring, integration and acquisition-related expenses, the variability of our tax rate and the impact of foreign currency fluctuation and material acquisitions, and other charges reflected in our historical results. The probable significance of each of these items is high and, based on historical experience, could be material.
Christopher McGinnis Investor Relations (847) 796-4320
Second Quarter Results Reflect Successful Holiday Performance
Generates Net Income of $82.5 million and Adjusted EBITDA1 of $131 million
Updates Fiscal 2023 Guidance
(1) Refer to “Definitions of Non-GAAP Financial Measures” and the tables attached at the end of this press release for reconciliation of non-GAAP results to applicable GAAP results.)
JERICHO, N.Y.–(BUSINESS WIRE)– 1-800-FLOWERS.COM, Inc. (NASDAQ: FLWS), a leading provider of gifts designed to help inspire customers to give more, connect more, and build more and better relationships, today reported results for its Fiscal 2023 second quarter ended January 1, 2023.
Fiscal 2023 Second Quarter Highlights
Total consolidated revenues decreased 4.8% to $897.9 million, compared with total consolidated revenues of $943.0 million in the prior year period.
Gross profit margin for the quarter was 41.0%, as compared with 40.1% in the prior year period.
Operating expenses were 28.1% of total sales, as compared with 27.9% in the prior year period.
Net income for the quarter was $82.5 million, or $1.27 per diluted share, as compared with net income of $88.5 million, or $1.34 per diluted share in the prior year period.
Adjusted EBITDA1 for the quarter was $131.4 million, as compared to Adjusted EBITDA1 of $133.1 million in the prior year period.
Expands leadership position in personalized gifting marketplace through the acquisition of the Things Remembered® brand, which occurred after the second quarter ended.
Chris McCann, CEO of 1-800-FLOWERS.COM, Inc., said, “Our second quarter results benefited from the strength of our Gourmet Foods and Gift Baskets business with improving gross margins, as well as an enterprise-wide reduction in operating expenses. As we had anticipated, consumers continued to spend for the major holidays and they reverted to their historical shopping patterns, shopping much later in the holiday period. PersonalizationMall.com® kicked off our holiday period with its biggest Cyber Monday ever, and as demand on our platform grew throughout the month of December, Harry & David® achieved record revenues for the quarter on the consumer side of its business. We did see demand soften in corporate gifting, which we attribute to macro-economic pressures and hybrid work environments, whereas a year ago there were fewer in-person holiday get-togethers.”
McCann added, “Our margins began to stabilize during the quarter, as we started to benefit from lower inbound freight costs and strategic pricing initiatives. Margins within our Gourmet Foods and Gift Baskets business also benefited from our logistics optimization and automation initiatives. We expect these favorable trends to continue and further improve our margins throughout the remainder of this fiscal year and beyond.”
“As we look to the balance of the year, we expect consumers to continue to shop and spend for the major upcoming holidays, while continuing to moderate their spend on everyday gifting occasions due to macro inflationary pressures.”
Second Quarter 2023 Financial Results
Total consolidated revenues decreased 4.8% to $897.9 million, as compared with total consolidated revenues of $943.0 million in the prior year period.
Gross profit margin for the quarter was 41.0%, increasing 90 basis points as compared with 40.1% in the prior year period. Gross profit margin improved based on strong performance within our Gourmet Foods and Gift Baskets business, primarily related to strategic pricing initiatives, lower in-bound freight costs, as well as an improvement in labor availability and automation. Operating expenses were 28.1% of total sales, as compared with 27.9% in the prior year period. On a dollar basis, operating expenses declined $10.1 million, primarily reflecting lower marketing costs, as the Company shifted its advertising investments to lower cost, higher return on investment areas of the marketing funnel.
As a result, the Company generated net income of $82.5 million, or $1.27 per diluted share, and Adjusted Net Income1 of $82.7 million, or $1.28 per share, as compared with net income of $88.5 million, or $1.34 per share, and Adjusted Net Income1 of $88.6 million, or $1.34 per share, in the prior year period. Adjusted EBITDA1 for the quarter was $131.4 million, as compared with Adjusted EBITDA1 of $133.1 million in the prior year period.
Segment Results
The Company provides selected financial results for its Gourmet Foods and Gift Baskets, Consumer Floral and Gifts, and BloomNet segments in the tables attached to this release and as follows:
Gourmet Foods and Gift Baskets: Revenues for the quarter decreased 0.4% to $588.4 million, compared with $590.9 million in the prior year period, reflecting the resiliency of our gourmet food gifting businesses. Gross profit margin was 41.0%, compared with 39.3% in the prior year period, benefiting from strategic pricing, lower inbound transportation costs, and automation initiatives. As a result, segment contribution margin1 was $123.5 million, compared with $110.5 million a year ago.
Consumer Floral and Gifts: Revenues decreased 12.1% to $277.0 million, compared with $315.1 million in the prior year period. Gross profit margin decreased to 40.5%, compared with 41.3% in the prior year period, primarily due to higher fulfillment costs and outbound transportation costs. Segment contribution margin1 was $27.9 million, compared with $38.2 million the prior year.
BloomNet: Revenues for the quarter decreased 13.4% to $32.9 million, compared with $37.9 million in the prior year period. Gross profit margin of 42.2% was flat with the prior year. Segment contribution margin1 was $9.3 million, compared with $11.9 million in the prior year period.
Company Guidance
The Company is updating its Fiscal 2023 guidance based on its second quarter performance and the current economic environment. While the highly unpredictable nature of the current macro economy makes it difficult to forecast in this environment, the Company continues to expect that after growing revenues 77% over the past three fiscal years, revenues will decline in Fiscal 2023 on cautious consumer behavior. The Company also anticipates that as a result of the investments it has made, and continues to make, in its business platform, along with strategic pricing programs and a moderation of certain cost inputs, gross margins and bottom-line results will gradually improve during the latter half of the current fiscal year.
Full Year Fiscal 2023 Guidance
Total revenues to decline in the mid-single digit range on a percentage basis as compared with the prior year;
Adjusted EBITDA1 is now expected to be in a range of $80 million to $85 million; and
Free Cash Flow1 to exceed $75 million.
Conference Call
The Company will conduct a conference call to discuss the above details and attached financial results today, Thursday, February 2, at 8:00 a.m. (ET). The conference call will be webcast from the Investors section of the Company’s website at www.1800flowersinc.com. A recording of the call will be posted on the Investors section of the Company’s website within two hours of the call’s completion. A telephonic replay of the call can be accessed beginning at 2:00 p.m. (ET) today through February 9, 2023, at: (US) 1-877-344-7529; (Canada) 855-669-9658; (International) 1-412-317-0088; enter conference ID #: 7691597. If you have any questions regarding the above information, please contact the Investor Relations office at invest@1800flowers.com.
Definitions of non-GAAP Financial Measures:
We sometimes use financial measures derived from consolidated financial information, but not presented in our financial statements prepared in accordance with U.S. generally accepted accounting principles (“GAAP”). Certain of these are considered “non-GAAP financial measures” under the U.S. Securities and Exchange Commission rules. Non-GAAP financial measures referred to in this document are either labeled as “non-GAAP” or designated as such with a “1”. See below for definitions and the reasons why we use these non-GAAP financial measures. Where applicable, see the Selected Financial Information below for reconciliations of these non-GAAP measures to their most directly comparable GAAP financial measures. Reconciliations for forward-looking figures would require unreasonable efforts at this time because of the uncertainty and variability of the nature and amount of certain components of various necessary GAAP components, including, for example, those related to compensation, tax items, amortization or others that may arise during the year, and the Company’s management believes such reconciliations would imply a degree of precision that would be confusing or misleading to investors. For the same reasons, the Company is unable to address the probable significance of the unavailable information. The lack of such reconciling information should be considered when assessing the impact of such disclosures.
EBITDA and Adjusted EBITDA:
We define EBITDA as net income (loss) before interest, taxes, depreciation, and amortization. Adjusted EBITDA is defined as EBITDA adjusted for the impact of stock-based compensation, Non-Qualified Plan Investment appreciation/depreciation, and for certain items affecting period-to-period comparability. See Selected Financial Information for details on how EBITDA and Adjusted EBITDA were calculated for each period presented. The Company presents EBITDA and Adjusted EBITDA because it considers such information meaningful supplemental measures of its performance and believes such information is frequently used by the investment community in the evaluation of similarly situated companies. The Company uses EBITDA and Adjusted EBITDA as factors to determine the total amount of incentive compensation available to be awarded to executive officers and other employees. The Company’s credit agreement uses EBITDA and Adjusted EBITDA to determine its interest rate and to measure compliance with certain covenants. EBITDA and Adjusted EBITDA are also used by the Company to evaluate and price potential acquisition candidates. EBITDA and Adjusted EBITDA have limitations as analytical tools and should not be considered in isolation or as a substitute for analysis of the Company’s results as reported under GAAP. Some of the limitations are: (a) EBITDA and Adjusted EBITDA do not reflect changes in, or cash requirements for, the Company’s working capital needs; (b) EBITDA and Adjusted EBITDA do not reflect the significant interest expense, or the cash requirements necessary to service interest or principal payments, on the Company’s debts; and (c) although depreciation and amortization are non-cash charges, the assets being depreciated and amortized may have to be replaced in the future and EBITDA does not reflect any cash requirements for such capital expenditures. EBITDA and Adjusted EBITDA should only be used on a supplemental basis combined with GAAP results when evaluating the Company’s performance.
Segment Contribution Margin:
We define Segment Contribution Margin as earnings before interest, taxes, depreciation, and amortization, before the allocation of corporate overhead expenses. See Selected Financial Information for details on how Segment Contribution Margin was calculated for each period presented. When viewed together with our GAAP results, we believe Segment Contribution Margin provides management and users of the financial statements meaningful information about the performance of our business segments. Segment Contribution Margin is used in addition to and in conjunction with results presented in accordance with GAAP and should not be relied upon to the exclusion of GAAP financial measures. The material limitation associated with the use of Segment Contribution Margin is that it is an incomplete measure of profitability as it does not include all operating expenses or non-operating income and expenses. Management compensates for these limitations when using this measure by looking at other GAAP measures, such as Operating Income and Net Income.
Adjusted Net Income (Loss) and Adjusted or Comparable Net Income (Loss) Per Common Share:
We define Adjusted Net Income (Loss) and Adjusted or Comparable Net Income (Loss) Per Common Share as Net Income (Loss) and Net Income (Loss) Per Common Share adjusted for certain items affecting period-to-period comparability. See Selected Financial Information below for details on how Adjusted Net Income (Loss) Per Common Share and Adjusted or Comparable Net Income (Loss) Per Common Share were calculated for each period presented. We believe that Adjusted Net Income (Loss) and Adjusted or Comparable Net Income (Loss) Per Common Share are meaningful measures because they increase the comparability of period-to-period results. Since these are not measures of performance calculated in accordance with GAAP, they should not be considered in isolation of, or as a substitute for, GAAP Net Income (Loss) and Net Income (Loss) Per Common share, as indicators of operating performance and they may not be comparable to similarly titled measures employed by other companies.
Free Cash Flow:
We define Free Cash Flow as net cash provided by operating activities less capital expenditures. The Company considers Free Cash Flow to be a liquidity measure that provides useful information to management and investors about the amount of cash generated by the business after the purchases of fixed assets, which can then be used to, among other things, invest in the Company’s business, make strategic acquisitions, strengthen the balance sheet, and repurchase stock or retire debt. Free Cash Flow is a liquidity measure that is frequently used by the investment community in the evaluation of similarly situated companies. Since Free Cash Flow is not a measure of performance calculated in accordance with GAAP, it should not be considered in isolation or as a substitute for analysis of the Company’s results as reported under GAAP. A limitation of the utility of Free Cash Flow as a measure of financial performance is that it does not represent the total increase or decrease in the Company’s cash balance for the period.
About 1-800-FLOWERS.COM, Inc.
1-800-FLOWERS.COM, Inc. is a leading provider of gifts designed to help inspire customers to give more, connect more, and build more and better relationships. The Company’s e-commerce business platform features an all-star family of brands, including: 1-800-Flowers.com®, 1-800-Baskets.com®, Cheryl’s Cookies®, Harry & David®, PersonalizationMall.com®, Shari’s Berries®, FruitBouquets.com®, Things Remembered®, Moose Munch®, The Popcorn Factory®, Wolferman’s Bakery®, Vital Choice®, Stock Yards® and Simply Chocolate®. Through the Celebrations Passport® loyalty program, which provides members with free standard shipping and no service charge across our portfolio of brands, 1-800-FLOWERS.COM, Inc. strives to deepen relationships with customers. The Company also operates BloomNet®, an international floral and gift industry service provider offering a broad-range of products and services designed to help members grow their businesses profitably; Napco℠, a resource for floral gifts and seasonal décor; DesignPac Gifts, LLC, a manufacturer of gift baskets and towers; and Alice’s Table®, a lifestyle business offering fully digital livestreaming and on demand floral, culinary and other experiences to guests across the country. 1-800-FLOWERS.COM, Inc. was recognized among the top 5 on the National Retail Federation’s 2021 Hot 25 Retailers list, which ranks the nation’s fastest-growing retail companies, and was named to the Fortune 1000 list in 2022. Shares in 1-800-FLOWERS.COM, Inc. are traded on the NASDAQ Global Select Market, ticker symbol: FLWS. For more information, visit 1800flowersinc.com or follow @1800FLOWERSInc on Twitter.
FLWS–COMP
FLWS-FN
Special Note Regarding Forward Looking Statements:
This press release contains forward-looking statements within the meaning of the Private Securities Litigation Reform Act of 1995. These forward-looking statements represent the Company’s current expectations or beliefs concerning future events and can generally be identified using statements that include words such as “estimate,” “expects,” “project,” “believe,” “anticipate,” “intend,” “plan,” “foresee,” “forecast,” “likely,” “will,” “target” or similar words or phrases. These forward-looking statements are subject to risks, uncertainties, and other factors, many of which are outside of the Company’s control, which could cause actual results to differ materially from the results expressed or implied in the forward-looking statements, including, but not limited to, statements regarding the Company’s ability to achieve its guidance for the full Fiscal year; the impact of the Covid-19 pandemic on the Company; its ability to leverage its operating platform and reduce its operating expense ratio; its ability to sell through existing inventories; its ability to successfully integrate acquired businesses and assets; its ability to successfully execute its strategic initiatives; its ability to cost effectively acquire and retain customers; the outcome of contingencies, including legal proceedings in the normal course of business; its ability to compete against existing and new competitors; its ability to manage expenses associated with sales and marketing and necessary general and administrative and technology investments; its ability to reduce promotional activities and achieve more efficient marketing programs; and general consumer sentiment and industry and economic conditions that may affect levels of discretionary customer purchases of the Company’s products. The Company undertakes no obligation to publicly update any of the forward-looking statements, whether because of new information, future events or otherwise, made in this release or in any of its SEC filings. Consequently, you should not consider any such list to be a complete set of all potential risks and uncertainties. For a more detailed description of these and other risk factors, refer to the Company’s SEC filings, including the Company’s Annual Reports on Form 10-K and its Quarterly Reports on Form 10-Q.
Note: The following tables are an integral part of this press release without which the information presented in this press release should be considered incomplete.
FORT WAYNE, Ind., Feb. 01, 2023 (GLOBE NEWSWIRE) — Vera Bradley, Inc. (Nasdaq: VRA) (“Vera Bradley” or the “Company”) today announced that it plans to report results for the fourth quarter and fiscal year ended January 28, 2023 at 8:00 a.m. Eastern Time on Wednesday, March 8, 2023.
The Company will host a conference call to discuss its financial results at 9:30 a.m. Eastern Time that same day. A live webcast of the conference call will be available on the Investor Relations section of the Company’s website, www.verabradley.com. Alternatively, interested parties may dial into the call at (888) 204-4368 or (323) 994-2093 and enter the access code 3761893. A replay will be available shortly after the conclusion of the call and remain available through March 22, 2023. To access the recording, listeners should dial (844) 512-2921, and enter the access code 3761893.
ABOUT VERA BRADLEY, INC.
Vera Bradley, Inc. operates two unique lifestyle brands – Vera Bradley and Pura Vida. Vera Bradley and Pura Vida are complementary businesses, both with devoted, emotionally connected, and multi-generational female customer bases; alignment as casual, comfortable, affordable, and fun brands; positioning as “gifting” and socially-connected brands; strong, entrepreneurial cultures; a keen focus on community, charity, and social consciousness; multi-channel distribution strategies; and talented leadership teams aligned and committed to the long-term success of their brands.
Vera Bradley, based in Fort Wayne, Indiana, is a leading designer of women’s handbags, luggage and other travel items, fashion and home accessories, and unique gifts. Founded in 1982 by friends Barbara Bradley Baekgaard and Patricia R. Miller, the brand is known for its innovative designs, iconic patterns, and brilliant colors that inspire and connect women unlike any other brand in the global marketplace.
In July 2019, Vera Bradley, Inc. acquired a 75% interest in Creative Genius, Inc., which also operates under the name Pura Vida Bracelets (“Pura Vida”), and acquired the remaining 25% interest in January 2023. Pura Vida, based in La Jolla, California, is a digitally native, highly engaging lifestyle brand founded in 2010 by friends Paul Goodman and Griffin Thall. Pura Vida has a differentiated and expanding offering of bracelets, jewelry, and other lifestyle accessories.
CONTACTS: Investors: Julia Bentley, VP of Investor Relations and Communications jbentley@verabradley.com (260) 207-5116
Cathie Wood isn’t the only one favoring Tesla (TSLA) at recent valuations. Retail accounts have just made it their favorite stock in 2022 as transactions outpace the old favorite, Apple (AAPL). Money from retail trading accounts flowing into the company founded by Elon Musk increased by 424% to $15.41 billion, versus $2.94 billion in 2021. To be fair, the iPhone maker isn’t too far behind, as retail made $15.21 billion in cumulative purchases during the same period.
Vanda is a global independent research company that provides tactical macro and strategic investment analysis to institutional investors. In the firm’s, last research note of 2022, Marco Iachini, senior vice president of research at Vanda, shed some light and data on retail’s current favorite as institutional traders are placing more and more importance on money flows from self-directed investors.
Tesla’s share price has been moving lower in recent weeks as investors and analysts have been critical of the steps the billionaire has taken at his social media company, including the level of focus he has given to his new acquisition. They also show concern of the interrelationship between Musk’s wealth, Twitter’s financial needs, and any tie-in with how Tesla may trade.
Tesla shares are headed for a 60% decline in 2022, which is the worst sell-off since its 2010 public offering. Tesla’s year-to-date loss outpaces the S&P 500’s decline of 18% and the Nasdaq 100’s drop of 31%. The old favorite, Apple stock, has given up 23% during the year.
On a wider scale, investors in Tesla, Apple, and other large-cap tech companies have been slammed this year after two years of above-average returns. Vanda underscored Tesla’s popularity, saying the stock makes up about 11% of the average retail portfolio.
On the Robinhood platform, Tesla is the ninth most popular stock of the year, with Microsoft filling the top position.
Many institutional investors have, over the years, used retail interest as a sign of what to stay away from or even short. “Given its growing importance, we view retail activity around it as a crucial signpost for what may be an eventual full-fledged capitulation in 2023,” said Iachini, who wrote the research note. This flies in the face of institutional chief investment officer and founder of ARK Invest Cathie Wood, who has purchased slightly more than 445,000 shares of the EV manufacturer since October. Over the previous year and a half, Wood has been a net seller of Tesla.
Consolidated third quarter net revenues totaled $124.0 million
Third quarter net income totaled $5.2 million, or $0.17 per diluted share, vs. $0.17 per diluted share last year; excluding certain items, non-GAAP net income totaled $6.3 million, or $0.20 per diluted share, vs. $0.18 per diluted share last year
Balance sheet remains solid, with cash and cash equivalents of $25.2 million and no debt
Jackie Ardrey named President and CEO effective November 1, 2022, replacing retiring President and CEO Rob Wallstrom
FORT WAYNE, Ind., Dec. 07, 2022 (GLOBE NEWSWIRE) — Vera Bradley, Inc. (Nasdaq: VRA) today announced its financial results for the third quarter ended October 29, 2022.
In this release, Vera Bradley, Inc. or “the Company” refers to the entire enterprise and includes both the Vera Bradley and Pura Vida brands. Vera Bradley on a stand-alone basis refers to the Vera Bradley brand.
Third Quarter Comments
Rob Wallstrom, outgoing Chief Executive Officer of the Company, commented, “We are pleased with our year-over-year improvement in third quarter non-GAAP EPS, largely driven by implementation of our targeted expense reductions. Total Company third quarter revenues of $124.0 million were modestly above overall expectations, and we began to experience some stabilization in our gross margin rate as supply chain challenges moderated and strategic price increases helped offset increased raw material and freight costs.
“As in past quarters, we are continuing to experience bifurcation in the spending of our customer base. Vera Bradley’s Direct Full-Price Channel customers with higher household incomes remained more engaged and continued to spend more than customers with lower household incomes, especially in our Vera Bradley Factory Channel, where inflationary pressures impacted traffic and discretionary spending. However, our Vera Bradley Indirect Channel experienced its third consecutive quarter of year-over-year growth.”
“We opened two additional Pura Vida Full-Price retail stores in the quarter, and they are performing ahead of our expectations,” Wallstrom continued. “As with many direct-to-consumer companies, we have seen a shift from a pure-digital-play model to an integrated multi-channel platform. Our four Full-Price retail stores are not only profitable but have driven improved ecommerce traffic and revenue in their trade areas. However, overall Pura Vida revenues continued to be negatively impacted by the shift in social and digital media effectiveness and rising digital media costs, and we experienced a decline in sales to wholesale accounts.”
Jackie Ardrey Named President and CEO
Jackie Ardrey joined the Company as President and CEO effective November 1, 2022, replacing retiring President and CEO Wallstrom. Wallstrom will continue to work closely with Ardrey through the end of December 2022 to ensure a smooth transition. Ardrey also replaced Wallstrom on the Company’s Board of Directors.
Ardrey is an accomplished, results-oriented leader with over 25 years of experience in multi-channel retail enterprises. Between 2018 and October 2022, she held the post of President at home furnishings and seasonal décor catalog and online retailer Grandin Road, part of the Qurate Retail Group. Previously, Ardrey was CEO of Trading Company Holdings and Senior Vice President of Merchandising and Supply Chain for iconic omnichannel gourmet food and gifting brand Harry and David. Prior to that, she spent 14 years at multi-channel high-end children’s retailer Hanna Andersson in various roles of increasing responsibility, including Senior Vice President of Merchandising, Design, and Wholesale.
“Although I have just been with the Company a few short weeks, I am convinced that both our Vera Bradley and Pura Vida brands have untapped potential in the marketplace,” Ardrey commented. “While I expect the macro environment to remain unpredictable, our teams are focused, and our cash position and balance sheet remain solid. I look forward to working closely with our leadership teams to develop and execute solid growth plans; leverage our many opportunities, especially in merchandising and marketing; and deliver consistent, sustainable growth and value to our stakeholders over the long term.”
Summary of Financial Performance for the Third Quarter
Consolidated net revenues totaled $124.0 million compared to $134.7 million in the prior year third quarter ended October 30, 2021.
For the current year third quarter, Vera Bradley, Inc.’s consolidated net income totaled $5.2 million, or $0.17 per diluted share. These results included $1.1 million of net after tax charges, comprised of $0.6 million of consulting and professional fees primarily associated with cost savings initiatives and the CEO search, $0.4 million for the amortization of definite-lived intangible assets, and $0.3 million of severance and stock-based retirement compensation charges, partially offset by a benefit of $0.2 million for the reversal of certain purchase order cancellation fees. On a non-GAAP basis, Vera Bradley, Inc.’s consolidated third quarter net income totaled $6.3 million, or $0.20 per diluted share.
For the prior year third quarter, Vera Bradley, Inc.’s consolidated net income totaled $5.8 million, or $0.17 per diluted share. These results included $0.4 million of net after tax charges related to intangible asset amortization. On a non-GAAP basis, Vera Bradley, Inc.’s consolidated third quarter net income totaled $6.2 million, or $0.18 per diluted share.
Summary of Financial Performance for the Nine Months
Consolidated net revenues totaled $352.9 million for the current year nine months ended October 29, 2022, compared to $390.9 million in the prior year nine month period ended October 30, 2021.
For the current year nine months, Vera Bradley, Inc.’s consolidated net loss totaled ($31.6) million, or ($1.00) per diluted share. These results included $34.2 million of net after tax charges, comprised of $18.2 million of Pura Vida goodwill and intangible asset impairment charges, $5.0 million of severance and stock-based retirement compensation retirement charges and other employee costs, $4.7 million of inventory adjustments associated with the exit of certain technology products and the write-off of excess mask inventory, $3.0 million of consulting and professional fees primarily associated with cost savings initiatives and the CEO search, $1.3 million of intangible asset amortization, $1.0 million of store and right-of-use asset impairment charges, $0.7 million of purchase order cancellation fees for spring 2023 goods, and $0.3 million of goodMRKT exit costs. On a non-GAAP basis, Vera Bradley, Inc.’s consolidated net income for the nine months totaled $2.6 million, or $0.08 per diluted share.
For the prior year nine months, Vera Bradley, Inc’s consolidated net income totaled $12.7 million, or $0.37 per diluted share. These results included $1.3 million of net after tax charges related to intangible asset amortization. On a non-GAAP basis, Vera Bradley, Inc.’s consolidated net income totaled $14.0 million, or $0.41 per diluted share, for the nine months.
Non-GAAP Numbers
The current year non-GAAP third quarter income statement numbers referenced below exclude the previously outlined consulting and professional fees primarily associated with cost savings initiatives and the CEO search, amortization of definite-lived intangible assets, severance and stock-based retirement compensation charges, and a benefit for the reversal of certain purchase order cancellation fees. The current year non-GAAP income statement numbers for the nine months referenced below exclude the previously outlined goodwill and intangible asset impairment charges, severance and stock-based retirement compensation retirement charges and other employee costs, inventory adjustments, consulting and professional fees, intangible asset amortization, store and right-of-use asset impairment charges, purchase order cancellation fees, and goodMRKT exit costs.
The prior year non-GAAP third quarter and nine-month income statement numbers referenced below exclude the previously outlined intangible asset amortization.
Third Quarter Details
Current year third quarter Vera Bradley Direct segment revenues totaled $80.1 million, a 7.6% decrease from $86.6 million in the prior year third quarter. Comparable sales decreased 9.6% in the third quarter. The Company permanently closed 12 full-line stores and opened 5 factory outlet stores in the last twelve months.
Vera Bradley Indirect segment revenues totaled $22.3 million, a 6.7% increase over $20.9 million in the prior year third quarter, reflecting an increase in certain key account orders, partially offset by a decline in specialty account orders.
Pura Vida segment revenues totaled $21.7 million, a 20.3% decrease from $27.2 million in the prior year.
Third quarter consolidated gross profit totaled $65.9 million, or 53.1% of net revenues, compared to $72.3 million, or 53.6% of net revenues, in the prior year. On a non-GAAP basis, current year gross profit totaled $65.6 million, or 52.9% of net revenues. The current year gross profit rate was negatively affected by higher inbound and outbound freight expense, deleverage of overhead costs, and channel mix changes, partially offset by price increases.
Third quarter consolidated SG&A expense totaled $60.1 million, or 48.4% of net revenues, compared to $64.5 million, or 47.8% of net revenues, in the prior year. On a non-GAAP basis, consolidated SG&A expense totaled $57.6 million, or 46.4% of net revenues for the current year third quarter, compared to $63.7 million, or 47.3% of net revenues, in the prior year. As expected, Vera Bradley’s SG&A current year expenses were lower than the prior year primarily due to cost reduction initiatives and a reduction in variable-related expenses due to the lower sales volume.
The Company’s third quarter consolidated operating income totaled $6.0 million, or 4.8% of net revenues, compared to $8.0 million, or 5.9% of net revenues, in the prior year third quarter. On a non-GAAP basis, the Company’s current year consolidated operating income totaled $8.2 million, or 6.6% of net revenues, compared to $8.7 million, or 6.5%, of net revenues, in the prior year.
By segment:
Vera Bradley Direct operating income was $17.1 million, or 21.3% of Direct net revenues, for the third quarter, compared to $17.8 million, or 20.6% of Direct net revenues, in the prior year. On a non-GAAP basis, current year Direct operating income totaled $16.8 million, or 21.0% of Direct revenues.
Vera Bradley Indirect operating income was $9.0 million, or 40.4% of Indirect net revenues, for the third quarter, compared to $7.3 million, or 35.1% of Indirect net revenues, in the prior year. On a non-GAAP basis, current year Indirect operating income totaled $9.0 million, or 40.2% of Indirect net revenues.
Pura Vida’s operating loss was ($1.4) million, or (6.2%) of Pura Vida net revenues, in the current year, compared to operating income of $1.8 million, or 6.6% of Pura Vida net revenues, in the prior year. On a non-GAAP basis, Pura Vida’s operating loss was ($0.1) million, or (0.3%) of Pura Vida net revenues, compared to operating income of $2.6 million, or 9.4% of Pura Vida net revenues, in the prior year.
Details for the Nine Months
Vera Bradley Direct segment revenues for the current year nine-month period totaled $228.7 million, an 8.7% decrease from $250.5 million in the prior year. Comparable sales declined 11.6% for the nine months.
Vera Bradley Indirect segment revenues for the nine months totaled $56.6 million, a 6.8% increase over $53.0 million in the prior year, reflecting an increase in certain key account orders, partially offset by a decline in specialty account orders.
Pura Vida segment revenues for the nine months totaled $67.5 million, a 22.7% decrease from $87.4 million in the prior year.
Consolidated gross profit for the nine months totaled $178.9 million, or 50.7% of net revenues, compared to $211.8 million, or 54.2% of net revenues, in the prior year. On a non-GAAP basis, current year gross profit totaled $185.9 million, or 52.7% of net revenues. The current year gross profit rate was negatively affected by higher inbound and outbound freight expense, deleverage of overhead costs, and channel mix changes, partially offset by price increases.
For the nine months, consolidated SG&A expense totaled $195.0 million, or 55.3% of net revenues, compared to $194.1 million, or 49.7% of net revenues, in the prior year. On a non-GAAP basis, current year consolidated SG&A expense totaled $181.0 million, or 51.3% of net revenues, compared to $191.8 million, or 49.1% of net revenues, in the prior year. As expected, Vera Bradley’s non-GAAP SG&A current year expenses were lower than the prior year primarily due to cost reduction initiatives and a reduction in variable-related expenses due to the lower sales volume.
For the nine months, the Company’s consolidated operating loss totaled ($45.1) million, or (12.8%) of net revenues, compared to consolidated operating income of $18.6 million, or 4.8% of net revenues, in the prior year nine-month period. On a non-GAAP basis, the Company’s current year consolidated operating income was $5.3 million, or 1.5% or net revenues, compared to $20.9 million, or 5.4% of net revenues, in the prior year.
By segment:
Vera Bradley Direct operating income was $32.6 million, or 14.3% of net revenues, compared to $51.9 million, or 20.7% of Direct net revenues, in the prior year. On a non-GAAP basis, current year Direct operating income was $38.6 million, or 16.9% of Direct net revenues.
Vera Bradley Indirect operating income was $18.4 million, or 32.5% of Indirect net revenues, compared to $17.4 million, or 32.8% of Indirect net revenues, in the prior year. On a non-GAAP basis, current year Indirect operating income totaled $19.4 million, or 34.2% of Indirect net revenues.
Pura Vida’s operating loss was ($28.8) million, or (42.7%) of Pura Vida net revenues, for the current year, compared to operating income of $7.5 million, or 8.6% of Pura Vida net revenues, in the prior year. On a non-GAAP basis, Pura Vida’s operating income was $4.3 million, or 6.4% of Pura Vida net revenues, for the current year, compared to $9.8 million, or 11.3% of Pura Vida net revenues, for the prior year.
Balance Sheet
Net capital spending for the third quarter and nine months totaled $2.6 million and $7.0 million, respectively.
Cash, cash equivalents, and investments as of October 29, 2022 totaled $25.2 million compared to $75.3 million at the end of last year’s third quarter. The Company had no borrowings on its $75 million ABL credit facility at quarter end.
Total quarter-end inventory was $178.3 million, compared to $148.3 million at the end of the third quarter last year. Total current year inventory was higher than the prior year primarily due to approximately $17 million in incremental logistics costs burdening overall inventory as well as incremental Vera Bradley Factory inventory related to lower than expected revenues.
During the third quarter, the Company repurchased approximately $0.8 million of its common stock (approximately 0.2 million shares at an average price of $3.56), bringing year-to-date purchases through the end of the third quarter to approximately $17.3 million (approximately 2.6 million shares at an average price of $6.56). The Company has $28.5 million of remaining availability under its $50.0 million repurchase authorization that expires in December 2024.
Forward Outlook
Ardrey noted, “We expect the fourth quarter macroeconomic environment to continue to be unpredictable; the Pura Vida business will continue to be challenging; inflationary pressures will continue to impact Vera Bradley customers with lower household incomes, particularly in the Factory Channel; and there will be continued pressure on gross margin.”
Excluding net revenues, all forward-looking guidance numbers referenced below are non-GAAP. The prior year SG&A and earnings per diluted share numbers exclude the previously disclosed net charges related to intangible asset amortization. Current year guidance excludes previously disclosed goodwill and intangible asset impairment charges, severance and stock-based retirement compensation retirement charges and other employee costs, inventory adjustments, consulting and professional fees, intangible asset amortization, store and right-of-use asset impairment charges, purchase order cancellation fees, and goodMRKT exit costs.
For the fourth quarter of Fiscal 2023, the Company’s expectations are as follows:
Consolidated net revenues of $136 to $141 million. Net revenues totaled $149.6 million in the prior year fourth quarter.
A consolidated gross profit percentage of 49.5% to 50.5% compared to 50.9% in the prior year fourth quarter. The expected decrease is primarily associated with incremental targeted promotional activity and deleverage on overhead costs, partially offset by price increases and lower year-over-year freight expense.
Consolidated SG&A expense of $61 to $63 million compared to $67.1 million in the prior year fourth quarter. The reduction in SG&A expense is being driven by cost reduction initiatives and a reduction in compensation expense, marketing, and other variable-related expenses due to the expected sales decline from the prior year.
Consolidated diluted EPS of $0.16 to $0.20 based on diluted weighted-average shares outstanding of 31.1 million and an effective tax rate of approximately 25%. Diluted EPS totaled $0.17 in last year’s fourth quarter.
For Fiscal 2023, the Company’s updated expectations are as follows:
Consolidated net revenues of $489 to $494 million. Net revenues totaled $540.5 million in Fiscal 2022. Year-over-year Vera Bradley revenues are expected to decline between 6% and 7%, and Pura Vida revenues are expected to decline between 20% and 21%.
A consolidated gross profit percentage of 51.9% to 52.1% compared to 53.3% in Fiscal 2022. The expected year-over-year decrease is primarily related to incremental inbound and outbound freight expense, incremental targeted promotional activity, and deleverage on overhead costs, partially offset by price increases.
Consolidated SG&A expense of $242 to $244 million compared to $258.8 million in Fiscal 2022. The reduction in SG&A expense is being driven by cost reduction initiatives and a reduction in compensation expense, marketing, and other variable-related expenses due to the expected sales decline from the prior year.
Consolidated operating income of $11.6 to $13.5 million compared to $30.1 million in Fiscal 2022.
Consolidated diluted EPS of $0.22 to $0.26 based on diluted weighted-average shares outstanding of 31.6 million and an effective tax rate of between 24.0 and 25.0%. Diluted EPS totaled $0.57 last year.
Net capital spending of approximately $10 million compared to $5.5 million in the prior year, reflecting investments associated with new Vera Bradley factory and Pura Vida store locations and technology and logistics enhancements.
Disclosure Regarding Non-GAAP Measures
The Company’s management does not, nor does it suggest that investors should, consider the supplemental non-GAAP financial measures in isolation from, or as a substitute for, financial information prepared in accordance with accounting principles generally accepted in the United States (“GAAP”). Further, the non-GAAP measures utilized by the Company may be unique to the Company, as they may be different from non-GAAP measures used by other companies.
The Company believes that the non-GAAP measures presented in this earnings release, including cost of sales; gross profit; selling, general, and administrative expenses; impairment of goodwill and intangible assets; operating income (loss); net income (loss); net (loss) income attributable and available to Vera Bradley, Inc.; and diluted net income (loss) per share available to Vera Bradley, Inc. common shareholders, along with the associated percentages of net revenues, are helpful to investors because they allow for a more direct comparison of the Company’s year-over-year performance and are consistent with management’s evaluation of business performance. A reconciliation of the non-GAAP measures to the most directly comparable GAAP measures can be found in the Company’s supplemental schedules included in this earnings release.
Call Information
A conference call to discuss results for the third quarter is scheduled for today, Wednesday, December 7, 2022, at 9:30 a.m. Eastern Time. A broadcast of the call will be available via Vera Bradley’s Investor Relations section of its website, www.verabradley.com. Alternatively, interested parties may dial into the call at (800) 437-2398, and enter the access code 6836290. A replay will be available shortly after the conclusion of the call and remain available through December 21, 2022. To access the recording, listeners should dial (844) 512-2921, and enter the access code 6836290.
About Vera Bradley, Inc.
Vera Bradley, Inc. operates two unique lifestyle brands – Vera Bradley and Pura Vida. Vera Bradley and Pura Vida are complementary businesses, both with devoted, emotionally-connected, and multi-generational female customer bases; alignment as casual, comfortable, affordable, and fun brands; positioning as “gifting” and socially-connected brands; strong, entrepreneurial cultures; a keen focus on community, charity, and social consciousness; multi-channel distribution strategies; and talented leadership teams aligned and committed to the long-term success of their brands.
Vera Bradley, based in Fort Wayne, Indiana, is a leading designer of women’s handbags, luggage and other travel items, fashion and home accessories, and unique gifts. Founded in 1982 by friends Barbara Bradley Baekgaard and Patricia R. Miller, the brand is known for its innovative designs, iconic patterns, and brilliant colors that inspire and connect women unlike any other brand in the global marketplace.
In July 2019, Vera Bradley, Inc. acquired a 75% interest in Creative Genius, Inc., which also operates under the name Pura Vida Bracelets (“Pura Vida”). Pura Vida, based in La Jolla, California, is a digitally native, highly-engaging lifestyle brand founded in 2010 by friends Paul Goodman and Griffin Thall. Pura Vida has a differentiated and expanding offering of bracelets, jewelry, and other lifestyle accessories.
The Company has three reportable segments: Vera Bradley Direct (“VB Direct”), Vera Bradley Indirect (“VB Indirect”), and Pura Vida. The VB Direct business consists of sales of Vera Bradley products through Vera Bradley full-line and factory outlet stores in the United States, verabradley.com, verabradley.ca, Vera Bradley’s online outlet site, and the Vera Bradley annual outlet sale in Fort Wayne, Indiana. The VB Indirect business consists of sales of Vera Bradley products to approximately 1,700 specialty retail locations throughout the United States, as well as select department stores, national accounts, third party e-commerce sites, and third-party inventory liquidators, and royalties recognized through licensing agreements related to the Vera Bradley brand. The Pura Vida segment consists of sales of Pura Vida products through the Pura Vida websites, www.puravidabracelets.com, www.puravidabracelets.eu, and www.puravidabracelets.ca; through the distribution of its products to wholesale retailers and department stores; and through its Pura Vida retail stores.
Website Information
We routinely post important information for investors on our website www.verabradley.com in the “Investor Relations” section. We intend to use this webpage as a means of disclosing material, non-public information and for complying with our disclosure obligations under Regulation FD. Accordingly, investors should monitor the Investor Relations section of our website, in addition to following our press releases, SEC filings, public conference calls, presentations and webcasts. The information contained on, or that may be accessed through, our webpage is not incorporated by reference into, and is not a part of, this document.
Investors and other interested parties may also access the Company’s most recent Corporate Responsibility and Sustainability Report outlining its ESG (Environmental, Social, and Governance) initiatives at https://verabradley.com/pages/corporate-responsibility.
Vera Bradley Safe Harbor Statement
Certain statements in this release are “forward-looking statements” made pursuant to the safe-harbor provisions of the Private Securities Litigation Reform Act of 1995. Such forward-looking statements reflect the Company’s current expectations or beliefs concerning future events and are subject to various risks and uncertainties that may cause actual results to differ materially from those that we expected, including: possible adverse changes in general economic conditions and their impact on consumer confidence and spending; possible inability to predict and respond in a timely manner to changes in consumer demand; possible loss of key management or design associates or inability to attract and retain the talent required for our business; possible inability to maintain and enhance our brands; possible inability to successfully implement the Company’s long-term strategic plan; possible inability to successfully open new stores, close targeted stores, and/or operate current stores as planned; incremental tariffs or adverse changes in the cost of raw materials and labor used to manufacture our products; possible adverse effects resulting from a significant disruption in our distribution facilities; or business disruption caused by COVID-19 or other pandemics. Risks, uncertainties, and assumptions also include the possibility that Pura Vida acquisition benefits may not materialize as expected and that Pura Vida’s business may not perform as expected. More information on potential factors that could affect the Company’s financial results is included from time to time in the “Risk Factors” and “Management’s Discussion and Analysis of Financial Condition and Results of Operations” sections of the Company’s public reports filed with the SEC, including the Company’s Form 10-K for the fiscal year ended January 29, 2022. We undertake no obligation to publicly update or revise any forward-looking statement. Financial schedules are attached to this release.
CONTACTS: Investors: Julia Bentley, VP of Investor Relations and Communications jbentley@verabradley.com (260) 207-5116