In a strategic move set to redefine the luxury retail sector, HBC, the parent company of Saks Fifth Avenue, announced plans to acquire Neiman Marcus Group for $2.65 billion. This landmark deal will pave the way for the formation of Saks Global, a powerhouse conglomerate encompassing Saks Fifth Avenue, Saks Off 5th, Neiman Marcus, and Bergdorf Goodman.
The acquisition comes amidst a turbulent period for brick-and-mortar retail, where consumer preferences have shifted towards experiential shopping over traditional goods. Luxury brands are increasingly bypassing department stores to establish direct connections with consumers through their own retail channels.
Marc Metrick, current CEO of Saks.com, will assume the role of CEO for the newly formed Saks Global, while Ian Putnam, President and CEO of HBC Properties and Investments, will lead the property and investments division.
This merger, long speculated upon, is expected to bolster the combined entity’s negotiating power with luxury brands, potentially driving down costs. It also marks a strategic alliance with tech giants Amazon and Salesforce, both of which will hold minority stakes in the new company. Amazon’s involvement underscores its ambition to penetrate the luxury retail market, leveraging its technological prowess and logistical infrastructure.
In a separate development reported by the Wall Street Journal, Arkhouse and Brigade Capital have increased their buyout offer for Macy’s to $6.9 billion. This revised bid represents a significant premium of nearly 43% over Macy’s closing price in December 2023, when the talks began. The proposal aims to acquire all outstanding Macy’s shares at $24.80 per share, indicating confidence in Macy’s potential despite its recent challenges.
Macy’s, facing declining sales and market share, has responded with store closures and strategic overhauls. Another option, taking the company private, could provide the flexibility needed to execute its turnaround plan away from the pressures of public markets.
Recent activity, and proposed activity, in the space highlights luxury brands trying to reposition themselves to survive in an ever-evolving consumer landscape that sees more and more consumers turning to online purchases and direct-to-consumer interaction. At the same time, it shows that many experts see the potential for a turnaround.
Gain more insight on the current, and future, state of the consumer, media, and tech sectors straight from the executives. Watch the replays from Noble’s recent virtual equity conference.
Xcel Brands, Inc. 1333 Broadway 10th Floor New York, NY 10018 United States https:/Sector(s): Consumer Cyclical Industry: Apparel Manufacturing Full Time Employees: 84 Key Executives Name Title Pay Exercised Year Born Mr. Robert W. D’Loren Chairman, Pres & CEO 1.27M N/A 1958 Mr. James F. Haran CFO, Principal Financial & Accou
Michael Kupinski, Director of Research, Equity Research Analyst, Digital, Media & Technology , Noble Capital Markets, Inc.
Jacob Mutchler, Research Associate, Noble Capital Markets, Inc.
Refer to the full report for the price target, fundamental analysis, and rating.
A noisy quarter. The company reported Q4 revenue of $2.3 million down year over year, but reflected strong 48% licensing revenue growth. Adj. EBITDA loss of $1.2 million was modestly lower than our estimate. In our view, the full impact of the company’s lower cost, licensing model has not yet been manifested.
Significant amount of revenue growth initiatives. In our view, the company’s outlook in 2024 appears favorable in terms of revenue and potential swing toward positive adj. EBITDA.The favorable outlook is supported by its joint venture with Christie Brinkley, TWRHLL, which is launching in May; G-III and its launch of Halston in Q3 of 2024; expanding products from C. Wonder and Judith Ripka.
Equity Research is available at no cost to Registered users of Channelchek. Not a Member? Click ‘Join’ to join the Channelchek Community. There is no cost to register, and we never collect credit card information.
This Company Sponsored Research is provided by Noble Capital Markets, Inc., a FINRA and S.E.C. registered broker-dealer (B/D).
*Analyst certification and important disclosures included in the full report. NOTE: investment decisions should not be based upon the content of this research summary. Proper due diligence is required before making any investment decision.
FORT WAYNE, Ind., Feb. 08, 2024 (GLOBE NEWSWIRE) — Vera Bradley, Inc. (Nasdaq: VRA) (the “Company”) today announced that it plans to report results for the fourth quarter and fiscal year ended February 3, 2024 at 8:00 a.m. Eastern Time on Wednesday, March 13, 2024.
The Company will host a conference call to discuss its financial results at 9:30 a.m. Eastern Time that same day. A live webcast of the conference call will be available on the Investor Relations section of the Company’s website, www.verabradley.com. Alternatively, interested parties may dial into the call at (877) 407-0779, and enter the access code 13742953. A replay will be available shortly after the conclusion of the call and remain available through March 27, 2024. To access the recording, listeners should dial (844) 512-2921, and enter the access code 13742953.
ABOUT VERA BRADLEY, INC.
Vera Bradley, Inc. operates two unique lifestyle brands – Vera Bradley and Pura Vida. Vera Bradley and Pura Vida are complementary businesses, both with devoted, emotionally connected, and multi-generational female customer bases; alignment as causal, comfortable, affordable, and fun brands; positioning as “gifting” and socially-connected brands; strong, entrepreneurial cultures; a keen focus on community, charity, and social consciousness; multi-channel distribution strategies; and talented leadership teams aligned and committed to the long-term success of their brands.
Vera Bradley, based in Fort Wayne, Indiana, is a leading designer of women’s handbags, luggage and other travel items, fashion and home accessories, and unique gifts. Founded in 1982 by friends Barbara Bradley Baekgaard and Patricia R. Miller, the brand is known for its innovative designs, iconic patterns, and brilliant colors that inspire and connect women unlike any other brand in the global marketplace.
In July 2019, Vera Bradley, Inc. acquired a 75% interest in Creative Genius, Inc., which also operates under the name Pura Vida Bracelets (“Pura Vida”). Pura Vida, based in La Jolla, California, is a digitally native, highly engaging lifestyle brand founded in 2010 by friends Paul Goodman and Griffin Thall. Pura Vida has a differentiated and expanding offering of bracelets, jewelry, and other lifestyle accessories. The Company acquired the remaining 25% of Pura Vida in January 2023.
Addition Of Rodriguez Will Shift Representation Of Women On Board To 78%
FORT WAYNE, Ind., Jan. 26, 2024 (GLOBE NEWSWIRE) — Vera Bradley, Inc. (Nasdaq: VRA) (the “Company”) today announced that Jessica Rodriguez, media business executive and former President of Entertainment and Chief Brand Officer for Univision Communications, Inc., has been elected to join its Board of Directors. With this appointment, representation of women on the Vera Bradley, Inc. Board of Directors will be 78%.
“Jessica Rodriguez brings a wealth of experience, supported by an exceptional record of driving innovation and executing future-focused, transformational strategies that deliver value and profitability in a rapidly changing business environment,” commented Jackie Ardrey, Chief Executive Officer of Vera Bradley, Inc. “Jessica’s unique perspective will be an excellent addition to the Vera Bradley, Inc. Board of Directors as we continue to focus on driving long-term, profitable growth for the Company and delivering value to our shareholders.”
Rodriguez is a visionary, results-driven leader and award-winning media business executive with a keen focus on creating, leading, and motivating high-performing, diverse, purpose-driven organizations. Rodriguez began her 20+ year career in media as Vice President and Station Manager for Univision Puerto Rico. From there, she successfully progressed through the organization in roles of increasing responsibility, including Vice President and Special Assistant to the President for Univision Networks, Inc.; Senior Vice President, Univision Cable Networks; Executive Vice President and Chief Marketing Officer, Univision; and Chief Operating Officer, Univision Networks. In 2018, Rodriguez was named President of Entertainment and Chief Brand Officer for Univision Communications, Inc., a post she held until 2022.
Rodriguez holds a bachelor’s degree in finance and economics from Fordham University and an MBA from the Stanford University Graduate School of Business. She currently serves as a member of the Burlington Stores, Inc. Board of Directors.
Rodriguez will join Vera Bradley Inc.’s eight other board members: Jackie Ardrey, CEO; Barbara Bradley Baekgaard, Co-Founder of Vera Bradley; Kristina Cashman, former Chief Financial Officer of P.F. Chang’s; Robert J. Hall, Chairman of the Vera Bradley Board of Directors and President of Green Gables Partners; Mary Lou Kelley, former President, E-Commerce for Best Buy; Frances P. Philip, Lead Independent Director of the Vera Bradley Board of Directors and former Chief Merchandising Officer of L.L. Bean, Inc.; Carrie Tharp, Vice President of Strategic Industries for Google Cloud; and recently appointed member Bradley Weston, former Chief Executive Officer of Party City Holdings, Inc.
About Vera Bradley, Inc. Vera Bradley, Inc. operates two unique lifestyle brands – Vera Bradley and Pura Vida. Vera Bradley and Pura Vida are complementary businesses, both with devoted, emotionally-connected, and multi-generational female customer bases; alignment as casual, comfortable, affordable, and fun brands; positioning as “gifting” and socially-connected brands; strong, entrepreneurial cultures; a keen focus on community, charity, and social consciousness; multi-channel distribution strategies; and talented leadership teams aligned and committed to the long-term success of their brands.
Vera Bradley, based in Fort Wayne, Indiana, is a leading designer of women’s handbags, luggage and other travel items, fashion and home accessories, and unique gifts. Founded in 1982 by friends Barbara Bradley Baekgaard and Patricia R. Miller, the brand is known for its innovative designs, iconic patterns, and brilliant colors that inspire and connect women unlike any other brand in the global marketplace.
In July 2019, Vera Bradley, Inc. acquired a 75% interest in Creative Genius, Inc., which also operates under the name Pura Vida Bracelets (“Pura Vida”). Pura Vida, based in La Jolla, California, is a digitally native, highly-engaging lifestyle brand founded in 2010 by friends Paul Goodman and Griffin Thall. Pura Vida has a differentiated and expanding offering of bracelets, jewelry, and other lifestyle accessories. The Company acquired the remaining 25% of Pura Vida in January 2023.
The Company has three reportable segments: Vera Bradley Direct (“VB Direct”), Vera Bradley Indirect (“VB Indirect”), and Pura Vida. The VB Direct business consists of sales of Vera Bradley products through Vera Bradley Full-Line and Factory Outlet stores in the United States, www.verabradley.com, Vera Bradley’s online outlet site, and the Vera Bradley annual outlet sale in Fort Wayne, Indiana. The VB Indirect business consists of sales of Vera Bradley products to approximately 1,600 specialty retail locations throughout the United States, as well as select department stores, national accounts, third party e-commerce sites, and third-party inventory liquidators, and royalties recognized through licensing agreements related to the Vera Bradley brand. The Pura Vida segment consists of sales of Pura Vida products through the Pura Vida websites, www.puravidabracelets.com, www.puravidabracelets.ca, and www.puravidabracelets.eu; through the distribution of its products to wholesale retailers and department stores; and through its Pura Vida retail stores.
Vera Bradley Safe Harbor Statement Certain statements in this release are “forward-looking statements” made pursuant to the safe-harbor provisions of the Private Securities Litigation Reform Act of 1995. Such forward-looking statements reflect the Company’s current expectations or beliefs concerning future events and are subject to various risks and uncertainties that may cause actual results to differ materially from those that we expected, including: possible adverse changes in general economic conditions and their impact on consumer confidence and spending; possible inability to predict and respond in a timely manner to changes in consumer demand; possible loss of key management or design associates or inability to attract and retain the talent required for our business; possible inability to maintain and enhance our brands; possible inability to successfully implement the Company’s long-term strategic plans; possible inability to successfully open new stores, close targeted stores, and/or operate current stores as planned; incremental tariffs or adverse changes in the cost of raw materials and labor used to manufacture our products; possible adverse effects resulting from a significant disruption in our distribution facilities; or business disruption caused by pandemics. More information on potential factors that could affect the Company’s financial results is included from time to time in the “Risk Factors” and “Management’s Discussion and Analysis of Financial Condition and Results of Operations” sections of the Company’s public reports filed with the SEC, including the Company’s Form 10-K for the fiscal year ended January 28, 2023. We undertake no obligation to publicly update or revise any forward-looking statement.
FORT WAYNE, Ind., Jan. 16, 2024 (GLOBE NEWSWIRE) — Vera Bradley, Inc. (NASDAQ: VRA) (the “Company”) today announced that Bradley (“Brad”) Weston, seasoned retail executive and former Chief Executive Officer of Party City Holdings, Inc., has been nominated to join its Board of Directors.
“We are so pleased to welcome Brad Weston as the newest member of the Vera Bradley, Inc. Board of Directors,” commented Jackie Ardrey, Chief Executive Officer of the Company. “As we continue to make progress on Project Restoration, our strategic plan to drive long-term profitable growth and deliver value to our shareholders, Brad’s wealth of omnichannel retail experience, strong merchandising background, and visionary leadership will be invaluable assets.”
Weston is a battle-tested executive with a diverse background, having successfully operated in mature, start-up, turnaround/transformation, and high-growth situations over his 35-year retail career. Most recently, Weston served as the Chief Executive Officer of Party City Holdings, Inc., a role he assumed at the start of the COVID-19 pandemic following a short period leading the company’s retail division. Previously, he spent seven years with Petco Animal Supplies, Inc. in roles of increasing responsibility from Chief Merchandising Officer to President and Chief Executive Officer. He also led the merchant organization at Dick’s Sporting Goods from 2008 to 2011 as Chief Merchandising Officer.
Weston’s merchandising expertise is grounded in the fundamentals he learned early in his career. Over 18 years, he successfully rose through the ranks at May Department Stores from Executive Trainee to Senior Vice President, General Merchandising Manager, Ready-to-Wear. He holds a bachelor’s degree in business administration with a finance and marketing emphasis from the University of California, Berkeley.
In addition to his appointment to the Vera Bradley, Inc. Board of Directors, Weston is currently a member of the Board of Directors for Boot Barn, Inc. He has previously served in Director roles for Party City Holdings, Inc.; Petco; the National Retail Federation; and The Sports Authority.
Weston will join Vera Bradley Inc.’s seven other board members: Jackie Ardrey, CEO; Barbara Bradley Baekgaard, Co-Founder of Vera Bradley; Kristina Cashman, former Chief Financial Officer of restaurant group PF Chang’s; Robert J. Hall, Chairman of the Vera Bradley Board of Directors and President of Green Gables Partners; Mary Lou Kelley, former President, E-Commerce for Best Buy; Frances P. Philip, Lead Independent Director of the Vera Bradley Board of Directors and former Chief Merchandising Officer of L.L. Bean, Inc.; and Carrie Tharp, Vice President of Strategic Industries for Google Cloud.
About Vera Bradley, Inc. Vera Bradley, Inc. operates two unique lifestyle brands – Vera Bradley and Pura Vida. Vera Bradley and Pura Vida are complementary businesses, both with devoted, emotionally-connected, and multi-generational female customer bases; alignment as casual, comfortable, affordable, and fun brands; positioning as “gifting” and socially-connected brands; strong, entrepreneurial cultures; a keen focus on community, charity, and social consciousness; multi-channel distribution strategies; and talented leadership teams aligned and committed to the long-term success of their brands.
Vera Bradley, based in Fort Wayne, Indiana, is a leading designer of women’s handbags, luggage and other travel items, fashion and home accessories, and unique gifts. Founded in 1982 by friends Barbara Bradley Baekgaard and Patricia R. Miller, the brand is known for its innovative designs, iconic patterns, and brilliant colors that inspire and connect women unlike any other brand in the global marketplace.
In July 2019, Vera Bradley, Inc. acquired a 75% interest in Creative Genius, Inc., which also operates under the name Pura Vida Bracelets (“Pura Vida”). Pura Vida, based in La Jolla, California, is a digitally native, highly-engaging lifestyle brand founded in 2010 by friends Paul Goodman and Griffin Thall. Pura Vida has a differentiated and expanding offering of bracelets, jewelry, and other lifestyle accessories. The Company acquired the remaining 25% of Pura Vida in January 2023.
The Company has three reportable segments: Vera Bradley Direct (“VB Direct”), Vera Bradley Indirect (“VB Indirect”), and Pura Vida. The VB Direct business consists of sales of Vera Bradley products through Vera Bradley Full-Line and Factory Outlet stores in the United States, www.verabradley.com, Vera Bradley’s online outlet site, and the Vera Bradley annual outlet sale in Fort Wayne, Indiana. The VB Indirect business consists of sales of Vera Bradley products to approximately 1,600 specialty retail locations throughout the United States, as well as select department stores, national accounts, third party e-commerce sites, and third-party inventory liquidators, and royalties recognized through licensing agreements related to the Vera Bradley brand. The Pura Vida segment consists of sales of Pura Vida products through the Pura Vida websites, www.puravidabracelets.com, www.puravidabracelets.ca, and www.puravidabracelets.eu; through the distribution of its products to wholesale retailers and department stores; and through its Pura Vida retail stores.
Vera Bradley Safe Harbor Statement Certain statements in this release are “forward-looking statements” made pursuant to the safe-harbor provisions of the Private Securities Litigation Reform Act of 1995. Such forward-looking statements reflect the Company’s current expectations or beliefs concerning future events and are subject to various risks and uncertainties that may cause actual results to differ materially from those that we expected, including: possible adverse changes in general economic conditions and their impact on consumer confidence and spending; possible inability to predict and respond in a timely manner to changes in consumer demand; possible loss of key management or design associates or inability to attract and retain the talent required for our business; possible inability to maintain and enhance our brands; possible inability to successfully implement the Company’s long-term strategic plans; possible inability to successfully open new stores, close targeted stores, and/or operate current stores as planned; incremental tariffs or adverse changes in the cost of raw materials and labor used to manufacture our products; possible adverse effects resulting from a significant disruption in our distribution facilities; or business disruption caused by pandemics. More information on potential factors that could affect the Company’s financial results is included from time to time in the “Risk Factors” and “Management’s Discussion and Analysis of Financial Condition and Results of Operations” sections of the Company’s public reports filed with the SEC, including the Company’s Form 10-K for the fiscal year ended January 28, 2023. We undertake no obligation to publicly update or revise any forward-looking statement.
Arkhouse Management and Brigade Capital Management Extend a $5.8 Billion Lifeline to Struggling Macy’s Inc.
In a bold move to rescue the iconic retailer, Arkhouse Management and Brigade Capital Management have proposed a buyout offer of $5.8 billion for Macy’s Inc. This strategic move comes at a time when Macy’s has faced a challenging year, with slumping sales and increasing competition from online retailers.
The buyout offer values Macy’s at $21 per share, a significant premium compared to its recent close at just over $17 per share. Macy’s shares closed at a little over $17 on Friday, representing a 17% decline since the beginning of the year. However, the market responded positively to the news, with a 15% increase in premarket trading on Monday.
Despite the retailer’s efforts to revitalize its brick-and-mortar stores, Macy’s sales have seen a 7% year-over-year decline in the third quarter. The struggle against online competitors and changing consumer preferences has made Macy’s an attractive acquisition target for Arkhouse and Brigade.
Arkhouse, primarily focused on real estate investment, and Brigade Capital, an asset management firm, have expressed their willingness to consider a higher bid after conducting due diligence on Macy’s. This signals their confidence in the potential for a successful turnaround.
Macy’s, with 722 store locations across 43 states, Washington, DC, Puerto Rico, and Guam, has faced challenges for decades. The rise of online giants like Amazon and the dominance of big-box retailers such as Walmart and Target have eroded Macy’s market share. The company’s annual profit and sales forecast was revised in June after a slowdown in customer demand, prompting a candid acknowledgment from Macy’s CEO Jeff Gennette.
“The US consumer, particularly at Macy’s, pulled back more than we anticipated,” Gennette stated on an earnings call. Customers “reallocated” spending to food, essentials, and services, he added.
This acquisition bid follows a similar trend in the retail sector, as evidenced by Kohl’s facing takeover offers in 2022. The challenging economic landscape, marked by volatile interest rates and high inflation, has affected retailers across the board. While online spending proved robust during Black Friday and Cyber Monday, uncertainties remain about the strength of the holiday season, especially after several retailers issued cautious fourth-quarter outlooks.
As Macy’s evaluates the proposal, the retail landscape awaits the potential transformation that Arkhouse Management and Brigade Capital Management could bring to this iconic brand.
Low-Cost Business Model and Disciplined Capital Allocation Drive Solid Operating Performance and Strong EPS Growth
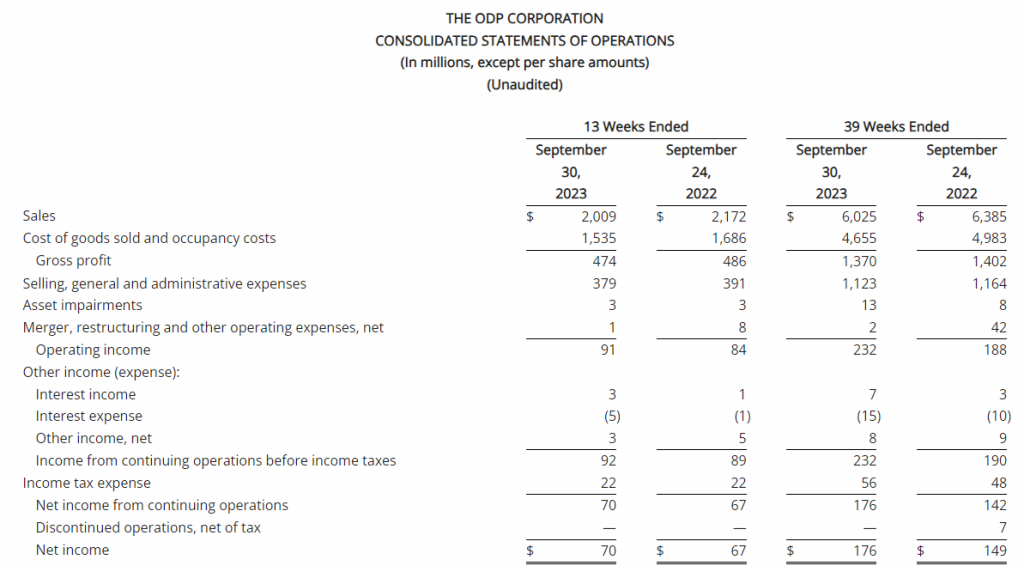
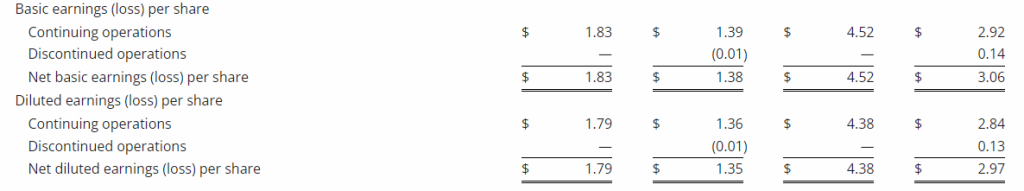
Third Quarter Revenue of $2 Billion with GAAP EPS of $1.79; Adjusted EPS of $1.88
GAAP Operating Income of $91 Million; GAAP Net Income of $70 Million; Adjusted EBITDA of $125 Million
Repurchased $32 Million of Shares in the Third Quarter of 2023
Updates Full-Year 2023 Guidance
BOCA RATON, Fla.–(BUSINESS WIRE)–Nov. 8, 2023– The ODP Corporation (“ODP,” or the “Company”) (NASDAQ:ODP), a leading provider of products, services, and technology solutions to businesses and consumers, today announced results for the third quarter ended September 30, 2023.
Consolidated (in millions, except per share amounts)
3Q23
3Q22
YTD23
YTD22
Selected GAAP and Non-GAAP measures:
Sales
$2,009
$2,172
$6,025
$6,385
Sales change from prior year period
(8)%
(6)%
Operating income
$91
$84
$232
$188
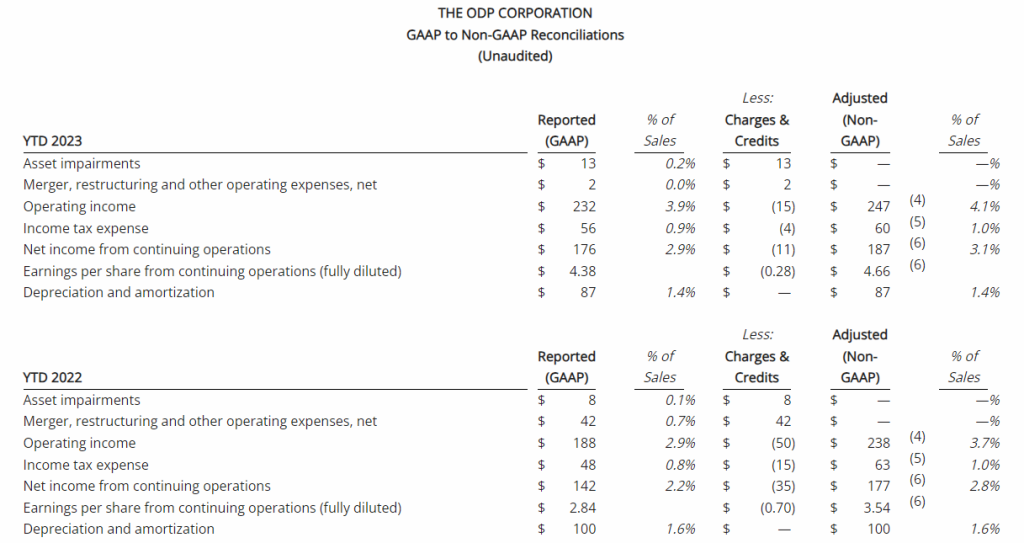
Adjusted operating income (1)
$95
$95
$247
$238
Net income from continuing operations
$70
$67
$176
$142
Diluted earnings per share from continuing operations
$1.79
$1.36
$4.38
$2.84
Adjusted net income from continuing operations (1)
$73
$73
$187
$177
Adjusted earnings per share from continuing operations (fully diluted) (1)
$1.88
$1.48
$4.66
$3.54
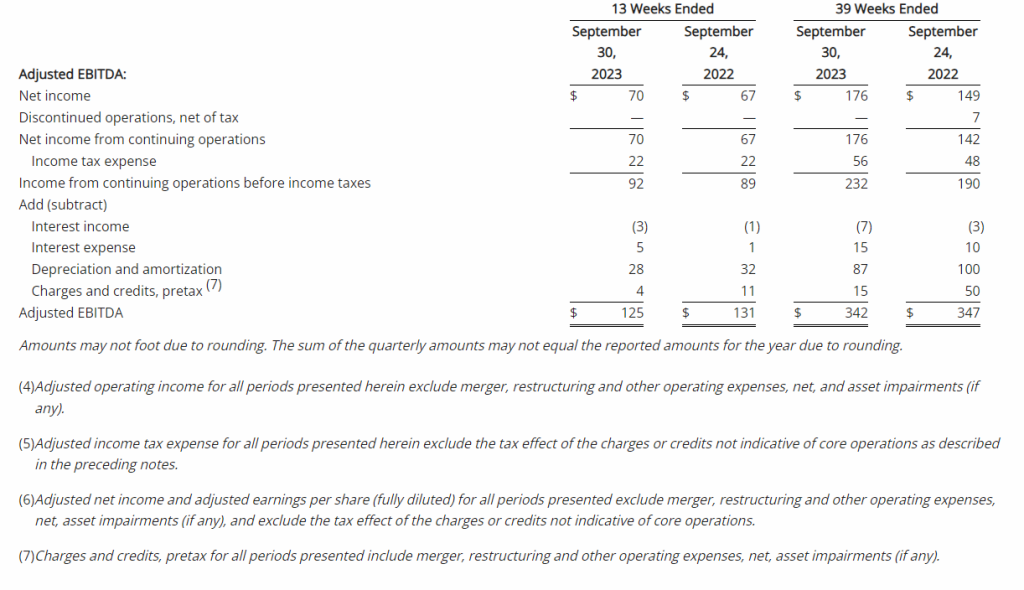
Adjusted EBITDA (1)
$125
$131
$342
$347
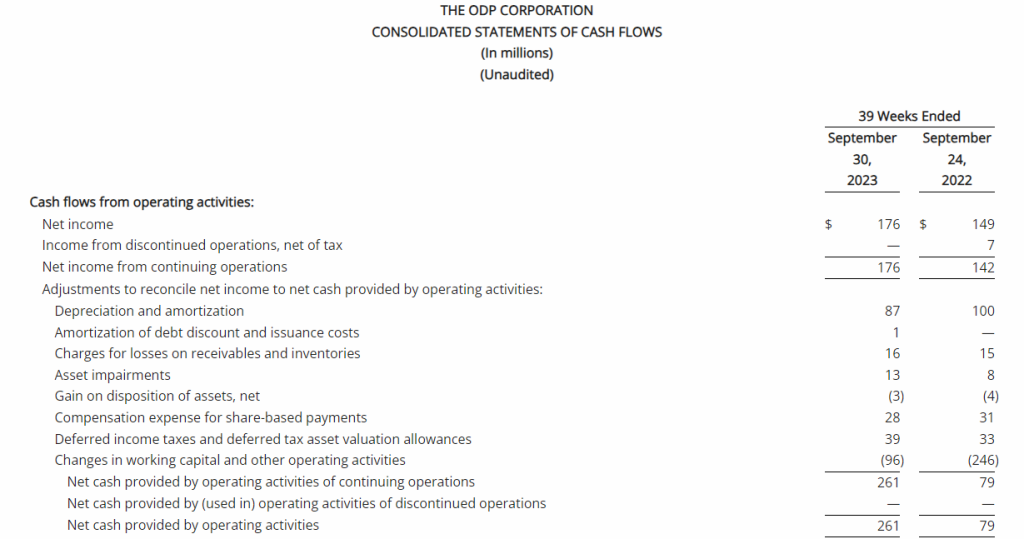
Operating Cash Flow from continuing operations
$112
$163
$261
$79
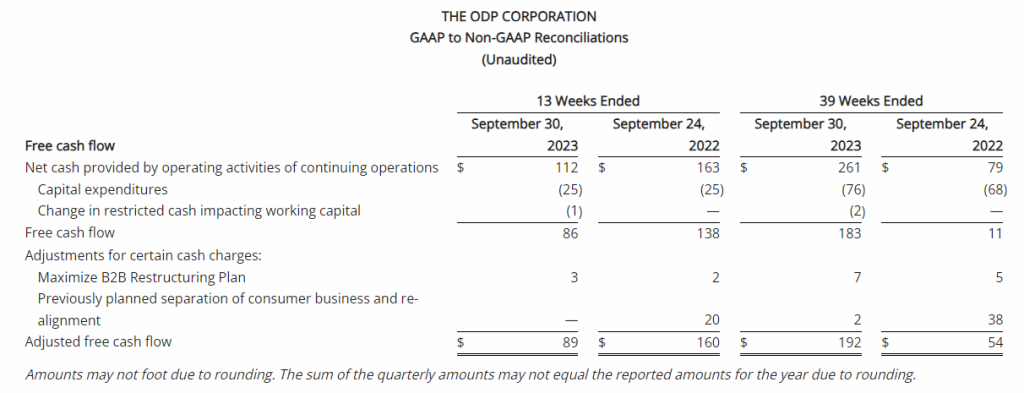
Free Cash Flow (2)
$86
$138
$183
$11
Adjusted Free Cash Flow (3)
$89
$160
$192
$54
Third Quarter 2023 Summary(1)(2)(3)
Total reported sales of $2.0 billion, down 8% versus the prior year, primarily due to lower sales in its Office Depot consumer division, largely driven by 71 fewer retail locations in service compared to the prior year, as well as lower retail and online consumer traffic and transactions
GAAP operating income of $91 million and net income from continuing operations of $70 million, or $1.79 per diluted share, versus $84 million and $67 million, respectively, or $1.36 per diluted share, in the prior year
Adjusted operating income of $95 million, flat compared to the third quarter of 2022; adjusted EBITDA of $125 million, compared to $131 million in the third quarter of 2022
Adjusted net income from continuing operations of $73 million, or adjusted diluted earnings per share from continuing operations of $1.88, versus $73 million or $1.48, respectively, in the prior year
Operating cash flow from continuing operations of $112 million and adjusted free cash flow of $89 million, versus $163 million and $160 million, respectively, in the prior year
Repurchased 659 thousand shares at a cost of $32 million in the third quarter of 2023
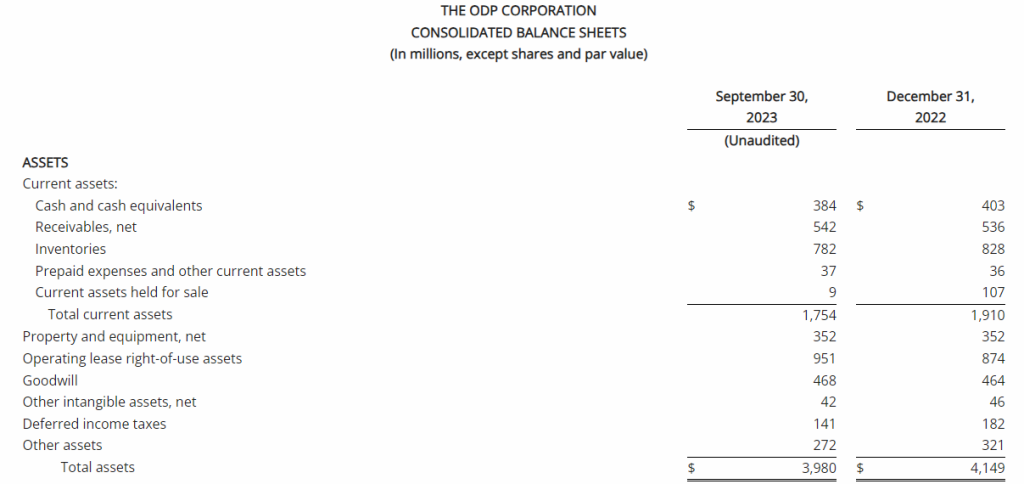
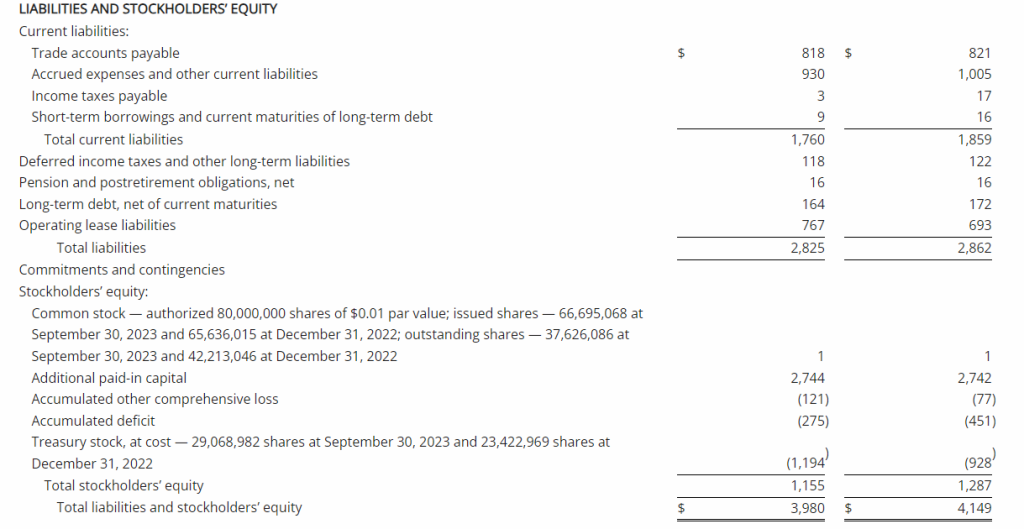
$1.2 billion of total available liquidity including $384 million in cash and cash equivalents at quarter end
“I am extremely impressed seeing the day-to-day commitment and exceptional execution from our team as I fulfill Chief Executive Officer Gerry Smith’s responsibilities while he is on medical leave,” said Joseph Vassalluzzo, ODP’s chairman of the board. “In the quarter, our team delivered strong operating income and earnings per share results against a challenging economic backdrop, reflecting our unwavering commitment to operational excellence and to our low-cost business model approach.
“We continue to make progress across our four business units as we execute our three horizons strategy. This included expanding margins at ODP Business Solutions, new product testing and category expansion at Office Depot, securing new third-party customers at Veyer while remaining on track to more than double third-party EBITDA this year, and enhancing our platform and customer engagement at Varis.
“Our shareholder value creation formula, which integrates operational excellence with a shareholder-focused capital allocation plan, including the repurchase of approximately $32 million of shares during the quarter, contributed to a meaningful year-over-year increase in adjusted earnings per share for the third quarter and revised upward EPS guidance for the full year,” Vassalluzzo added.
“As we look ahead, we anticipate the macroeconomic environment to remain challenging throughout the remainder of the year. However, we are confident in our position of strength and will continue to focus on driving value for shareholders through our low-cost business model, leveraging our multiple routes to market, and continuing with our disciplined capital allocation,” Vassalluzzo concluded.
Consolidated Results
Reported (GAAP) Results
Total reported sales for the third quarter of 2023 were $2 billion, a decrease of 8% compared with the same period last year. This was driven primarily by lower sales in its consumer division, Office Depot, primarily due to 71 fewer stores in service compared to last year related to planned store closures, as well as lower retail and online consumer traffic. Sales at ODP Business Solutions Division were down slightly compared to last year, largely driven by slower return to office trends and lower sales of technology products. Meanwhile, Veyer provided strong logistics support for the ODP Business Solutions and Office Depot Divisions, and continued to capture additional demand for its supply chain and procurement solutions among other third-party customers.
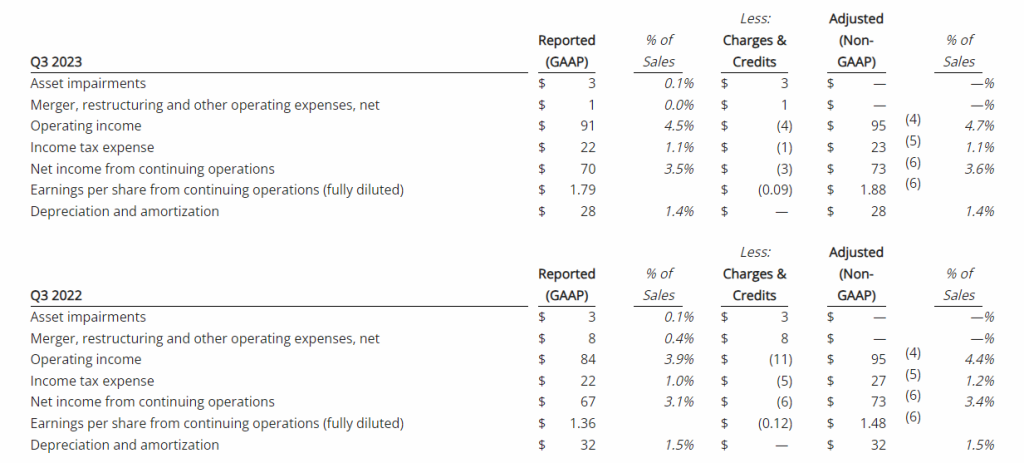
The Company reported operating income of $91 million in the third quarter of 2023, up 8% compared to operating income of $84 million in the prior year period. Operating results in the third quarter of 2023 included $4 million of charges. These charges consisted primarily of $3 million associated with non-cash asset impairments largely related to the operating lease right-of-use (ROU) assets associated with the Company’s retail store locations. Net income from continuing operations was $70 million, or $1.79 per diluted share in the third quarter of 2023, up from $67 million, or $1.36 per diluted share in the third quarter of 2022.
Adjusted (non-GAAP) Results(1)
Adjusted results for the third quarter of 2023 exclude charges and credits totaling $4 million as described above and the associated tax impacts.
Third quarter of 2023 adjusted EBITDA was $125 million compared to $131 million in the prior year period. This included depreciation and amortization of $28 million and $32 million in the third quarters of 2023 and 2022, respectively
Third quarter of 2023 adjusted operating income was $95 million, flat compared to the third quarter of 2022
Third quarter of 2023 adjusted net income from continuing operations was $73 million, or $1.88 per diluted share, compared to $73 million, or $1.48 per diluted share, in the third quarter of 2022, an increase of 27% on a per share basis
Division Results
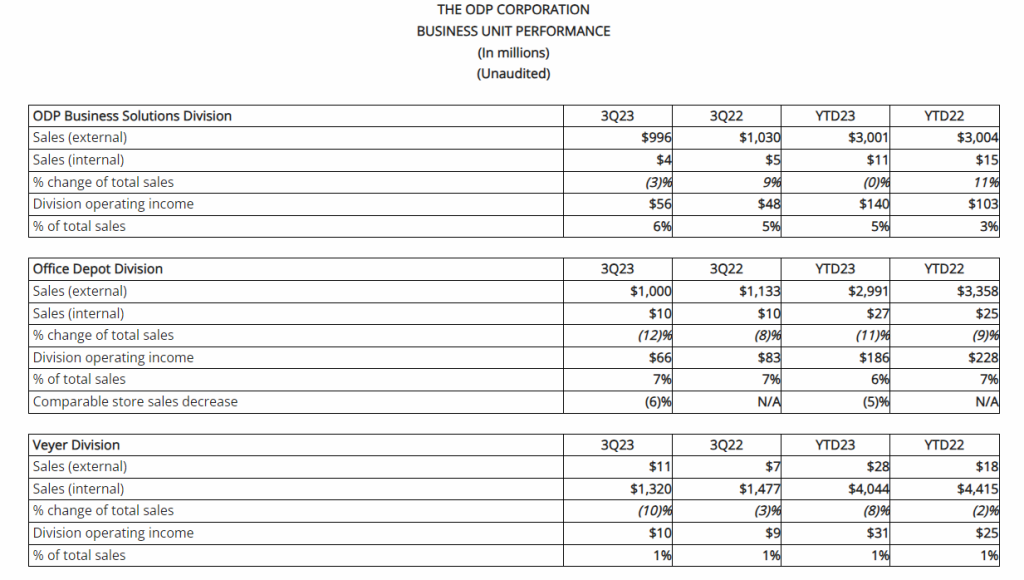
ODP Business Solutions Division
Leading B2B distribution solutions provider serving small, medium and enterprise level companies with an annual trailing-twelve-month revenue in excess of $4 billion
Reported sales were $1.0 billion in the third quarter of 2023, down approximately 3% compared to the same period last year primarily related to lower sales of technology products and weaker macroeconomic conditions
Stronger sales in cleaning and breakroom supplies were more than offset by lower sales of technology and core supplies
Total adjacency category sales, including cleaning and breakroom, furniture, technology, and copy and print, were 44% of total ODP Business Solutions’ sales
Continued strong pipeline and net new business customer additions
Operating income was $56 million in the third quarter of 2023, up 17% over the same period last year, related primarily to higher gross margins. As a percentage of sales, operating income margin was 6%, up 90 basis points compared to the same period last year
Office Depot Division
Leading provider of retail consumer and small business products and services distributed via Office Depot and OfficeMax retail locations and an award-winning eCommerce presence
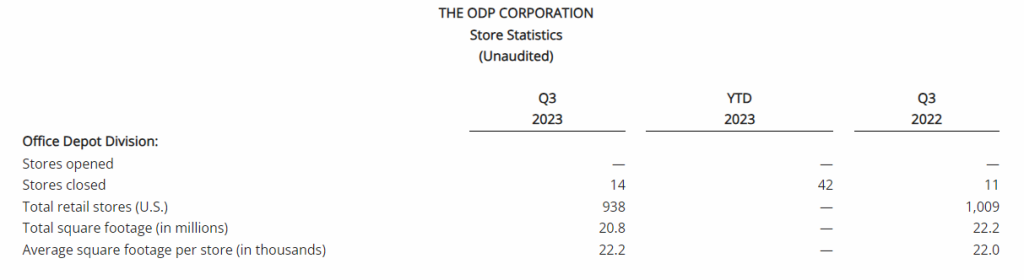
Reported sales were $1.0 billion in the third quarter of 2023, down 12% compared to the prior year period partially due to 71 fewer retail outlets in service associated with planned store closures, as well as lower demand relative to last year in certain product categories, softer back-to-school seasonal demand, and lower online sales. The Company closed 14 retail stores in the quarter and had 938 stores at quarter end. Sales were down approximately 6% on a comparable store basis
Stronger sales of copy and print services were more than offset by lower sales in supplies, technology, and other categories
Store and online traffic were lower year over year due to a greater percentage of customers having returned to the office post pandemic, as well as weaker macroeconomic activity
Operating income was $66 million in the third quarter of 2023, compared to operating income of $83 million during the same period last year, driven primarily by the flow through impact from lower sales. As a percentage of sales, operating income was 7%, flat compared to the same period last year.
Veyer Division
Veyer is a supply chain, distribution, procurement and global sourcing operation with over 35 years of experience and proven leadership, supporting Office Depot and ODP Business Solutions, as well as third-party customers. Veyer’s assets and capabilities include 8 million square feet of infrastructure through a nationwide network of distribution centers, cross-docks, and other facilities throughout the United States; a global sourcing presence in Asia; a large private fleet of vehicles; and next-day delivery to 98.5% of US population
In the third quarter of 2023, Veyer provided strong support for its internal customers, ODP Business Solutions and Office Depot, as well as for its third-party customers, generating sales of $1.3 billion
Operating income was $10 million in the third quarter of 2023, up from $9 million in the prior year period related to the favorable impacts of higher sales to external third parties and lower product costing
In the quarter relative to last year, sales and EBITDA generated from third party customers was up 57% and 119% respectively, resulting in sales of approximately $11 million and EBITDA of $3 million in the quarter
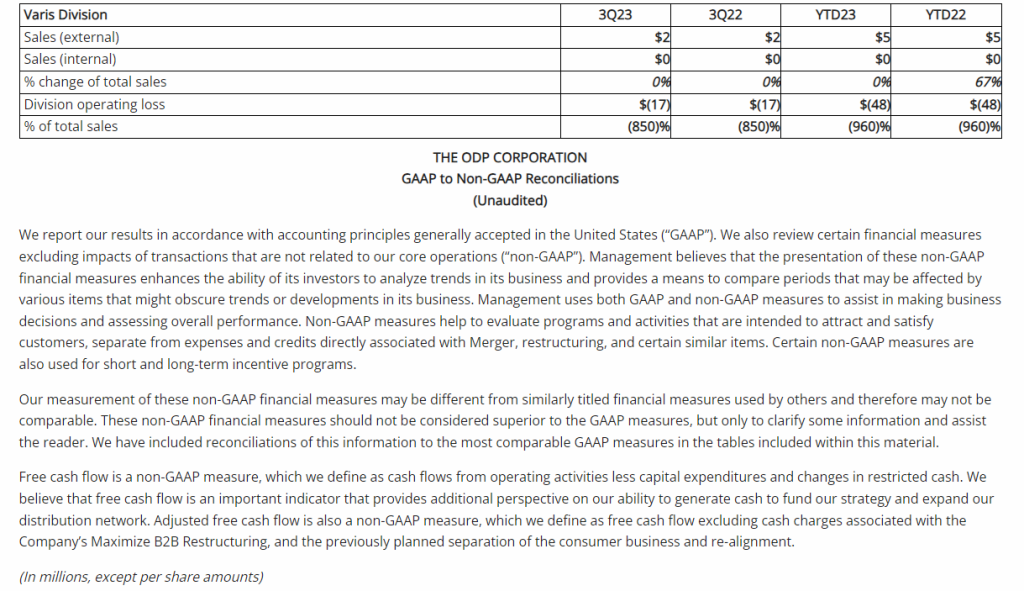
Varis Division
Varis is a tech-enabled B2B indirect procurement marketplace launched in the fourth quarter of 2022, which provides buyers and suppliers a seamless way to transact through the platform’s consumer-like buying experience and advanced spend management tools
Successfully launched the platform in the fourth quarter of 2022; adding and on-boarding new customers, incorporating feedback, and adding new features and capabilities to the platform
Varis generated revenues in the third quarter of 2023 of $2 million, flat compared to the third quarter of 2022
Operating loss was $17 million, flat compared to the third quarter of 2022, as the division continued to enhance its platform and onboard new customers
Share Repurchases
The Company continued to execute under its previously announced $1 billion share repurchase authorization, available through year-end 2025. During the third quarter of 2023, the Company repurchased 659 thousand shares at a cost of $32 million. Since the inception of the authorization beginning in November 2022, the Company has repurchased 9 million shares for approximately $420 million.
The number of shares to be repurchased in the future and the timing of such transactions will depend on a variety of factors, including market conditions, regulatory requirements, and other corporate considerations. The current authorization could be suspended or discontinued at any time as determined by the Board of Directors.
Balance Sheet and Cash Flow
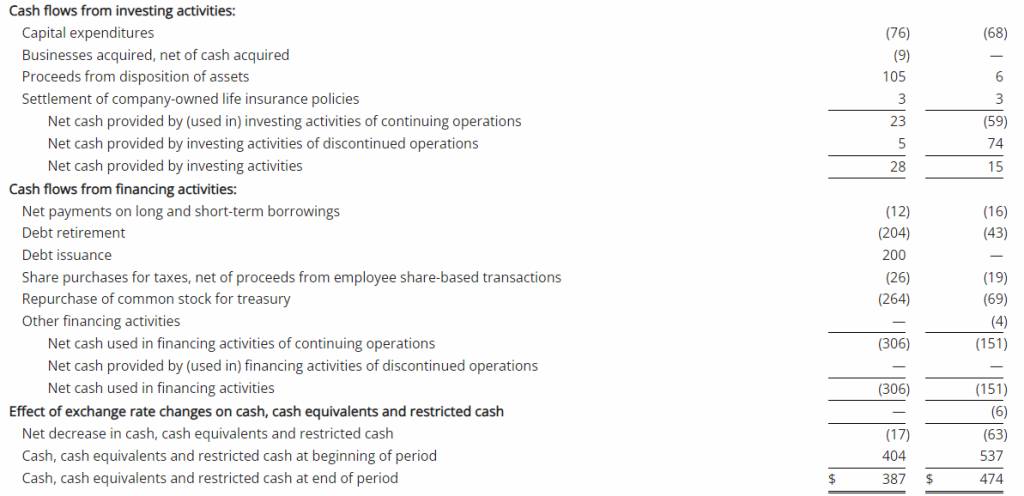
As of September 30, 2023, ODP had total available liquidity of approximately $1.2 billion, consisting of $384 million in cash and cash equivalents and $771 million of available credit under the Third Amended Credit Agreement. Total debt was $173 million.
For the third quarter of 2023, cash generated by operating activities of continuing operations was $112 million, which included $3 million in restructuring and other spend, compared to cash provided by operating activities of continuing operations of $163 million in the third quarter of the prior year, which included $22 million in restructuring and other spend. The year-over-year change in operating cash flow is largely related to the timing of certain working capital items.
Capital expenditures in the third quarter of 2023 and 2022 were $25 million, reflecting continued growth investments in the Company’s digital transformation, distribution network, and eCommerce capabilities. Adjusted Free Cash Flow(3) was $89 million in the third quarter of 2023, compared to $160 million in the prior year period.
“I would like to recognize our entire team for their commitment and dedication in managing inventory and working capital, which has resulted in another quarter of strong cash flow generation,” said Anthony Scaglione, executive vice president and chief financial officer of The ODP Corporation. “As we work to close out the year, we maintain our disciplined approach, focusing on managing costs, maximizing cash flow, and executing our capital allocation plan,” Scaglione added.
Updated 2023 Expectations
“Our team’s unwavering commitment to delivering value is evident in our compelling customer proposition, strong free cash flow generation, and strategic capital allocation for the benefit of our shareholders,” highlighted Vassalluzzo. “While we acknowledge the influence of the challenging macroeconomic environment on consumer and business activity, we remain steadfast in our dedication to driving long-term value within our business through effective execution of our three horizons strategy.”
The Company’s full year guidance for 2023 included in this release includes non-GAAP measures, such as Adjusted EBITDA, Adjusted Operating Income, Adjusted Earnings per Share and Adjusted Free Cash Flow. These measures exclude charges or credits not indicative of core operations, which may include but not be limited to merger integration expenses, restructuring charges, acquisition-related costs, executive transition costs, asset impairments and other significant items that currently cannot be predicted without unreasonable efforts. The exact amount of these charges or credits are not currently determinable but may be significant. Accordingly, the Company is unable to provide equivalent GAAP measures or reconciliations from GAAP to non-GAAP for these financial measures without unreasonable effort.
The Company is updating its full year guidance for 2023 as follows:
Previous 2023 Guidance
Updated 2023 Guidance
Sales
Approximately $8 billion
Revised to $7.8 – $7.9 billion
Adjusted EBITDA
$400 – $430 million
Affirmed
Adjusted Operating Income
$270 – $300 million
Revised to $280 – $310 million
Adjusted Earnings per Share(*)
$5.00 – $5.30 per share
Revised to $5.30 – $5.60 per share
Adjusted Free Cash Flow(**)
$200 – $230 million
Affirmed
Capital Expenditures
$100 – $120 million
Affirmed
*Adjusted Earnings per Share (EPS) guidance for 2023 includes tax benefits related to R&D and employee-related tax credits and includes expected impact from share repurchases
**Adjusted Free Cash Flow is defined as cash flows from operating activities less capital expenditures excluding cash charges associated with the Company’s Maximize B2B Restructuring and expenses incurred in connection with our previously planned separation of the consumer business and re-alignment
“Our year-to-date performance speaks to the resilience of our team and the strength of our low-cost business model and capital allocation approach,” said Scaglione. “While the weaker macroeconomic conditions have impacted the level of consumer and business activity creating top-line headwinds, our continued focus on operational excellence has us well positioned to continue driving strong operating results as we close out the year. Our updated guidance assumes a consistent overall macroeconomic environment and reflects our year-to-date revenue trends, while increasing our outlook for adjusted operating income and adjusted EPS.
Our increased adjusted EPS outlook also assumes a lower full-year effective tax rate driven by the execution of certain tax credits, lower than anticipated interest expense associated with projected intra-quarter ABL borrowings, and the impact from our continued share buyback activity,” Scaglione added.
The ODP Corporation will webcast a call with financial analysts and investors on November 8, 2023, at 9:00 am Eastern Time, which will be accessible to the media and the general public. To listen to the conference call via webcast, please visit The ODP Corporation’s Investor Relations website at investor.theodpcorp.com. A replay of the webcast will be available approximately two hours following the event.
(1)
As presented throughout this release, adjusted results represent non-GAAP financial measures and exclude charges or credits not indicative of core operations and the tax effect of these items, which may include but not be limited to merger integration, restructuring, acquisition costs, and asset impairments. Reconciliations from GAAP to non-GAAP financial measures can be found in this release as well as on the Company’s Investor Relations website at investor.theodpcorp.com.
(2)
As used in this release, Free Cash Flow is defined as cash flows from operating activities less capital expenditures. Free Cash Flow is a non-GAAP financial measure and reconciliations from GAAP financial measures can be found in this release as well as on the Company’s Investor Relations website at investor.theodpcorp.com.
(3)
As used in this release, Adjusted Free Cash Flow is defined as Free Cash Flow excluding cash charges associated with the Company’s Maximize B2B Restructuring, and expenses incurred in connection with our previously planned separation of the consumer business and re-alignment. Adjusted Free Cash Flow is a non-GAAP financial measure and reconciliations from GAAP financial measures can be found in this release as well as on the Company’s Investor Relations website at investor.theodpcorp.com.
About The ODP Corporation
The ODP Corporation (NASDAQ:ODP) is a leading provider of products, services, and technology solutions through an integrated business-to-business (B2B) distribution platform and omni-channel presence, which includes supply chain and distribution operations, dedicated sales professionals, a B2B digital procurement solution, online presence, and a network of Office Depot and OfficeMax retail stores. Through its operating companies ODP Business Solutions, LLC; Office Depot, LLC; Veyer, LLC; and Varis, Inc, The ODP Corporation empowers every business, professional, and consumer to achieve more every day. For more information, visit theodpcorp.com.
This communication may contain forward-looking statements within the meaning of the Private Securities Litigation Reform Act of 1995. These statements or disclosures may discuss goals, intentions and expectations as to future trends, plans, events, results of operations, cash flow or financial condition, the potential impacts on our business due to the unknown severity and duration of the COVID-19 pandemic, or state other information relating to, among other things, the Company, based on current beliefs and assumptions made by, and information currently available to, management. Forward-looking statements generally will be accompanied by words such as “anticipate,” “believe,” “plan,” “could,” “estimate,” “expect,” “forecast,” “guidance,” “expectations”, “outlook,” “intend,” “may,” “possible,” “potential,” “predict,” “project,” “propose” or other similar words, phrases or expressions, or other variations of such words. These forward-looking statements are subject to various risks and uncertainties, many of which are outside of the Company’s control. There can be no assurances that the Company will realize these expectations or that these beliefs will prove correct, and therefore investors and stakeholders should not place undue reliance on such statements.
Factors that could cause actual results to differ materially from those in the forward-looking statements include, among other things, highly competitive office products market and failure to differentiate the Company from other office supply resellers or respond to decline in general office supplies sales or to shifting consumer demands; competitive pressures on the Company’s sales and pricing; the risk that the Company is unable to transform the business into a service-driven, B2B platform that such a strategy will not result in the benefits anticipated; the risk that the Company will not be able to achieve the expected benefits of its strategic plans, including its strategic shift to maintain all of its businesses under common ownership; the risk that the Company may not be able to realize the anticipated benefits of acquisitions due to unforeseen liabilities, future capital expenditures, expenses, indebtedness and the unanticipated loss of key customers or the inability to achieve expected revenues, synergies, cost savings or financial performance; the risk that the Company is unable to successfully maintain a relevant omni-channel experience for its customers; the risk that the Company is unable to execute the Maximize B2B Restructuring Plan successfully or that such plan will not result in the benefits anticipated; failure to effectively manage the Company’s real estate portfolio; loss of business with government entities, purchasing consortiums, and sole- or limited-source distribution arrangements; failure to attract and retain qualified personnel, including employees in stores, service centers, distribution centers, field and corporate offices and executive management, and the inability to keep supply of skills and resources in balance with customer demand; failure to execute effective advertising efforts and maintain the Company’s reputation and brand at a high level; disruptions in computer systems, including delivery of technology services; breach of information technology systems affecting reputation, business partner and customer relationships and operations and resulting in high costs and lost revenue; unanticipated downturns in business relationships with customers or terms with the suppliers, third-party vendors and business partners; disruption of global sourcing activities, evolving foreign trade policy (including tariffs imposed on certain foreign made goods); exclusive Office Depot branded products are subject to additional product, supply chain and legal risks; product safety and quality concerns of manufacturers’ branded products and services and Office Depot private branded products; covenants in the credit facility; general disruption in the credit markets; incurrence of significant impairment charges; retained responsibility for liabilities of acquired companies; fluctuation in quarterly operating results due to seasonality of the Company’s business; changes in tax laws in jurisdictions where the Company operates; increases in wage and benefit costs and changes in labor regulations; changes in the regulatory environment, legal compliance risks and violations of the U.S. Foreign Corrupt Practices Act and other worldwide anti-bribery laws; volatility in the Company’s common stock price; changes in or the elimination of the payment of cash dividends on Company common stock; macroeconomic conditions such as higher interest rates and future declines in business or consumer spending; increases in fuel and other commodity prices and the cost of material, energy and other production costs, or unexpected costs that cannot be recouped in product pricing; unexpected claims, charges, litigation, dispute resolutions or settlement expenses; catastrophic events, including the impact of weather events on the Company’s business; the discouragement of lawsuits by shareholders against the Company and its directors and officers as a result of the exclusive forum selection of the Court of Chancery, the federal district court for the District of Delaware or other Delaware state courts by the Company as the sole and exclusive forum for such lawsuits; and the impact of the COVID-19 pandemic on the Company’s business. The foregoing list of factors is not exhaustive. Investors and shareholders should carefully consider the foregoing factors and the other risks and uncertainties described in the Company’s Annual Reports on Form 10-K, Quarterly Reports on Form 10-Q, and Current Reports on Form 8-K filed with the U.S. Securities and Exchange Commission. The Company does not assume any obligation to update or revise any forward-looking statements.
FORT WAYNE, Ind., Nov. 01, 2023 (GLOBE NEWSWIRE) — Vera Bradley, Inc. (Nasdaq: VRA) (the “Company”) today announced that it plans to report results for the third quarter ended October 28, 2023 at 8:00 a.m. Eastern Time on Wednesday, December 6, 2023.
The Company will host a conference call to discuss its financial results at 9:30 a.m. Eastern Time that same day. A live webcast of the conference call will be available on the Investor Relations section of the Company’s website, www.verabradley.com. Alternatively, interested parties may dial into the call at (888) 204-4368, and enter the access code 7089328. A replay will be available shortly after the conclusion of the call and remain available through December 20, 2023. To access the recording, listeners should dial (844) 512-2921, and enter the access code 7089328.
ABOUT VERA BRADLEY, INC.
Vera Bradley, Inc. operates two unique lifestyle brands – Vera Bradley and Pura Vida. Vera Bradley and Pura Vida are complementary businesses, both with devoted, emotionally connected, and multi-generational female customer bases; alignment as causal, comfortable, affordable, and fun brands; positioning as “gifting” and socially-connected brands; strong, entrepreneurial cultures; a keen focus on community, charity, and social consciousness; multi-channel distribution strategies; and talented leadership teams aligned and committed to the long-term success of their brands.
Vera Bradley, based in Fort Wayne, Indiana, is a leading designer of women’s handbags, luggage and other travel items, fashion and home accessories, and unique gifts. Founded in 1982 by friends Barbara Bradley Baekgaard and Patricia R. Miller, the brand is known for its innovative designs, iconic patterns, and brilliant colors that inspire and connect women unlike any other brand in the global marketplace.
In July 2019, Vera Bradley, Inc. acquired a 75% interest in Creative Genius, Inc., which also operates under the name Pura Vida Bracelets (“Pura Vida”). Pura Vida, based in La Jolla, California, is a digitally native, highly engaging lifestyle brand founded in 2010 by friends Paul Goodman and Griffin Thall. Pura Vida has a differentiated and expanding offering of bracelets, jewelry, and other lifestyle accessories. The Company acquired the remaining 25% of Pura Vida in January 2023.
LAKE ZURICH, Ill.–(BUSINESS WIRE)– ACCO Brands Corporation (NYSE: ACCO) today announced that its board of directors has declared a quarterly cash dividend of $0.075 per share. The dividend will be paid on December 6, 2023, to stockholders of record as of the close of business on November 15, 2023.
“This is the Company’s 24th quarterly cash dividend since it began paying dividends in 2018. The Company’s dividend has become an important part of our capital allocation strategy and we remain committed to supporting our quarterly dividend with our robust free cash flow. At the current stock price, on an annualized basis, our shareholders are receiving an almost 6% yield on their investment,” said Tom Tedford, President and Chief Executive Officer of ACCO Brands.
About ACCO Brands Corporation
ACCO Brands, the Home of Great Brands Built by Great People, designs, manufactures and markets consumer and end-user products that help people work, learn, play and thrive. Our widely recognized brands include AT-A-GLANCE®, Five Star®, Kensington®, Leitz®, Mead®, PowerA®, Swingline®, Tilibra® and many others. More information about ACCO Brands Corporation (NYSE: ACCO) can be found at www.accobrands.com.
BOCA RATON, Fla.–(BUSINESS WIRE)–Oct. 25, 2023– The ODP Corporation (NASDAQ:ODP) (“ODP,” or the “Company”), a leading provider of business services, products and digital workplace technology solutions to businesses and consumers, will announce third quarter 2023 financial results before the market open on Wednesday, November 8th, 2023. The ODP Corporation will webcast a call with financial analysts and investors that day at 9:00 am Eastern Time which will be accessible to the media and the general public.
To listen to the conference call via webcast, please visit The ODP Corporation’s Investor Relations website at investor.theodpcorp.com. A replay of the webcast will be available approximately two hours following the event. A copy of the earnings press release, supplemental financial disclosures and presentation will also be available on the website.
About The ODP Corporation
The ODP Corporation (NASDAQ:ODP) is a leading provider of products and services through an integrated business-to-business (B2B) distribution platform and omnichannel presence, which includes world-class supply chain and distribution operations, dedicated sales professionals, a B2B digital procurement solution, online presence and a network of Office Depot and OfficeMax retail stores. Through its operating companies Office Depot, LLC; ODP Business Solutions, LLC; Veyer, LLC; and Varis, Inc., The ODP Corporation empowers every business, professional, and consumer to achieve more every day. For more information, visit theodpcorp.com.
ODP and ODP Business Solutions are trademarks of ODP Business Solutions, LLC. Office Depot is a trademark of The Office Club, LLC. OfficeMax is a trademark of OMX, Inc. Veyer is a trademark of Veyer, LLC. Varis is a trademark of Varis Inc. Grand&Toy is a trademark of Grand & Toy, LLC in Canada. Any other product or company names mentioned herein are the trademarks of their respective owners.
Instacart experienced a red-hot debut on the public markets as shares soared 40% in its first day of trading. The grocery delivery pioneer opened at $42 per share on the Nasdaq exchange, well above its IPO price of $30.
The opening trade valued Instacart at nearly $14 billion, up from the $10 billion valuation set by its IPO pricing on Monday. Demand from investors seeking exposure to the future of grocery commerce drove the shares sharply higher out of the gate.
Trading volume was heavy early on, with over 18 million shares changing hands in the first 30 minutes. The stock traded as high as $47.57 at its peak, showcasing strong appetite for the newly minted public company.
Instacart (CART) raised $420 million through the IPO by selling 14.1 million shares, representing just 8% of its total outstanding shares. Existing shareholders also sold 7.9 million shares in the offering for liquidity.
The blockbuster debut delivered significant returns for IPO participants during a volatile time for tech stocks. But Instacart’s valuation remains below the $39 billion mark it reached at the height of pandemic demand in 2021, reflecting more measured recent tech valuations.
Still, the strong first day pop is a promising sign for Instacart as it embarks on the public market journey. The company priced its offering conservatively to allow room for an impressive inaugural rally.
The offering adds Instacart to the ranks of publicly traded ecommerce innovators disrupting traditional retail models. It joins the likes of DoorDash, Uber, and Amazon in leveraging technology to unlock the potential of online grocery delivery.
Instacart is at the forefront of transforming the $1 trillion grocery industry through its on-demand digital marketplace. Its platform connects customers with personal shoppers who handle orders from partner grocers and deliver items in as fast as an hour.
Founded in 2012 by an Amazon veteran, Instacart was early to recognize the coming wave of grocery ecommerce. The company scaled rapidly when the pandemic accelerated adoption of online ordering and delivery.
Instacart seized its first-mover advantage to emerge as a leader in the space. It has partnered with prominent national, regional, and local grocers to build a retail network covering over 85% of U.S. households.
The company aligned with shifting consumer preferences for convenience and digital experiences. Busy lifestyles and smartphone ubiquity make grocery delivery a killer app of modern ecommerce.
Instacart smartly invested to expand services like fast unstaffed delivery and self-service pickup. Its Instacart Ads platform also lets brands promote products through sponsored listings.
The company rapidly grew revenue to over $7 billion in 2021 during the pandemic-driven surge. More recently it has focused on boosting profitability as demand normalizes post-Covid.
Instacart generated $14 billion in gross merchandise volume in 2021. Its net revenue neared $2 billion, doubling from 2020. But losses have narrowed dramatically since the company turned EBITDA positive last year.
As the first major tech IPO of 2023, Instacart’s trading provides a blueprint for startups and venture investors awaiting public debuts this year. The initial reception indicates persistent investor appetite for innovative tech names with strong growth narratives.
The blockbuster debut opens an exciting new chapter for Instacart and the future of digital grocery. Its first trading day validated Instacart’s pioneering business model and resilient growth prospects.
Net income totaled $9.3 million, or $0.30 per diluted share; non-GAAP net income totaled $10.2 million, or $0.33 per diluted share
Balance sheet strengthens, with cash and cash equivalents of $48.5 million, no debt, and year-over-year inventories down 22.4%
FORT WAYNE, Ind., Aug. 30, 2023 (GLOBE NEWSWIRE) — Vera Bradley, Inc. (Nasdaq: VRA) today announced its financial results for the second quarter and six months ended July 29, 2023.
In this release, Vera Bradley, Inc. or “the Company” refers to the entire enterprise and includes both the Vera Bradley and Pura Vida brands. Vera Bradley on a stand-alone basis refers to the Vera Bradley brand.
Second Quarter Comments
Jackie Ardrey, Chief Executive Officer of the Company, noted, “Our transformational efforts continue to bear fruit and are the result of the hard work of our associates across the country. We are very pleased with the meaningful year-over-year improvement in second quarter earnings, driven by significant gross margin expansion and successful expense reduction efforts. During the quarter, we carefully managed our debt-free balance sheet, adding to our cash position while continuing to strategically improve our inventory position.
“One of our key goals this year is to stabilize revenues. We continue to make progress on that front, with second quarter consolidated revenues of $128.2 million only modestly below last year.”
“Total second quarter revenues for the Vera Bradley brand were down 1.2% from last year,” Ardrey commented. “Vera Bradley Direct revenue declines resulted from store closures over the last year, while we saw a small comparable store gain in our full line stores. The successful return of the Vera Bradley Annual Outlet Sale offset weakness we experienced in our factory outlet stores in addition to compensating for the elimination of one online outlet sale during the quarter. The remainder of our e-commerce sales continued to perform well. Lastly, Vera Bradley Indirect revenues were up slightly to last year.
“Pura Vida year-over-year sales declined 3.6%, primarily related to a shortfall in wholesale revenues, which we believe will improve in the second half of the year. Store sales remained strong, and we began to realize the benefits of changes in our performance-based marketing program.
“In general, at both brands, customers have responded enthusiastically to our collaborations and to our product offerings when they are innovative and trend-right, even as they have been more selective in their discretionary spending in light of the current macro environment.”
Ardrey continued, “We are taking strategic actions to stabilize and steadily grow Pura Vida’s revenues and to reverse the trends in Vera Bradley’s factory outlet stores through a thorough, multi-pronged approach, including potential pricing adjustments and targeted marketing initiatives aimed to drive traffic and average order size. Our team is focused on generating long-term revenue increases, expanding gross margin, and ensuring strong financial discipline and cost control, which we expect will drive long-term profitable growth.”
Ardrey added, “We continue to make meaningful progress on Project Restoration, focusing on four key pillars of the business for each brand – Consumer, Brand, Product, and Channel. Through the first half of Fiscal 2024, we have progressed as expected. We anticipate execution of Project Restoration will drive this long-term profitable growth and deliver value to our shareholders.”
Summary of Financial Performance for the Second Quarter
Consolidated net revenues totaled $128.2 million compared to $130.4 million in the prior year second quarter ended July 30, 2022.
For the current year second quarter, Vera Bradley, Inc.’s consolidated net income totaled $9.3 million, or $0.30 per diluted share. These results included $0.9 million of net after tax charges, comprised of $0.6 million for the amortization of definite-lived intangible assets, $0.2 million of consulting fees primarily associated with strategic initiatives, and $0.1 million of severance charges. On a non-GAAP basis, Vera Bradley, Inc.’s consolidated second quarter net income totaled $10.2 million, or $0.33 per diluted share.
For the prior year second quarter, Vera Bradley, Inc.’s consolidated net loss totaled ($29.8) million, or ($0.95) per diluted share. These results included $32.2 million of net after tax charges, comprised of $18.2 million of Pura Vida goodwill and intangible asset impairment charges, $4.7 million of inventory adjustments associated with the exit of certain technology products and the write-off of excess mask inventory, $4.7 million of severance charges and other employee costs, $2.3 million of consulting fees associated with cost savings initiatives and CEO search, $0.9 million of purchase order cancellation fees for spring 2023 goods, $0.6 million of store impairment charges, $0.5 million of intangible asset amortization, and $0.3 million of goodMRKT exit costs. On a non-GAAP basis, Vera Bradley, Inc.’s prior year consolidated second quarter net income totaled $2.4 million, or $0.08 per diluted share.
Summary of Financial Performance for the Six Months
Consolidated net revenues totaled $222.5 million for the current year six months ended July 29, 2023, compared to $228.8 million in the prior year six month period ended July 30, 2022.
For the current year six months, Vera Bradley, Inc.’s consolidated net income totaled $4.6 million, or $0.15 per diluted share. These results included $3.0 million of net after tax charges, comprised of $1.5 million of severance charges, $1.1 million for the amortization of definite-lived intangible assets, and $0.4 million of consulting and professional fees primarily associated with strategic initiatives. On a non-GAAP basis, Vera Bradley, Inc.’s consolidated net income for the six months totaled $7.6 million, or $0.24 per diluted share.
For the prior year six months, Vera Bradley, Inc.’s consolidated net loss totaled ($36.7) million, or ($1.15) per diluted share. These results included $33.1 million of net after tax charges, comprised of $18.2 million of Pura Vida goodwill and intangible asset impairment charges, $4.7 million of inventory adjustments associated with the exit of certain technology products and the write-off of excess mask inventory, $4.7 million of severance charges and other employee costs, $2.4 million of consulting fees associated with cost savings initiatives and CEO search, $1.0 million of store and right-of-use asset impairment charges, $0.9 million of purchase order cancellation fees for spring 2023 goods, $0.9 million of intangible asset amortization, and $0.3 million of goodMRKT exit costs. On a non-GAAP basis, Vera Bradley, Inc.’s prior year consolidated net loss for the six months totaled ($3.6) million, or ($0.11) per diluted share.
Non-GAAP Numbers
The current year non-GAAP second quarter and six-month income statement numbers referenced below exclude the previously outlined severance charges, intangible asset amortization, and consulting and professional fees. The prior year non-GAAP second quarter and six-month income statement numbers referenced below exclude the previously outlined goodwill and intangible asset impairment charges, inventory adjustments, severance charges and other employee costs, consulting fees, store and right-of-use asset impairment charges, purchase order cancellation fees, intangible asset amortization, and goodMRKT exit costs.
Second Quarter Details
Current year second quarter Vera Bradley Direct segment revenues totaled $85.7 million, a 1.5% decrease from $87.0 million in the prior year second quarter. Comparable sales declined 5.3% in the second quarter, primarily driven by weakness in the factory outlet channel. The Company permanently closed 19 full-line and two factory outlet stores and opened three factory outlet stores over the last twelve months. This year, the Direct segment revenues included sales from the Vera Bradley Annual Outlet sale, which was not held last year.
Vera Bradley Indirect segment revenues totaled $17.4 million, a 0.2% increase over $17.3 million in the prior year second quarter.
Pura Vida segment revenues totaled $25.1 million, a 3.6% decrease from $26.0 million in the prior year, reflecting a decline in sales to wholesale accounts and a modest decline in ecommerce sales, partially offset by new store growth resulting in non-comparable retail store sales.
Second quarter consolidated gross profit totaled $72.0 million, or 56.2% of net revenues, compared to $60.5 million, or 46.4% of net revenues, in the prior year. On a non-GAAP basis, prior year gross profit totaled $67.8 million, or 52.0% of net revenues. The current year gross profit rate compared to the prior year non-GAAP rate was favorably impacted by lower year-over-year inbound and outbound freight expense and the sell-through of previously-reserved inventory, partially offset by an increase in promotional activity. Prior year gross profit was materially impacted by high inbound and outbound freight expense and deleverage of overhead costs.
Second quarter consolidated SG&A expense totaled $59.4 million, or 46.3% of net revenues, compared to $74.0 million, or 56.8% of net revenues, in the prior year. On a non-GAAP basis, consolidated SG&A expense totaled $58.3 million, or 45.5% of net revenues, compared to $64.0 million, or 49.1% of net revenues, in the prior year. Vera Bradley’s current year non-GAAP SG&A expenses were lower than the prior year primarily due to Company-wide cost reduction initiatives across various areas of the enterprise.
The Company’s second quarter consolidated operating income totaled $12.9 million, or 10.0% of net revenues, compared to an operating loss of ($42.8) million, or (32.8%) of net revenues, in the prior year second quarter. On a non-GAAP basis, the Company’s current year consolidated operating income totaled $14.0 million, or 10.9% of net revenues, compared to $3.9 million, or 3.0% of net revenues, in the prior year.
By segment:
Vera Bradley Direct operating income was $20.6 million, or 24.1% of Direct net revenues, compared to $10.0 million, or 11.5% of Direct net revenues, in the prior year. On a non-GAAP basis, prior year Direct operating income totaled $16.2 million, or 18.6% of Direct revenues.
Vera Bradley Indirect operating income was $6.2 million, or 35.7% of Indirect net revenues, compared to $3.9 million, or 22.6% of Indirect net revenues, in the prior year. On a non-GAAP basis, prior year Indirect operating income totaled $4.9 million, or 28.4% of Indirect net revenues.
Pura Vida’s operating income was $4.0 million, or 15.9% of Pura Vida net revenues, compared to an operating loss of ($28.5) million, or (109.6%) of Pura Vida net revenues, in the prior year. On a non-GAAP basis, Pura Vida’s operating income was $4.8 million, or 19.2% of Pura Vida net revenues, compared to $2.6 million, or 9.8% of Pura Vida net revenues, in the prior year.
Details for the Six Months
Vera Bradley Direct segment revenues for the current year six-month period totaled $144.6 million, a 2.7% decrease from $148.6 million in the prior year. Comparable sales declined 4.5% for the six months. This year, the Direct segment revenues included sales from the Vera Bradley Annual Outlet sale, which was not held last year.
Vera Bradley Indirect segment revenues for the six months totaled $32.7 million, a 4.6% decrease from $34.3 million last year. Prior year revenues reflected a large one-time key account order that was not repeated in the current year.
Pura Vida segment revenues totaled $45.2 million, a 1.5% decrease from $45.9 million in the prior year, reflecting a decline in sales to wholesale accounts and a modest decline in ecommerce sales, partially offset by new store growth resulting in non-comparable retail store sales.
Consolidated gross profit for the six months totaled $123.8 million, or 55.6% of net revenues, compared to $113.0 million, or 49.4% of net revenues, in the prior year. On a non-GAAP basis, prior year gross profit totaled $120.3 million, or 52.6% of net revenues. The current year gross profit rate compared to the prior year non-GAAP rate was favorably impacted by lower year-over-year inbound and outbound freight expense and the sell-through of previously-reserved inventory, partially offset by an increase in promotional activity.
For the six months, consolidated SG&A expense totaled $117.9 million, or 53.0% of net revenues, compared to $135.0 million, or 59.0% of net revenues, in the prior year. On a non-GAAP basis, current year consolidated SG&A expense totaled $113.9 million, or 51.2% of net revenues, compared to $123.4 million, or 53.9% of net revenues, in the prior year. Vera Bradley’s current year non-GAAP SG&A expenses were lower than the prior year primarily due Company-wide cost reduction initiatives across various areas of the enterprise.
For the six months, the Company’s consolidated operating income totaled $6.5 million, 2.9% of net revenues, compared to an operating loss of ($51.1) million, or (22.3%) of net revenues, in the prior year six-month period. On a non-GAAP basis, the Company’s current year consolidated operating income was $10.5 million, or 4.7% of net revenues, compared to an operating loss of ($2.9) million, or (1.2%) of net revenues, in the prior year.
By segment:
Vera Bradley Direct operating income was $28.0 million, or 19.3% million of Direct net revenues, compared to $15.5 million, or 10.5% of Direct net revenues, in the prior year. On a non-GAAP basis, current year Direct operating income was $28.3 million, or 19.6% of Direct net revenues, compared to $21.7 million, or 14.6% of Direct net revenues, in the prior year.
Vera Bradley Indirect operating income was $10.9 million, or 33.3% of Indirect net revenues, compared to $9.4 million, or 27.4% of Indirect net revenues, in the prior year. On a non-GAAP basis, prior year Indirect operating income totaled $10.4 million, or 30.3% of Indirect net revenues.
Pura Vida’s operating income was $5.6 million, or 12.3% of Pura Vida net revenues, compared to an operating loss of ($27.5) million, or (59.9%) of Pura Vida net revenues, in the prior year. On a non-GAAP basis, Pura Vida’s operating income was $7.1 million, or 15.7% of Pura Vida net revenues, compared to $4.4 million, or 9.5% of Pura Vida net revenues, in the prior year.
Balance Sheet
Net capital spending for the six months ended July 29, 2023 totaled $1.7 million compared to $4.4 million in the prior year.
Cash and cash equivalents as of July 29, 2023 totaled $48.5 million compared to $38.3 million at the end of last year’s second quarter. The Company had no borrowings on its $75 million asset-based lending (“ABL”) facility at quarter end.
Subsequent to quarter end, the Company completed renegotiation of its ABL agreement, and the modifications, among other things, convert the interest calculation from LIBOR (London Interbank Offer Rate) to SOFR (Secured Overnight Financing Rate) as well as enhance the Company’s future ability to expand the ABL if necessary. Management believes that its access to liquidity and capital is sufficient to address needs in the foreseeable future.
Total quarter-end inventory was $139.3 million, compared to $179.6 million at the end of the second quarter last year.
During the second quarter, the Company repurchased approximately $683,000 of its common stock (120,220 shares at an average price of $5.68), bringing the total repurchased for the six months to approximately $1.4 million (248,320 shares at an average price of $5.70). The Company has $26.3 million remaining under its $50.0 million repurchase authorization that expires in December 2024.
Forward Outlook
Management is updating certain components of guidance for the fiscal year ending February 3, 2024 (“Fiscal 2024”) based on first half performance, Company initiatives underway, and current macroeconomic trends and expectations. The Company has narrowed the guidance range for diluted earnings per share.
Excluding net revenues, all forward-looking guidance numbers referenced below are non-GAAP. The prior year income statement numbers exclude the previously disclosed charges for goodwill and intangible asset impairment; net inventory and purchase order-related adjustments; severance, retention, and stock-based retirement compensation; consulting and professional fees primarily associated with cost savings initiatives, the CEO search, and strategic initiatives; amortization of definite-lived intangible assets; store and right-of-use asset impairment charges; new CEO sign-on bonus and relocation; and goodMRKT exit costs. Current year guidance excludes any similar charges.
For Fiscal 2024, the Company’s updated expectations are as follows:
Consolidated net revenues of $490 to $500 million. Net revenues totaled $500.0 million in Fiscal 2023.
A consolidated gross profit percentage of 53.0% to 53.8% compared to 51.4% in Fiscal 2023. The Fiscal 2024 gross profit rate is expected to be favorably impacted by lower year-over-year freight expense, cost reduction initiatives, and the sell-through of previously-reserved inventory, partially offset by an increase in promotional activity.
Consolidated SG&A expense of $237 to $243 million compared to $245.3 million in Fiscal 2023. An expected decline in SG&A expense is being driven by Company-wide cost reduction initiatives, partially offset by restoring short-term and long-term incentive compensation to more normalized levels and incremental marketing investment intended to accelerate customer file growth.
Consolidated operating income of $24 to $28 million compared to $12.3 million in Fiscal 2023.
Free cash flow of between $40 and $45 million compared to a cash usage of $21.7 million in Fiscal 2023.
Consolidated diluted EPS of $0.57 to $0.65 based on diluted weighted-average shares outstanding of approximately 31.0 million and an effective tax rate of approximately 28%. Diluted EPS totaled $0.24 last year.
Net capital spending of approximately $5 million compared to $8.2 million in the prior year, reflecting investments associated with new Vera Bradley factory outlet stores and technology and logistics enhancements.
Disclosure Regarding Non-GAAP Measures
The Company’s management does not, nor does it suggest that investors should, consider the supplemental non-GAAP financial measures in isolation from, or as a substitute for, financial information prepared in accordance with accounting principles generally accepted in the United States (“GAAP”). Further, the non-GAAP measures utilized by the Company may be unique to the Company, as they may be different from non-GAAP measures used by other companies.
The Company believes that the non-GAAP measures presented in this earnings release, including free cash flow (cash usage); gross profit; selling, general, and administrative expenses; operating income (loss); net income (loss); net income (loss) attributable and available to Vera Bradley, Inc.; and diluted net income (loss) per share available to Vera Bradley, Inc. common shareholders, along with the associated percentages of net revenues, are helpful to investors because they allow for a more direct comparison of the Company’s year-over-year performance and are consistent with management’s evaluation of business performance. A reconciliation of the non-GAAP measures to the most directly comparable GAAP measures can be found in the Company’s supplemental schedules included in this earnings release.
Call Information
A conference call to discuss results for the second quarter is scheduled for today, Wednesday, August 30, 2023, at 9:30 a.m. Eastern Time. A broadcast of the call will be available via Vera Bradley’s Investor Relations section of its website, www.verabradley.com. Alternatively, interested parties may dial into the call at (888) 394-8218, and enter the access code 1990839. A replay will be available shortly after the conclusion of the call and remain available through September 13, 2023. To access the recording, listeners should dial (844) 512-2921, and enter the access code 1990839.
About Vera Bradley, Inc.
Vera Bradley, Inc. operates two unique lifestyle brands – Vera Bradley and Pura Vida. Vera Bradley and Pura Vida are complementary businesses, both with devoted, emotionally-connected, and multi-generational female customer bases; alignment as casual, comfortable, affordable, and fun brands; positioning as “gifting” and socially-connected brands; strong, entrepreneurial cultures; a keen focus on community, charity, and social consciousness; multi-channel distribution strategies; and talented leadership teams aligned and committed to the long-term success of their brands.
Vera Bradley, based in Fort Wayne, Indiana, is a leading designer of women’s handbags, luggage and other travel items, fashion and home accessories, and unique gifts. Founded in 1982 by friends Barbara Bradley Baekgaard and Patricia R. Miller, the brand is known for its innovative designs, iconic patterns, and brilliant colors that inspire and connect women unlike any other brand in the global marketplace.
In July 2019, Vera Bradley, Inc. acquired a 75% interest in Creative Genius, Inc., which also operates under the name Pura Vida Bracelets (“Pura Vida”). Pura Vida, based in La Jolla, California, is a digitally native, highly-engaging lifestyle brand founded in 2010 by friends Paul Goodman and Griffin Thall. Pura Vida has a differentiated and expanding offering of bracelets, jewelry, and other lifestyle accessories. The Company acquired the remaining 25% of Pura Vida in January 2023.
The Company has three reportable segments: Vera Bradley Direct (“VB Direct”), Vera Bradley Indirect (“VB Indirect”), and Pura Vida. The VB Direct business consists of sales of Vera Bradley products through Vera Bradley Full-Line and Factory Outlet stores in the United States, www.verabradley.com, Vera Bradley’s online outlet site, and the Vera Bradley annual outlet sale in Fort Wayne, Indiana. The VB Indirect business consists of sales of Vera Bradley products to approximately 1,700 specialty retail locations throughout the United States, as well as select department stores, national accounts, third party e-commerce sites, and third-party inventory liquidators, and royalties recognized through licensing agreements related to the Vera Bradley brand. The Pura Vida segment consists of sales of Pura Vida products through the Pura Vida websites, www.puravidabracelets.com, www.puravidabracelets.ca, and www.puravidabracelets.eu; through the distribution of its products to wholesale retailers and department stores; and through its Pura Vida retail stores.
Website Information
We routinely post important information for investors on our website www.verabradley.com in the “Investor Relations” section. We intend to use this webpage as a means of disclosing material, non-public information and for complying with our disclosure obligations under Regulation FD. Accordingly, investors should monitor the Investor Relations section of our website, in addition to following our press releases, SEC filings, public conference calls, presentations and webcasts. The information contained on, or that may be accessed through, our webpage is not incorporated by reference into, and is not a part of, this document.
Investors and other interested parties may also access the Company’s most recent Corporate Responsibility and Sustainability Report outlining its ESG (Environmental, Social, and Governance) initiatives at https://verabradley.com/pages/corporate-responsibility.
Vera Bradley Safe Harbor Statement
Certain statements in this release are “forward-looking statements” made pursuant to the safe-harbor provisions of the Private Securities Litigation Reform Act of 1995. Such forward-looking statements reflect the Company’s current expectations or beliefs concerning future events and are subject to various risks and uncertainties that may cause actual results to differ materially from those that we expected, including: possible adverse changes in general economic conditions and their impact on consumer confidence and spending; possible inability to predict and respond in a timely manner to changes in consumer demand; possible loss of key management or design associates or inability to attract and retain the talent required for our business; possible inability to maintain and enhance our brands; possible inability to successfully implement the Company’s long-term strategic plans; possible inability to successfully open new stores, close targeted stores, and/or operate current stores as planned; incremental tariffs or adverse changes in the cost of raw materials and labor used to manufacture our products; possible adverse effects resulting from a significant disruption in our distribution facilities; or business disruption caused by pandemics. Risks, uncertainties, and assumptions also include the possibility that Pura Vida acquisition benefits may not materialize as expected and that Pura Vida’s business may not perform as expected. More information on potential factors that could affect the Company’s financial results is included from time to time in the “Risk Factors” and “Management’s Discussion and Analysis of Financial Condition and Results of Operations” sections of the Company’s public reports filed with the SEC, including the Company’s Form 10-K for the fiscal year ended January 28, 2023. We undertake no obligation to publicly update or revise any forward-looking statement. Financial schedules are attached to this release.
Liabilities, Redeemable Noncontrolling Interest, and Shareholders’ Equity
Current liabilities:
Accounts payable
$
21,605
$
20,350
$
43,722
Accrued employment costs
12,965
14,312
16,018
Short-term operating lease liabilities
19,587
19,714
19,768
Other accrued liabilities
13,496
12,723
21,526
Income taxes payable
528
558
374
Total current liabilities
68,181
67,657
101,408
Long-term operating lease liabilities
66,718
74,664
84,015
Other long-term liabilities
82
90
157
Total liabilities
134,981
142,411
185,580
Redeemable noncontrolling interest
–
10,712
23,491
Shareholders’ equity:
Additional paid-in-capital
111,663
109,718
107,941
Retained earnings
279,204
274,629
297,623
Accumulated other comprehensive loss
(69
)
(105
)
(135
)
Treasury stock
(134,279
)
(132,864
)
(131,279
)
Total shareholders’ equity of Vera Bradley, Inc.
256,519
251,378
274,150
Total liabilities, redeemable noncontrolling interest, and shareholders’ equity
$
391,500
$
404,501
$
483,221
Vera Bradley, Inc.
Condensed Consolidated Statements of Operations
(in thousands, except per share amounts)
(unaudited)
Thirteen Weeks Ended
Twenty-Six Weeks Ended
July 29, 2023
July 30, 2022
July 29, 2023
July 30, 2022
Net revenues
$
128,172
$
130,371
$
222,534
$
228,830
Cost of sales
56,156
69,854
98,769
115,799
Gross profit
72,016
60,517
123,765
113,031
Selling, general, and administrative expenses
59,405
74,042
117,911
134,956
Impairment of goodwill and intangible assets
–
29,338
–
29,338
Other income, net
260
42
631
209
Operating income (loss)
12,871
(42,821
)
6,485
(51,054
)
Interest expense, net
12
36
44
76
Income (loss) before income taxes
12,859
(42,857
)
6,441
(51,130
)
Income tax expense (benefit)
3,605
(5,956
)
1,866
(7,519
)
Net income (loss)
9,254
(36,901
)
4,575
(43,611
)
Less: Net loss attributable to redeemable noncontrolling interest
–
(7,134
)
–
(6,870
)
Net income (loss) attributable to Vera Bradley, Inc.
$
9,254
$
(29,767
)
$
4,575
$
(36,741
)
Basic weighted-average shares outstanding
30,901
31,429
30,847
32,051
Diluted weighted-average shares outstanding
31,139
31,429
31,208
32,051
Basic net income (loss) per share available to Vera Bradley, Inc. common shareholders
$
0.30
$
(0.95
)
$
0.15
$
(1.15
)
Diluted net income (loss) per share available to Vera Bradley, Inc. common shareholders
$
0.30
$
(0.95
)
$
0.15
$
(1.15
)
Vera Bradley, Inc.
Condensed Consolidated Statements of Cash Flows
(in thousands)
(unaudited)
Twenty-Six Weeks Ended
July 29, 2023
July 30, 2022
Cash flows from operating activities
Net income (loss)
$
4,575
$
(43,611
)
Adjustments to reconcile net income (loss) to net cash provided by (used in) operating activities:
Depreciation of property, plant, and equipment
4,070
4,371
Amortization of operating right-of-use assets
10,501
10,621
Goodwill and intangible asset impairment
–
29,338
Other impairment charges
–
1,351
Amortization of intangible assets
1,458
1,537
Provision for doubtful accounts
17
(119
)
Stock-based compensation
1,601
1,444
Deferred income taxes
2,102
(5,419
)
Other non-cash loss, net
40
–
Changes in assets and liabilities:
Accounts receivable
(1,856
)
(4,793
)
Inventories
2,974
(34,676
)
Prepaid expenses and other assets
1,107
348
Accounts payable
1,403
12,759
Income taxes
(899
)
4,652
Operating lease liabilities, net
(10,552
)
(12,910
)
Accrued and other liabilities
(566
)
7,989
Net cash provided by (used in) operating activities
15,975
(27,118
)
Cash flows from investing activities
Purchases of property, plant, and equipment
(1,727
)
(4,391
)
Cash paid for business acquisition
(10,000
)
–
Net cash used in investing activities
(11,727
)
(4,391
)
Cash flows from financing activities
Tax withholdings for equity compensation
(942
)
(1,410
)
Repurchase of common stock
(1,415
)
(16,477
)
Distributions to redeemable noncontrolling interest
–
(613
)
Net cash used in financing activities
(2,357
)
(18,500
)
Effect of exchange rate changes on cash and cash equivalents
36
(106
)
Net increase (decrease) in cash and cash equivalents
$
1,927
$
(50,115
)
Cash and cash equivalents, beginning of period
46,595
88,436
Cash and cash equivalents, end of period
$
48,522
$
38,321
Vera Bradley, Inc.
Second Quarter Fiscal 2024
GAAP to Non-GAAP Reconciliation Thirteen Weeks Ended July 29, 2023
(in thousands, except per share amounts)
(unaudited)
Thirteen Weeks Ended
As Reported
Other Items
Non-GAAP (Excluding Items)
Gross profit
$
72,016
$
–
$
72,016
Selling, general, and administrative expenses
59,405
1,101
1
58,304
Operating income (loss)
12,871
(1,101
)
13,972
Income (loss) before income taxes
12,859
(1,101
)
13,960
Income tax expense (benefit)
3,605
(157
)
2
3,762
Net income (loss)
9,254
(944
)
10,198
Less: Net loss attributable to redeemable noncontrolling interest
–
–
–
Net income (loss) attributable to Vera Bradley, Inc.
9,254
(944
)
10,198
Diluted net income (loss) per share available to Vera Bradley, Inc. common shareholders
$
0.30
$
(0.03
)
$
0.33
Vera Bradley Direct segment operating income
$
20,621
$
–
$
20,621
Vera Bradley Indirect segment operating income
$
6,204
$
–
$
6,204
Pura Vida segment operating income (loss)
$
4,000
$
(808
)
3
$
4,808
Unallocated corporate expenses
$
(17,954
)
$
(293
)
4
$
(17,661
)
1Items include $729 for the amortization of definite-lived intangible assets; $293 for certain professional fees and consulting fees associated with strategic initiatives; and $79 for severance charges
2Related to the tax impact of the items mentioned above
3Related to $729 for the amortization of definite-lived intangible assets and $79 for severance charges
4Related to certain professional fees and consulting fees for strategic initiatives
Vera Bradley, Inc.
Second Quarter Fiscal 2023
GAAP to Non-GAAP Reconciliation Thirteen Weeks Ended July 30, 2022
(in thousands, except per share amounts)
(unaudited)
Thirteen Weeks Ended
As Reported
Other Items
Non-GAAP (Excluding Items)
Gross profit (loss)
$
60,517
$
(7,276
)
1
$
67,793
Selling, general, and administrative expenses
74,042
10,076
2
63,966
Impairment of goodwill and intangible assets
29,338
29,338
–
Operating (loss) income
(42,821
)
(46,690
)
3,869
(Loss) Income before income taxes
(42,857
)
(46,690
)
3,833
Income tax (benefit) expense
(5,956
)
(6,760
)
3
804
Net (loss) income
(36,901
)
(39,930
)
3,029
Less: Net (loss) income attributable to redeemable noncontrolling interest
(7,134
)
(7,771
)
637
Net (loss) income attributable to Vera Bradley, Inc.
(29,767
)
(32,159
)
2,392
Diluted net (loss) income per share available to Vera Bradley, Inc. common shareholders
$
(0.95
)
$
(1.02
)
$
0.08
Vera Bradley Direct segment operating income (loss)
$
10,044
$
(6,173
)
4
$
16,217
Vera Bradley Indirect segment operating income (loss)
$
3,918
$
(994
)
5
$
4,912
Pura Vida segment operating (loss) income
$
(28,534
)
$
(31,085
)
6
$
2,551
Unallocated corporate expenses
$
(28,249
)
$
(8,438
)
7
$
(19,811
)
1Items include $6,142 for inventory adjustments associated with the exit of certain technology products and the goodMRKT brand, as well as excess mask products and $1,134 for PO cancellation fees
2Items include $5,714 for severance charges; $2,755 for consulting fees associated with cost savings initiatives and CEO search; $768 for the amortization of definite-lived intangible assets; $759 for store impairment charges; and $80 for goodMRKT brand exit costs
3Related to the tax impact of the charges mentioned above, as well as goodwill and intangible asset impairment charges
4Related to $5,097 related to an allocation for certain inventory adjustments and PO cancellation fees; $759 for store impairment charges; $302 for goodMRKT brand exit costs; and $15 for severance charges
5Related to an allocation for certain inventory adjustments and PO cancellation fees
6Related to $29,338 of goodwill and intangible asset impairment charges; $963 for inventory adjustments associated with mask products; $768 for the amortization of definite-lived intangible assets; and $16 for severance charges
7Related to $5,683 for severance charges and $2,755 for consulting fees associated with cost savings initiatives and CEO search
Vera Bradley, Inc.
GAAP to Non-GAAP Reconciliation Twenty-Six Weeks Ended July 29, 2023
(in thousands, except per share amounts)
(unaudited)
Twenty-Six Weeks Ended
As Reported
Other Items
Non-GAAP (Excluding Items)
Gross profit
$
123,765
$
–
$
123,765
Selling, general, and administrative expenses
117,911
4,001
1
113,910
Operating income (loss)
6,485
(4,001
)
10,486
Income (loss) before income taxes
6,441
(4,001
)
10,442
Income tax expense (benefit)
1,866
(1,013
)
2
2,879
Net income (loss)
4,575
(2,988
)
7,563
Less: Net loss attributable to redeemable noncontrolling interest
–
–
–
Net income (loss) attributable to Vera Bradley, Inc.
4,575
(2,988
)
7,563
Diluted net income (loss) per share available to Vera Bradley, Inc. common shareholders
$
0.15
$
(0.10
)
$
0.24
Vera Bradley Direct segment operating income (loss)
$
27,961
$
(342
)
3
$
28,303
Vera Bradley Indirect segment operating income
$
10,910
$
–
$
10,910
Pura Vida segment operating income (loss)
$
5,562
$
(1,537
)
4
$
7,099
Unallocated corporate expenses
$
(37,948
)
$
(2,122
)
5
$
(35,826
)
1Items include $2,068 for severance charges; $1,458 for the amortization of definite-lived intangible assets; and $475 for certain professional fees and consulting fees associated with strategic initiatives
2Related to the tax impact of the items mentioned above
3Related to severance charges
4Related to $1,458 for the amortization of definite-lived intangible assets and $79 for severance charges
5Items include $1,647 for severance charges and $475 associated with certain professional fees and consulting fees for strategic initiatives
Vera Bradley, Inc.
GAAP to Non-GAAP Reconciliation Twenty-Six Weeks Ended July 30, 2022
(in thousands, except per share amounts)
(unaudited)
Twenty-Six Weeks Ended
As Reported
Other Items
Non-GAAP (Excluding Items)
Gross profit (loss)
$
113,031
$
(7,276
)
1
$
120,307
Selling, general, and administrative expenses
134,956
11,587
2
123,369
Impairment of goodwill and intangible assets
29,338
29,338
–
Operating loss
(51,054
)
(48,201
)
(2,853
)
Loss before income taxes
(51,130
)
(48,201
)
(2,929
)
Income tax benefit
(7,519
)
(7,135
)
3
(384
)
Net loss
(43,611
)
(41,066
)
(2,545
)
Less: Net (loss) income attributable to redeemable noncontrolling interest
(6,870
)
(7,963
)
1,093
Net loss attributable to Vera Bradley, Inc.
(36,741
)
(33,103
)
(3,638
)
Diluted net loss per share available to Vera Bradley, Inc. common shareholders
$
(1.15
)
$
(1.03
)
$
(0.11
)
Vera Bradley Direct segment operating income (loss)
$
15,547
$
(6,173
)
4
$
21,720
Vera Bradley Indirect segment operating income (loss)
$
9,397
$
(994
)
5
$
10,391
Pura Vida segment operating (loss) income
$
(27,478
)
$
(31,854
)
6
$
4,376
Unallocated corporate expenses
$
(48,520
)
$
(9,180
)
7
$
(39,340
)
1Items include $6,142 for inventory adjustments associated with the exit of certain technology products and the goodMRKT brand, as well as excess mask products and $1,134 for PO cancellation fees
2Items include $5,714 for severance charges; $2,905 for consulting fees associated with cost savings initiatives and CEO search; $1,537 for the amortization of definite-lived intangible assets; $1,351 for store and right-of-use asset impairment charges; and $80 for goodMRKT brand exit costs
3Related to the tax impact of the charges mentioned above, as well as goodwill and intangible asset impairment charges
4Related to $5,097 related to an allocation for certain inventory adjustments and PO cancellation fees; $759 for store impairment charges; $302 for goodMRKT brand exit costs; and $15 for severance charges
5Related to an allocation for certain inventory adjustments and PO cancellation fees
6Related to $29,338 of goodwill and intangible asset impairment charges; $963 for inventory adjustments associated with mask products; $1,537 for the amortization of definite-lived intangible assets; and $16 for severance charges
7Related to $5,683 for severance charges; $2,905 for consulting fees associated with cost savings initiatives and CEO search; and $592 for a right-of-use asset impairment charge
Original CookieCakeFranchiseExpands Florida Footprint
LOS ANGELES, Aug. 29, 2023 (GLOBE NEWSWIRE) — Great American Cookies, the Original Cookie Cake franchise, announces its return to the Orlando market with a new location. Situated in the Orlando International Premium Outlets, the latest store marks another successful Nestlé® Toll House® Café by Chip® conversion by FAT Brands, the parent company of Great American Cookies. The cookie chain has plans to continue its growth in Orlando with new locations set to open later this year.
“We are beyond excited for Great American Cookies to re-enter the Orlando market and offer our signature Cookie Cakes and Cookies to the community once again,” said Allison Lauenstein, President of the QSR Division at FAT Brands Inc. “Our brand has a rich history of creating memorable moments with our freshly baked CookieCakes, and we can’t wait to continue that tradition in Orlando.”
Since 1977, Great American Cookies has baked up a reputation for not only being the creator of the Original Cookie Cake, but also for its famous chocolate chip cookie recipe. Other craveable menu items include Brownies and Double Doozies™, delectable icing sandwiched between two cookies.
The new Great American Cookies Orlando store is located at 4955 International Dr., Unit 1C 02, Orlando, FL. 32819, and is open Monday through Sunday, 11 a.m. to 8 p.m.
About FAT (Fresh. Authentic. Tasty.) Brands FAT Brands (NASDAQ: FAT) is a leading global franchising company that strategically acquires, markets, and develops fast casual, quick-service, casual dining, and polished casual dining concepts around the world. The Company currently owns 17 restaurant brands: Round Table Pizza, Fatburger, Marble Slab Creamery, Johnny Rockets, Fazoli’s, Twin Peaks, Great American Cookies, Hot Dog on a Stick, Buffalo’s Cafe & Express, Hurricane Grill & Wings, Pretzelmaker, Elevation Burger, Native Grill & Wings, Yalla Mediterranean and Ponderosa and Bonanza Steakhouses, and franchises and owns over 2,300 units worldwide. For more information on FAT Brands, please visit www.fatbrands.com.
About Great American Cookies Founded on a family chocolate chip cookie recipe in 1977, Great American Cookies believes that pure, simple delight is part of living a full life. Serving the Original Cookie Cake, fresh baked cookies in a variety of flavors, brownies, and Double Doozies™, we promise to treat you to bites of bliss that prove how sweet life can be. With 400 bakeries across the country and internationally in Bahrain, Guam, Saudi Arabia, and treats available to ship right to your door, the sweet spot is always close to home. For more information, visit www.greatamericancookies.com.