What Investors Learned in July That They Can Use in August

Looking Back at the Markets in July and Forward to August

Enthusiasm for the overall stock market remained strong in July. The major indices were all up, and every S&P sector closed in positive territory. Despite the Federal Reserve which continued its monetary policy tightening, and suggestion that it is not finished, markets looked at waning inflation and still strong employment and began to believe a soft landing is now more likely. During the month Nasdaq decided to rebalance the Nasdaq 100, this was completed as of the market open on July 31. The purpose was to allow the index to better reflect price movements in the top 100 Nasdaq stocks. As with the S&P 500, the weighting of the five largest companies represented in the index, has been a concern for many investors that don’t believe the index represents the overall market moves well. On the other side of the scale, for the second month in a row, the small cap Russell 2000 index led the other popular market indexes by a wide margin.

Earnings season or second quarter reporting, which kicked off mid-July, has so far exceeded estimates for many highly followed companies; this has also kept the markets rising in July.  Whether the strong market momentum continues through August may depend on if inflation continues to show signs of coming down toward the Fed’s 2% target.
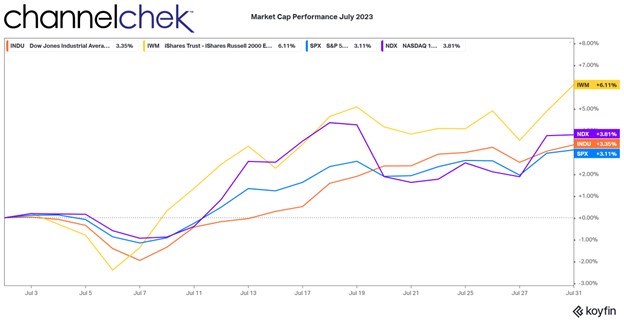
Image Credit: Koyfin

Look Back

Four broad stock market indices were positive in June. In order, the Russell 2000 Small Caps, Nasdaq 100 Large Caps, the Dow Jones Industrials, and S&P 500 Large Caps.

Small cap stocks are the big winner in June as investors went looking for value. The Russell 2000 rose 6.11%, which follows a large 8.07% gain the previous month. The smaller stocks may now have more positive impetus that could carry over into August. Just prior to the beginning of July, Goldman Sachs had estimated that based on their models, small cap stocks could rise 14% over the next 12 months.  This helped small cap stocks continue their outperformance as more investors begin to exercise caution toward the high P/E ratios in larger companies and recognize the historical value still represented in small cap company valuations.

The Nasdaq maintained its growth as big tech retained its appeal despite individual company market caps that have exceeded those of developed countries. The Nasdaq 100 was up 3.81%, following 6.49% in June. The Dow 30 Industrials made headlines for a week as it had a 13 day winning streak. It returned 3.35% during July after a 4.56% increase in June. The S&P 500 was the worst performing index at 3.11% after rising 6.47% the previous month.  All major indices are off their all time highs that were reached in Winter 2021.
Source: Koyfin

Market Sector Lookback

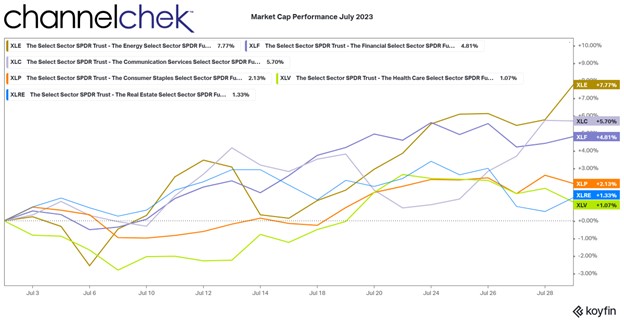
Of the 11 S&P market sectors (SPDRs), even the lowest performer had an above-average one-month return. The chart above reflects the three best-performing sectors and the three worst. The top performer demonstrated the strength of energy during the month as oil and natural gas prices rose.  

The energy sector had the best return at 7.77% during July.  Continued disruption as countries work toward renewables, the war in Ukraine, and even a coup in Niger all helped the sector attract investors.

Communications was second with a 5.70% return. On June 26, the White House announced internet infrastructure spending plans that helped support and should continue to help many companies in this sector.

Investors began returning to companies in the financial sector as a rebound from March and April when investors became leary after a few bank failures. Bank earnings in July showed better-than-expected performance on many of the large banks. This helped the move back into financials. The sector returned 4.81% in July.

The three worst-performing sectors also indicate the month was very positive. Consumer Staples which was third from the bottom returned a respectable 2.13%. Investors view this sector as a defensive play in times of economic uncertainty. Its move shows less interest as investors become more positive on the economic outlook.

The second to weakest performer is Real Estate. The sector has held up fairly well considering how closely its performance can be tied to interest rates. The 1.33% return in June is indicative of the entire market’s resilience yet lower probability of the sector in light of a still hawkish Fed.

Health Care is still out of favor. Investors had a lower level of interest in healthcare stocks, which are also considered defensive. Lower market volatility and a brighter economic outlook have investors less interested in defensive stocks. Also, interest rates could be affecting big pharma as dividends on the stocks become less appealing as bond yields rise.

Looking Forward

The job market is strong, inflation is tapering,  and consumers are more confident. Analysts are now expecting that companies that have been waiting for a more friendly market to go public are considering now as a good time for their IPO.

Bitcoin and other cryptocurrencies, along with stocks of crypto exchanges, are still faced with uncertain legal outcomes and regulatory positioning. Artificial intelligence as a growing component of many industries, is driving interest as investors look to uncover those companies that will benefit the most both directly (ie: selling chips) or indirectly (ie: gain efficiency).

The rotation to small caps and sectors that perform better when the economy improves has a lot of momentum heading into August. This sector has a long way to run before it catches up with the large cap sectors that it historically surpasses over time.

Take-Away

The market showed more signs of relief in July as the conversation changed from an upcoming recession to a likely soft landing. With five more months in 2023, the markets have rallied and are not showing signs of retrenching. This is especially true of small cap stocks that for the second month have handily outperformed large caps.

Paul Hoffman

Managing Editor, Channelchek

Sources
https://www.barrons.com/livecoverage/stock-market-today-072723/card/dow-ends-13-day-winning-streak-as-markets-slide-E6vt9Ow8tIPvRB87SWNQ

https://www.whitehouse.gov/briefing-room/statements-releases/2023/06/26/fact-sheet-biden-harris-administration-announces-over-40-billion-to-connect-everyone-in-america-to-affordable-reliable-high-speed-internet/

What Investors Learned in June That They Can Use in July

Looking Back at the Markets in June and Forward to July

Enthusiasm in the overall stock market was strong in June, the major indices were all up, and every S&P sector closed in positive territory. In fact, there was spectacular performance across market caps as Apple (AAPL) became the first company to reach a $3 trillion market cap, and noteworthy among small caps, Bitcoin mining company Bit Digital (BTBT) was up another 20% and a staggering 685% on the year during the last week in June. The across-the-board positive sentiment came during a month when the market was disappointed by the Federal Reserve’s continued hawkish bias.

Two dark clouds that the markets had hanging over them as they entered June were a possible U.S. default on debt and talk of a recession later this year. A higher debt ceiling law was signed on June 5, and a strong jobs report and higher-than-expected first-quarter GDP have for most, pushed most recession forecasts into 2024 or later. June’s performance may reflect a celebration and feelings of relief from both concerns.

Consumer confidence improved in June to its highest level since January 2022, reflecting a big jump in outlook and expectations. This surprise positive mood is reflected in stock market rotations experienced during June in both market-cap and market sectors.

Image Credit: Koyfin

Look Back

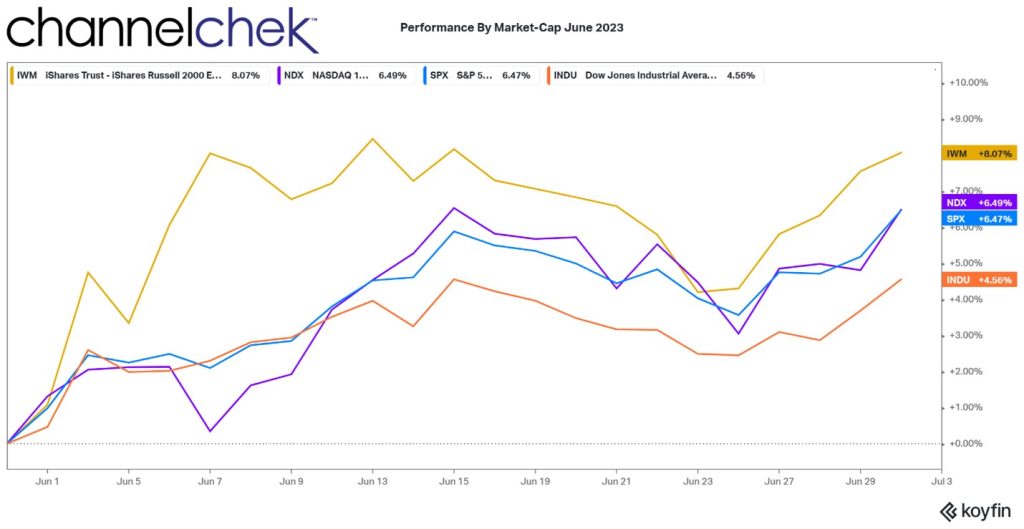
Four broad stock market indices were positive in June. In order, the Russell 2000 Small Caps, Nasdaq 100 Large Caps, the S&P 500 Large Caps, and the Dow Jones Industrials. Small cap stocks are the big winner in June as investors went looking for value. The Russell 2000 rose 8.07%. The smaller stocks may now have more positive impetus that could carry over into July as a report released last week by Goldman Sachs estimates that based on their models, small cap stocks could rise 14% over the next 12 months.  

While small cap stocks had their stars, the Nasdaq maintained a startling pace as big tech retained its appeal despite individual company market caps that have exceeded those of developed countries. The Nasdaq 100 was up 6.49% in June. The S&P 500 nearly matched Nasdaq with a 6.47% return. The Dow 30 Industrials, which have had a difficult few months, returned 4.56% to investors.

Source: Koyfin

Market Sector Lookback

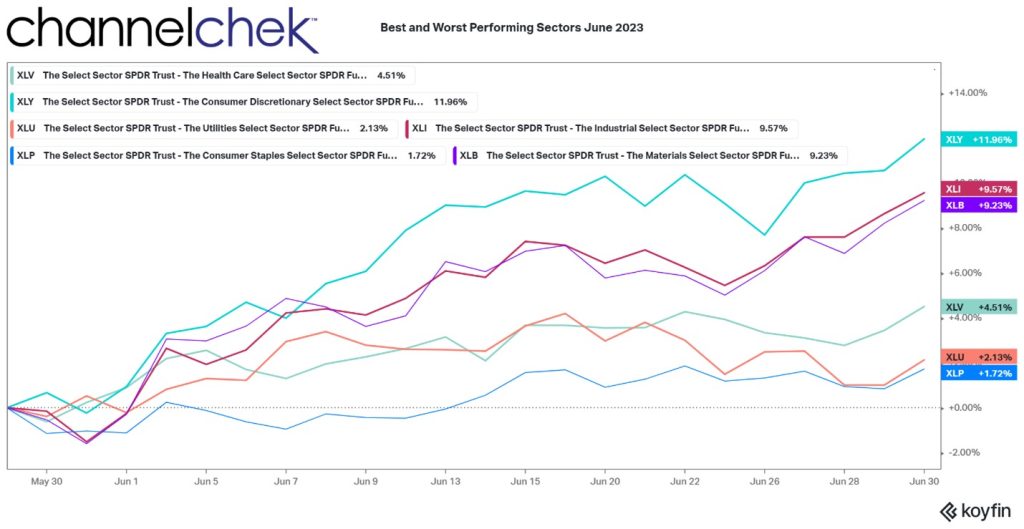
Of the 11 S&P market sectors (SPDRs), even the lowest performer had an impressive one-month return. The chart above reflects the three best-performing sectors and the three worst. The performance indicates that there was a sector rotation away from defensive stocks during June.

Consumer Discretionary had the best return at 11.96%. By definition, these are companies selling products that consumers can cut back on or more easily avoid. The top ten holdings include Starbucks (SBUX), Bookings Holdings (BKNG), and Tesla (TSLA).

What S&P calls the Industrial Select sector finally came to life in June. Its 9.57% return represents almost all of this sector’s performance for the first six months of 2023 (9.73% YTD). Examples of top stocks contained in this index are John Deere (D.E.), General Electric (G.E.), and Union Pacific (UNP).

The third was Materials Select which was negative on the year heading into June. The 9.23% return on the month more than erased the negative 7.67% performance heading into the month.

Each of the top three performers is typically sectors that investors delve into when their economic outlook is more positive.

The three worst-performing sectors also indicate the month was very positive. The Health Care sector was the best of the bottom three at 4.51%. While this did not bring the sector positive on the year, companies like Johnson & Johnson (JNJ), Abbott Labs (ABT), and United Health (UNH), had experienced strong years this decade with growth drivers that have since weakened some.

The second to weakest performer is Utilities Select. Utilities are still negative on the year despite a 2.13% increase in June. Companies like American Electric Power (AEP), Dominion Energy (D), and Consolidated Edison (E.D.) are surrounded by a lot of uncertainty as their costs are driven more than other industries by fuel prices. Additionally, investors in utilities tend to be dividend stock investors. Dividend stocks tend to underperform in a rising interest rate environment as they compete less favorably with bonds.

The worst-performing sector provides further evidence of a rotation during June. Consumer Staples was the second-worst-performing sector at the close of May. While it returned 1.72% in June, the sector, which includes Colgate Palmolive (CL), Walmart (WMT), and Philip Morris (PM), usually gains in popularity when consumer confidence is low, it loses popularity as consumer confidence is high, that’s when, as we saw in June, consumer discretionary stocks get attention.

Looking Forward

The job market is strong, inflation is tapering,  and consumers are more confident. There are even signs that companies that have been waiting for an improved market to go public are considering now a good time for an IPO.

Bitcoin mining stocks and artificial intelligence are still be on fire. The crypto-mining stocks interest is tied to the price of Bitcoin – many of the stocks have actually outperformed the cryptocurrency. Artificial intelligence, as its potential becomes better understood, has inspired many to place bets that this will grow into a technology that is indispensable to many industries. Is the next Apple in this tech segment?

The rotation to small caps and sectors that perform better when the economy improves has a lot of momentum heading into July.

The next FOMC meeting is July 25-26; while market participants already expect further tightening, it has not deterred their positive view on the “risk-on” trade.

Take-Away

The market was jubilant in June. The signing into law of an increased debt ceiling helped kick off a change from the uncertain mood in May.  It unleashed buyers that continued even after it was clear the Federal Reserve was not finished hiking interest rates.

The year 2023 now sits at the halfway point. And within a few months, we will be in a presidential election year. Stocks tend to do well in election years. While the Russia/Ukraine situation is still uncertain, especially in the energy sector, the markets seem to have already priced in negative scenarios and are marching upward confidently.

Paul Hoffman

Managing Editor, Channelchek

What Investors Learned in May That They Can Use in June

Looking Back at the Markets in May and Forward to June

Conviction in the overall stock market was weak in May, while enthusiasm for specific sectors was strong. June investors may regain some clarity as markets may be relieved from the debt ceiling dark cloud that kept investors overly cautious. But a renewed fear that the Fed is losing ground to inflation may become the focal point until the coming FOMC meeting. In the meantime, any increase in the debt limit signed into law kicks the can down the road, ongoing increases in borrowing and spending may not haunt the overall market in June, but the path of escalating debt is unsustainable for a healthy U.S. economy.

The next scheduled FOMC meeting is June 13-14. We will have another look at consumer inflation numbers before the June 14 Fed monetary policy decision date CPI (June 13).

While the Fed is wrestling with stubborn inflation, it is keeping an eye on the strong labor markets, which provides leeway and perhaps even a strong reason fo it to continue riding the economic break pedal by being increasingly less accommodative. Although low unemployment is desirable, tight labor markets are helping to drive prices up. The Fed aims to find a better balance.

Image Credit: Koyfin

Look Back

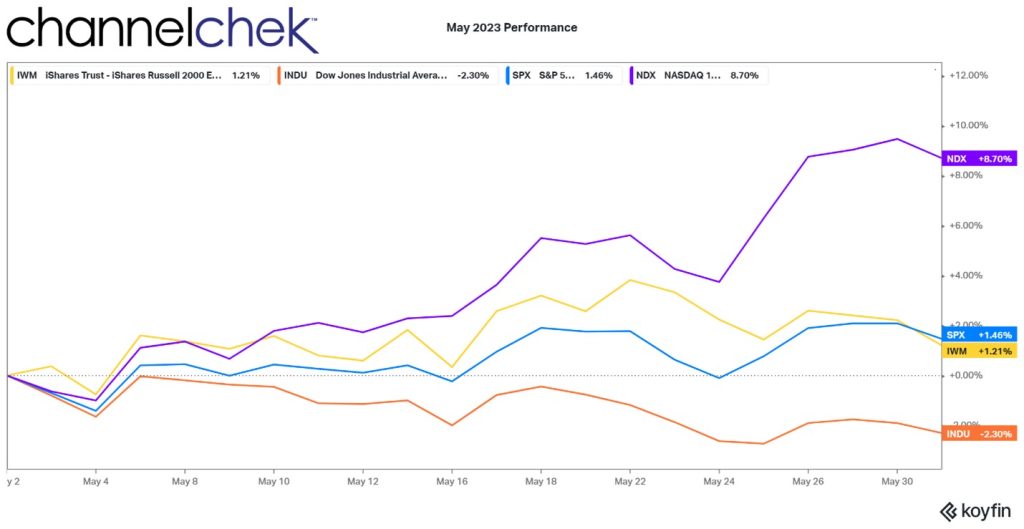
Three broad stock market indices (S&P 500, Nasdaq 100, and Russell 2000) are positive on the month of May. The Dow Industrials spent the entire month in negative territory. The Nasdaq 100 was the big winner (+8.7%) on the back of tech stocks as many have been inspired by the earnings performance and stock price performance of Nvidia (NVDA). The S&P 500 (+1.46%) and Russell 2000 (+1.21%) had a good showing putting the Russell 2000 back in positive territory for 2023. The Dow Industrials is negative (-2.30%), leaving this NYSE index down (-.72%) on the year.

During June, inflation showed signs that it was not decelerating but instead could be building strength. While the Fed raised rates by .25% and continued on pace with quantitative tightening, the impact has been seen as a sharp decrease in money supply (M2), but the central banks’ intended effect has not been realized.

Monetary policy is seen as having a lagging effect; that is to say, when the Fed pushes rates up today, it may take a year to work its way into the system to cause slowing and less demand to reduce price increases. Whether the Fed has done enough can only be seen in the rearview mirror months from now.

Source: Koyfin

Market Sector Lookback

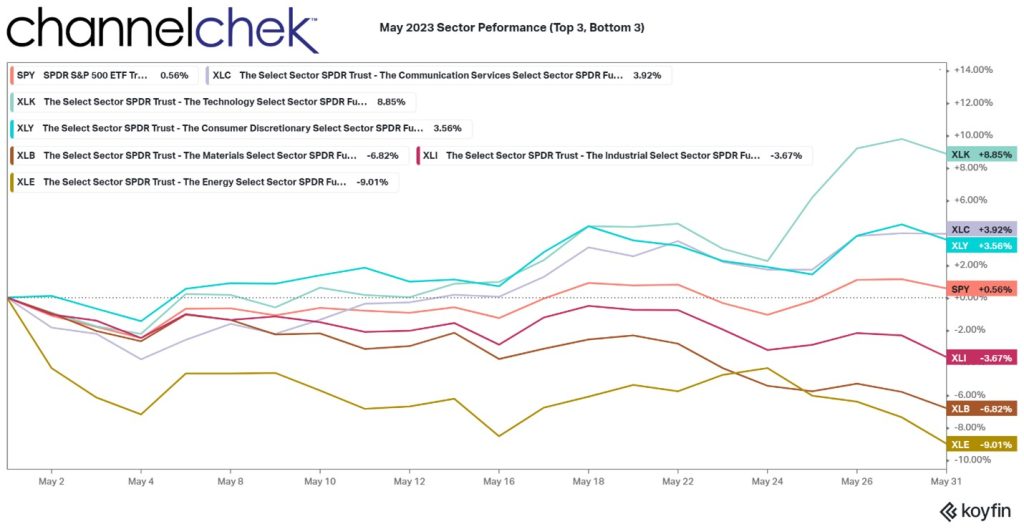
Of the 11 S&P market sectors (SPDRs), three were in positive territory as May came to a close. Technology, ticker XLK (+8.85%), was the only sector that showed an increase the previous month as well (.08%). That is followed by Communications Services, ticker XLC (3.92%), and Consumer Discretionary, ticker XLY, (+3.56%).

The S&P 500, which is comprised of the 11 market sectors, was barely positive during the month of May (+56%). 

Of the three worst performers are Industrials, ticker XLI (-3.67%), it faired the best as the industrial sector has been relatively flat on the year. The Materials, ticker XLB, (-6.87%) took a larger hit as commodities prices dropped during the month; this sector was positive on the year going into May. Energy, ticker XLE, (-11.73%) has been volatile during 2023. It is just off its low (-12%) that it reached in mid-March.

Looking Forward

The job market is strong, and inflation, at best, isn’t declining; this makes it more comfortable for the Fed to raise rates. Another way to look at it is it creates a need for them to continue to hammer away to reverse the inflationary trend – and the economic latitude in which to do it.

While the energy sector was the worst performer among S&P 500 sectors, there are factors suggesting the trend could hold until OPEC and Russia begin to work in synch again. Oil prices are near their lowest levels all year, reflecting a drop in global demand, on the output side, since October, OPEC+ was supposed to be reducing production by 3.5 million barrels a day. There are signs that a key country in the alliance isn’t adhering to the announced production cuts. Whether this causes additional “cheating”, or causes the cartel to force members to fall in line remains to be seen.

Technology stocks, particularly those that could possibly benefit from the artificial intelligence revolution, are likely to be among the focus for a while. The sudden broad awareness of what the technology can do has sent investors scrambling for exposure. Whether the potential (AI) is unleashed quickly or the promise of AI now takes a slower road remains to be seen.

The Russell Reconstitution will be complete as of the first Monday in June. The index will have its new components and the portfolio managers of indexed funds ought to own the stocks that were added to the indexes in their funds and sell out of those that are no longer in the funds index. This creates a lot of activity around June 24. When the market opens on June 27, the index with its new makeup will be set.

Take-Away

The market was full of uncertainty in May. Yet three of the four major market indexes were higher. The signing into law of an increased debt ceiling will make one of the most worrisome objections to being involved disappear. This may unleash buyers that were sidelined.

Technology, caused by high expectations of AI was the focus during May; often, hype causes investors to shoot first and aim later. There will be winners and losers in this technology segment, as with any investment; remove yourself from the hype, carefully evaluate the opportunity, and read the professional research, positive and negative, of those you trust.  

By the end of the month we will have two quarters of 2023 behind us, and there are no signs of a recession and little on the horizon to cause U.S. growth to falter quickly enough for there to be a recession this year. It is unlikely the Fed will ease in 2023. It is, however, likely a pause will eventually happen. There are reasons to believe that the pause won’t happen in June.

The axiom, sell in May and walk away is in question. Three of the four major indexes were up in May, so the jury is still out as to whether selling made sense for 2023.

Paul Hoffman

Managing Editor, Channelchek

Sources
https://www.clevelandfed.org/indicators-and-data/inflation-nowcasting

Koyfin | Advanced graphing and analytical tools for investors

What Investors Learned in February That They Can Use in March

Image Credit: Bradley Higginson (Flickr)

Stock Market Performance – Looking Back at February, Forward to March

The months seem to go by quickly. And as satisfying as January was for most stock market investors, February left people with 2022 flashbacks. High inflation, or what more inflation could mean for monetary policy, again was the culprit weighing on investors’ minds and account values. One consideration is that investors are now entering March and are faced with very negative sentiment. This could actually be bullish and may lead the major indexes on a wave upward.

The next scheduled FOMC meeting is March 21-22. By then, we will have seen another round of inflation numbers as CPI (March 14) and the PCE index (March 15) are both released during the same week, otherwise known as the ides of March. While the Fed is wrestling with stubborn inflation, it is keeping an eye on the strong labor markets. Although low unemployment is desirable, tight labor markets are helping to drive prices up. The Fed is looking to find a better balance.

Image Credit: Koyfin

Look Back

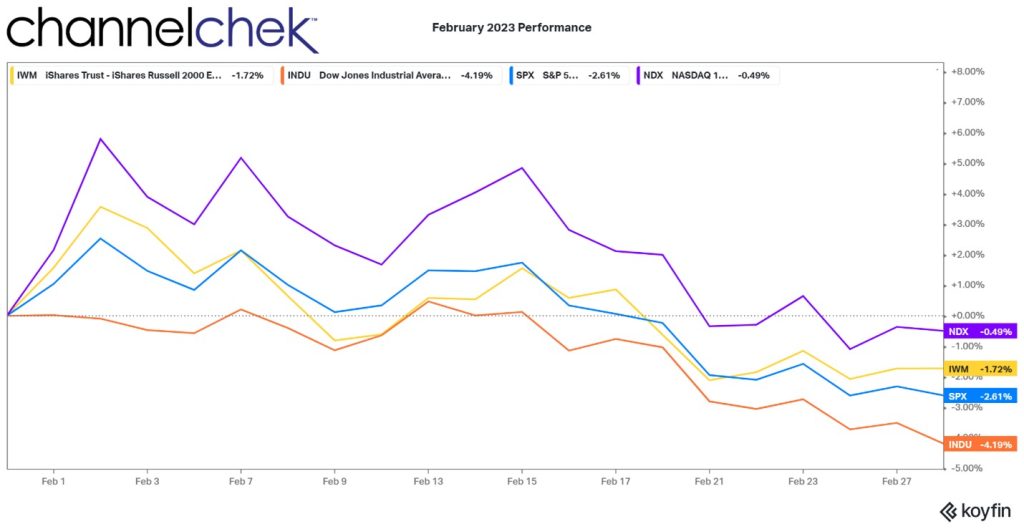
The three broad stock market indices (S&P 500, Nasdaq 100, and Russell 2000) are positive on the year, the Dow went negative on the 21st of February. The Nasdaq 100 and Russell 2000 have gained 9.70% and 8.22% respectively year-to-date, while the S&P is a positive 3.21% and the Dow Industrials is a negative 1.45%.

Each of the four closely watched indexes shown above began falling off as soon as January ended. It has only totalled a partial reversal, but the overall negative sentiment rose through February.

 Viewing the indices from a year-to-date perspective, all but the Dow are well above their historical average pace.

Source: Koyfin

Market Sector Lookback

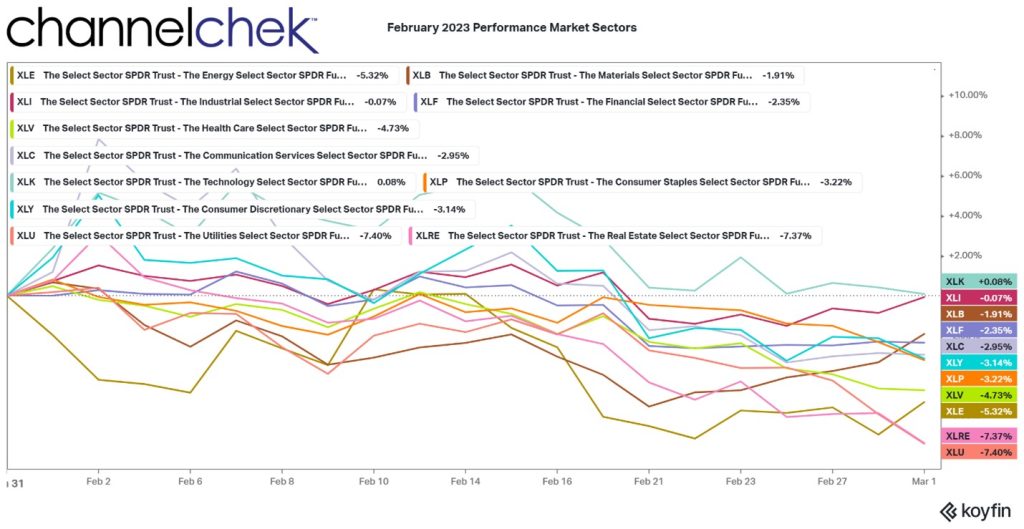
Of the 11 S&P market sectors (SPDRs) only one was in positive territory for the month. This is Technology (XLK) and was barely positive at .08%. That is followed by Industrials (XLI), which fell a mere .07%. This demonstrates the flaw in using the Dow 30 Industrials (declined 4.07%) which is not as broad of an index or a great gauge of stock market direction. The third top performer was Financials (XLF) which returned a negative 2.26%. Financial firms tend to benefit from higher yields, especially if the yield curev steepens, the curve currently has negative spreads out longer.

Of the worst performers are Utilities (XLU), down 7.45%. Many investors in utilities these stocks for dividend yield; as US government bonds pay more interest, they make utility stocks less attractive. Real Estate is also affected by higher rates as underlying assets (properties) decline and the attractiveness of its dividends diminish with high rates available elsewhere. The Energy sector (XLE) was the third worst. Energy is taking its lead from what is happening between Russia and the rest of Europe.

Looking Forward

Income and consumer spending have held strong in early 2023. This would seem to put off any chance of a recession beginning this quarter or next. Earnings reported for the fourth quarter have been mixed. Public companies are dealing with their own increased costs of doing business.

The Fed raising rates one, two, or three more times in 2023 is fully expected. What became less certain is whether they will continue to rely on 25bp increments or if another 50bp is on tap in March or beyond. The Fed began raising rates last March, a large impact has yet to be felt, and it is not expected to take a wait-and-see approach soon.  

February’s small decline after a large January run-up is not unusual activity. In fact the short month has typically been one of the worst of the year for the U.S. stock market. Historically, the S&P 500 has performed better in March and April. How much better? Since 1928, the S&P 500 has averaged a 0.5% gain in March and a 1.4% gain in April.

Take-Away

The market was given a lot to think about in February. Inflation stopped trending down, earnings were not exciting, and participants had amassed better gains than they had in previous months. It was time for some to take some chips off the table and look for an opportunity to get back in.

March, which historically has been positive, will allow investors to see if the tick-up in inflation is a trend or an aberration and whether negative sentiment, with money on the sidelines, makes the current market more of a buy than a sell.

Paul Hoffman

Managing Editor, Channelchek

Will February Follow Through On January’s Gains

Image Credit: Ben Welsh (Flickr)

January’s Stock Market Performance Bodes Well for the Rest of 2023

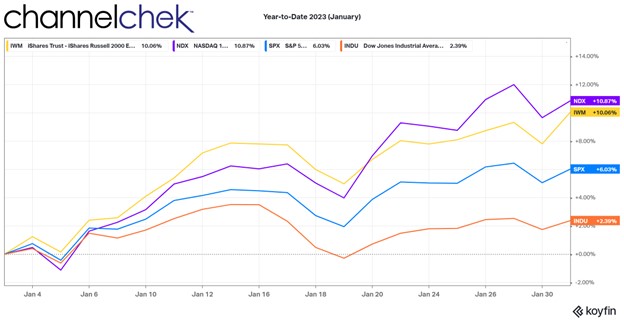
The stock market has put in a solid January in terms of overall performance. Following month after negative month last year, this is a welcome relief for those with money in the market which is beginning to look welcoming to those that have been on the sidelines. While the Fed is still looming with perhaps another 50-75 basis points in rate hikes left to implement over the coming months, the market has been resilient and has already made up for some of last year’s lost ground.

Source: Koyfin

For the month (with an hour left before market close on January 31), the Nasdaq 100 is up over 10.8% for the month. Over 10%  would be a good year historically, of course averaging in last year, it is still solidly underperforming market averages. The small-cap Russell 2000 index is also above 10%. Small-caps have underperformed larger cap stocks over several years and are seen to have more attractive valuations now than large caps as well as other fundamental strengths. These include a higher domestic US customer base in the face of a strong dollar, fewer borrowings that would be more costly with the increased rate environment, and an overall expectation that the major indexes will revert to their mean performance spreads which the small-cap indexes have been lagging. The S&P 500, the most quoted stock index is up over 6% in January, and the Dow 30 Industrials are up almost 2.4%.

Rate Increases

The stock and bond markets hope for a solid sign that the FOMCs rate increases will cease. The reduced fear of an ongoing tightening cycle will calm the nervousness that comes from knowing that higher rates hurt the consumer, increases unemployment, reduces spending and therefore hurts earnings which are most closely tied to stock valuations.

January Historically

January rallies, on their own, statistically have been a good omen for the 11 months ahead.  When the S&P 500 posts a gain for the first month of the year, it goes on to rise another 8.6%, on average for the rest of the year according to statistics dating back to 1929.  In more than 75% of these January rally years, the markets further gained during the year.

Other statistics indicate a bright year to come for the market as well. Using the S&P 500, it rallied for the final five trading days of last year and the first two of 2023, it gained for first five trading days of the new year, and rallied through January. When all three of these have occurred in the past, after a bear market (20%+ decline), the index’s average gain for the rest of the year is 13.9%. In fact it posted positive returns in almost all of the 17 post-bear market years that were ushered in with similar gains.

Follow Through

Beyond history, there is a reason for the follow-through years. January rallies are signs of confidence, they indicate that self-directed investors and professional money managers are buying stocks at the lower prices. It suggests they have a strong enough belief that conditions that caused the bear market have or will soon reverse.  

And this is quite possibly where the markets are at today. The lower valuations seem attractive, this is especially true of the overly beaten down Nasdaq 100 stocks and the small-caps that had been trailing in returns since before the pandemic.

Federal Reserve Chair Powell is looking to make money more expensive in order to slow an economy that is still exhibiting inflationary pressures. He is not, however, looking to crush the stock market. Fed governors seem to be concerned that the bond market prices haven’t declined to match their tightening efforts, but a healthy stock market helps the Fed by giving it latitude to act. Powell will take the podium post FOMC meetings eight times this year.

Each time his intention will be to usher in a long term healthy economy, with reasonable growth, low inflation, and jobs levels that are in line with consumer confidence.

Paul Hoffman

Managing Editor, Channelchek

Sources

https://www.ndr.com/news

https://tdameritradenetwork.com/video/how-to-read-the-technicals-before-the-market-changes

https://www.marketwatch.com/story/last-years-stock-market-volatility-has-carried-over-into-january

https://www.barrons.com/articles/stocks-january-gains-what-it-means-51675185839?mod=hp_LATEST