Current Technology May Be Leading the Next Shift in Stock Market Investing
Investor exposure to the stock market has grown and evolved through different iterations over the years. There is no reason to believe that it isn’t evolving still. The main drivers of change have been the cost of ownership, technology, and convenience, which are related to the other two drivers. There seems to be a new transformation that has been happening over the past few years. And with each change, there will be those that benefit and those that fall short. So it’s important for an investor to be aware of changes that may be taking place around them.
Recent History
Your grandfather probably didn’t own stocks. If he did, he bought shares in companies his broker researched, and he then speculated they would out-earn alternative uses of his capital – this was expensive. Mutual funds later grew in popularity as computer power expanded, and an increased number of investors flocked to these managed funds – the price of entry was less than buying individual stocks. Charles Schwab and other discount brokers sprang up – they offered lower commissions than traditional brokers. Mutual funds were able to further reduce fees charged by offering easier to manage indexed funds or funds linked to a market index like the Dow 30 or S&P 500. Indexed exchange-traded funds (ETF) took the indexed fund idea one step further – they have a much lower cost of entry than either mutual funds or even discount brokerage accounts. An added benefit to indexed ETFs is they can be traded at intraday prices and provide tax benefits.
Just as Schwab ushered in an era of low-commission trades, Robinhood busted the doors open to no-commission trades, and most large online brokers followed. This change allows for almost imperceptible costs in most stock market transactions. It also changed the concept of a round-lot, or transacting in increments of 100 shares. In fact, the most popular brokers all offer fractional share ownership now.
Are Index ETFs Becoming Dinosaurs?
Funds made sense for those seeking diversification of holdings, it used to take a large sum of money to do that; investors with a $10,000 account or more can easily achieve acceptable diversification with odd-lots and fractional shares ability.
Today investors can create their own index-like “fund,” or as they called it in your grandparent’s day, “portfolio management.”
One big advantage to creating your own portfolio, even if you rely heavily on stocks from a specific index to choose from, is that you can adapt it more toward your sector or company expectations. Indexed funds are stuck with their index holdings, they have no ability to change. One may increase or decrease risk by leaving out stocks or even whole industry groups. Also, it can be managed with greater tax efficiency than an index fund tailored to your situation.
There is also the DIY thrill that one gets from creating anything themselves rather than to just buying one off the shelf. There have been a number of renowned investors like Peter Lynch and Michael Burry warning that indexed funds no longer provide expected diversification and that many of the stocks are valued higher because so many dollars are on “auto-invest” into indexes that the bad has been pushed up with the good.
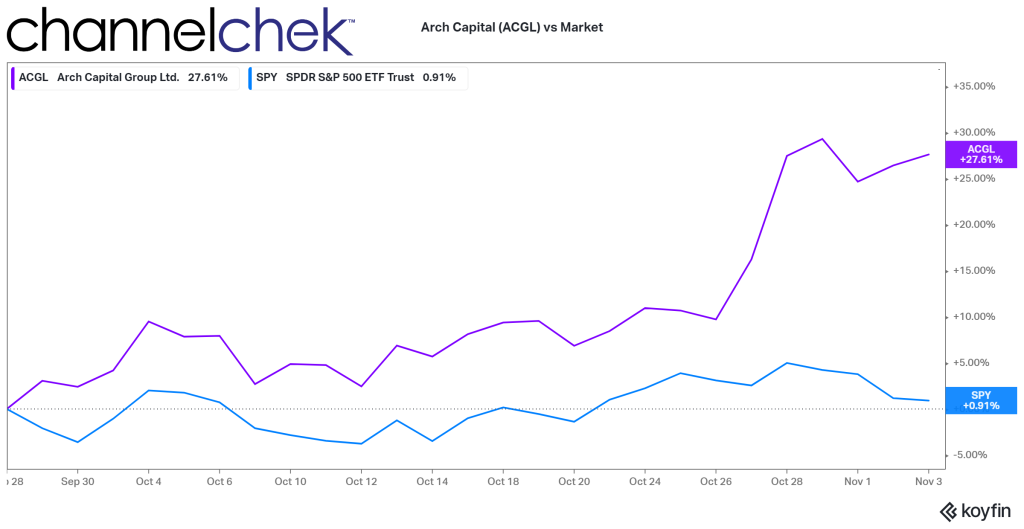
An example of what added demand does to the valuation of a company when being added to an index can be seen over the last month when it became clear that Twitter would be leaving an empty slot that would be filled by Arch Capital (ACGL). The added demand for ACGL pushed up the value by an estimated 25%. Was it undervalued before (when stand-alone), or is it over-valued now? Some stocks that are getting more attention because they are in an index could, as Michael Burry warned, be in bubble territory.
Setting Up a Portfolio
The more you do to ensure your portfolio weightings mimic an index, the closer your performance is likely to be to that index. You may want to limit your holdings to names that are actually in the index and shift the weightings for return enhancement. Another concern often cited with indexes is the way that they weight holdings; you may choose to weight your portfolio using the market capitalization of each company to own the same percentage of the company’s value or use another method like pure cost measures or cost per P/E.
Picking Stocks
While studies suggest that market diversification can be achieved by owning as few as five stocks and doesn’t improve much after 30 holdings, the more you own, providing they aren’t overweighted in a sector, it stands to reason the more diversification protection you can achieve.
As a DIY, self-directed investor, it makes sense not to chase after whatever YouTube influencer, loud-mouthed-TV analyst, or Stocktwit tells you. This is your baby, and the results, good or bad, are yours. Do what you can to make informed decisions, even if some turn out unexpected. The benefit of this is you can lean away from stocks that are still in indexes that don’t have good future prospects and lean into more companies that do.
I’m hearing from more of my self-directed investor friends and investment advisors that more people are looking to own companies that have non-financial objectives they, as an investor, support. And for some of them, there is no standard ESG framework that they support. They have decided, because they do care, to do more portfolio management with individual stocks than before. This is so they can individually look under the hood at employee policies, or environmental stature, etc. While ESG funds exist, the investor or client of the investment advisor would prefer not to own anything they oppose if they can avoid it. What better way than being able to say no to $XYZ company because they do this, this, and this that is against my own fabric?
Channelchek is a great resource for any percentage of your personally managed fund that includes stocks in the small-cap or microcap categories. These stocks could add a bit more potential for return but could also change your risk characteristics. Sign-up to get research from FINRA-licensed analysts.
Take Away
Stock investing has evolved and become more inclusive. But the future may be more like the past, with individuals creating portfolios of stocks for themselves. You don’t have to be rich anymore to buy stocks, and you don’t have to own a fund to get affordable diversification on nearly any size account. There’s a trend toward building one’s own personalized, diversified, low-transaction portfolio. Channelchek is helping investors find possible fits with its free research platform.
Managing Editor, Channelchek