Is the Mismatch in Workers and Open Jobs Proving to Be Transitory?
Inflation has been the most bearish word for the stock and bond markets over the past year or more. Shortly after many of the supply chain issues cleared up, and the cargo ships were no longer stacked up outside of major ports, attracting scarce workers with higher pay became a growing cause of inflationary pressure. At the end of November 2022, Federal Reserve Chair Jerome Powell stated that “job openings exceed available workers by about 4 million.” That number has now grown to 4.7 million after the continued strengthening of the market for qualified labor.
This mismatch, depicted in the Fed Data below, between available positions and workers to fill them, developed a more inflationary trend. The graph depicts the mismatch of labor supply and demand and the extent that it has worsened.
When the civilian labor force is greater than employment plus job openings, the economy has an immediate capacity to fill open positions. Currently, the employment level plus job openings are at 170.5 million, while the total labor force is at 165.8 million. Thus the 4.7 million quoted earlier. There are a whopping 4.7 million more jobs available compared to people available to fill them.
The civilian labor force, the amount of people working or looking for a job, is shown below in red; the current employment level plus the number of job openings is shown in blue.
.

Labor Participation Hesitancy
The pandemic has been emphasized as a cause of this not-very-transitory labor shortage, but the trends in labor demand and labor supply in the graph above indicate that demand was already outpacing supply as the US entered 2018. This was two years before the novel coronavirus hit US shores. Back then the mismatch was about one million workers fewer than jobs available before the economic disruption.
As the US began to move toward business-as-usual, news and market analysts offered many explanations for the labor shortage. These included childcare problems, health concerns, minimum wage pushback, and even a wave of new retirees.
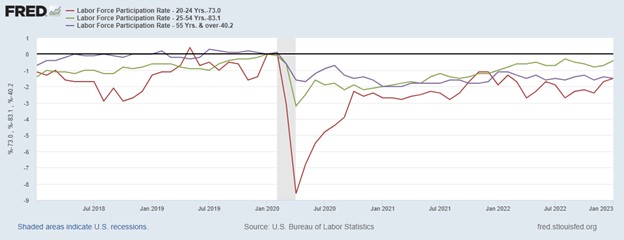
The visual below shows the change experienced in the labor force participation rate (LFPR) for specific age groups: 20 to 24 years old, 25 to 54 years old, and 55+ years old. By subtracting the most recent LFPR from that of January 2020 we get the percentage-point change in labor force participation relative to the month just before the pandemic began impacting businesses.
When the pandemic hit, the sharpest decline in the LFPR was for workers between the ages of 20 and 24. Their LFPR decreased from 73% to 64.4% in 4 months before increasing again. However, at the end of 2022, the LFPR for 20- to 24-year-olds still hadn’t fully recovered and remained 1.7 percentage points below its January 2020 value.
This overall pattern is similar but less extreme for the other age groups. Although no age group fully recovered by the end of 2022, the 25-54 group was closest, at 0.7 percentage points below its January 2002 level. There’s been speculation older workers retired early (and permanently) during the pandemic, and the 55+ group remained 1.4 percentage points below its January 2020 level as of December 2022, with no sign of further recovery.

Take Away
The mechanisms that cause inflation are widely understood. If there is a shortage of goods because of the supply chain, sellers can ask more for the product. If the cost of producing goods or providing services increase, perhaps because of the cost of labor, the seller may try to pass those higher costs along. On the demand-pull side, if there is an abundance of currency, this increases demand for goods and services and is also inflationary.
While the Fed has been waging a fight against rising prices by removing liquidity and ratcheting up the cost of money (interest rates), the number of open jobs compared to the number of workers available to fill them has widened.
Managing Editor, Channelchek
Sources
https://www.federalreserve.gov/newsevents/speech/powell20221130a.htm
https://www.bls.gov/news.release/empsit.nr0.htm
https://fred.stlouisfed.org/searchresults/?st=unemployment%20rate&isTst=1