Will Global Rate Hikes Set Off a Global Debt Bomb?
The higher levels of risky corporate debt issuance over the past few year will need to be refinanced between 2023 and 2025, In numbers terms, there will be over $10 trillion of the riskiest debt at much higher interest rates and with less liquidity. In addition to domestic high yield issuance, the majority of the major European economies have issued negative-yielding debt over the past three years and must now refinance at significantly higher rates. In 2020–21. the annual increase in the US money supply (M2) was 27 percent, more than 2.5 times higher than the quantitative easing peak of 2009 and the highest level since 1960. Negative yielding bonds, an economic anomaly that should have set off alarm bells as an example of a bubble worse than the “subprime” bubble, amounted to over $12 trillion. Even if refinancing occurs smoothly but at higher costs, the impact on new credit and innovation will be enormous, and the crowding out effect of government debt absorbing the majority of liquidity and the zombification of the already indebted will result in weaker growth and decreased productivity in the future.
Raising interest rates is a necessary but insufficient measure to combat inflation. To reduce inflation to 2 percent, central banks must significantly reduce their balance sheets, which has not yet occurred in local currency, and governments must reduce spending, which is highly unlikely.
The most challenging obstacle is also the accumulation of debt.
The so-called expansionary policies have not been an instrument for reducing debt, but rather for increasing it. In the second quarter of 2022, according to the Institute of International Finance (IIF), the global debt-to-GDP ratio will approach 350 percent of GDP. IIF anticipates that the global debt-to-GDP ratio will reach 352 percent by the end of 2022.
Global issuances of high-yield debt have slowed but remain elevated. According to the IMF, the total issuance of European and American high-yield bonds reached a record high of $1,6 trillion in 2021, as businesses and investors capitalized on still low interest rates and high liquidity. According to the IMF, high-yield bond issuances in the United States and Europe will reach $700 billion in 2022, similar to 2008 levels. All of the risky debt accumulated over the past few years will need to be refinanced between 2023 and 2025, requiring the refinancing of over $10 trillion of the riskiest debt at much higher interest rates and with less liquidity.
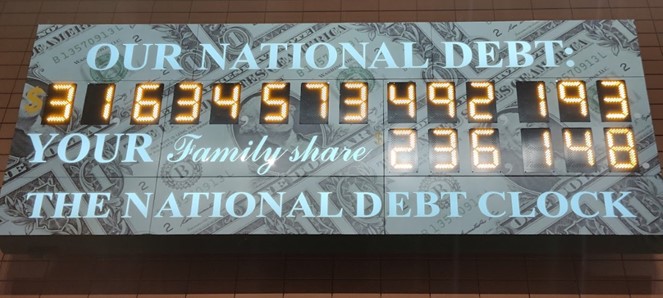
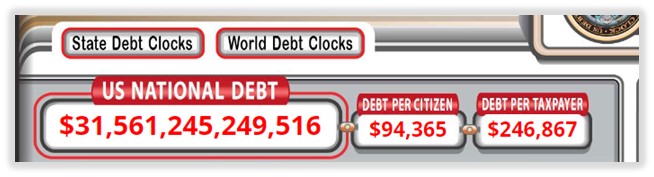
Moody’s estimates that United States corporate debt maturities will total $785 billion in 2023 and $800 billion in 2024. This increases the maturities of the Federal government. The United States has $31 trillion in outstanding debt with a five-year average maturity, resulting in $5 trillion in refinancing needs during fiscal 2023 and a $2 trillion budget deficit. Knowing that the federal debt of the United States will be refinanced increases the risk of crowding out and liquidity stress on the debt market.
According to The Economist, the cumulative interest bill for the United States between 2023 and 2027 should be less than 3 percent of GDP, which appears manageable. However, as a result of the current path of rate hikes, this number has increased, which exacerbates an already unsustainable fiscal problem.
If you think the problem in the United States is significant, the situation in the eurozone is even worse. Governments in the euro area are accustomed to negative nominal and real interest rates. The majority of the major European economies have issued negative-yielding debt over the past three years and must now refinance at significantly higher rates. France and Italy have longer average debt maturities than the United States, but their debt and growing structural deficits are also greater. Morgan Stanley estimates that, over the next two years, the major economies of the eurozone will require a total of $3 trillion in refinancing.
Although at higher rates, governments will refinance their debt. What will become of businesses and families? If quantitative tightening is added to the liquidity gap, a credit crunch is likely to ensue. However, the issue is not rate hikes but excessive debt accumulation complacency.
Explaining to citizens that negative real interest rates are an anomaly that should never have been implemented is challenging. Families may be concerned about the possibility of a higher mortgage payment, but they are oblivious to the fact that house prices have skyrocketed due to risk accumulation caused by excessively low interest rates.
The magnitude of the monetary insanity since 2008 is enormous, but the glut of 2020 was unprecedented. Between 2009 and 2018, we were repeatedly informed that there was no inflation, despite the massive asset inflation and the unjustified rise in financial sector valuations. This is inflation, massive inflation. It was not only an overvaluation of financial assets, but also a price increase for irreplaceable goods and services. The FAO food index reached record highs in 2018, as did the housing, health, education, and insurance indices. Those who argued that printing money without control did not cause inflation, however, continued to believe that nothing was wrong until 2020, when they broke every rule.
In 2020–21, the annual increase in the US money supply (M2) was 27 percent, more than 2.5 times higher than the quantitative easing peak of 2009 and the highest level since 1960. Negative yielding bonds, an economic anomaly that should have set off alarm bells as an example of a bubble worse than the “subprime” bubble, amounted to over $12 trillion. But statism was pleased because government bonds experienced a bubble. Statism always warns of bubbles in everything except that which causes the government’s size to expand.
In the eurozone, the increase in the money supply was the greatest in its history, nearly three times the Draghi-era peak. Today, the annualized rate is greater than 6 percent, remaining above Draghi’s “bazooka.” All of this unprecedented monetary excess during an economic shutdown was used to stimulate public spending, which continued after the economy reopened … And inflation skyrocketed. However, according to Lagarde, inflation appeared “out of nowhere.”
No, inflation is not caused by commodities, war, or “disruptions in the supply chain.” Wars are deflationary if the money supply remains constant. Several times between 2008 and 2018, the value of commodities rose sharply, but they do not cause all prices to rise simultaneously. If the amount of currency issued remains unchanged, supply chain issues do not affect all prices. If the money supply remains the same, core inflation does not rise to levels not seen in thirty years.
All of the excess of unproductive debt issued during a period of complacency will exacerbate the problem in 2023 and 2024. Even if refinancing occurs smoothly but at higher costs, the impact on new credit and innovation will be enormous, and the crowding out effect of government debt absorbing the majority of liquidity and the zombification of the already indebted will result in weaker growth and decreased productivity in the future.
About the Author:
Daniel Lacalle, PhD, economist and fund manager, is the author of the bestselling books Freedom or Equality (2020), Escape from the Central Bank Trap (2017), The Energy World Is Flat (2015), and Life in the Financial Markets (2014).