Joe Gomes, Managing Director – Generalist Analyst, Noble Capital Markets, Inc.
Joshua Zoepfel, Research Associate, Noble Capital Markets, Inc.
Refer to the full report for the price target, fundamental analysis, and rating.
4Q22 Bottom Line Impacted By Special Items. CVG reported GAAP EPS of a loss of $0.98. Adjusting for one-time items, adjusted EPS was $0.04. Further adjusting for special items, high program start-up costs and foreign exchange, special item adjusted EPS was $0.14, or much more in-line with our $0.17 forecast, which did not include any of the above.
A Refined Long-term Roadmap. Management put out a more refined long-term roadmap with a goal of $1.5 billion of revenue and a 9.0% adjusted EBITDA margin for 2027. While the new revenue goal is below the previous $1.9 billion goal, the adjusted EBITDA margin rises from a prior 8.5%. We believe the updated road map reflects management’s goal of focusing on adding only higher margin growth and not just growth for growth’s sake.
Equity Research is available at no cost to Registered users of Channelchek. Not a Member? Click ‘Join’ to join the Channelchek Community. There is no cost to register, and we never collect credit card information.
This Company Sponsored Research is provided by Noble Capital Markets, Inc., a FINRA and S.E.C. registered broker-dealer (B/D).
*Analyst certification and important disclosures included in the full report. NOTE: investment decisions should not be based upon the content of this research summary. Proper due diligence is required before making any investment decision.
FAT Brands (NASDAQ: FAT) is a leading global franchising company that strategically acquires, markets, and develops fast casual, quick-service, casual dining, and polished casual dining concepts around the world. The Company currently owns 17 restaurant brands: Round Table Pizza, Fatburger, Marble Slab Creamery, Johnny Rockets, Fazoli’s, Twin Peaks, Great American Cookies, Hot Dog on a Stick, Buffalo’s Cafe & Express, Hurricane Grill & Wings, Pretzelmaker, Elevation Burger, Native Grill & Wings, Yalla Mediterranean and Ponderosa and Bonanza Steakhouses, and franchises and owns over 2,300 units worldwide. For more information on FAT Brands, please visit www.fatbrands.com.
Joe Gomes, Managing Director – Generalist Analyst, Noble Capital Markets, Inc.
Joshua Zoepfel, Research Associate, Noble Capital Markets, Inc.
Refer to the full report for the price target, fundamental analysis, and rating.
Management Change. Yesterday after the market close, FAT Brands announced that its founder and CEO, Andy Wiederhorn, will transition to a new role as an outside consultant and strategic advisor to the Company effective May 5, 2023. Mr. Wiederhorn will remain a FAT Brands Board member and his family office, Fog Cutter Holdings LLC, will continue as the controlling shareholder of FAT Brands. The appointment of an interim CEO will be announced prior to the transition date, and Mr. Wiederhorn will continue as CEO until then.
Drivers. According to the Company, in transitioning from his role as CEO, Mr. Wiederhorn seeks to eliminate the distraction of the previously announced government investigation tied to him, and allow senior management to focus on continuing to drive shareholder value.
Equity Research is available at no cost to Registered users of Channelchek. Not a Member? Click ‘Join’ to join the Channelchek Community. There is no cost to register, and we never collect credit card information.
This Company Sponsored Research is provided by Noble Capital Markets, Inc., a FINRA and S.E.C. registered broker-dealer (B/D).
*Analyst certification and important disclosures included in the full report. NOTE: investment decisions should not be based upon the content of this research summary. Proper due diligence is required before making any investment decision.
Joe Gomes, Managing Director – Generalist Analyst, Noble Capital Markets, Inc.
Joshua Zoepfel, Research Associate, Noble Capital Markets, Inc.
Refer to the full report for the price target, fundamental analysis, and rating.
4Q22 Top Line. Revenues were $234.9 million compared to $228.9 million in the prior year period, an increase of 2.6%. The increase in revenues is due to increased pricing to offset material cost increases. Foreign currency translation unfavorably impacted fourth quarter 2022 revenues by $6.3 million, or by 2.7%. New business revenue was approximately $20 million in the quarter, offsetting ongoing softness in the Industrial Automation segment. We had forecast revenue of $249 million.
4Q22 Bottom Line. CVGI reported a net loss of $32.0 million, or $0.98 per diluted share for the quarter, caused by non-cash charges related to tax valuation allowance changes, a pension settlement to terminate the Company’s U.S. legacy pension plan, and a $10.4 million non-cash charge in the Industrial Automation segment due to the modest outlook for the business. Adjusted EPS was $0.04, short of our $0.17 projection. Adjusted EBITDA was $13.3 million, up $0.4 million or 3.1%.
Equity Research is available at no cost to Registered users of Channelchek. Not a Member? Click ‘Join’ to join the Channelchek Community. There is no cost to register, and we never collect credit card information.
This Company Sponsored Research is provided by Noble Capital Markets, Inc., a FINRA and S.E.C. registered broker-dealer (B/D).
*Analyst certification and important disclosures included in the full report. NOTE: investment decisions should not be based upon the content of this research summary. Proper due diligence is required before making any investment decision.
Veteran Restaurant Executive Will Assume New Position as Outside Consultant and Strategic Advisor
LOS ANGELES, March 06, 2023 (GLOBE NEWSWIRE) — FAT (Fresh. Authentic. Tasty.) Brands Inc. announces that its founder and CEO, Andy Wiederhorn, will transition to a new role as an outside consultant and strategic advisor to the Company effective May 5, 2023. Mr. Wiederhorn will remain a FAT Brands Board member and his family office, Fog Cutter Holdings LLC, will continue as the controlling shareholder of FAT Brands. The appointment of an interim CEO will be announced prior to the transition date, and Mr. Wiederhorn will continue as CEO until then.
In his strategic advisory role, Mr. Wiederhorn will continue to support the management team and the Company while focusing his time on the Company’s long-term strategy and capital allocation plans. In transitioning from his role as CEO, Mr. Wiederhorn seeks to eliminate the distraction of the previously announced government investigation tied to him, and allow senior management to focus on continuing to drive shareholder value.
“While I will be stepping aside as CEO, I will continue to support the growth and evolution of FAT Brands, including championing our talented executive team, which has over the past five years taken the Company from two brands to 17 iconic restaurant brands with over 2,300 units and systemwide sales of $2.2 billion annually,” said FAT Brands CEO Andy Wiederhorn. “In 2022 we were named Public Company of the Year by the Los Angeles Business Journal, due in large part to the hard work and dedication of our corporate teams and franchise partners.”
About FAT (Fresh. Authentic. Tasty.) Brands FAT Brands (NASDAQ: FAT) is a leading global franchising company that strategically acquires, markets, and develops fast casual, quick-service, casual dining, and polished casual dining concepts around the world. The Company currently owns 17 restaurant brands: Round Table Pizza, Fatburger, Marble Slab Creamery, Johnny Rockets, Fazoli’s, Twin Peaks, Great American Cookies, Hot Dog on a Stick, Buffalo’s Cafe & Express, Hurricane Grill & Wings, Pretzelmaker, Elevation Burger, Native Grill & Wings, Yalla Mediterranean and Ponderosa and Bonanza Steakhouses, and franchises and owns over 2,300 units worldwide. For more information on FAT Brands, please visit www.fatbrands.com.
ACCO Brands Corporation is one of the world’s largest designers, marketers and manufacturers of branded academic, consumer and business products. Our widely recognized brands include AT-A-GLANCE®, Esselte®, Five Star®, GBC®, Kensington®, Leitz®, Mead®, PowerA®, Quartet®, Rapid®, Rexel®, Swingline®, Tilibra®, and many others. Our products are sold in more than 100 countries around the world. More information about ACCO Brands, the Home of Great Brands Built by Great People, can be found at www.accobrands.com.
Joe Gomes, Managing Director – Generalist Analyst, Noble Capital Markets, Inc.
Joshua Zoepfel, Research Associate, Noble Capital Markets, Inc.
Refer to the full report for the price target, fundamental analysis, and rating.
Challenging Current Environment, But Future Remains Bright. In spite of a challenging 2022, ACCO delivered 1% comparable sales growth in 2022 as the Company continued to execute its strategic transformation, including expanding product categories, broadening geographic reach, and bringing innovative new consumer-centric products to market. This enabled ACCO to achieve market share gains with many of its brands.
Taking Action. For 2023, management’s top priority is to restore the margin profile through incremental pricing actions implemented in January of 2023, the restructuring initiatives undertaken during the fourth quarter of 2022, and the additional productivity programs that will be implemented in 2023. We expect these actions will drive margin expansion and profit growth for the full year of 2023.
Equity Research is available at no cost to Registered users of Channelchek. Not a Member? Click ‘Join’ to join the Channelchek Community. There is no cost to register, and we never collect credit card information.
This Company Sponsored Research is provided by Noble Capital Markets, Inc., a FINRA and S.E.C. registered broker-dealer (B/D).
*Analyst certification and important disclosures included in the full report. NOTE: investment decisions should not be based upon the content of this research summary. Proper due diligence is required before making any investment decision.
FAT Brands (NASDAQ: FAT) is a leading global franchising company that strategically acquires, markets, and develops fast casual, quick-service, casual dining, and polished casual dining concepts around the world. The Company currently owns 17 restaurant brands: Round Table Pizza, Fatburger, Marble Slab Creamery, Johnny Rockets, Fazoli’s, Twin Peaks, Great American Cookies, Hot Dog on a Stick, Buffalo’s Cafe & Express, Hurricane Grill & Wings, Pretzelmaker, Elevation Burger, Native Grill & Wings, Yalla Mediterranean and Ponderosa and Bonanza Steakhouses, and franchises and owns over 2,300 units worldwide. For more information on FAT Brands, please visit www.fatbrands.com.
Joe Gomes, Managing Director – Generalist Analyst, Noble Capital Markets, Inc.
Joshua Zoepfel, Research Associate, Noble Capital Markets, Inc.
Refer to the full report for the price target, fundamental analysis, and rating.
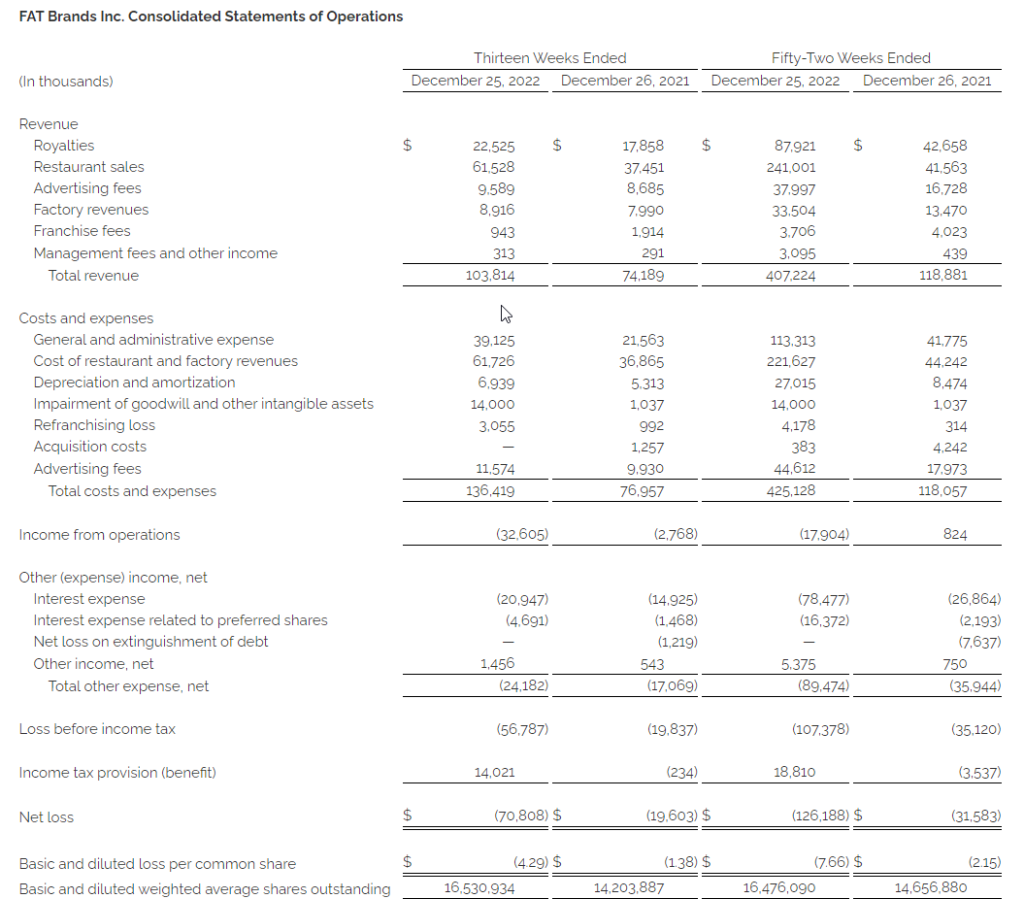
4Q22 Results. FAT Brands reported 4Q22 revenue of $103.8 million, up 39.9% y-o-y from $74.2 million in the year ago quarter. The increased revenue reflects the 2021 acquisitions and ongoing recovery from COVID impacts as SSS was up 2.7%. FAT reported adjusted EBITDA of $19.6 million in the quarter, down from $24.6 million in 3Q22. Net loss for the quarter was $70.8 million, or a loss of $4.29 per share, compared to a net loss of $19.6 million, or a loss of $1.38 per share, last year. We had projected revenue of $104.8 million and a net loss of $16.5 million, or a loss of $0.99 per share.
One-Time Items Impact. The quarter’s results were impacted by a number of one-time non-cash charges, including a $16.1 million non-cash reserve on employee retention credits, a $14 million non-cash trademark impairment charge, and a $20.4 million valuation allowance.
Equity Research is available at no cost to Registered users of Channelchek. Not a Member? Click ‘Join’ to join the Channelchek Community. There is no cost to register, and we never collect credit card information.
This Company Sponsored Research is provided by Noble Capital Markets, Inc., a FINRA and S.E.C. registered broker-dealer (B/D).
*Analyst certification and important disclosures included in the full report. NOTE: investment decisions should not be based upon the content of this research summary. Proper due diligence is required before making any investment decision.
ACCO Brands Corporation is one of the world’s largest designers, marketers and manufacturers of branded academic, consumer and business products. Our widely recognized brands include AT-A-GLANCE®, Esselte®, Five Star®, GBC®, Kensington®, Leitz®, Mead®, PowerA®, Quartet®, Rapid®, Rexel®, Swingline®, Tilibra®, and many others. Our products are sold in more than 100 countries around the world. More information about ACCO Brands, the Home of Great Brands Built by Great People, can be found at www.accobrands.com.
Joe Gomes, Managing Director – Generalist Analyst, Noble Capital Markets, Inc.
Joshua Zoepfel, Research Associate, Noble Capital Markets, Inc.
Refer to the full report for the price target, fundamental analysis, and rating.
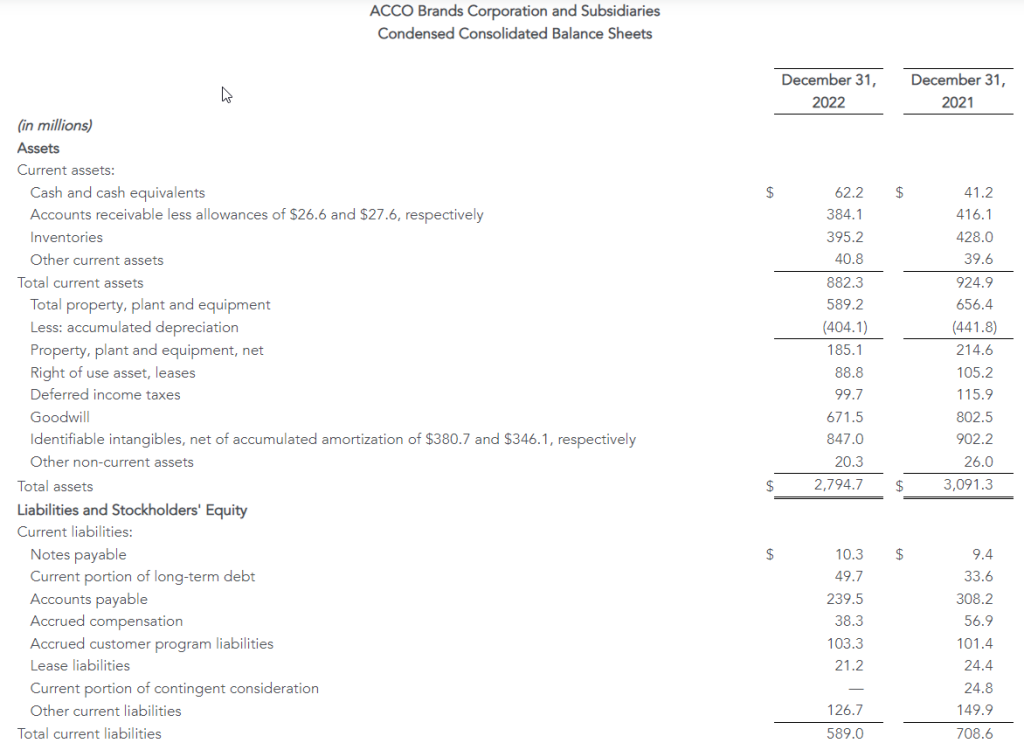
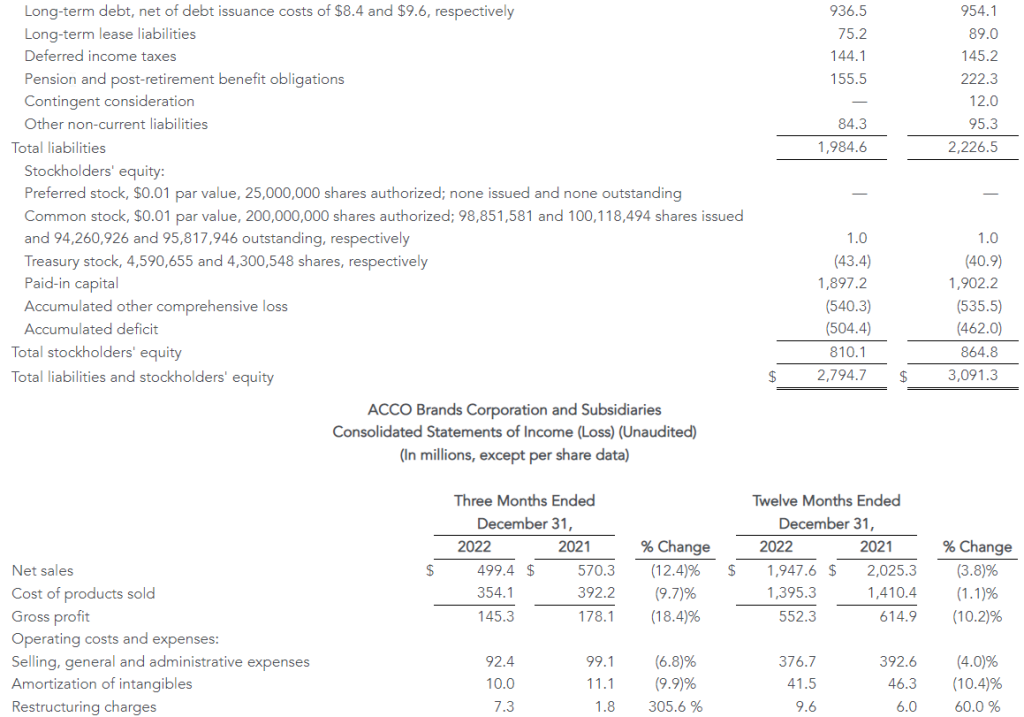
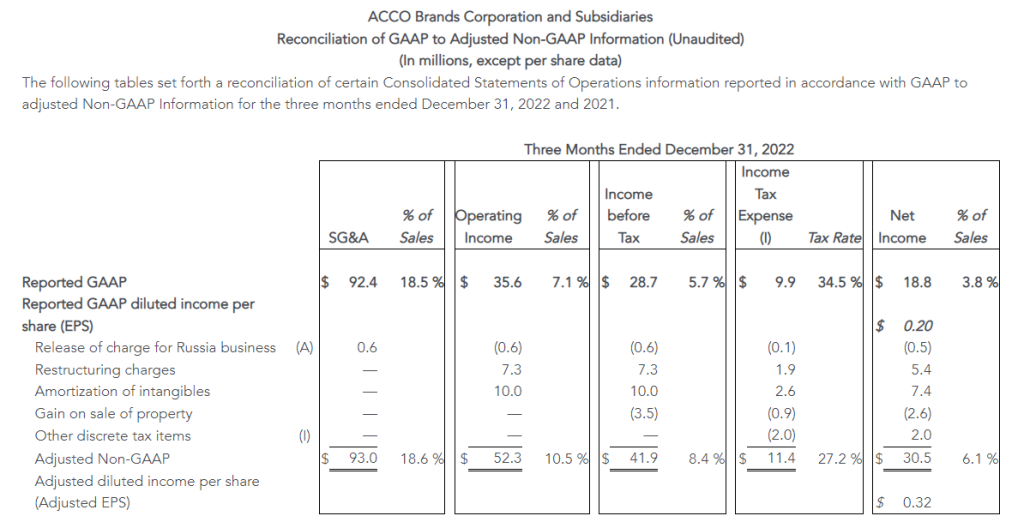
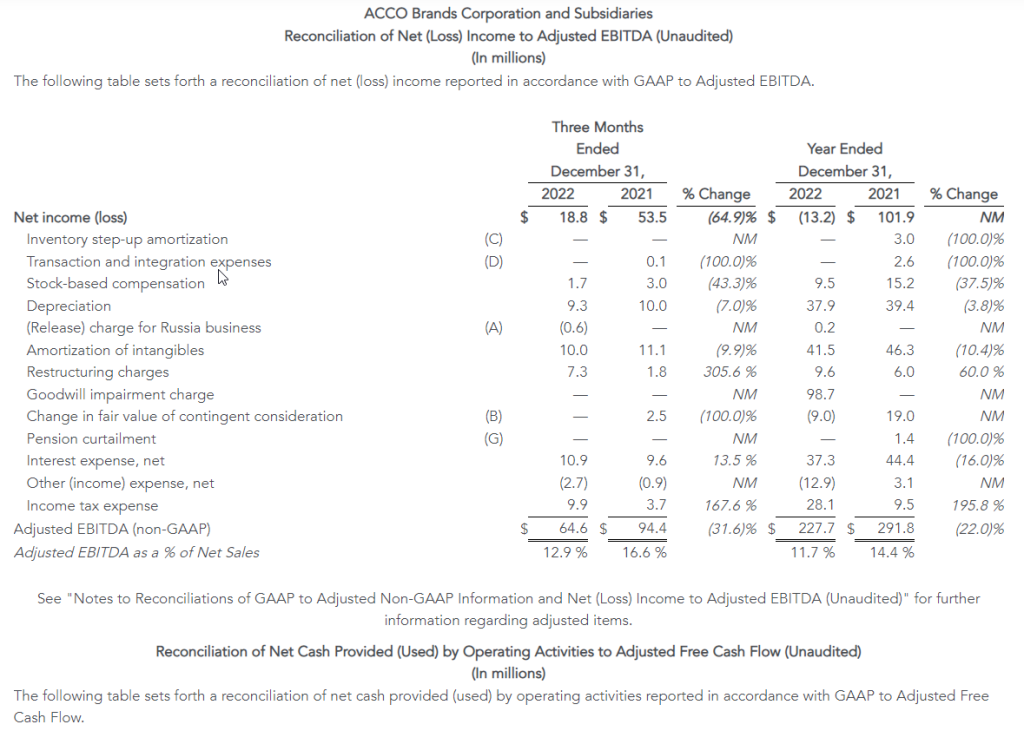
4Q Results. ACCO Brands posted net sales of $499.4 million, a decrease of 12.4% from the prior year’s $570.3 million. Operating income for the quarter was at $35.6 million versus $63.6 million the prior year due to lower sales volumes and higher inflation. Net income was reported at $18.8 million, or $0.20 per diluted share, compared to $53.5 million, or $0.55/sh, last year. We estimated revenue of $510.0 million, operating income of $47 million, net income of $26 million, and EPS of $0.28.
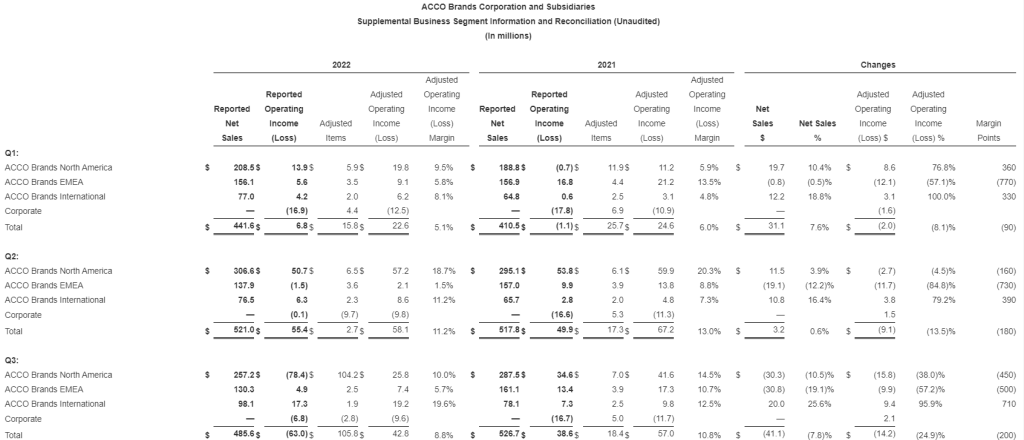
Revenue Segments. North America saw a decrease in sales to $225.7 million versus $271.0 million the prior year with operating income of $8.9 million versus $34.2 million a year ago. EMEA sales were $156.0 million versus $187.9 million the year prior, with operating income of $12.7 million versus $21.6 million. Lastly, International had sales of $117.7 million, an increase from last year’s $111.4 million, with operating income of $22.7 million, an increase over last year’s $20.9 million.
Equity Research is available at no cost to Registered users of Channelchek. Not a Member? Click ‘Join’ to join the Channelchek Community. There is no cost to register, and we never collect credit card information.
This Company Sponsored Research is provided by Noble Capital Markets, Inc., a FINRA and S.E.C. registered broker-dealer (B/D).
*Analyst certification and important disclosures included in the full report. NOTE: investment decisions should not be based upon the content of this research summary. Proper due diligence is required before making any investment decision.
Net sales were $1.95 billion, down 4 percent; comparable sales up 1 percent
Gained market share across multiple product categories in North America in 2022
Achieved quarterly sequential margin improvement in EMEA as pricing actions took hold
Realized double-digit sales and profit growth in the International segment
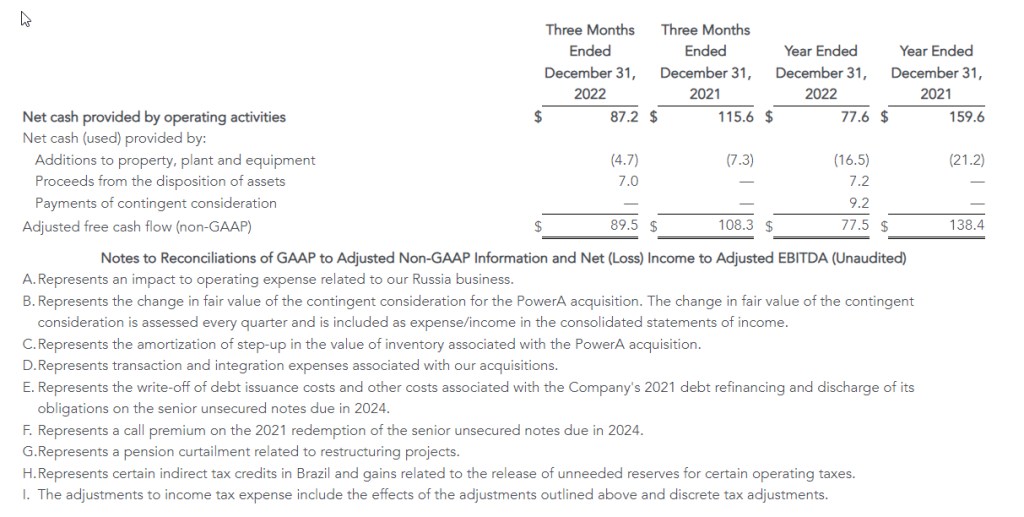
Generated $78 million of cash from operations; adjusted free cash flow of $78 million
During fourth quarter of 2022 actioned annual cost savings of $13 million from significant restructuring initiatives
Full year 2023 outlook anticipates margin expansion and profit growth
LAKE ZURICH, Ill.–(BUSINESS WIRE)– ACCO Brands Corporation (NYSE: ACCO) today announced its fourth quarter and full year results for the period ended December 31, 2022.
“We delivered 1% comparable sales growth in 2022 as we continue to execute on our strategic transformation, including expanding our product categories, broadening our geographic reach and bringing innovative new consumer-centric products to market. This enabled us to achieve market share gains with many of our brands, including Five Star®, Kensington®, Mead®, Quartet® and AT-A-GLANCE®. These successes give us confidence that our strategy of being a more consumer, brand and technology centric company and our portfolio of strong brands will position us to deliver sustainable organic growth over the long-term,” said Boris Elisman, Chairman and Chief Executive Officer of ACCO Brands.
“In 2023 our top priority is to restore our margin profile through incremental pricing actions implemented in January of 2023, the restructuring initiatives undertaken during the fourth quarter of 2022 and the additional productivity programs we will implement in 2023. We expect these actions will drive margin expansion and profit growth for the full year of 2023. With our expected continued strong cash flow in 2023, we will support our quarterly dividend, pay down debt and continue to invest in new product development and go-to-market initiatives, which we expect will better position us for future growth,” added Elisman.
Fourth Quarter Results
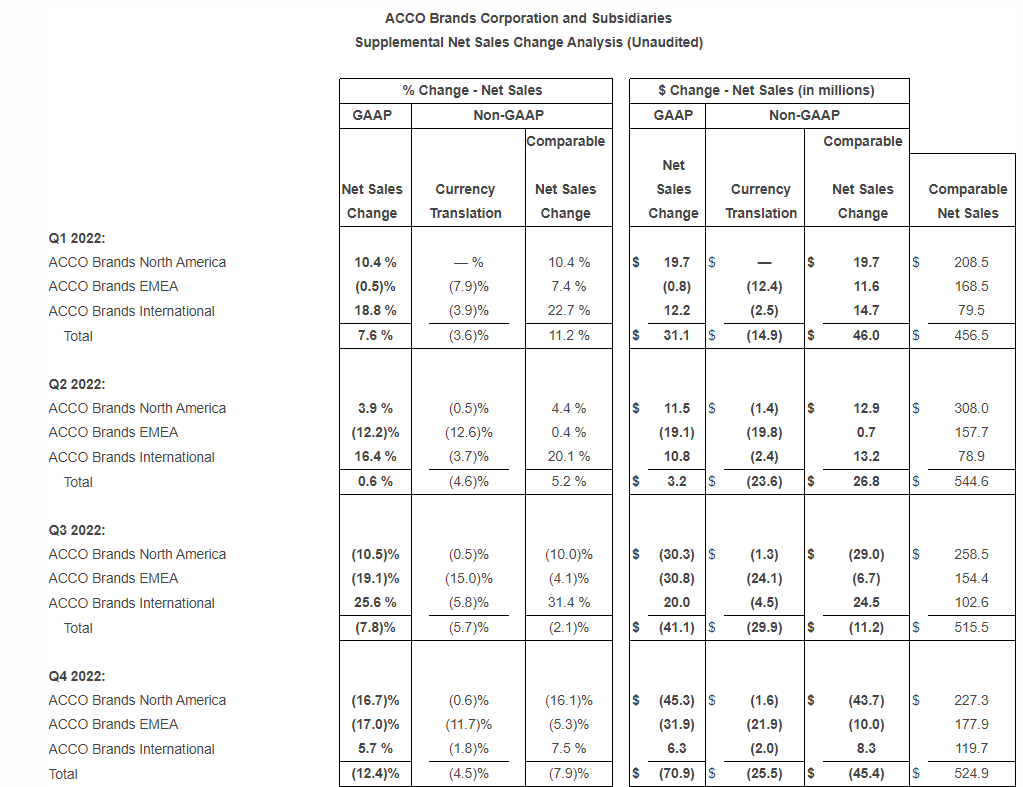
Net sales declined 12.4 percent to $499.4 million from $570.3 million in 2021. Adverse foreign exchange reduced sales $25.5 million, or 4.5 percent. Comparable sales fell 7.9 percent. Both reported and comparable sales declines were due to weaker sales of gaming accessories, lower inventory replenishment by our retailer customers and reduced volumes due to a deterioration in the macroeconomic environment. These more than offset global price increases.
Operating income was $35.6 million versus $63.6 million in 2021, and adjusted operating income decreased to $52.3 million from $79.1 million in the prior year. Both reported and adjusted operating income reflect the impact of lower sales volumes and higher inflation on raw materials, finished goods and transportation costs, which was partially offset by price increases, and reduced SG&A expense due to lower incentive compensation expense. Adverse foreign exchange reduced operating income by $2.2 million.
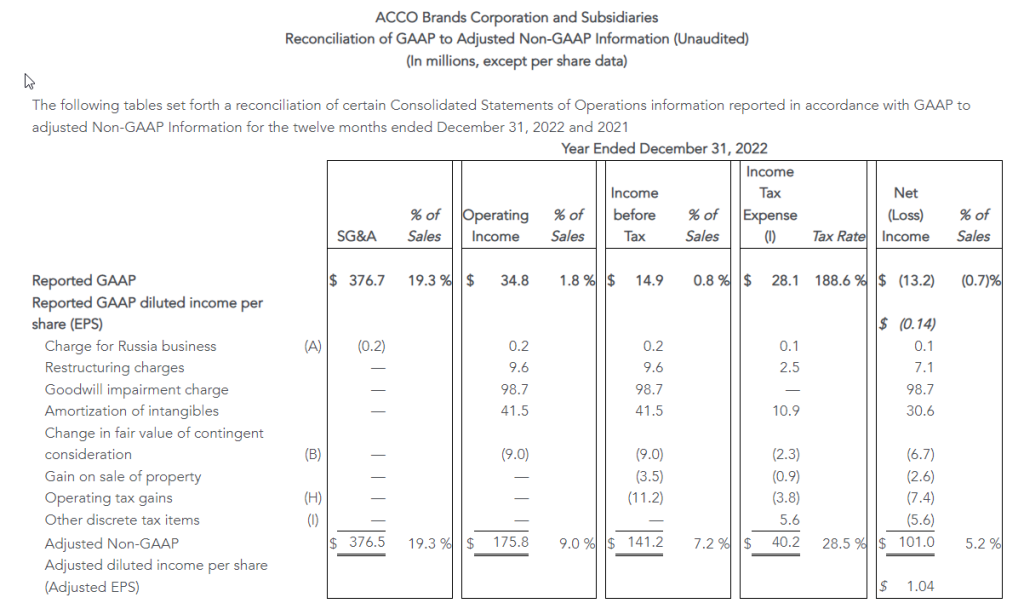
The Company reported net income of $18.8 million, or $0.20 per share, compared with prior year net income of $53.5 million, or $0.55 per share, which included $13.0 million of favorable discrete tax items. Adjusted net income was $30.5 million, or $0.32 per share, compared with $53.1 million, or $0.54 per share in 2021. The remaining declines in underlying reported net income, as well as adjusted net income were due to the items noted above in operating income.
Full Year Results
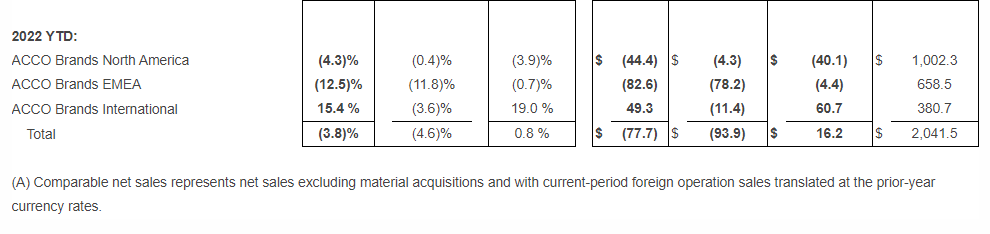
Net sales decreased 3.8 percent to $1.95 billion from $2.03 billion in 2021. The unfavorable impact of foreign exchange reduced sales by $93.9 million, or 4.6 percent. Comparable sales increased 0.8 percent. Both reported and comparable sales reflect the benefit of higher prices in all segments and strong volume growth in the International segment, partially offset by weaker sales of gaming accessories, and lower volumes in North America and EMEA due to the challenging macroeconomic environment.
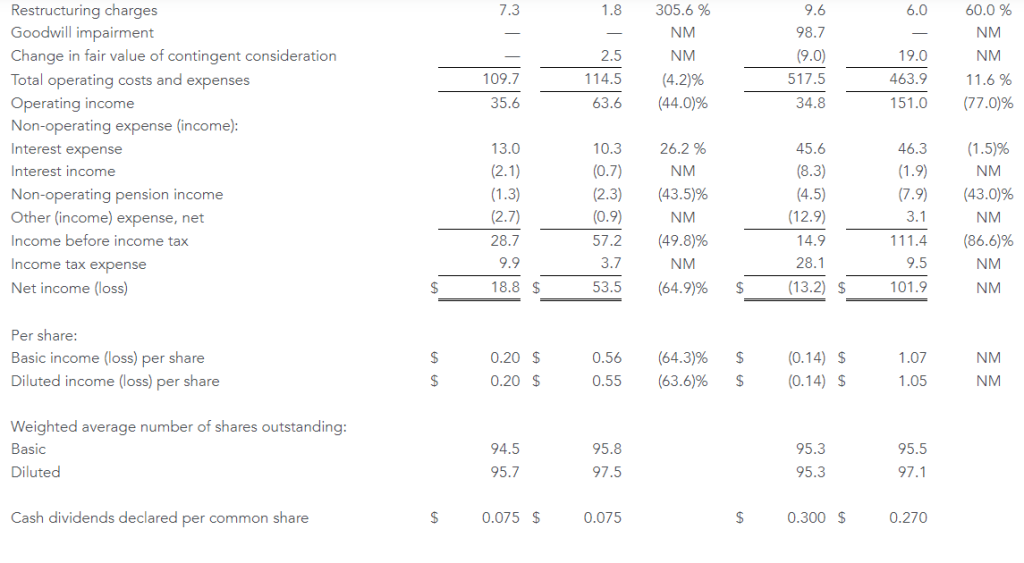
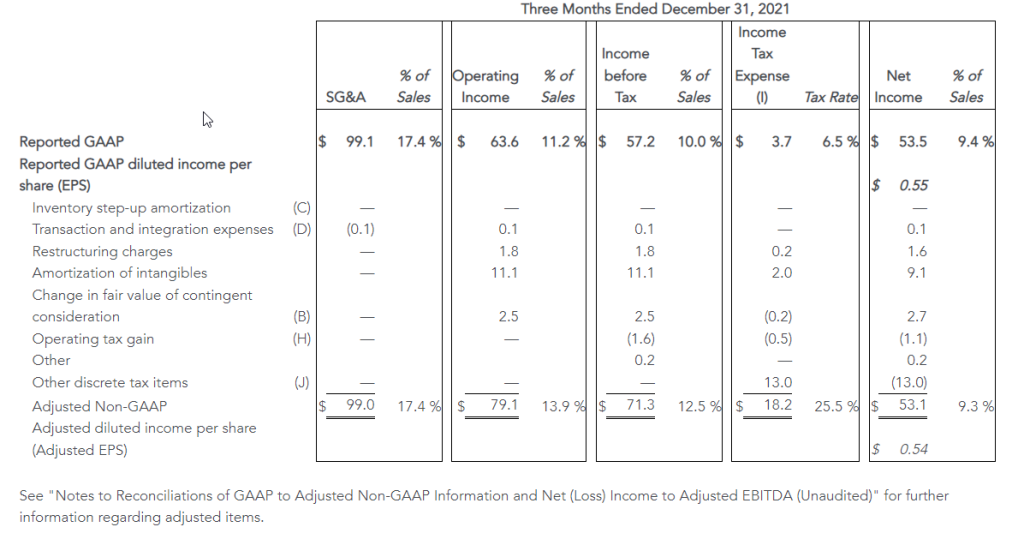
Operating income was $34.8 million compared to $151.0 million in 2021, with the decline primarily due to the non-cash goodwill impairment charge of $98.7 million, partially offset by the favorable change in fair value of $28.0 million related to the PowerA contingent earnout. Adjusted operating income declined to $175.8 million from $227.9 million in 2021. The declines in both reported and adjusted operating income also reflect the impact of inflation that exceeded the benefit of price increases, and reduced volumes, partially offset by reduced SG&A expense which includes lower incentive compensation expense. Unfavorable foreign exchange reduced operating income by $6.3 million.
Net loss was $13.2 million, or ($0.14) per share, compared with net income of $101.9 million, or $1.05 per share, in 2021. The current year net loss includes $98.7 million in non-cash goodwill impairment charges, mitigated by the favorable change in fair value of the contingent earnout consideration of $20.9 million. Prior year net income also included $19.7 million of additional favorable discrete tax items, partially offset by $9.9 million of expenses related to the debt refinancing. Adjusted net income was $101.0 million, compared with $136.8 million in 2021, and adjusted earnings per share were $1.04 compared with $1.41 in 2021. The remaining declines in reported net income and adjusted net income reflect the changes noted above for adjusted operating income, partially offset by higher interest income due to higher cash balances and increased interest rates in Brazil. Interest expense was similar to the prior year.
Capital Allocation and Dividend
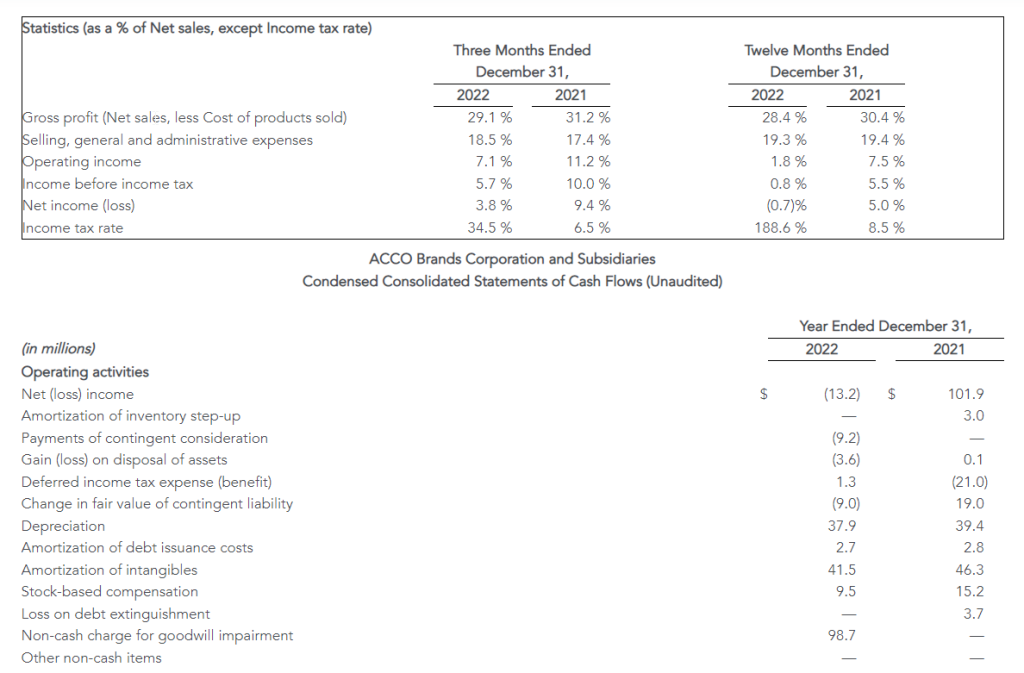
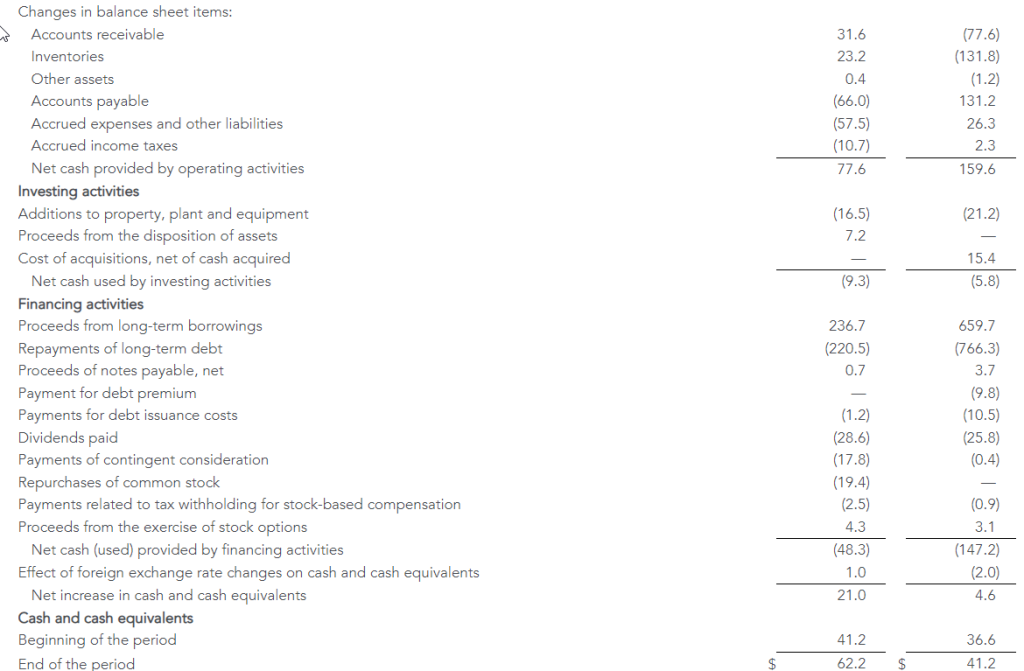
For the full year, the Company’s cash generated by operating activities was $77.6 million versus $159.6 million in the prior year. Adjusted free cash flow in 2022 was $77.5 million, reflecting net investing activity and excluding the operating component of the contingent earnout payment. In 2022 the Company paid $28.6 million in dividends, repurchased 2.7 million shares for $19.4 million and fully paid $27.0 million related to the 2021 PowerA contingent earnout.
ACCO Brands announced on February 17, 2023, that its board of directors declared a regular quarterly cash dividend of $0.075 per share. The dividend will be paid on April 5, 2023, to stockholders of record at the close of business on March 10, 2023.
Restructuring Actions
During the fourth quarter of 2022, the Company developed restructuring plans for both its North America and EMEA operating segments, intended to expand margins through initiatives focused on improving operating efficiency and reducing cost. In the Company’s North America segment, the plan is focused on consolidation of supply chain operations, SKU reduction, automating our sales support process, and sourcing optimization. In the Company’s EMEA segment, the focus is on reducing redundancy and enhancing productivity in its operations, SKU reduction, and sourcing initiatives. The Company anticipates these initiatives will create operating efficiencies and improve profitability, as well as provide for future growth investments. The Company has the following expectations for the restructuring plans:
Targeted annualized operating profit improvement of $13 million, with the vast majority of these savings delivered in 2023
Total profit improvements to be realized approximately 75% through lower SG&A costs and 25% through reduced cost of goods sold
Pre-tax restructuring charges of approximately $7 million were recorded in the fourth quarter, primarily comprised of severance and employee related costs
In addition, the Company has implemented plans to reduce inventory levels, increase inventory turns and improve cash flow and working capital.
Business Segment Results
ACCO Brands North America – Fourth quarter segment net sales of $225.7 million decreased 16.7 percent versus the prior year’s segment net sales of $271.0 million. Adverse foreign exchange reduced sales by 0.6 percent. Comparable sales of $227.3 million were down 16.1 percent. The decrease was primarily due to lower demand for gaming accessories and channel inventory destocking, more than offsetting price increases.
Fourth quarter operating income in North America was $8.9 million versus $34.2 million a year earlier, and adjusted operating income was $18.7 million compared to $41.9 million a year ago, with the decline in both primarily reflecting the impact of lower sales, reduced gross margin rates from negative fixed cost leverage and higher inflation on raw materials, finished goods and transportation costs. In addition, we incurred one-off items in the quarter of $7.8 million, reducing the margin rate by 340 basis points. We anticipate stabilization of product costs in select areas and improved ocean freight rates, which should benefit our margin profile in future periods.
For the full year, 2022 North America net sales of $998.0 million decreased 4.3 percent from $1,042.4 million in 2021, and comparable sales declined 3.9 percent. Higher sales and market share gains in many brands and product categories were more than offset by weaker demand for gaming accessories. Sales were stronger in the first half of 2022, driven by early demand for back-to-school products as retailers pulled their shipments to earlier in the year seeking to secure product for the selling season, while second half sales were challenged by both this pull forward, as well as inventory destocking and a slowdown in demand related to the macroeconomic environment.
In North America, the full year operating loss was $4.9 million versus operating income of $121.9 million in 2021. The loss was primarily due to the $98.7 million non-cash goodwill impairment charge. Adjusted operating income of $121.5 million decreased from $154.6 million in 2021. The decreases to reported operating loss/income and adjusted operating income reflect lower sales volumes and reduced gross margin from higher inflation on raw materials, finished goods and transportation costs.
ACCO Brands EMEA – Fourth quarter segment net sales of $156.0 million decreased 17.0 percent versus the prior year’s segment revenue of $187.9 million. Adverse foreign exchange reduced sales by 11.7 percent. Comparable sales of $177.9 million decreased 5.3 percent versus the prior-year period. Both reported and comparable sales declines were due to lower volumes which more than offset price increases. In Europe, the current energy crisis and significant inflation have created a challenging macroeconomic environment impacting sales.
Fourth quarter operating income in EMEA was $12.7 million versus $21.6 million a year earlier, and adjusted operating income was $18.4 million compared to $24.9 million a year ago. The decreases in both reported operating income and adjusted operating income were due primarily to lower sales and reduced gross margins reflecting negative fixed cost leverage and higher costs for finished goods, raw materials and freight due to significant inflation. In the fourth quarter, EMEA’s operating margin improved on a sequential basis benefiting from pricing actions and deflation in certain product and transportation costs.
Net sales for the full year in the EMEA segment of $580.3 million decreased 12.5 percent from $662.9 million in 2021. The impact of adverse foreign exchange reduced sales $78.2 million, or 11.8 percent. Comparable sales of $658.5 million decreased $4.4 million or 0.7 percent. Both reported and comparable sales declines reflect stronger sales volumes in early 2022 driven by computer accessories and business products, offset by persistent inflation and a challenging demand environment in the second half of the year, as well as the stoppage of sales to Russia.
The EMEA segment posted full-year operating income of $21.7 million compared with operating income of $61.7 million in 2021. Adjusted operating income was $37.0 million, down from $77.2 million in 2021. The declines in both reflects the impact of lower sales volumes and reduced gross margins reflecting higher costs for finished goods, raw materials and freight due to significant inflation and negative fixed cost leverage.
ACCO Brands International – Fourth quarter segment sales of $117.7 million increased 5.7 percent versus the prior year’s segment revenue of $111.4 million. Adverse foreign exchange reduced sales by 1.8 percent. Comparable sales of $119.7 million increased 7.5 percent versus the year-ago period. Both reported and comparable sales increased primarily due to price increases, more than offsetting lower volumes. Strong sales in Brazil benefited from a return to in-person education.
Fourth quarter operating income in the International segment was $22.7 million versus $20.9 million a year earlier, and adjusted operating income was $24.3 million compared to $22.9 million a year ago. The increases in both operating income and adjusted operating income were due primarily to price increases, and the strong performance in our Brazil business.
International segment sales of $369.3 million for the full year increased 15.4 percent from $320.0 million in 2021. Adverse foreign exchange reduced sales by $11.4 million. Comparable sales were $380.7 million, up 19.0 percent, due to increased volume and higher prices, primarily in Latin America from a return of in-person education and work.
Operating income of $50.5 million increased from $31.6 million in 2021. Adjusted operating income of $58.3 million increased from $40.6 million. The increases in both operating and adjusted operating income were primarily due to higher sales volumes, pricing and improved expense leverage.
Commentary and Outlook for 1Q and Full Year 2023
“Our priority in 2023 is to improve our operating profitability and free cash flow through pricing, productivity and restructuring initiatives and more efficient use of working capital. We anticipate that these actions, along with a moderating rate of inflation, will allow us to deliver margin expansion and profit and cash flow growth in 2023. We achieved comparable sales growth in 2022 and are confident in the long term sales potential of our business. Our proven business strategy, which includes geographic diversity, and our strong portfolio of brands and innovative products have us well positioned for continued long term profitable growth,” added Elisman.
“While the current economic environment remains fluid, we have an experienced management team with a proven track record of navigating periods of economic uncertainties. We are also well-capitalized, with no near-term debt maturities and generate consistent free cash flow. We remain confident in our strategic transformation and believe we have taken the right actions to drive long-term shareholder value,” Elisman concluded.
The Company is providing full year 2023 and 1Q outlook. For the full year, we expect comparable sales to be down 3 percent to flat, reflecting a challenging near-term demand environment. Foreign exchange is expected to be neutral to reported revenue. Full year adjusted EPS is expected to rise 4 percent to 8 percent, to $1.08 to $1.12, approaching low double-digit growth in adjusted operating income, partially offset by higher interest and non-cash non-operating pension expenses. 2023 free cash flow is expected to grow to at least $100 million.
Our quarterly sales and profit projection for 2023 will reflect a different cadence than last year. In 2022, the Company experienced good sales growth in the first half of the year reflecting strong demand from the post-pandemic economic recovery. In addition, North America sales benefited from the pull forward of purchases by retailers to ensure product availability for back-to-school. Concerns about the economy, the war in Ukraine and related energy crisis in EMEA challenged demand and our sales in the second half of 2022. In addition, our retail customers proactively curtailed purchases in the back half of the year to aggressively reduce their inventory levels. Against these comparisons, we are projecting our sales to be down in both the first quarter and first half of 2023, with growth anticipated in the second half of the year.
In the first quarter, we expect comparable sales to decline 10 percent to 7 percent, primarily due to the timing of back-to-school shipments and lower sales of gaming accessories in North America, partially offset by higher sales in our International segment. First quarter adjusted EPS is expected to be $0.05 to $0.07 with higher gross margins offset by sales deleveraging, higher interest and non-cash, non-operating pension expenses.
Webcast
At 8:30 a.m. ET on February 24, 2023, ACCO Brands Corporation will host a conference call to discuss the Company’s fourth quarter and full year 2022 results. The call will be broadcast live via webcast. The webcast can be accessed through the Investor Relations section of www.accobrands.com. The webcast will be in listen-only mode and will be available for replay following the event.
About ACCO Brands Corporation
ACCO Brands, the Home of Great Brands Built by Great People, designs, manufactures and markets consumer and end-user products that help people work, learn, play and thrive. Our widely recognized brands include AT-A-GLANCE®, Five Star®, Kensington®, Leitz®, Mead®, PowerA®, Swingline®, Tilibra® and many others. More information about ACCO Brands Corporation (NYSE: ACCO) can be found at www.accobrands.com.
Non-GAAP Financial Measures
In addition to financial results reported in accordance with generally accepted accounting principles (GAAP), we have provided certain non-GAAP financial information in this earnings release to aid investors in understanding the Company’s performance. Each non-GAAP financial measure is defined and reconciled to its most closely related GAAP financial measure in the “About Non-GAAP Financial Measures” section of this earnings release.
Forward-Looking Statements
Statements contained herein, other than statements of historical fact, particularly those anticipating future financial performance, business prospects, growth, strategies, business operations and similar matters, results of operations, liquidity and financial condition, are “forward-looking statements” within the meaning of the Private Securities Litigation Reform Act of 1995. These statements are based on the beliefs and assumptions of management based on information available to us at the time such statements are made. These statements, which are generally identifiable by the use of the words “will,” “believe,” “expect,” “intend,” “anticipate,” “estimate,” “forecast,” “project,” “plan,” and similar expressions, are subject to certain risks and uncertainties, are made as of the date hereof, and we undertake no duty or obligation to update them. Because actual results may differ materially from those suggested or implied by such forward-looking statements, you should not place undue reliance on them when deciding whether to buy, sell or hold the company’s securities.
Our outlook is based on certain assumptions, which we believe to be reasonable under the circumstances. These include, without limitation, assumptions regarding the impact of the COVID-19 pandemic and the war in Ukraine; the impact of inflation and global economic uncertainties, fluctuations in foreign currency exchange rates and acquisitions; and the other factors described below.
Among the factors that could cause our actual results to differ materially from our forward-looking statements are: our ability to successfully execute our restructuring plans and realize the benefits of our productivity initiatives; our ability to obtain additional price increases and realize longer-term cost reductions; the ongoing impact of the COVID-19 pandemic; a relatively limited number of large customers account for a significant percentage of our sales; issues that influence customer and consumer discretionary spending during periods of economic uncertainty or weakness; risks associated with foreign currency exchange rate fluctuations; challenges related to the highly competitive business environment in which we operate; our ability to develop and market innovative products that meet consumer demands and to expand into new and adjacent product categories that are experiencing higher growth rates; our ability to successfully expand our business in emerging markets and the exposure to greater financial, operational, regulatory, compliance and other risks in such markets; the continued decline in the use of certain of our products; risks associated with seasonality; the sufficiency of investment returns on pension assets, risks related to actuarial assumptions, changes in government regulations and changes in the unfunded liabilities of a multi-employer pension plan; any impairment of our intangible assets; our ability to secure, protect and maintain our intellectual property rights, and our ability to license rights from major gaming console makers and video game publishers to support our gaming business; continued disruptions in the global supply chain; risks associated with inflation and other changes in the cost or availability of raw materials, transportation, labor, and other necessary supplies and services and the cost of finished goods; the continued global shortage of microchips which are needed in our gaming and computer accessories businesses; risks associated with outsourcing production of certain of our products, information technology systems and other administrative functions; the failure, inadequacy or interruption of our information technology systems or its supporting infrastructure; risks associated with a cybersecurity incident or information security breach, including that related to a disclosure of personally identifiable information; our ability to grow profitably through acquisitions; our ability to successfully integrate acquisitions and achieve the financial and other results anticipated at the time of acquisition, including planned synergies; risks associated with our indebtedness, including limitations imposed by restrictive covenants, our debt service obligations, and our ability to comply with financial ratios and tests; a change in or discontinuance of our stock repurchase program or the payment of dividends; product liability claims, recalls or regulatory actions; the impact of litigation or other legal proceedings; our failure to comply with applicable laws, rules and regulations and self-regulatory requirements, the costs of compliance and the impact of changes in such laws; our ability to attract and retain qualified personnel; the volatility of our stock price; risks associated with circumstances outside our control, including those caused by public health crises, such as the occurrence of contagious diseases like COVID-19, severe weather events, war, terrorism and other geopolitical incidents; and other risks and uncertainties described in “Part I, Item 1A. Risk Factors” in our Annual Report on Form 10-K for the year ended December 31, 2021, “Part II, Item 1A Risk Factors” in our Quarterly Report on Form 10-Q for the quarter ended September 30, 2022 and in other reports we file with the Securities and Exchange Commission.
About Non-GAAP Financial Measures
We explain below how we calculate each of our non-GAAP financial measures and a reconciliation of our current period and historical non-GAAP financial measures to the most directly comparable GAAP financial measures follows.
We use our non-GAAP financial measures both to explain our results to stockholders and the investment community and in the internal evaluation and management of our business. We believe our non-GAAP financial measures provide management and investors with a more complete understanding of our underlying operational results and trends, facilitate meaningful period-to-period comparisons and enhance an overall understanding of our past and future financial performance.
Our non-GAAP financial measures exclude certain items that may have a material impact upon our reported financial results such as restructuring charges, transaction and integration expenses associated with material acquisitions, the impact of foreign currency exchange rate fluctuations and acquisitions, unusual tax items, goodwill impairment charges, and other non-recurring items that we consider to be outside of our core operations. These measures should not be considered in isolation or as a substitute for, or superior to, the directly comparable GAAP financial measures and should be read in connection with the Company’s financial statements presented in accordance with GAAP.
Our non-GAAP financial measures include the following:
Comparable Sales : Represents net sales excluding the impact of material acquisitions with current-period foreign operation sales translated at prior-year currency rates. We believe comparable sales are useful to investors and management because they reflect underlying sales and sales trends without the effect of acquisitions and fluctuations in foreign exchange rates and facilitate meaningful period-to-period comparisons. We sometimes refer to comparable sales as comparable net sales.
Adjusted Gross Profit : Represents gross profit excluding the effect of the amortization of the step-up in inventory from material acquisitions. We believe adjusted gross profit is useful to investors and management because it reflects underlying gross profit without the effect of inventory adjustments resulting from acquisitions that we consider to be outside our core operations and facilitates meaningful period-to-period comparisons.
Adjusted Selling, General and Administrative (SG&A) Expenses : Represents selling, general and administrative expenses excluding transaction and integration expenses related to material acquisitions. We believe adjusted SG&A expenses are useful to investors and management because they reflect underlying SG&A expenses without the effect of expenses related to acquiring and integrating acquisitions that we consider to be outside our core operations and facilitate meaningful period-to-period comparisons.
Adjusted Operating Income/Adjusted Income Before Taxes/Adjusted Net Income/Adjusted Net Income Per Diluted Share :Represents operating income, income before taxes, net income, and net income per diluted share excluding restructuring and goodwill impairment charges, the amortization of intangibles, the amortization of the step-up in value of inventory, the change in fair value of contingent consideration, transaction and integration expenses associated with material acquisitions, non-recurring items in interest expense or other income/expense such as expenses associated with debt refinancing, a bond redemption, or a pension curtailment, and other non-recurring items as well as all unusual and discrete income tax adjustments, including income tax related to the foregoing. We believe these adjusted non-GAAP financial measures are useful to investors and management because they reflect our underlying operating performance before items that we consider to be outside our core operations and facilitate meaningful period-to-period comparisons. Senior management’s incentive compensation is derived, in part, using adjusted operating income and adjusted net income per diluted share, which is derived from adjusted net income. We sometimes refer to adjusted net income per diluted share as adjusted earnings per share or adjusted EPS.
Adjusted Income Tax Expense/Rate :Represents income tax expense/rate excluding the tax effect of the items that have been excluded from adjusted income before taxes, unusual income tax items such as the impact of tax audits and changes in laws, significant reserves for cash repatriation, excess tax benefits/losses, and other discrete tax items. We believe our adjusted income tax expense/rate is useful to investors because it reflects our baseline income tax expense/rate before benefits/losses and other discrete items that we consider to be outside our core operations and facilitates meaningful period-to-period comparisons.
Adjusted EBITDA: Represents net income excluding the effects of depreciation, stock-based compensation expense, amortization of intangibles, the change in fair value of contingent consideration, interest expense, net, other (income) expense, net, and income tax expense, the amortization of the step-up in value of inventory, transaction and integration expenses associated with material acquisitions, restructuring and goodwill impairment charges, non-recurring items in interest expense or other income/expense such as expenses associated with debt refinancing, a bond redemption, or a pension curtailment and other non-recurring items. We believe adjusted EBITDA is useful to investors because it reflects our underlying cash profitability and adjusts for certain non-cash charges, and items that we consider to be outside our core operations and facilitates meaningful period-to-period comparisons.
Adjusted Free Cash Flow: Represents cash flow from operating activities, excluding cash payments made for contingent earnouts, less cash used for additions to property, plant and equipment, plus cash proceeds from the disposition of assets. We believe adjusted free cash flow is useful to investors because it measures our available cash flow for paying dividends, funding strategic material acquisitions, reducing debt, and repurchasing shares.
Consolidated Leverage Ratio: Represents balance sheet debt, plus debt origination costs and less any cash and cash equivalents divided by adjusted EBITDA. We believe that consolidated leverage ratio is useful to investors since the company has the ability to, and may decide to use a portion of its cash and cash equivalents to retire debt.
We also provide forward-looking non-GAAP comparable sales, adjusted earnings per share, adjusted free cash flow, adjusted EBITDA, and adjusted tax rate, and historical and forward-looking consolidated leverage ratio. We do not provide a reconciliation of these forward-looking and historical non-GAAP measures to GAAP because the GAAP financial measure is not currently available and management cannot reliably predict all the necessary components of such non-GAAP measures without unreasonable effort or expense due to the inherent difficulty of forecasting and quantifying certain amounts that are necessary for such a reconciliation, including adjustments that could be made for restructuring, integration and acquisition-related expenses, the variability of our tax rate and the impact of foreign currency fluctuation and material acquisitions, and other charges reflected in our historical results. The probable significance of each of these items is high and, based on historical experience, could be material.
Christopher McGinnis Investor Relations (847) 796-4320
LOS ANGELES, Feb. 22, 2023 (GLOBE NEWSWIRE) — FAT (Fresh. Authentic. Tasty.) Brands Inc. (NASDAQ: FAT) (“FAT Brands” or the “Company”) today reported fourth quarter and full year 2022 financial results for the fiscal year ended December 25, 2022.
Andy Wiederhorn, President and CEO of FAT Brands, commented, “The fourth quarter marked yet another strong performance for FAT Brands, as evidenced by our robust unit development and profitable revenue growth. After a very active acquisition strategy in 2021, I am particularly pleased with the momentum of our organic growth strategy during 2022.”
“With over 140 store openings during 2022, we achieved a new milestone for FAT Brands, including 44 that opened in the fourth quarter. We plan to continue this robust unit growth with between 150 and 175 units slated to open in 2023. We are seeing strong new franchisee activity as well as continued demand from existing franchise partners to develop other brands within our portfolio, which is very encouraging as we look beyond our current unit development pipeline of over 1,000 locations representing 60% EBITDA growth over the next several years.”
“We are extremely impressed with how our 2021 acquisitions have seamlessly fit into our portfolio and the demand we are experiencing for them from our franchisee base. In addition to our organic growth momentum, we will lean into the expansion of our high-growth brands, particularly our sports lodge category, and continue to expand our factory business.”
“We also continue to work on reducing our cost of capital and are pursuing strategies to significantly reduce our leverage ratio over the next 24 to 36 months.”
Fiscal FourthQuarter 2022Highlights
Total revenue improved 39.9% to $103.8 million compared to $74.2 million in the fourth quarter of 2021
System-wide sales growth of 22.1% in the fourth quarter of 2022 compared to the prior year quarter
Year-to-date system-wide same-store sales growth of 2.7% in the fourth quarter of 2022 compared to the prior year
44 new store openings during the fourth quarter of 2022 and over 140 openings during the year
Net loss of $70.8 million, or $4.29 per diluted share, compared to $19.6 million, or $1.38 per diluted share, in the fourth quarter of 2021
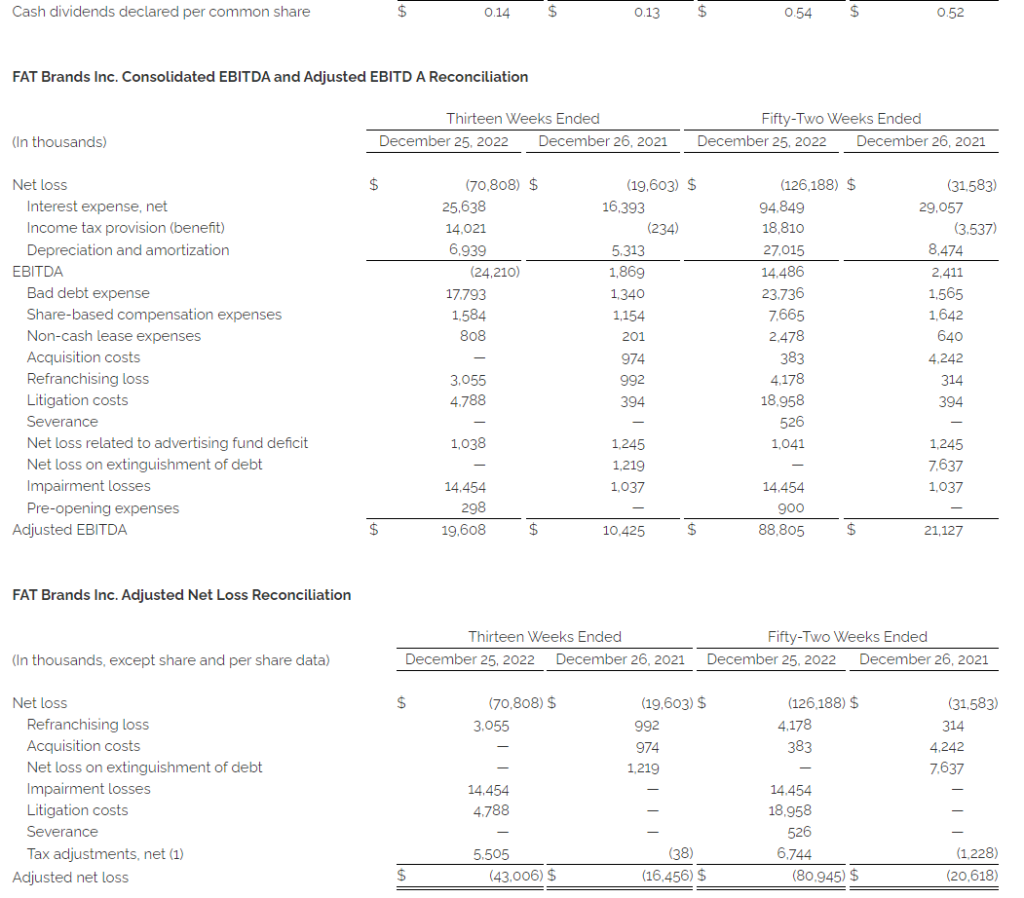
Adjusted EBITDA(1) of $19.6 million compared to $10.4 million in the fourth quarter of 2021
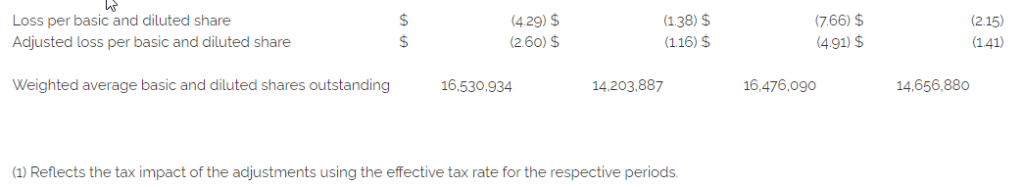
Adjusted net loss(1) of $43.0 million, or $2.60 per diluted share, compared to $16.5 million, or $1.16 per diluted share, in the fourth quarter of 2021
Fiscal Year 2022 Highlights
Total revenue increased 242.5% to $407.2 million compared to $118.9 million in 2021
System-wide sales growth of 108.0% compared to 2021
Year-to-date system-wide same-store sales growth of 6.0% in 2022 compared to 2021
Over 140 new store openings during 2022
Net loss of $126.2 million, or $7.66 per diluted share, compared to $31.6 million, or $2.15 per diluted share, in 2021
Adjusted EBITDA(1) of $88.8 million compared to $21.1 million 2021
Adjusted net loss(1) of $80.9 million, or $4.91 per diluted share, compared to $20.6 million, or $1.41 per diluted share, in 2021
(1) EBITDA, Adjusted EBITDA and adjusted net loss are non-GAAP measures defined below, under “Non-GAAP Measures”. Reconciliation of GAAP net loss to EBITDA, adjusted EBITDA and adjusted net loss are included in the accompanying financial tables.
Summary of Fourth Quarter 2022 Financial Results
Total revenue increased $29.6 million, or 39.9%, in the fourth quarter of 2022, to $103.8 million compared to $74.2 million in the same period of 2021. The increase reflects revenue from the acquisition of Twin Peaks in October 2021, the acquisitions of Fazoli’s and Native Grill & Wings in December 2021 (collectively, the “2021 Acquisitions”) and the continuing recovery from the negative effects of the COVID-19 pandemic on royalties from restaurant sales.
Costs and expenses increased $59.5 million, or 77.3%, in the fourth quarter of 2022 to $136.4 million compared to $77.0 million in the same period in the prior year, primarily due to the 2021 Acquisitions.
General and administrative expense increased $17.6 million, or 81.4%, in the fourth quarter of 2022 compared to the same period in the prior year, primarily due to the 2021 Acquisitions, increased compensation costs, professional fees related to pending litigation and government investigations, and travel, reflecting the significant expansion of the organization.
Cost of restaurant and factory revenues totaled $61.7 million in the fourth quarter of 2022 and was related to the operations of the company-owned restaurant locations and our dough factory associated with the 2021 Acquisitions.
Depreciation and amortization increased $1.6 million, or 30.6% in the fourth quarter of 2022 compared to the same period in the prior year, primarily due to depreciation of company-owned restaurant property and equipment and amortizing intangible assets related to the 2021 Acquisitions.
Refranchising losses in the fourth quarter of 2022 were $3.1 million and were comprised of restaurant costs and expenses, net of food sales. Refranchising losses in the fourth quarter of 2021 were $1.0 million and were comprised of $2.1 million restaurant operating costs, net of food sales, partially offset by $1.1 million in net gains related to refranchised restaurants.
Advertising expenses increased $1.6 million in the fourth quarter of 2022 compared to the prior year period. These expenses vary in relation to advertising revenues and reflect advertising expenses related to the 2021 Acquisitions and the increase in customer activity as the recovery from COVID continues.
Total other expense, net for the fourth quarters of 2022 and 2021 was $24.2 million and $17.1 million, respectively, primarily comprised of net interest expense of $25.6 million and $16.4 million, respectively.
Adjusted net loss was $43.0 million, or $2.60 per diluted share, in the fourth quarter of 2022 compared to $16.5 million, or $1.16 per diluted share, in the fourth quarter of 2021.
Key Financial Definitions
New store openings – The number of new store openings reflects the number of stores opened during a particular reporting period. The total number of new stores per reporting period and the timing of stores openings has, and will continue to have, an impact on our results.
Same-store sales growth – Same-store sales growth reflects the change in year-over-year sales for the comparable store base, which we define as the number of stores open and in the FAT Brands system for at least one full fiscal year. For stores that were temporarily closed, sales in the current and prior period are adjusted accordingly. Given our focused marketing efforts and public excitement surrounding each opening, new stores often experience an initial start-up period with considerably higher than average sales volumes, which subsequently decrease to stabilized levels after three to six months. Additionally, when we acquire a brand, it may take several months to integrate fully each location of said brand into the FAT Brands platform. Thus, we do not include stores in the comparable base until they have been open and in the FAT Brands system for at least one full fiscal year. For 2022, the comparable store base does not include concepts acquired during the fourth quarter of 2021.
System-wide sales growth – System wide sales growth reflects the percentage change in sales in any given fiscal period compared to the prior fiscal period for all stores in that brand only when the brand is owned by FAT Brands. Because of acquisitions, new store openings and store closures, the stores open throughout both fiscal periods being compared may be different from period to period.
Conference Call and Webcast
FAT Brands will host a conference call and webcast to discuss its fiscal fourth quarter 2022 financial results today at 5:00 PM ET. Hosting the conference call and webcast will be Andy Wiederhorn, President and Chief Executive Officer, and Ken Kuick, Chief Financial Officer.
The conference call can be accessed live over the phone by dialing 1-877-704-4453 from the U.S. or 1-201-389-0920 internationally. A replay will be available after the call until Wednesday, March 1, 2023, and can be accessed by dialing 1-844-512-2921 from the U.S. or 1-412-317-6671 internationally. The passcode is 13735781. The webcast will be available at www.fatbrands.com under the “Investors” section and will be archived on the site shortly after the call has concluded.
About FAT (Fresh. Authentic. Tasty.) Brands
FAT Brands (NASDAQ: FAT) is a leading global franchising company that strategically acquires, markets, and develops fast casual, quick-service, casual dining, and polished casual dining concepts around the world. The Company currently owns 17 restaurant brands: Round Table Pizza, Fatburger, Marble Slab Creamery, Johnny Rockets, Fazoli’s, Twin Peaks, Great American Cookies, Hot Dog on a Stick, Buffalo’s Cafe & Express, Hurricane Grill & Wings, Pretzelmaker, Elevation Burger, Native Grill & Wings, Yalla Mediterranean and Ponderosa and Bonanza Steakhouses and franchises and owns approximately 2,300 units worldwide. For more information, please visit www.fatbrands.com.
Forward-Looking Statements
This press release contains forward-looking statements within the meaning of the Private Securities Litigation Reform Act of 1995, including statements relating to the future financial and operating results of the Company, estimates of future EBITDA, the timing and performance of new store openings, future reductions in cost of capital and leverage ratio, our ability to conduct future accretive acquisitions, our pipeline of new store locations, and the recovery of our business from the COVID-19 pandemic. Forward-looking statements generally use words such as “expect,” “foresee,” “anticipate,” “believe,” “project,” “should,” “estimate,” “will,” “plans,” “forecast,” and similar expressions, and reflect our expectations concerning the future. Forward-looking statements are subject to significant business, economic and competitive risks, uncertainties and contingencies, many of which are difficult to predict and beyond our control, which could cause our actual results to differ materially from the results expressed or implied in such forward-looking statements. We refer you to the documents that we file from time to time with the Securities and Exchange Commission, such as our reports on Form 10-K, Form 10-Q and Form 8-K, for a discussion of these and other risks and uncertainties that could cause our actual results to differ materially from our current expectations and from the forward-looking statements contained in this press release. We undertake no obligation to update any forward-looking statements to reflect events or circumstances occurring after the date of this press release.
Non-GAAP Measures (Unaudited)
This press release includes the non-GAAP financial measures of EBITDA, adjusted EBITDA and adjusted net loss.
EBITDA is defined as earnings before interest, taxes, and depreciation and amortization. We use the term EBITDA, as opposed to income from operations, as it is widely used by analysts, investors, and other interested parties to evaluate companies in our industry. We believe that EBITDA is an appropriate measure of operating performance because it eliminates the impact of expenses that do not relate to business performance. EBITDA is not a measure of our financial performance or liquidity that is determined in accordance with generally accepted accounting principles (“GAAP”), and should not be considered as an alternative to net income (loss) as a measure of financial performance or cash flows from operations as measures of liquidity, or any other performance measure derived in accordance with GAAP.
Adjusted EBITDA is defined as EBITDA (as defined above), excluding expenses related to acquisitions, refranchising gain or losses, impairment charges, and certain non-recurring or non-cash items that the Company does not believe directly reflect its core operations and may not be indicative of the Company’s recurring business operations.
Adjusted net loss is a supplemental measure of financial performance that is not required by or presented in accordance with GAAP. Adjusted net loss is defined as net loss plus the impact of adjustments and the tax effects of such adjustments. Adjusted net loss is presented because we believe it helps convey supplemental information to investors regarding our performance, excluding the impact of special items that affect the comparability of results in past quarters to expected results in future quarters. Adjusted net loss as presented may not be comparable to other similarly titled measures of other companies, and our presentation of adjusted net loss should not be construed as an inference that our future results will be unaffected by excluded or unusual items. Our management uses this non-GAAP financial measure to analyze changes in our underlying business from quarter to quarter based on comparable financial results.
Reconciliations of net loss presented in accordance with GAAP to EBITDA, adjusted EBITDA and adjusted net loss are set forth in the tables below.
NEW ALBANY, Ohio, Feb. 22, 2023 (GLOBE NEWSWIRE) — CVG (NASDAQ: CVGI) will hold its quarterly conference call on Tuesday, March 7, 2023, at 10:00 a.m. ET, to discuss fourth quarter and full year 2022 financial results. CVG will issue a press release and presentation prior to the conference call.
Toll-free participants dial (888) 396-8049 using conference code 33489158. International participants dial (416) 764-8646 using conference code 33489158. This call is being webcast and can be accessed through the “Investors” section of CVG’s website at ir.cvgrp.com where it will be archived for one year.
A telephonic replay of the conference call will be available until March 21, 2023. To access the replay, toll-free callers can dial (877) 674-7070 using access code 489158.
About CVG
At CVG, we deliver real solutions to complex design, engineering and manufacturing problems while creating positive change for our customers, industries, and communities we serve. Information about the Company and its products is available on the internet at www.cvgrp.com.
Investor Relations Contact: Ross Collins or Stephen Poe Alpha IR Group CVGI@alpha-ir.com
The ultimate sports lodgecontinues toperformat a high level, opening ninenew restaurantsand landingfive major development agreements
DALLAS, Feb. 13, 2023 (GLOBE NEWSWIRE) — FAT (Fresh. Authentic. Tasty.) Brands Inc., parent company of Twin Peaks Restaurant and 16 other restaurant concepts, is pleased to announce another strong year for Twin Peaks. The leading sports lodge concept generated strong growth throughout 2022 in addition to landing top spots on several prestigious awards lists.
In total, the banner year saw Twin Peaks open nine new lodges, while also signing four new area development agreements (ADAs) to add 26 future lodges in the United States and one ADA in Mexico for an additional 32 lodges. These agreements are expected to allow the brand to surpass the monumental 100-restaurant milestone by spring of 2023.
“We’re proud of the work our teams put in to ensure that Twin Peaks stays at the forefront of the sports bar segment and the restaurant industry as a whole,” said CEO Joe Hummel, who was named one of the most influential restaurant CEOs by Nation’s Restaurant News in 2022.
Twin Peaks began 2022 with the opening of its third lodge in Mexico City and now has four locations south of the border. The brand enters 2023 with 95 locations across the United States and Mexico with an anticipated 18-20 additional restaurants opening in 2023 in Chattanooga, Tennessee; Greenwood, Indiana; Deer Valley, Arizona; Columbus, Ohio; Springfield, Missouri; as well as Daytona Beach and Jacksonville, Florida to begin the year.
The brand signed several domestic ADAs to expand its footprint, including eight locations across North Carolina with Music City Consulting, four locations in the Ohio River Valley with JEB Food Group and three restaurants in the Pittsburgh area with the Falcons Group. Twin Peaks also secured an agreement with Dos Montes Corp. to add seven locations in Chicago and its largest international ADA to date with its subsidiary, Operadora 2 Montes, for 32 lodges in Mexico.
Twin Peaks also scored a number of industry honors. It placed seventh in Nation’s Restaurant News’ “Top 10 Biggest Sports Bars” and ranked 107th among the publication’s “Top 500 Restaurant Chains.” Twin Peaks also earned additional recognition by being named to Entrepreneur’s “Top 500” list, Black Box’s “Top 5 Restaurant Brands,” and Restaurant Business’ “Top 500” list for 2022.
In addition to these accolades, Twin Peaks continues to level up the sports bar’s menu. Twin Peaks amplified its scratch-made kitchen in 2022 with new artisan Flatbreads, Crispy Mini Beef Tacos, a variety of Street Tacos made with in-house smoked meats, a hand-cut choice New York Strip Steak, and specially crafted dessert and shot pairings.
Twin Peaks wrapped up its banner year by joining several partners in local fundraising initiatives. From serving meals to those affected by Hurricane Ian in Florida to fundraising efforts to raise $10,000 for Warriors for Freedom in Oklahoma to various local toy drives and gifting Christmas trees to military families throughout the holidays, Twin Peaks staff gave its time and effort to help support those in need throughout the communities in which it operates.
Capping off the year was Twin Peaks’ partnership with two national nonprofit organizations. Twin Peaks supported the ALS Foundation with a systemwide campaign to raise $15,000 for the organization and hosted the Twin Peaks Annual Hero’s Golf Tournament that raised $100,000 for its military foundation, Tunnel to Towers.
As Twin Peaks looks forward to surpassing the 100-restaurant milestone, the award-winning brand also has more big things in store for 2023 with continued unit growth, exciting marketing promotions for Super Bowl Sunday and March Madness, and a focus on the continued evolution of its sports bar fare with the launch of its new craft cocktails and spirits menu. Guests can also expect an expansion of its premium barrel selects that include refined choices like Angel’s Envy and Stagg Jr. bourbon and Corazon Resposado Buffalo Trace tequila to go along with reimagined cocktails and a fresh batch of quality spirits.
FAT Brands (NASDAQ: FAT) is a leading global franchising company that strategically acquires, markets, and develops fast casual, quick-service, casual dining, and polished casual dining concepts around the world. The Company currently owns 17 restaurant brands: Round Table Pizza, Fatburger, Marble Slab Creamery, Johnny Rockets, Fazoli’s, Twin Peaks, Great American Cookies, Hot Dog on a Stick, Buffalo’s Cafe & Express, Hurricane Grill & Wings, Pretzelmaker, Elevation Burger, Native Grill & Wings, Yalla Mediterranean and Ponderosa and Bonanza Steakhouses, and franchises and owns over 2,300 units worldwide.
About Twin Peaks
Founded in 2005 in the Dallas suburb of Lewisville, Twin Peaks now has nearly 100 locations in the US and Mexico. Twin Peaks is the ultimate sports lodge featuring made-from-scratch food and the coldest beer in the business surrounded by scenic views and the latest in high-definition TVs. At every Twin Peaks, guests are immediately welcomed by a friendly Twin Peaks Girl and served up a menu made for MVPs. From its smashed and seared to order burgers to its in-house smoked brisket, pork and wings, guests can expect menu items capable of satisfying every appetite. To learn more about franchise opportunities, visit twinpeaksfranchise.com. For more information, visit twinpeaksrestaurant.com.
Forward Looking Statements
This press release contains forward-looking statements within the meaning of the Private Securities Litigation Reform Act of 1995, including statements relating to the timing and performance of new store openings and growth in same-store sales. Forward-looking statements reflect expectations of management concerning the future and are subject to significant business, economic and competitive risks, uncertainties and contingencies, including but not limited to uncertainties surrounding the severity, duration and effects of the COVID-19 pandemic. These factors are difficult to predict and beyond our control, and could cause our actual results to differ materially from those expressed or implied in such forward-looking statements. We refer you to the documents that are filed from time to time by FAT Brands Inc. with the Securities and Exchange Commission, such as its reports on Form 10-K, Form 10-Q and Form 8-K, for a discussion of these and other factors. We undertake no obligation to update any forward-looking statement to reflect events or circumstances occurring after the date of this press release.
Global Restaurant FranchisingCompanyBuilds Upon 1,000 Unit Pipeline
LOS ANGELES, Feb. 06, 2023 (GLOBE NEWSWIRE) — FAT (Fresh. Authentic. Tasty.) Brands Inc., a leading global franchising company that owns a number of iconic restaurant brands, including Johnny Rockets, Fatburger, Round Table Pizza, Twin Peaks, Fazoli’s and 12 other concepts, announces it has experienced a historic year of growth, opening 142 new stores in 2022 and adding a total of 362 stores to its development pipeline which spans 29 states and 17 countries.
Leading the way in new store development amongst FAT Brands’ concepts was Fatburger and Buffalo’s Express with 86 stores, Fazoli’s with 61, Round Table Pizza with 56, and Twin Peaks with 50. Noteworthy franchise deals included a combined 80-store development agreement for 40 Fatburger and Buffalo’s Express locations and 40 Round Table Pizza restaurants in the state of Texas, a 32-store agreement for Twin Peaks in Mexico, and a10-store agreement for Johnny Rockets in Israel.
Other strategic deals included 10 Marble Slab Creamery locations in Egypt and a nine-store development deal for Fazoli’s in Phoenix, AZ. The record-breaking development activity by the company will also bring its iconic portfolio to highly anticipated areas, such as Fatburger arriving in Florida, Puerto Rico and Atlanta, GA, Fazoli’s landing in Louisiana and Dallas, TX, and Twin Peaks growing its presence in Chicago, IL.
“We are extremely proud of our organic growth and the performance of our team in 2022,” said Taylor Wiederhorn, Chief Development Officer of FAT Brands. “Franchisee interest was at an all-time high from both new and existing franchisees, which speaks volumes to our robust portfolio of brands that continue to deliver strong same-store sales and attract new fans around the globe. This year, we will remain focused on converting our over 1,000-unit pipeline into new stores, approximately 175 of which are set to open in 2023, along with continuing to fuel our long-term growth with additional development deals.”
FAT Brands (NASDAQ: FAT) is a leading global franchising company that strategically acquires, markets, and develops fast casual, quick-service, casual dining, and polished casual dining concepts around the world. The Company currently owns 17 restaurant brands: Round Table Pizza, Fatburger, Marble Slab Creamery, Johnny Rockets, Fazoli’s, Twin Peaks, Great American Cookies, Hot Dog on a Stick, Buffalo’s Cafe & Express, Hurricane Grill & Wings, Pretzelmaker, Elevation Burger, Native Grill & Wings, Yalla Mediterranean and Ponderosa and Bonanza Steakhouses, and franchises and owns over 2,300 units worldwide.
Forward Looking Statements
This press release contains forward-looking statements within the meaning of the Private Securities Litigation Reform Act of 1995, including statements relating to the timing and performance of new store openings, area development agreements, and growth in same-store sales. Forward-looking statements reflect expectations of FAT Brands Inc. (“we”, “our” or the “Company”) concerning the future and are subject to significant business, economic and competitive risks, uncertainties and contingencies, including but not limited to uncertainties surrounding the severity, duration and effects of the COVID-19 pandemic. These factors are difficult to predict and beyond our control, and could cause our actual results to differ materially from those expressed or implied in such forward-looking statements. We refer you to the documents that we file from time to time with the Securities and Exchange Commission, such as our reports on Form 10-K, Form 10-Q and Form 8-K, for a discussion of these and other factors. We undertake no obligation to update any forward-looking statement to reflect events or circumstances occurring after the date of this press release.
Newegg Commerce, Inc. (NASDAQ: NEGG), founded in 2001 and based in the City of Industry, Calif., near Los Angeles, is a leading global online retailer for PC hardware, consumer electronics, gaming peripherals, home appliances, automotive and lifestyle technology. Newegg also serves businesses’ e-commerce needs with marketing, supply chain and technical solutions in a single platform. For more information, please visit Newegg.com.
Michael Kupinski, Director of Research, Noble Capital Markets, Inc.
Patrick McCann, Research Associate, Noble Capital Markets, Inc.
Refer to the full report for the price target, fundamental analysis, and rating.
Initiating coverage with an Outperform rating. We believe Newegg has a platform that is positioned to benefit from a fast-growing e-commerce vertical, namely, electronics. The company’s platforms serve both B2B and B2C customers on an international scale, reaching more than 20 countries. Moreover, the company has additional growth opportunities through expansion into other e-commerce verticals.
Growing e-commerce market. The global retail e-commerce market is expected to grow at 13.5% CAGR from 2019-2026. Notably, the North American technology e-commerce market, Newegg’s area of focus, is expected to grow even faster, at 25% CAGR over the same period.
Equity Research is available at no cost to Registered users of Channelchek. Not a Member? Click ‘Join’ to join the Channelchek Community. There is no cost to register, and we never collect credit card information.
This Research is provided by Noble Capital Markets, Inc., a FINRA and S.E.C. registered broker-dealer (B/D).
*Analyst certification and important disclosures included in the full report. NOTE: investment decisions should not be based upon the content of this research summary. Proper due diligence is required before making any investment decision.