Joe Gomes, CFA, Managing Director, Equity Research Analyst, Generalist , Noble Capital Markets, Inc.
Joshua Zoepfel, Research Associate, Noble Capital Markets, Inc.
Refer to the full report for the price target, fundamental analysis, and rating.
Another Challenging Quarter. Third quarter revenue decreased 15.3% to $171.8 million from $202.9 million in the prior year. Operating loss was $1.1 million and adjusted operating loss was $0.4 million, down from operating and adjusted operating income of $8.9 million last year. Net loss was $0.9 million, or $0.03/sh, and adjusted net loss totaled $0.4 million, or $0.01/sh, compared to net income of $4.7 million, or $0.14/sh. Adjusted EBITDA was $4.3 million, down 64.8%. Note: results from the sold Cab Structures and Industrial Automation businesses have been reclassified to discontinued operations.
Soft Customer Demand. Continuing from the second quarter, the agricultural and construction end markets have had softer demand, impacting the Electrical Systems segment. The Vehicle Solutions and Aftermarket & Accessories segments also experienced decreased customer demand, alongside a lower margin business phase out and a reduced backlog, respectively.
Equity Research is available at no cost to Registered users of Channelchek. Not a Member? Click ‘Join’ to join the Channelchek Community. There is no cost to register, and we never collect credit card information.
This Company Sponsored Research is provided by Noble Capital Markets, Inc., a FINRA and S.E.C. registered broker-dealer (B/D).
*Analyst certification and important disclosures included in the full report. NOTE: investment decisions should not be based upon the content of this research summary. Proper due diligence is required before making any investment decision.
ACCO Brands Corporation is one of the world’s largest designers, marketers and manufacturers of branded academic, consumer and business products. Our widely recognized brands include AT-A-GLANCE®, Esselte®, Five Star®, GBC®, Kensington®, Leitz®, Mead®, PowerA®, Quartet®, Rapid®, Rexel®, Swingline®, Tilibra®, and many others. Our products are sold in more than 100 countries around the world. More information about ACCO Brands, the Home of Great Brands Built by Great People, can be found at www.accobrands.com.
Joe Gomes, CFA, Managing Director, Equity Research Analyst, Generalist , Noble Capital Markets, Inc.
Joshua Zoepfel, Research Associate, Noble Capital Markets, Inc.
Refer to the full report for the price target, fundamental analysis, and rating.
Green Shoots. In the third quarter, ACCO experienced growth across each of its segments. This was the second consecutive quarter of growth in computer accessories, which can be attributed to an improving demand environment as well as new product launches in gaming accessories. Growth was fueled by the successful rollout of new products as well as international expansion efforts.
Cash Flow. Following the historic pattern, ACCO generated significant cash flow in the quarter. CFFO in the quarter totaled $95.5 million, with CFFO for the nine month period totaling $96 million. On a year-to-date basis, CFFO is up $25 million. Free cash flow for the quarter totaled $89 million and is $87 million year-to-date. Free cash flow is up $26 million from the same period last year, reflecting improved working capital. Management continues to project full year free to be approximately $130 million.
Equity Research is available at no cost to Registered users of Channelchek. Not a Member? Click ‘Join’ to join the Channelchek Community. There is no cost to register, and we never collect credit card information.
This Company Sponsored Research is provided by Noble Capital Markets, Inc., a FINRA and S.E.C. registered broker-dealer (B/D).
*Analyst certification and important disclosures included in the full report. NOTE: investment decisions should not be based upon the content of this research summary. Proper due diligence is required before making any investment decision.
ACCO Brands Corporation is one of the world’s largest designers, marketers and manufacturers of branded academic, consumer and business products. Our widely recognized brands include AT-A-GLANCE®, Esselte®, Five Star®, GBC®, Kensington®, Leitz®, Mead®, PowerA®, Quartet®, Rapid®, Rexel®, Swingline®, Tilibra®, and many others. Our products are sold in more than 100 countries around the world. More information about ACCO Brands, the Home of Great Brands Built by Great People, can be found at www.accobrands.com.
Joe Gomes, CFA, Managing Director, Equity Research Analyst, Generalist , Noble Capital Markets, Inc.
Joshua Zoepfel, Research Associate, Noble Capital Markets, Inc.
Refer to the full report for the price target, fundamental analysis, and rating.
3Q24. ACCO is beginning to see the fruits of its cost reduction and infrastructure initiatives with 3Q24 results in line with expectations and overall sales trends improving in the third quarter compared to the first half of the year. Gross margin expanded by 20 basis points-the seventh consecutive quarter of improvement-and SG&A costs were down 7% y-o-y.
Details. Revenue of $420.9 million was down 6% on a reported basis y-o-y, with comp sales off 5%, reflecting softer back-to-school demand as well as for certain office products, although technology accessories saw growth. We had projected revenue of $418 million. Reported operating income was $26.3 million. Adjusted operating income was $44.7 million, down from $46 million in 3Q23. GAAP net income was $9.3 million, or $0.09/sh, with adjusted net income of $22.5 million, or $0.23/sh. In 3Q23, ACCO reported net income of $14.9 million, or $0.15/sh, and adjusted net income of $23.1 million, or $0.24/sh. We were at $0.15/sh and $0.24/sh, respectively.
Equity Research is available at no cost to Registered users of Channelchek. Not a Member? Click ‘Join’ to join the Channelchek Community. There is no cost to register, and we never collect credit card information.
This Company Sponsored Research is provided by Noble Capital Markets, Inc., a FINRA and S.E.C. registered broker-dealer (B/D).
*Analyst certification and important disclosures included in the full report. NOTE: investment decisions should not be based upon the content of this research summary. Proper due diligence is required before making any investment decision.
For more than 45 years, 1-800-Flowers.com has offered truly original floral arrangements, plants and unique gifts to celebrate birthdays, anniversaries, everyday occasions, and seasonal holidays, and to deliver comfort during times of grief. Backed by a caring team obsessed with service, 1-800-Flowers.com provides customers thoughtful ways to express themselves and connect with the most important people in their lives. 1-800-Flowers.com is part of the 1-800-FLOWERS.COM, Inc. family of brands. Shares in 1-800-FLOWERS.COM, Inc. are traded on the NASDAQ Global Select Market, ticker symbol: FLWS.
Michael Kupinski, Director of Research, Equity Research Analyst, Digital, Media & Technology , Noble Capital Markets, Inc.
Jacob Mutchler, Research Associate, Noble Capital Markets, Inc.
Refer to the full report for the price target, fundamental analysis, and rating.
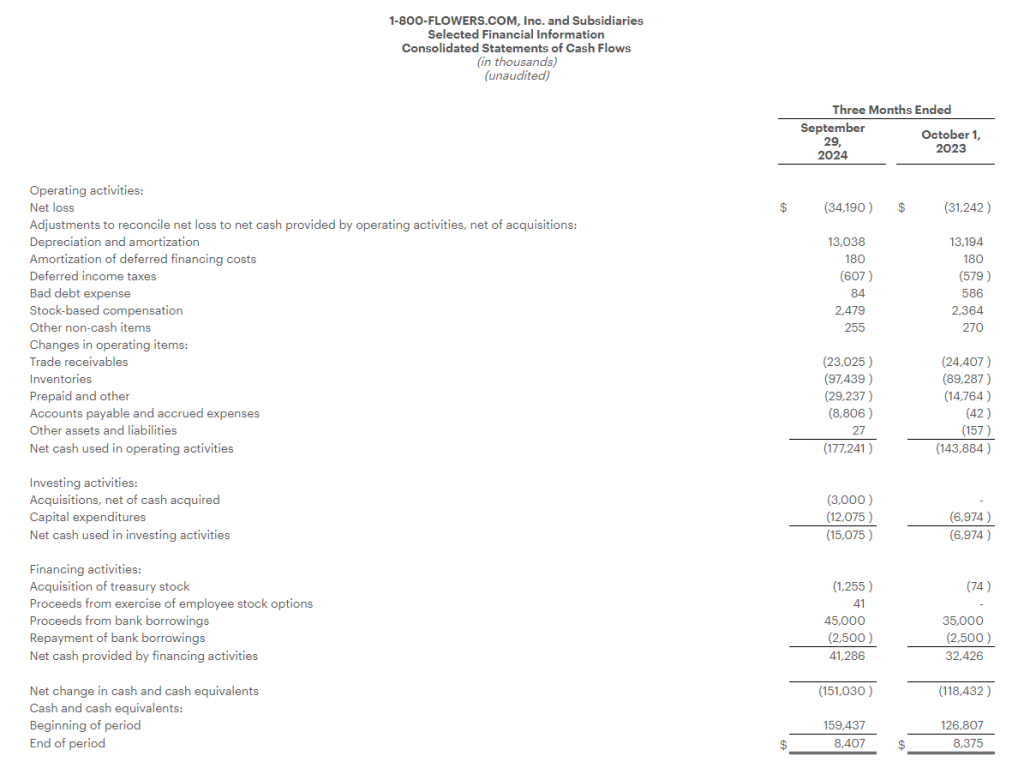
Q1 results. The company reported Q1 revenue of $242.1 million, 3% lower than our estimate of $249.7 million. Adj. EBITDA loss of $27.9 million was below our estimate of negative $23.5 million. The lackluster results were partially attributed to roughly $3 million in wholesale revenue being pushed into Q2. A bright spot in Q1 was the effective management of input costs, which contributed to a gross margin improvement of 20 basis points from the prior year period.
Positioned for revenue growth. In our view, the company is positioned to benefit from several favorable developments, including expanded product offerings, a growing same-day delivery footprint and effective cost management of input prices. We believe that revenue trends should improve in coming quarters as inflation trends moderate and the general economy improves.
Equity Research is available at no cost to Registered users of Channelchek. Not a Member? Click ‘Join’ to join the Channelchek Community. There is no cost to register, and we never collect credit card information.
This Company Sponsored Research is provided by Noble Capital Markets, Inc., a FINRA and S.E.C. registered broker-dealer (B/D).
*Analyst certification and important disclosures included in the full report. NOTE: investment decisions should not be based upon the content of this research summary. Proper due diligence is required before making any investment decision.
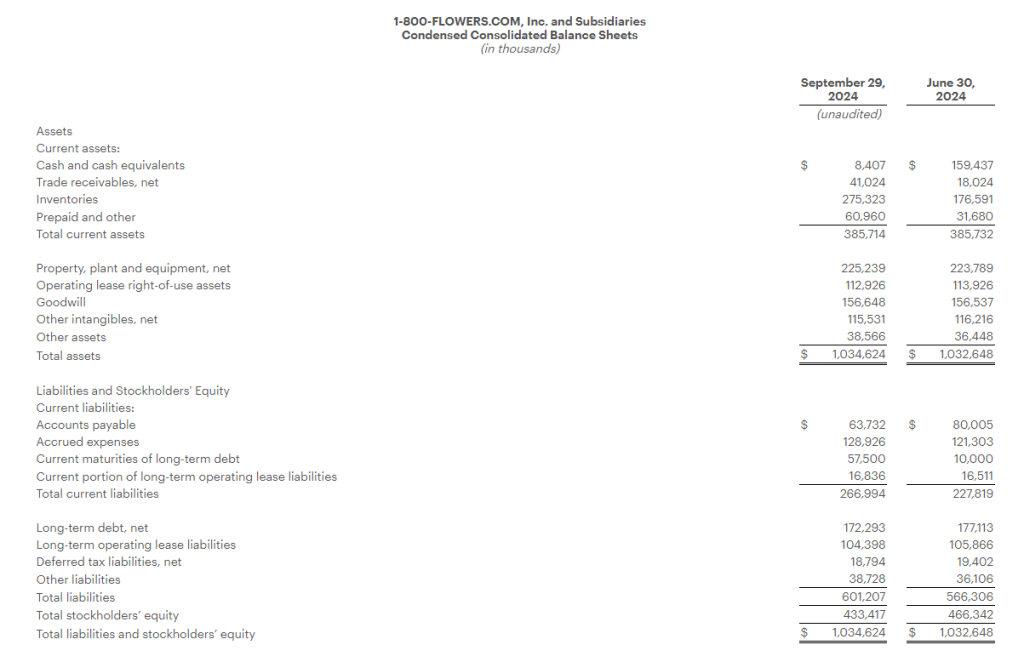
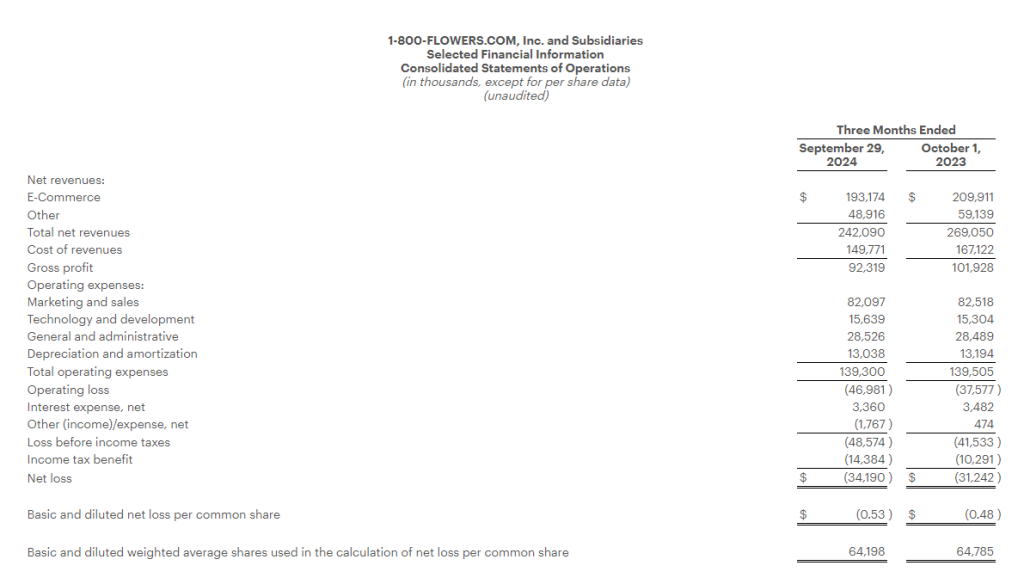
Generates Revenues of $242.1 million and a Net Loss of $34.2 million
Gross Profit Margin Increases 20 basis points to 38.1%
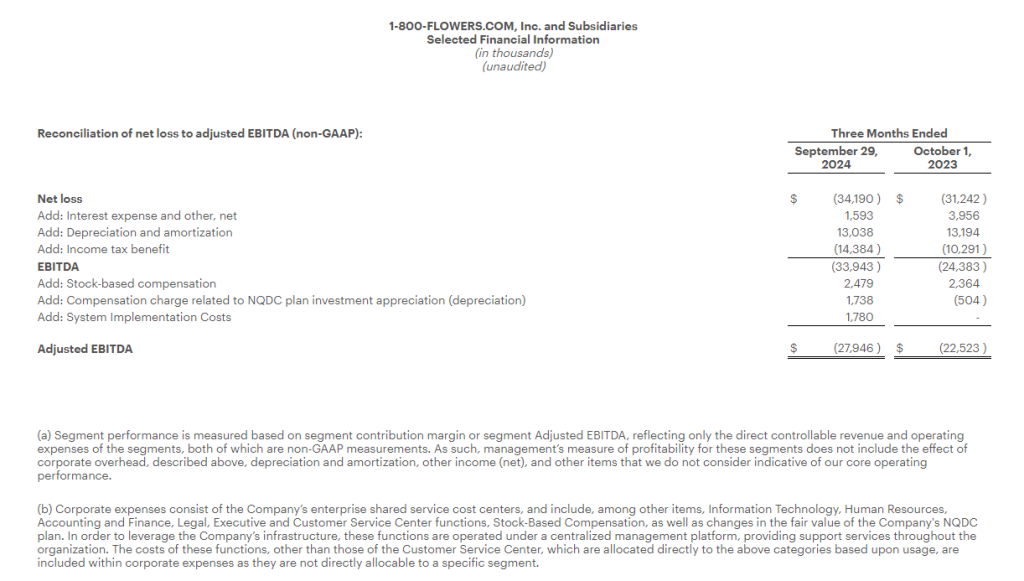
Reports Adjusted EBITDA(1) Loss of $27.9 million
(1) Refer to “Definitions of Non-GAAP Financial Measures” and the tables attached at the end of this press release for reconciliation of non-GAAP results to applicable GAAP results.)
JERICHO, N.Y.–(BUSINESS WIRE)– 1-800-FLOWERS.COM, Inc. (NASDAQ: FLWS), a leading provider of gifts designed to help inspire customers to give more, connect more, and build more and better relationships, today reported results for its Fiscal 2025 first quarter ended September 29, 2024.
“Our first quarter performance generally came in-line with our expectations, as we began to see a slight improvement in our e-commerce revenue trends during the quarter, our gross profit margin continued to grow, and we reduced expenses as a result of our Work Smarter initiatives to operate more efficiently,” said Jim McCann, Chairman and Chief Executive Officer of 1-800-FLOWERS.COM, Inc. “We expect the improvement in our e-commerce revenue trends to accelerate as we move closer to the holiday selling season, and our revenues will further benefit from the growth of wholesale orders this year. Through the Relationship Innovation initiatives that we implemented over the last two years, we have expanded our offerings and broadened our price points, providing gift givers with more choices at prices that span from budget-friendly to premium. We look forward to helping our customers connect and express their sentiments with the important people in their lives.”
Fiscal 2025 First Quarter Highlights
Total consolidated revenues decreased 10.0% to $242.1 million, as compared with the prior year period.
E-commerce revenues decreased 8.0% over the prior year period, comprised of a 6.5% decline in orders and a 1.5% decline in Average Order Value (AOV).
Gross profit margin increased 20 basis points to 38.1%, as compared with the prior year period.
Operating expenses declined $0.2 million to $139.3 million, as compared with the prior year period. Excluding the impact of non-recurring charges in the current period associated with new systems implementation costs, as well as the impact of the Company’s non-qualified deferred compensation plan in both periods, operating expenses declined by $4.2 million to $135.8 million, as compared with the prior year period.
Net loss for the quarter was $34.2 million, or ($0.53) per share, as compared to a net loss of $31.2 million, or ($0.48) per share in the prior year period.
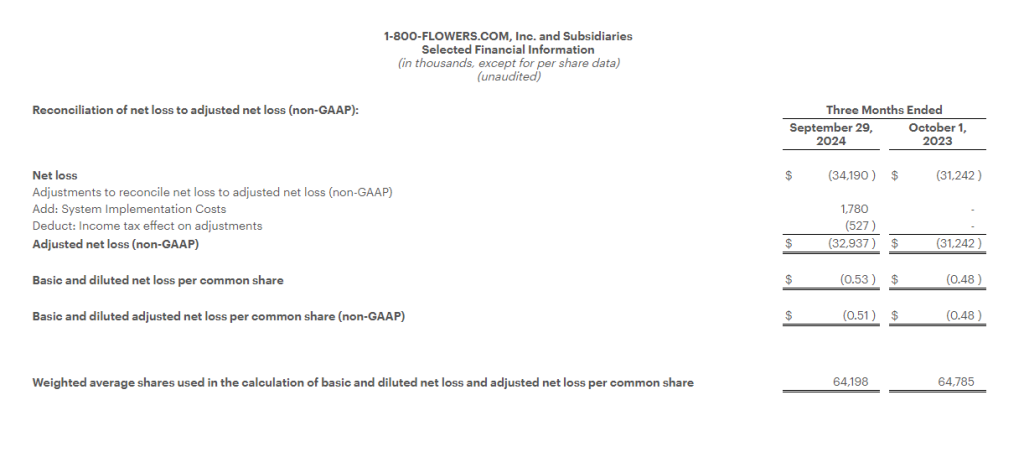
Adjusted Net Loss1 was $32.9 million, or ($0.51) per share, compared with an Adjusted Net Loss1 of $31.2 million, or ($0.48) per share, in the prior year period.
Adjusted EBITDA1 loss for the quarter was $27.9 million, as compared with an Adjusted EBITDA1 loss of $22.5 million in the prior year period.
1-800-FLOWERS.COM, Inc. was named one of Newsweek’s Most Admired Workplaces for 2025.
Segment Results
The Company provides Fiscal 2025 first quarter financial results for its Gourmet Foods and Gift Baskets, Consumer Floral and Gifts, and BloomNet® segments in the tables attached to this release and as follows:
Gourmet Foods and Gift Baskets: Revenues for the quarter declined 14.4% to $84.0 million as compared with the prior year period. This decline reflects the timing of approximately $3.0 million of wholesale orders that shifted from the first quarter into the second quarter. Gross profit margin increased 50 basis points to 32.0%, benefiting from the Company’s inventory optimization efforts and a decline in certain commodity costs. Excluding the impact of the systems implementation costs, adjusted segment contribution margin1 loss was $11.3 million, compared with a loss of $11.0 million in the prior year period.
Consumer Floral & Gifts: Revenues for the quarter declined 4.9% to $135.2 million as compared with the prior year period. Gross profit margin increased 30 basis points to 39.9%. Segment contribution margin1 was $4.9 million, compared with $8.8 million in the prior year period.
BloomNet: Revenues for the quarter declined 20.1% to $23.1 million as compared with the prior year period. Revenue and gross margin were impacted by the lower volume of lower margin orders processed by BloomNet. Gross profit margin decreased 20 basis points to 50.0% due to deleveraging on the lower sales volume. Segment contribution margin1 was $6.8 million, compared with $9.4 million in the prior year period.
Company Guidance
For Fiscal 2025, the Company continues to expect its revenue trend to improve as the fiscal year progresses benefiting from the Company’s Relationship Innovation initiatives that have expanded the Company’s product offerings, broadened price points, and enhanced the user experience, combined with increased marketing spend. The Adjusted EBITDA range reflects the acknowledgement that the consumer environment remains uncertain.
As a result, for Fiscal 2025 the Company continues to expect:
total revenues on a percentage basis to be in a range of flat to a decrease in the low-single digits, as compared with the prior year;
Adjusted EBITDA1 to be in a range of $85 million to $95 million; and
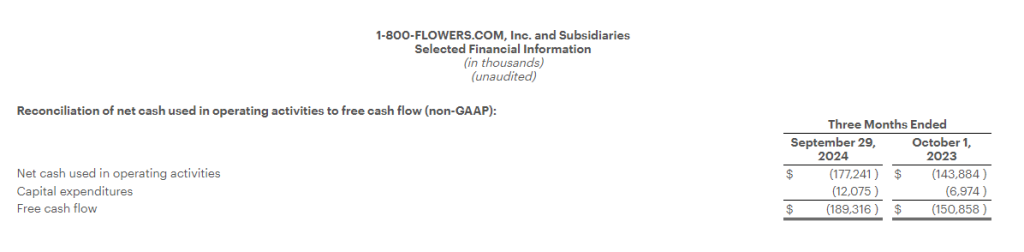
Free Cash Flow1 to be in a range of $45 million to $55 million.
Conference Call
The Company will conduct a conference call to discuss the above details and attached financial results today, October 31, 2024, at 8:00 a.m. (ET). The conference call will be webcast from the Investors section of the Company’s website at www.1800flowersinc.com. A recording of the call will be posted on the Investors section of the Company’s website within two hours of the call’s completion. A telephonic replay of the call can be accessed beginning at 2:00 p.m. (ET) today through November 7, 2024, at: (US) 1-877-344-7529; (Canada) 855-669-9658; (International) 1-412-317-0088; enter conference ID #: 1727189.
Definitions of non-GAAP Financial Measures:
We sometimes use financial measures derived from consolidated financial information, but not presented in our financial statements prepared in accordance with U.S. generally accepted accounting principles (“GAAP”). Certain of these are considered “non-GAAP financial measures” under the U.S. Securities and Exchange Commission rules. Non-GAAP financial measures referred to in this document are either labeled as “non-GAAP” or designated as such with a “1”. See below for definitions and the reasons why we use these non-GAAP financial measures. Where applicable, see the Selected Financial Information below for reconciliations of these non-GAAP measures to their most directly comparable GAAP financial measures. Reconciliations for forward-looking figures would require unreasonable efforts at this time because of the uncertainty and variability of the nature and amount of certain components of various necessary GAAP components, including, for example, those related to compensation, tax items, amortization or others that may arise during the year, and the Company’s management believes such reconciliations would imply a degree of precision that would be confusing or misleading to investors. For the same reasons, the Company is unable to address the probable significance of the unavailable information. The lack of such reconciling information should be considered when assessing the impact of such disclosures.
EBITDA and Adjusted EBITDA:
We define EBITDA as net income (loss) before interest, taxes, depreciation, and amortization. Adjusted EBITDA is defined as EBITDA adjusted for the impact of stock-based compensation, Non-Qualified Plan Investment appreciation/depreciation, and for certain items affecting period-to-period comparability. See Selected Financial Information for details on how EBITDA and Adjusted EBITDA were calculated for each period presented. The Company presents EBITDA and Adjusted EBITDA because it considers such information meaningful supplemental measures of its performance and believes such information is frequently used by the investment community in the evaluation of similarly situated companies. The Company uses EBITDA and Adjusted EBITDA as factors to determine the total amount of incentive compensation available to be awarded to executive officers and other employees. The Company’s credit agreement uses EBITDA and Adjusted EBITDA to determine its interest rate and to measure compliance with certain covenants. EBITDA and Adjusted EBITDA are also used by the Company to evaluate and price potential acquisition candidates. EBITDA and Adjusted EBITDA have limitations as analytical tools and should not be considered in isolation or as a substitute for analysis of the Company’s results as reported under GAAP. Some of the limitations are: (a) EBITDA and Adjusted EBITDA do not reflect changes in, or cash requirements for, the Company’s working capital needs; (b) EBITDA and Adjusted EBITDA do not reflect the significant interest expense, or the cash requirements necessary to service interest or principal payments, on the Company’s debts; and (c) although depreciation and amortization are non-cash charges, the assets being depreciated and amortized may have to be replaced in the future and EBITDA does not reflect any cash requirements for such capital expenditures. EBITDA and Adjusted EBITDA should only be used on a supplemental basis combined with GAAP results when evaluating the Company’s performance.
Segment Contribution Margin and Adjusted Segment Contribution Margin
We define Segment Contribution Margin as earnings before interest, taxes, depreciation, and amortization, before the allocation of corporate overhead expenses. Adjusted Segment Contribution Margin is defined as Segment Contribution Margin adjusted for certain items affecting period-to-period comparability. See Selected Financial Information for details on how Segment Contribution Margin and Adjusted Segment Contribution Margin were calculated for each period presented. When viewed together with our GAAP results, we believe Segment Contribution Margin and Adjusted Segment Contribution Margin provide management and users of the financial statements meaningful information about the performance of our business segments. Segment Contribution Margin and Adjusted Segment Contribution Margin are used in addition to and in conjunction with results presented in accordance with GAAP and should not be relied upon to the exclusion of GAAP financial measures. The material limitation associated with the use of Segment Contribution Margin and Adjusted Segment Contribution Margin is that they are an incomplete measure of profitability as they do not include all operating expenses or non-operating income and expenses. Management compensates for this limitation when using these measures by looking at other GAAP measures, such as Operating Income and Net Income.
Adjusted Net Income (Loss) and Adjusted or Comparable Net Income (Loss) Per Common Share:
We define Adjusted Net Income (Loss) and Adjusted or Comparable Net Income (Loss) Per Common Share as Net Income (Loss) and Net Income (Loss) Per Common Share adjusted for certain items affecting period-to-period comparability. See Selected Financial Information below for details on how Adjusted Net Income (Loss) Per Common Share and Adjusted or Comparable Net Income (Loss) Per Common Share were calculated for each period presented. We believe that Adjusted Net Income (Loss) and Adjusted or Comparable Net Income (Loss) Per Common Share are meaningful measures because they increase the comparability of period-to-period results. Since these are not measures of performance calculated in accordance with GAAP, they should not be considered in isolation of, or as a substitute for, GAAP Net Income (Loss) and Net Income (Loss) Per Common Share, as indicators of operating performance and they may not be comparable to similarly titled measures employed by other companies.
Free Cash Flow:
We define Free Cash Flow as net cash provided by operating activities less capital expenditures. The Company considers Free Cash Flow to be a liquidity measure that provides useful information to management and investors about the amount of cash generated by the business after the purchases of fixed assets, which can then be used to, among other things, invest in the Company’s business, make strategic acquisitions, strengthen the balance sheet, and repurchase stock or retire debt. Free Cash Flow is a liquidity measure that is frequently used by the investment community in the evaluation of similarly situated companies. Since Free Cash Flow is not a measure of performance calculated in accordance with GAAP, it should not be considered in isolation or as a substitute for analysis of the Company’s results as reported under GAAP. A limitation of the utility of Free Cash Flow as a measure of financial performance is that it does not represent the total increase or decrease in the Company’s cash balance for the period.
About 1-800-FLOWERS.COM, Inc.
1-800-FLOWERS.COM, Inc. is a leading provider of gifts designed to help inspire customers to give more, connect more, and build more and better relationships. The Company’s e-commerce business platform features an all-star family of brands, including: 1-800-Flowers.com®, 1-800-Baskets.com®, Cheryl’s Cookies®, Harry & David®, PersonalizationMall.com®, Shari’s Berries®, FruitBouquets.com®, Things Remembered®, Moose Munch®, The Popcorn Factory®, Wolferman’s Bakery®, Vital Choice®, Simply Chocolate® and Scharffen Berger®. Through the Celebrations Passport® loyalty program, which provides members with free standard shipping and no service charge on eligible products across our portfolio of brands, 1-800-FLOWERS.COM, Inc. strives to deepen relationships with customers. The Company also operates BloomNet®, an international floral and gift industry service provider offering a broad-range of products and services designed to help members grow their businesses profitably; Napco℠, a resource for floral gifts and seasonal décor; DesignPac Gifts, LLC, a manufacturer of gift baskets and towers; Alice’s Table®, a lifestyle business offering fully digital livestreaming and on demand floral, culinary and other experiences to guests across the country; and Card Isle®, an e-commerce greeting card service. 1-800-FLOWERS.COM, Inc. was recognized among America’s Most Trustworthy Companies by Newsweek. 1-800-FLOWERS.COM, Inc. was also recognized as one of America’s Most Admired Workplaces for 2025 by Newsweek and was named to the Fortune 1000 list in 2022. Shares in 1-800-FLOWERS.COM, Inc. are traded on the NASDAQ Global Select Market, ticker symbol: FLWS. For more information, visit 1800flowersinc.com.
FLWS–COMP FLWS-FN
Special Note Regarding Forward Looking Statements:
This press release contains forward-looking statements within the meaning of the Private Securities Litigation Reform Act of 1995. These forward-looking statements represent the Company’s current expectations or beliefs concerning future events and can generally be identified using statements that include words such as “estimate,” “expects,” “project,” “believe,” “anticipate,” “intend,” “plan,” “foresee,” “forecast,” “likely,” “should,” “will,” “target” or similar words or phrases. These forward-looking statements are subject to risks, uncertainties, and other factors, many of which are outside of the Company’s control, which could cause actual results to differ materially from the results expressed or implied in the forward-looking statements, including, but not limited to, statements regarding the Company’s ability to achieve its guidance for the full Fiscal year; the Company’s ability to leverage its operating platform and reduce its operating expense ratio; its ability to successfully integrate acquired businesses and assets; its ability to successfully execute its strategic initiatives; its ability to cost effectively acquire and retain customers; the outcome of contingencies, including legal proceedings in the normal course of business; its ability to compete against existing and new competitors; its ability to manage expenses associated with sales and marketing and necessary general and administrative and technology investments; its ability to reduce promotional activities and achieve more efficient marketing programs; and general consumer sentiment and industry and economic conditions that may affect levels of discretionary customer purchases of the Company’s products. The Company undertakes no obligation to publicly update any of the forward-looking statements, whether because of new information, future events or otherwise, made in this release or in any of its SEC filings. Consequently, you should not consider any such list to be a complete set of all potential risks and uncertainties. For a more detailed description of these and other risk factors, refer to the Company’s SEC filings, including the Company’s Annual Reports on Form 10-K and its Quarterly Reports on Form 10-Q.
Note: The following tables are an integral part of this press release without which the information presented in this press release should be considered incomplete.
FAT Brands (NASDAQ: FAT) is a leading global franchising company that strategically acquires, markets, and develops fast casual, quick-service, casual dining, and polished casual dining concepts around the world. The Company currently owns 17 restaurant brands: Round Table Pizza, Fatburger, Marble Slab Creamery, Johnny Rockets, Fazoli’s, Twin Peaks, Great American Cookies, Hot Dog on a Stick, Buffalo’s Cafe & Express, Hurricane Grill & Wings, Pretzelmaker, Elevation Burger, Native Grill & Wings, Yalla Mediterranean and Ponderosa and Bonanza Steakhouses, and franchises and owns over 2,300 units worldwide. For more information on FAT Brands, please visit www.fatbrands.com.
Joe Gomes, CFA, Managing Director, Equity Research Analyst, Generalist , Noble Capital Markets, Inc.
Joshua Zoepfel, Research Associate, Noble Capital Markets, Inc.
Refer to the full report for the price target, fundamental analysis, and rating.
Overview. FAT Brands 3Q24 results were below our expectations, mostly due to underperformance at the Smokey Bones brand. Development deals continued strongly, although new store openings are below plan as franchisees have taken a more conservative stance on new openings. Management continues to move forward with value creation efforts, specifically with Twin Peaks, and is hopeful of announcing additional developments in the coming weeks.
3Q24 Results. Revenue of $143.3 million was up 31.1% y-o-y but was down from $152 million reported in 2Q24. We had estimated $159.9 million. Adjusted EBITDA totaled $14.1 million, down from $21.9 million in 3Q23 and $15.7 million in 2Q24. FAT Brands reported a net loss of $44.8 million, or $2.74/sh, compared to a net loss of $24.7 million, or $1.59/sh, last year. We had forecasted a net loss of $32 million, or $1.88/sh.
Equity Research is available at no cost to Registered users of Channelchek. Not a Member? Click ‘Join’ to join the Channelchek Community. There is no cost to register, and we never collect credit card information.
This Company Sponsored Research is provided by Noble Capital Markets, Inc., a FINRA and S.E.C. registered broker-dealer (B/D).
*Analyst certification and important disclosures included in the full report. NOTE: investment decisions should not be based upon the content of this research summary. Proper due diligence is required before making any investment decision.
Office Depot, Inc., together with its subsidiaries, supplies a range of office products and services. It offers merchandise, such as general office supplies, computer supplies, business machines and related supplies, and office furniture through its chain of office supply stores under the Office Depot, Foray, Ativa, Break Escapes, Worklife, and Christopher Lowell brand names. The company also provides graphic design, printing, reproduction, mailing, shipping, and other services through design, print, and ship centers. It has operations throughout North America, Europe, Asia, and Central America. The company also sells its products and services through direct mail catalogs, contract sales force, Internet sites, and retail stores, through a mix of company-owned operations, joint ventures, licensing and franchise agreements, alliances, and other arrangements. As of December 31, 2008, Office Depot operated 1,267 North American retail division office supply stores and 162 international division retail stores, as well as participated under licensing and merchandise arrangements in 98 stores. The company was founded in 1986 and is based in Boca Raton, Florida.
Joe Gomes, CFA, Managing Director, Equity Research Analyst, Generalist , Noble Capital Markets, Inc.
Jacob Mutchler, Research Associate, Noble Capital Markets, Inc.
Refer to the full report for the price target, fundamental analysis, and rating.
A Sale. The ODP Corporation reported that on October 18, 2024, the Company sold its Varis Division to an affiliate of Arising Ventures. The Company did not release the terms of the agreement. We expect to see additional detail on the Company’s third quarter earnings call.
Details. ODP is retaining a minority interest of 19.9% after the sale. Under the terms of the agreement, the Company will fund up to $4 million of expenses that Varis may incur following the transaction date until December 31, 2025, and has no further obligations to contribute capital to Varis. The terms of the sale did not result in a materially different impact on the Company’s financial statements than previously estimated.
Equity Research is available at no cost to Registered users of Channelchek. Not a Member? Click ‘Join’ to join the Channelchek Community. There is no cost to register, and we never collect credit card information.
This Company Sponsored Research is provided by Noble Capital Markets, Inc., a FINRA and S.E.C. registered broker-dealer (B/D).
*Analyst certification and important disclosures included in the full report. NOTE: investment decisions should not be based upon the content of this research summary. Proper due diligence is required before making any investment decision.
SKYX will Offer a Variety of its Advanced and Smart Plug & Play Lighting and Ceiling Fan Products, Plug & Play Retrofit Kits and Recessed Lights, Ceiling Outlet Receptacles, and More
MIAMI, Oct. 16, 2024 (GLOBE NEWSWIRE) — SKYX Platforms Corp. (NASDAQ: SKYX) (d/b/a “SKYX Technologies”), a highly disruptive smart platform technology company with over 97 issued and pending patents in the U.S. and globally, with a mission to make homes and buildings become smart, safe, and advanced as the new standard, announced today a collaboration with world leading home décor website, Wayfair, for its advanced and smart plug & play products.
SKYX will offer a large variety of its advanced and smart plug & play products including retrofit kits, plug & play smart light fixtures, ceiling fans, recessed lights, and ceiling outlet receptacles, SKYX’s advanced and smart products are expected to be offered on Wayfair’s website in the coming weeks.
Steve Schmidt, President of SKYX, said: “We are truly excited to collaborate with the world leading home décor e-commerce company, Wayfair. I view this collaboration as a great growth opportunity for us and Wayfair, as our technology offers a variety of game changing products for both retail and professional segments that is a growing category for Wayfair.”
Rani Kohen, Founder and Executive Chairman of SKYX, said: “We are thrilled to work together with Wayfair, a world leading home décor company. This is a significant opportunity to enhance our market penetration to both retail and professional channels, including architects, designers, and home decorators.”
Video Link to SKYX’s three generations of products Click Here
As electricity is a standard in every home and building, our mission is to make homes and buildings become safe-advanced and smart as the new standard. SKYX has a series of highly disruptive advanced-safe-smart platform technologies, with over 97 U.S. and global patents and patent pending applications. Our technologies place an emphasis on high quality and ease of use, while significantly enhancing both safety and lifestyle in homes and buildings. We believe that our products are a necessity in every room in both homes and other buildings in the U.S. and globally. For more information, please visit our website at https://skyplug.com/ or follow us on LinkedIn.
Forward-Looking Statements
Certain statements made in this press release are not based on historical facts, but are forward-looking statements. These statements can be identified by the use of forward-looking terminology such as “aim,” “anticipate,” “believe,” “can,” “could,” “continue,” “estimate,” “expect,” “evaluate,” “forecast,” “guidance,” “intend,” “likely,” “may,” “might,” “objective,” “ongoing,” “outlook,” “plan,” “potential,” “predict,” “probable,” “project,” “seek,” “should,” “target” “view,” “will,” or “would,” or the negative thereof or other variations thereon or comparable terminology, although not all forward-looking statements contain these words. These statements reflect the Company’s reasonable judgment with respect to future events and are subject to risks, uncertainties and other factors, many of which have outcomes difficult to predict and may be outside our control, that could cause actual results or outcomes to differ materially from those in the forward-looking statements. Such risks and uncertainties include statements relating to the Company’s ability to successfully launch, commercialize, develop additional features and achieve market acceptance of its products and technologies and integrate its products and technologies with third-party platforms or technologies; the Company’s efforts and ability to drive the adoption of its products and technologies as a standard feature, including their use in homes, hotels, offices and cruise ships; the Company’s ability to capture market share; the Company’s estimates of its potential addressable market and demand for its products and technologies; the Company’s ability to raise additional capital to support its operations as needed, which may not be available on acceptable terms or at all; the Company’s ability to continue as a going concern; the Company’s ability to execute on any sales and licensing or other strategic opportunities; the possibility that any of the Company’s products will become National Electrical Code (NEC)-code or otherwise code mandatory in any jurisdiction, or that any of the Company’s current or future products or technologies will be adopted by any state, country, or municipality, within any specific timeframe or at all; risks arising from mergers, acquisitions, joint ventures and other collaborations; the Company’s ability to attract and retain key executives and qualified personnel; guidance provided by management, which may differ from the Company’s actual operating results; the potential impact of unstable market and economic conditions on the Company’s business, financial condition, and stock price; and other risks and uncertainties described in the Company’s filings with the Securities and Exchange Commission, including its periodic reports on Form 10-K and Form 10-Q. There can be no assurance as to any of the foregoing matters. Any forward-looking statement speaks only as of the date of this press release, and the Company undertakes no obligation to update or revise any forward-looking statements, whether as a result of new information, future events or otherwise, except as required by U.S. federal securities laws.
Reports Fiscal Year 2024 Revenue of $1.83 Billion and a Net Loss of $6.1 Million, which Includes a Non-Cash Impairment Charge of $19.8 million Recorded in the Second Quarter
Fiscal Year 2024 Gross Profit Margin Increased 260 Basis Points to 40.1%
Fiscal Year 2024 Adjusted EBITDA1 Increased to $93.1 million
Issues Fiscal Year 2025 Outlook
(1) Refer to “Definitions of Non-GAAP Financial Measures” and the tables attached at the end of this press release for reconciliation of non-GAAP results to applicable GAAP results.)
JERICHO, N.Y.–(BUSINESS WIRE)– 1-800-FLOWERS.COM, Inc. (NASDAQ: FLWS), a leading provider of gifts designed to help inspire customers to give more, connect more, and build more and better relationships, today reported results for its Fiscal 2024 fourth quarter and year ended June 30, 2024.
“In a dynamic consumer environment that impacted discretionary consumer spending, especially amongst lower income households, our organization was able to grow year-over-year adjusted EBITDA, which benefitted from our significant gross margin recovery and our expense optimization efforts that more than offset the top line decline,” said Jim McCann, Chairman and Chief Executive Officer of 1-800-FLOWERS.COM, Inc. “During Fiscal 2024, through our Relationship Innovation initiatives, we significantly enhanced our gifting platform, including category expansion, broadening our price points, increasing our assortment of gifts available for same-day delivery, and enhancing the user experience. We also experienced a significant recovery in our gross profit margin, which benefitted from a reversion to the mean on a number of commodity costs combined with our Work Smarter initiatives to operate more efficiently.”
“As we turn to Fiscal 2025, with our gross margin recovery well underway, our organization continues to be keenly focused on improving our sales trends by leveraging our Relationship Innovation initiatives. Acknowledging the uncertain consumer environment, we anticipate revenue trends improving as the fiscal year progresses as consumers respond to our newer offerings and services. We are confident in our strategic direction to be the gifting destination of choice for thoughtful and expressive gift-giving occasions and remain focused on delivering long-term value to our shareholders,” Mr. McCann continued.
Fiscal 2024 Fourth Quarter Highlights
Total consolidated revenues decreased 9.5% to $360.9 million, compared with total consolidated revenues of $398.8 million in the prior year period.
Gross profit margin increased 130 basis points to 38.4%, compared with 37.1% in the prior year period. The gross profit margin improved on lower freight costs, a decline in certain commodity costs, and the Company’s logistics optimization efforts.
Operating expenses declined $5.8 million to $166.2 million, as compared with the prior year period.
Net loss for the quarter was $20.9 million, or ($0.32) per share, as compared to a net loss of $22.5 million, or ($0.35) per share in the prior year period.
Adjusted Net Loss1 was $21.8 million, or ($0.34) per share, compared with an Adjusted Net Loss1 of $17.8 million, or ($0.28) per share, in the prior year period.
Adjusted EBITDA1 loss for the quarter was $8.8 million, as compared with an Adjusted EBITDA1 loss of $6.6 million in the prior year period.
Acquired Scharffen Berger Chocolate Maker, a high-end producer of extraordinary craft chocolates, that enhances and expands the Company’s chocolate offerings within its gourmet food and gift basket business. The acquisition closed after the fourth quarter ended.
Fiscal Year 2024 Highlights
Total consolidated revenues decreased 9.2% to $1.83 billion, compared with total consolidated revenues of $2.02 billion in the prior year period.
Gross profit margin increased 260 basis points to 40.1%, compared with 37.5% in the prior year period. The gross profit margin improved on lower freight costs, improved commodity costs, and the Company’s logistics optimization efforts.
Operating expenses declined $55.7 million to $736.8 million, as compared with the prior year period. Excluding impairment and other non-recurring charges in both periods, as well as the impact of the Company’s non-qualified deferred compensation plan in both periods, operating expenses declined by $22.2 million to $706.1 million, as compared with the prior year.
Net loss for the fiscal year was $6.1 million, or ($0.09) per share, compared with $44.7 million, or ($0.69) per share, in the prior year period. Both periods include impairment charges as outlined in the financial tables.
Adjusted Net Income1 was $11.6 million, or $0.18 per share, compared with Adjusted Net Income1 of $13.4 million, or $0.21 per share, in the prior year period.
Adjusted EBITDA1 for the fiscal year was $93.1 million, as compared with $91.2 million in the prior year period.
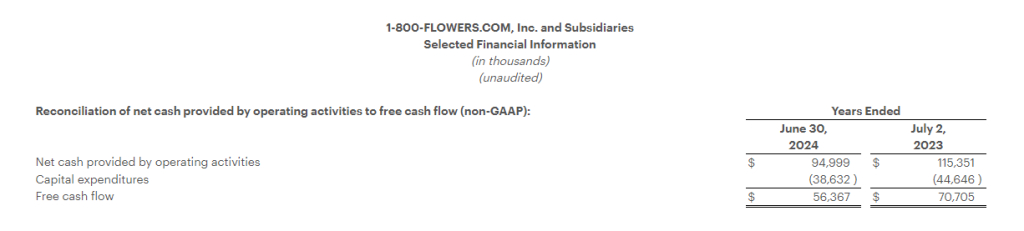
Net cash provided by operating activities was $95.0 million.
Generated Free Cash Flow1 of $56.4 million.
Segment Results
The Company provides Fiscal 2024 fourth quarter and full year selected financial results for its Gourmet Foods and Gift Baskets, Consumer Floral and Gifts, and BloomNet segments in the tables attached to this release and as follows:
Gourmet Foods and Gift Baskets: Revenues for the quarter declined 12.8% to $105.2 million, as compared with the prior year period. Gross profit margin increased 190 basis points from the prior year period to 30.0%, benefiting from lower freight costs, the Company’s inventory and labor optimization efforts, as well as a decline in certain commodity costs. Segment contribution margin1 loss was $14.4 million, compared with a loss of $13.4 million in the prior year period.
For the full fiscal year, revenue decreased 9.4% to $874.3 million. Gross profit margin increased 340 basis points to 38.3%, benefiting from lower freight costs, the Company’s inventory and labor optimization efforts, as well as a decline in certain commodity costs. Excluding the impact of the severance charge in the current year and the impairment charge a year ago, segment contribution margin1 for the year was $85.0 million, compared with $77.5 million in the prior year.
Consumer Floral & Gifts: Revenues for the quarter declined 6.7% to $231.6 million, as compared with the prior year period. Gross profit margin increased 20 basis points from the prior year period to 40.8%. Segment contribution margin1 was $25.7 million, compared with $30.7 million in the prior year period.
For the full fiscal year, revenues decreased 7.7% to $849.8 million, as compared with the prior year period. Gross profit margin increased 130 basis points from the prior year period to 40.8%, improving on lower fulfillment costs and the Company’s logistics optimization efforts. Excluding the impact of the severance and impairment charges in the current year, segment contribution margin1 was $87.7 million, compared with $95.5 million in the prior year.
BloomNet: Revenues for the quarter declined 18.7% to $24.4 million, as compared with the prior year period. Revenue and gross margin were impacted by the lower volume of lower margin orders processed by BloomNet. Gross profit margin increased 710 basis points from the prior year period to 49.7%, also benefitting from lower ocean freight costs as well as product mix. Segment contribution margin1 was $7.8 million, compared with $7.4 million in the prior year period.
For the year, revenues decreased 19.1% to $107.8 million, as compared with the prior year period. Gross profit margin increased 550 basis points from the prior year period to 48.2% due to lower volume of lower margin orders, lower ocean freight costs, as well as product mix. Excluding the impact of the severance charge in the current year, segment contribution margin1 for the year was $33.8 million, compared with $37.2 million in the prior year.
Company Guidance
For Fiscal 2025, with a sustained challenging consumer environment, the Company expects revenue trends to improve as the fiscal year progresses benefitting from the company’s Relationship Innovation initiatives that have expanded the Company’s product offerings, broadened price points, and enhanced the user experience, combined with increased marketing spend. Additionally, the guidance assumes increased incentive compensation expense.
As a result, for Fiscal Year 2025 the Company expects:
total revenues on a percentage basis to be in a range of flat to a decrease in the low-single digits, as compared with the prior year;
Adjusted EBITDA1 to be in a range of $85 million to $95 million; and
Free Cash Flow1 to be in a range of $45 million to $55 million.
Conference Call
The Company will conduct a conference call to discuss the above details and attached financial results today, August 29, 2024, at 8:00 a.m. (ET). The conference call will be webcast from the Investors section of the Company’s website at www.1800flowersinc.com. A recording of the call will be posted on the Investors section of the Company’s website within two hours of the call’s completion. A telephonic replay of the call can be accessed beginning at 2:00 p.m. (ET) today through September 5, 2024, at: (US) 1-877-344-7529; (Canada) 855-669-9658; (International) 1-412-317-0088; enter conference ID #: 5141252.
Definitions of non-GAAP Financial Measures:
We sometimes use financial measures derived from consolidated financial information, but not presented in our financial statements prepared in accordance with U.S. generally accepted accounting principles (“GAAP”). Certain of these are considered “non-GAAP financial measures” under the U.S. Securities and Exchange Commission rules. Non-GAAP financial measures referred to in this document are either labeled as “non-GAAP” or designated as such with a “1”. See below for definitions and the reasons why we use these non-GAAP financial measures. Where applicable, see the Selected Financial Information below for reconciliations of these non-GAAP measures to their most directly comparable GAAP financial measures. Reconciliations for forward-looking figures would require unreasonable efforts at this time because of the uncertainty and variability of the nature and amount of certain components of various necessary GAAP components, including, for example, those related to compensation, tax items, amortization or others that may arise during the year, and the Company’s management believes such reconciliations would imply a degree of precision that would be confusing or misleading to investors. For the same reasons, the Company is unable to address the probable significance of the unavailable information. The lack of such reconciling information should be considered when assessing the impact of such disclosures.
EBITDA and Adjusted EBITDA:
We define EBITDA as net income (loss) before interest, taxes, depreciation, and amortization. Adjusted EBITDA is defined as EBITDA adjusted for the impact of stock-based compensation, Non-Qualified Plan Investment appreciation/depreciation, and for certain items affecting period-to-period comparability. See Selected Financial Information for details on how EBITDA and Adjusted EBITDA were calculated for each period presented. The Company presents EBITDA and Adjusted EBITDA because it considers such information meaningful supplemental measures of its performance and believes such information is frequently used by the investment community in the evaluation of similarly situated companies. The Company uses EBITDA and Adjusted EBITDA as factors to determine the total amount of incentive compensation available to be awarded to executive officers and other employees. The Company’s credit agreement uses EBITDA and Adjusted EBITDA to determine its interest rate and to measure compliance with certain covenants. EBITDA and Adjusted EBITDA are also used by the Company to evaluate and price potential acquisition candidates. EBITDA and Adjusted EBITDA have limitations as analytical tools and should not be considered in isolation or as a substitute for analysis of the Company’s results as reported under GAAP. Some of the limitations are: (a) EBITDA and Adjusted EBITDA do not reflect changes in, or cash requirements for, the Company’s working capital needs; (b) EBITDA and Adjusted EBITDA do not reflect the significant interest expense, or the cash requirements necessary to service interest or principal payments, on the Company’s debts; and (c) although depreciation and amortization are non-cash charges, the assets being depreciated and amortized may have to be replaced in the future and EBITDA does not reflect any cash requirements for such capital expenditures. EBITDA and Adjusted EBITDA should only be used on a supplemental basis combined with GAAP results when evaluating the Company’s performance.
Segment Contribution Margin and Adjusted Segment Contribution Margin
We define Segment Contribution Margin as earnings before interest, taxes, depreciation, and amortization, before the allocation of corporate overhead expenses. Adjusted Segment Contribution Margin is defined as Segment Contribution Margin adjusted for certain items affecting period-to-period comparability. See Selected Financial Information for details on how Segment Contribution Margin and Adjusted Segment Contribution Margin were calculated for each period presented. When viewed together with our GAAP results, we believe Segment Contribution Margin and Adjusted Segment Contribution Margin provide management and users of the financial statements meaningful information about the performance of our business segments. Segment Contribution Margin and Adjusted Segment Contribution Margin are used in addition to and in conjunction with results presented in accordance with GAAP and should not be relied upon to the exclusion of GAAP financial measures. The material limitation associated with the use of Segment Contribution Margin and Adjusted Segment Contribution Margin is that they are an incomplete measure of profitability as they do not include all operating expenses or non-operating income and expenses. Management compensates for this limitation when using these measures by looking at other GAAP measures, such as Operating Income and Net Income.
Adjusted Net Income (Loss) and Adjusted or Comparable Net Income (Loss) Per Common Share:
We define Adjusted Net Income (Loss) and Adjusted or Comparable Net Income (Loss) Per Common Share as Net Income (Loss) and Net Income (Loss) Per Common Share adjusted for certain items affecting period-to-period comparability. See Selected Financial Information below for details on how Adjusted Net Income (Loss) Per Common Share and Adjusted or Comparable Net Income (Loss) Per Common Share were calculated for each period presented. We believe that Adjusted Net Income (Loss) and Adjusted or Comparable Net Income (Loss) Per Common Share are meaningful measures because they increase the comparability of period-to-period results. Since these are not measures of performance calculated in accordance with GAAP, they should not be considered in isolation of, or as a substitute for, GAAP Net Income (Loss) and Net Income (Loss) Per Common share, as indicators of operating performance and they may not be comparable to similarly titled measures employed by other companies.
Free Cash Flow:
We define Free Cash Flow as net cash provided by operating activities less capital expenditures. The Company considers Free Cash Flow to be a liquidity measure that provides useful information to management and investors about the amount of cash generated by the business after the purchases of fixed assets, which can then be used to, among other things, invest in the Company’s business, make strategic acquisitions, strengthen the balance sheet, and repurchase stock or retire debt. Free Cash Flow is a liquidity measure that is frequently used by the investment community in the evaluation of similarly situated companies. Since Free Cash Flow is not a measure of performance calculated in accordance with GAAP, it should not be considered in isolation or as a substitute for analysis of the Company’s results as reported under GAAP. A limitation of the utility of Free Cash Flow as a measure of financial performance is that it does not represent the total increase or decrease in the Company’s cash balance for the period.
About 1-800-FLOWERS.COM, Inc.
1-800-FLOWERS.COM, Inc. is a leading provider of gifts designed to help inspire customers to give more, connect more, and build more and better relationships. The Company’s e-commerce business platform features an all-star family of brands, including: 1-800-Flowers.com®, 1-800-Baskets.com®, Cheryl’s Cookies®, Harry & David®, PersonalizationMall.com®, Shari’s Berries®, FruitBouquets.com®, Things Remembered®, Moose Munch®, The Popcorn Factory®, Wolferman’s Bakery®, Vital Choice®, and Simply Chocolate®. Through the Celebrations Passport® loyalty program, which provides members with free standard shipping and no service charge on eligible products across our portfolio of brands, 1-800-FLOWERS.COM, Inc. strives to deepen relationships with customers. The Company also operates BloomNet®, an international floral and gift industry service provider offering a broad-range of products and services designed to help members grow their businesses profitably; Napco℠, a resource for floral gifts and seasonal décor; DesignPac Gifts, LLC, a manufacturer of gift baskets and towers; and Alice’s Table®, a lifestyle business offering fully digital livestreaming and on demand floral, culinary and other experiences to guests across the country. 1-800-FLOWERS.COM, Inc. was recognized among America’s Most Trustworthy Companies by Newsweek. 1-800-FLOWERS.COM, Inc. was also recognized among the top 5 on the National Retail Federation’s 2021 Hot 25 Retailers list, which ranks the nation’s fastest-growing retail companies, and was named to the Fortune 1000 list in 2022. Shares in 1-800-FLOWERS.COM, Inc. are traded on the NASDAQ Global Select Market, ticker symbol: FLWS. For more information, visit 1800flowersinc.com or follow @1800FLOWERSInc on Twitter.
FLWS–COMP FLWS-FN
Special Note Regarding Forward Looking Statements:
This press release contains forward-looking statements within the meaning of the Private Securities Litigation Reform Act of 1995. These forward-looking statements represent the Company’s current expectations or beliefs concerning future events and can generally be identified using statements that include words such as “estimate,” “expects,” “project,” “believe,” “anticipate,” “intend,” “plan,” “foresee,” “forecast,” “likely,” “should,” “will,” “target” or similar words or phrases. These forward-looking statements are subject to risks, uncertainties, and other factors, many of which are outside of the Company’s control, which could cause actual results to differ materially from the results expressed or implied in the forward-looking statements, including, but not limited to, statements regarding the Company’s ability to achieve its guidance for the full Fiscal year; the Company’s ability to leverage its operating platform and reduce its operating expense ratio; its ability to successfully integrate acquired businesses and assets; its ability to successfully execute its strategic initiatives; its ability to cost effectively acquire and retain customers; the outcome of contingencies, including legal proceedings in the normal course of business; its ability to compete against existing and new competitors; its ability to manage expenses associated with sales and marketing and necessary general and administrative and technology investments; its ability to reduce promotional activities and achieve more efficient marketing programs; and general consumer sentiment and industry and economic conditions that may affect levels of discretionary customer purchases of the Company’s products. The Company undertakes no obligation to publicly update any of the forward-looking statements, whether because of new information, future events or otherwise, made in this release or in any of its SEC filings. Consequently, you should not consider any such list to be a complete set of all potential risks and uncertainties. For a more detailed description of these and other risk factors, refer to the Company’s SEC filings, including the Company’s Annual Reports on Form 10-K and its Quarterly Reports on Form 10-Q.
Note: The following tables are an integral part of this press release without which the information presented in this press release should be considered incomplete.
Management Emphasizes That It Has Sufficient Cash to Achieve Its Goals Including Recently Announced Collaborations and Being Cash Flow Positive During 2025
The $11 Million Investment includes Leading Builders and Hotel Developers
MIAMI, Oct. 07, 2024 (GLOBE NEWSWIRE) — SKYX Platforms Corp. (NASDAQ: SKYX) (d/b/a SKYX Technologies) (the “Company” or “SKYX”), a highly disruptive smart platform technology company with more than 97 issued and pending patents globally and over 60 lighting and home décor websites, today announced the completion of a strategic investment of $11 million of a new class of preferred stock in SKYX, with a conversion price of $2.00 per common share, with an 8% annual dividend, led by Lance Shaner, Chairman & CEO of Shaner Hotel Group, joined by other strategic and key SKYX investors.
Mr. Shaner said, “I clearly recognize SKYX’s extreme value proposition for hotels, buildings, and homes, and its significant global growth opportunity. I am now aligned to participate as a significant long term minded SKYX investor. I strongly believe that SKYX’s game-changing advanced and smart platform technologies will make hotels, buildings, and homes, advanced, smart, and safe instantly, while saving cost, time, and lives.”
Steve Schmidt, President of SKYX, said, “We are truly excited about this strategic investment, led by a Marriott global hotel chain developer such as Lance Shaner. This represents another significant confirmation of our value proposition for hotels, buildings, and homes, while enhancing our cash position to support our continuing growth including our recent collaborations with U.S. and world leading companies.”
Rani Kohen, Founder and Executive Chairman of SKYX, said, “We are thrilled to have Mr. Shaner as a strategic lead investor, as he contributes vast multi-faceted business experience including in community and hospitality developments. His experience and reputation not only represent success, but his involvement also provides continued validation and a major stamp of approval that SKYX’s advanced and smart technologies are game-changing for buildings, hotels, and homes.”
About Shaner Hotels
Headquartered in State College, Pa., Shaner Hotels is one of the foremost owner-operator companies in the hospitality industry with more than $1 billion invested in 60 hotel properties owned and managed across the U.S., Italy, Greece and the Bahamas. Over the past 40 years, the company has also been engaged in both new development and redevelopment of more than 80 hotel projects with leading brand affiliations such as Marriott International, InterContinental Hotels, Choice Hotels and Hilton. New properties are constantly evaluated as Shaner Hotels continues a conservative yet opportunistic approach to growth. For more information about the company and its divisions visit shanercorp.com.
About SKYX Platforms Corp.
As electricity is a standard in every home and building, our mission is to make homes and buildings become safe-advanced and smart as the new standard. SKYX has a series of highly disruptive advanced-safe-smart platform technologies, with over 97 U.S. and global patents and patent pending applications. Additionally, the Company owns over 60 lighting and home decor websites for both retail and commercial segments. Our technologies place an emphasis on high quality and ease of use, while significantly enhancing both safety and lifestyle in homes and buildings. We believe that our products are a necessity in every room in both homes and other buildings in the U.S. and globally. For more information, please visit our website at https://skyplug.com/ or follow us on LinkedIn.
Forward-Looking Statements
Certain statements made in this press release are not based on historical facts but are forward-looking statements. These statements can be identified by the use of forward-looking terminology such as “aim,” “anticipate,” “believe,” “can,” “could,” “continue,” “estimate,” “expect,” “evaluate,” “forecast,” “guidance,” “intend,” “likely,” “may,” “might,” “objective,” “ongoing,” “outlook,” “plan,” “potential,” “predict,” “probable,” “project,” “seek,” “should,” “target” “view,” “will,” or “would,” or the negative thereof or other variations thereon or comparable terminology, although not all forward-looking statements contain these words. These statements reflect the Company’s reasonable judgment with respect to future events and are subject to risks, uncertainties and other factors, many of which have outcomes difficult to predict and may be outside our control, that could cause actual results or outcomes to differ materially from those in the forward-looking statements. Such risks and uncertainties include statements relating to the Company’s ability to successfully launch, commercialize, develop additional features and achieve market acceptance of its products and technologies and integrate its products and technologies with third-party platforms or technologies; the Company’s efforts and ability to drive the adoption of its products and technologies as a standard feature, including their use in homes, hotels, offices and cruise ships; the Company’s ability to capture market share; the Company’s estimates of its potential addressable market and demand for its products and technologies; the Company’s ability to raise additional capital to support its operations as needed, which may not be available on acceptable terms or at all; the Company’s ability to continue as a going concern; the Company’s ability to execute on any sales and licensing or other strategic opportunities; the possibility that any of the Company’s products will become National Electrical Code (NEC)-code or otherwise code mandatory in any jurisdiction, or that any of the Company’s current or future products or technologies will be adopted by any state, country, or municipality, within any specific timeframe or at all; risks arising from mergers, acquisitions, joint ventures and other collaborations; the Company’s ability to attract and retain key executives and qualified personnel; guidance provided by management, which may differ from the Company’s actual operating results; the potential impact of unstable market and economic conditions on the Company’s business, financial condition, and stock price; and other risks and uncertainties described in the Company’s filings with the Securities and Exchange Commission, including its periodic reports on Form 10-K and Form 10-Q. There can be no assurance as to any of the foregoing matters. Any forward-looking statement speaks only as of the date of this press release, and the Company undertakes no obligation to update or revise any forward-looking statements, whether as a result of new information, future events or otherwise, except as required by U.S. federal securities laws.
Joe Gomes, CFA, Managing Director, Equity Research Analyst, Generalist , Noble Capital Markets, Inc.
Joshua Zoepfel, Research Associate, Noble Capital Markets, Inc.
Refer to the full report for the price target, fundamental analysis, and rating.
The Proposal. In a move long awaited by many investors, yesterday after the market closed Danone North America proposed to acquire Lifeway for $25/sh in cash, valuing the entire Company at approximately $380 million. Although the proposal is non-binding, Danone seeks to engage in discussions with the Board with a view to signing a definitive agreement rapidly. LWAY shares reacted positively, trading up nearly 16% to $24.91 on the news.
Why Now? Danone has been a significant Lifeway shareholder since 1999 and currently owns 23.4% of the outstanding equity. According to the letter sent to management, Danone’s 2025-28 Renew strategy has a strong focus on gut health, “which is driving our interest in considering the benefits of a potential combination with Lifeway.” The probiotics in kefir may help support a healthy gut.
Equity Research is available at no cost to Registered users of Channelchek. Not a Member? Click ‘Join’ to join the Channelchek Community. There is no cost to register, and we never collect credit card information.
This Company Sponsored Research is provided by Noble Capital Markets, Inc., a FINRA and S.E.C. registered broker-dealer (B/D).
*Analyst certification and important disclosures included in the full report. NOTE: investment decisions should not be based upon the content of this research summary. Proper due diligence is required before making any investment decision.
500 5th Avenue 20th Floor New York, NY 10110 United States Sector(s): Consumer Cyclical Industry: Apparel Manufacturing Full Time Employees: 599 Key Executives Name Title Pay Exercised Year Born Mr. Jonathan CEO & Director 825.62k N/A 1958 Ms. Marie Fogel Senior VP and Chief Merchandising & Manufacturing Officer 633.19k N/A 1961 Mr. John Chief Financial Officer
Michael Kupinski, Director of Research, Equity Research Analyst, Digital, Media & Technology , Noble Capital Markets, Inc.
Refer to the full report for the price target, fundamental analysis, and rating.
Fiscal Q2 overachieves expectations. Q2 revenues of $74.2 million were much better than our $68.5 million estimate and supported a “beat” in our adj. EBITDA estimate, a positive $2.4 million versus our adj. EBITDA loss estimate of $1.5 million. The largest portion of the variance was due to timing of wholesale order shipments, which pushed into the second quarter. We estimate that those revenues were roughly $5 million.
Profit margins improved, outlook appears favorable. Gross profit margins increased 80 basis points from year earlier levels, as the company shifts away from price promotions and with a focus on tight cost controls. management guided for operating margins to increase 350 to 450 basis points for the full year, bolstered by a shift away from discounting, higher pricing, and lower freight costs.
Equity Research is available at no cost to Registered users of Channelchek. Not a Member? Click ‘Join’ to join the Channelchek Community. There is no cost to register, and we never collect credit card information.
This Company Sponsored Research is provided by Noble Capital Markets, Inc., a FINRA and S.E.C. registered broker-dealer (B/D).
*Analyst certification and important disclosures included in the full report. NOTE: investment decisions should not be based upon the content of this research summary. Proper due diligence is required before making any investment decision.
Joe Gomes, CFA, Managing Director, Equity Research Analyst, Generalist , Noble Capital Markets, Inc.
Joshua Zoepfel, Research Associate, Noble Capital Markets, Inc.
Refer to the full report for the price target, fundamental analysis, and rating.
Increasing Price Target. Shares of LWAY have risen since the Company had record-breaking operating results in the second quarter. The increase in the share price, of around 15% from the announcement of second quarter results, along with the positive operating momentum of the Company pushes our target price from a previous $20 to $25.
Rise in Price. Since the second quarter results on August 13th, shares of LWAY have risen to $19.18 as of Friday’s close from $16.66. The average volume per day over the course of this time (14 days) was approximately 255,571 shares as opposed to last quarter’s 164,046. Although not all volume is positive, the positive trend indicates more investor interest in Lifeway’s story and being encouraged with the Company’s performance.
Equity Research is available at no cost to Registered users of Channelchek. Not a Member? Click ‘Join’ to join the Channelchek Community. There is no cost to register, and we never collect credit card information.
This Company Sponsored Research is provided by Noble Capital Markets, Inc., a FINRA and S.E.C. registered broker-dealer (B/D).
*Analyst certification and important disclosures included in the full report. NOTE: investment decisions should not be based upon the content of this research summary. Proper due diligence is required before making any investment decision.