The Trading Week Ahead Could See Investors Continuing to Adjust to the Flattening Yield Curve
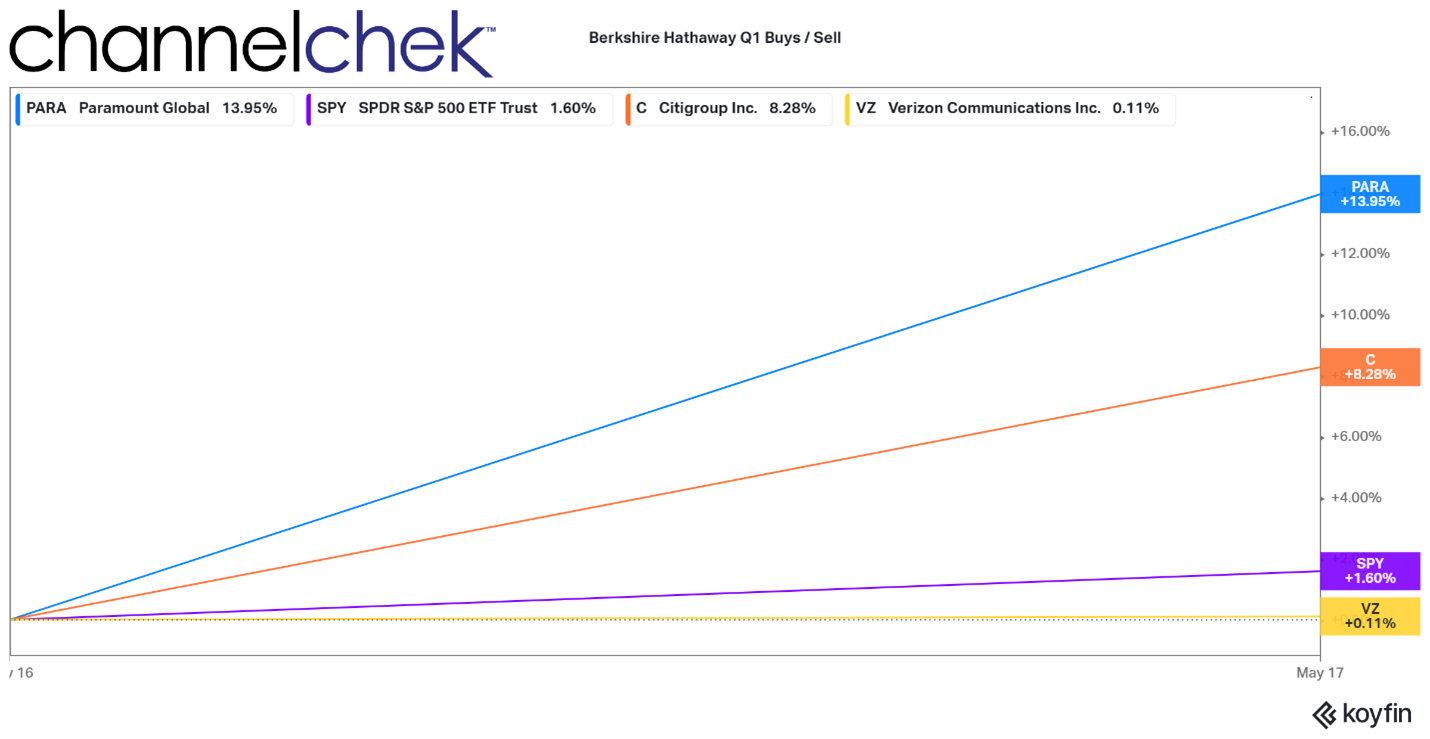
Bill Ackman says he’s short the U.S. Treasury long bond. Michael Burry, who tends to see things before others, had been short a derivative of Treasuries two summers ago, was he involved in interest rates this most recent quarter-end? We will get a glimpse into what these two, plus Warren Buffett and a host of others, as time runs out on their 13-F filing as of the close of business on Monday.
Last week many investors went from betting on a soft-landing a few weeks ago to now thinking interest rates along the curve are too low. The impetus for the shift was the CPI and PPI reports last week had provided nothing for the Fed to stop or slow down tightening. This concerns stock market investors. Higher rates, at a minimum, are beginning to provide an attractive alternative to a stock market that has already run up above average. This is because investors can now be choosier as their cash is far more productive, even after inflation, than it has been in years. Individual companies that have great prospects, rather index ETFs where you hold the good with the bad, would seem more prudent in the current scenario.
Monday 8/14
• 13-F Day is the SEC deadline for funds that manage more than $100 million in assets, that they must divulge positions held as of the end of the previous quarter. For example, Michael Burry’s Scion Asset Management hedge fund, Warren Buffett’s Berkshire Capital Holdings, and all U.S. asset managers of size have 45 days from quarter-end to file. A very large percentage choose to file on the 45th day, August 14th is 45 days from June 30th. Investors pour through the 13_f filings of top investors looking for insights.
Tuesday 8/15
• 8:30 AM ET, The consensus for Retail Sales for July is up 0.4% after an unexpectedly poor showing in June of a gain of 0.2%. Retail sales measure the total receipts at stores that sell merchandise and related services to final consumers. Sales are by retail and food services stores.
• 8:30 AM ET, Import and Export Prices are expected to show that import prices increased 0.2% in July after falling 0.2% in June. Export prices are expected to have increased 0.1% after dropping 0.9% in June. The underlying value of this report is the measure of global inflationary trends. Import price indexes are compiled for the prices of goods that are bought in the United States but produced abroad and export price indexes are compiled for the prices of goods sold abroad but produced within the U.S.
• 4:00 AM ET, Treasury International Capital is the tracking of who holds U.S. securities, or put another way, where in the world are U.S. Stocks, U.S. Treasuries, Agencies, and Corporate Bonds. TIC has recently been watched by a wider group as it is a measure of foreign demand for our assets. The prior number (May) showed net long-term transactions abroad of U.S. securities at $25.8 billion.
Wednesday 8/16
• 7:00 AM ET, The Mortgage Bankers Association (MBA) compiles data which indicates demand for mortgages. Data from the previous week indicate a drop in their Purchasing index of 2.7%, and a decline in its Refinance index of 4.0%.
• 8:30 AM ET, Housing Starts month over month for July are expected to have increased to 1.464 million from 1.44 million in June.
• 9:15 AM ET, Industrial Production had fallen 0.5 percent for two straight months; forecasters expect a rebound of 0.3 percent in July. After falling 0.3 and 0.2 percent, manufacturing output is seen as unchanged. Capacity utilization is expected to rise to 79.1 from 78.9 percent, still below what is considered inflationary.
• 10:30 PM ET, The Energy Information Administration (EIA) provides weekly information on petroleum inventories in the U.S., whether produced here or abroad. The inventory level impacts prices for petroleum products.
• 2:00 PM ET, FOMC minutes are from the meeting three weeks ago, where the Fed adjusted the overnight target upward. This report has recently been market-moving as it details the issues of debate and consensus among policymakers.
Thursday 8/17
• 8:30 AM ET, Initial Jobless Claims are expected to have fallen the week ended August 12th to 240,000 following a 21,000 jump to 248,000 last week, in the absence of inflation data, the market places adds emphasis on unexpected results in the labor market.
• 10:00 AM ET, E-Commerce Retail Sales for the second quarter are scheduled for release. During the first quarter, online retail transactions had increased by 3%.
• 4:30 AM ET, the weekly report on the Fed’s Balance Sheet is now awaited each week as it provides statistics on whether the Fed is fulfilling its quantitative tightening promise on schedule. It also could provide an early tip-off if there is a problem within the banking system. The report from the week prior showed $8.208 trillion in assets, and bank reserve credit declining $18,685 billion.
Friday 8/18
• 10:00 AM ET, The Quarterly Services Survey is not usually a large focus, but it is the only economic number printing on what may very well be a lightly traded late summer Friday. The report includes industry information; professional, scientific, and technical services; administrative & support services; and waste management (NAICS 51, 54, and 56). Last quarter, these industries experienced 2.9% growth, or 9.7% year-on-year.
What Else
A press release dated Friday, August 11th, stated that Greg Steube, a Representative from Florida’s 17th district had filed “Articles of Impeachment Against Joseph Robinette Biden, Jr., President of the United States, For High Crimes and Misdemeanors.” What this could mean for markets, if the past is an indicator, is very little. There could be days where traders are largely distracted by news stories that may come from this, but the soundness of the U.S. or the global economy is not likely to be hanging in the balance on any outcome from the proceedings.
Managing Editor, Channelchek
Sources
Steube.house.gov
https://www.econoday.com/articles/high-points-for-economic-data-scheduled-for-august-14-week/
Steube.house.gov


