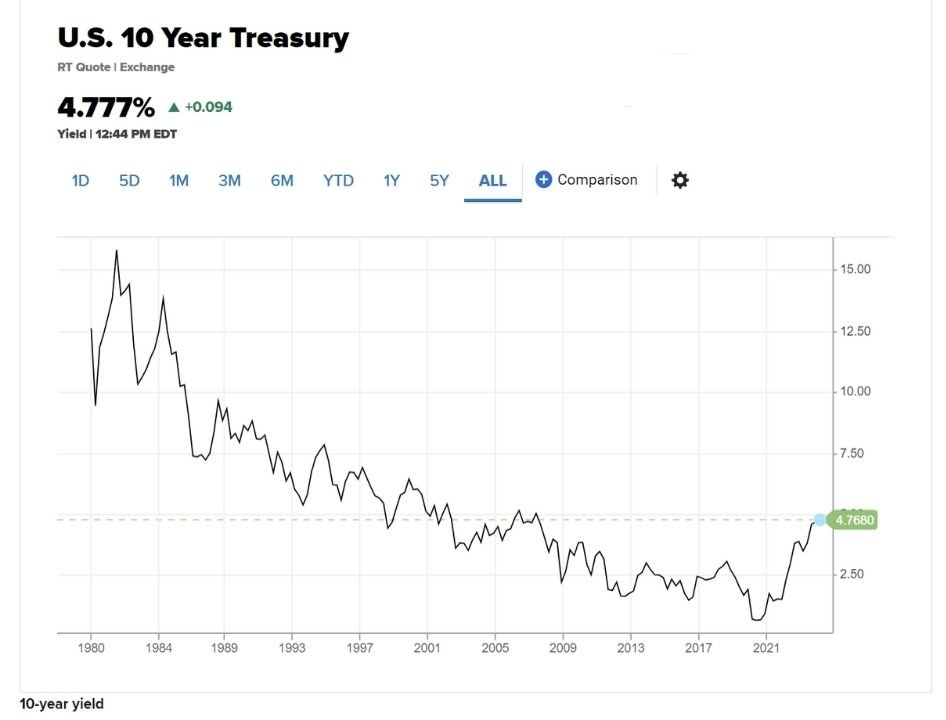
The bond market is sounding alarm bells about the economic outlook. The yield on the 2-year Treasury briefly exceeded the 10-year yield this week for the first time since 2019. Known as a yield curve inversion, this phenomenon historically signals a recession could be on the horizon.
While not a guarantee, yield curve inversions have preceded every recession over the past 50 years. Here is what is happening in the bond market and what it could mean for investors.
Why Did Yields Invert?
Yields on short-term bonds like 2-year Treasuries tend to track the Federal Reserve’s policy rate. With the Fed aggressively hiking rates to combat inflation, short-term yields have been rising quickly.
Meanwhile, long-term yields like the 10-year are influenced by investors’ growth and inflation expectations. As optimism over the economy’s trajectory wanes, investors have been driving down long-term yields.
This dynamic inversion, where short-term rates exceed longer-duration ones, reflects mounting concerns that the Fed’s rate hikes will severely slow economic activity. Markets increasingly fear rates may cause a hard landing into recession.
The yield curve has flashed the most negative signal since the lead up to the pandemic recession. This suggests investors see a lack of catalysts for growth on the horizon even as inflation remains stubbornly high.
Ongoing supply chain problems, the war in Ukraine putting pressure on food and energy prices, and fears of a housing market slowdown are all weighing on outlooks. There is a sense the Fed lacks effective tools to bring down inflation without crushing the economy.
Meanwhile, key economic indicators like manufacturing surveys have weakened significantly. This points to activity already slowing ahead of when rate hikes would take full effect.
Implications for Investors
The risks of a recession are rising. Yield curve inversions have foreshadowed every recession since the 1950s. However, they have also sometimes occurred 1-2 years before downturns start.
This suggests investors should prepare for choppiness, but not panic. Rotating toward more defensive stocks like healthcare and consumer staples can help portfolios better weather volatility. At the same time, cyclical sectors like tech and industrials could face more pressure.
In fixed income, short-term bonds may offer opportunities as the Fed potentially cuts rates during a downturn. But credit-sensitive sectors like high-yield bonds and leveraged loans could struggle if defaults rise.
While uncertainty abounds, the inverted yield curve highlights the delicate balancing act ahead for the Fed and concerns over still-high inflation. Investors will be closely watching upcoming data for signs of how quickly the economy is slowing. For now, caution and safe-haven assets look to be in favor as recession worries cast a long shadow.
Doomsday Investor Sees Ongoing Moves by Policymakers as Destructive
We’d all like to think that global decision-makers responsible for economic conditions have the best interest of the world’s citizenry in mind when making decisions – but doubts and concerns are growing. Among the most concerned are economic stakeholders that don’t believe “bad” things should always be prevented. One very credible voice highlighting this idea is hedge fund manager Paul Singer. He’s the CEO of Elliot Investment Management and recently moved his firm’s offices out of NY, NY, to the more business-friendly West Palm Beach, FL. Singer says a credit collapse and deep recession may be needed to restore financial markets.
Paul Singer is the founder and CEO of Elliott Investment Management. Its year-end 13F reportable AUM was $12.25 billion. The firms opportunity-based investment style allows Singer and Company, known for their corporate activism, to move to wherever profit may lie.
The current thinking of Singer, a registered Republican, has been making headlines. This includes a widely circulated opinion piece published in the Wall Street Journal last week. In it, he discusses more than a decade of what he believes are damaging easy-money policies and how a deep recession and even credit collapse will be necessary to purge financial markets of excesses.
“I think that this is an extraordinarily dangerous and confusing period,” Singer told The Journal, in his interview, he warns that trouble in markets may only be getting started now that a full year has passed from the start of tighter monetary policy.
One of the more chilling quotes from Singer is, “Credit collapse, although terrible, is not as terrible as hyperinflation in terms of destruction wrought upon societies.”
The idea that we are headed down either one path or the other, he doesn’t mention a third option, may be why the New Yorker magazine calls him “Doomsday Investor.” He explains, “Capitalism, which is economic freedom, can survive a credit crisis. We don’t think it can survive hyperinflation.”
The Doomsday Investor has been outspoken against government safety nets for a while, including the sweeping banking regulations from the Dodd-Frank Act of 2010. This act created the Financial Protection Bureau (CFPB) and established the Financial Stability Oversight Council (FSOC). Singer strongly opposed prolonged market interventions by global central banks following the 2008 global financial crisis. Interventions that still haven’t been drained from the U.S. monetary system.
Singer, who is 78 called crypto, “completely lacking in any value,” in his WSJ interview. He also said: “There are thousands of cryptocurrencies. That’s why they’re worth zero. Anybody can make one. All they are is nothing with a marketing pitch—literally nothing.”
While his funds performance have placed him near the top of hedge fund manager performance, Singer personally worries the Fed and other central banks will respond to the next downturn by referring to the failed playbook of slashing interest rates and potentially resuming large-scale asset purchases. The point was shown to be current, as Singer called the regulatory response to the collapse of Silicon Valley Bank and Signature Bank, including the guaranteeing of all deposits from the two lenders akin to “wrapping all market movements in security blankets.”
He complained, “…all concepts of risk management are based around the possibilities of loss.” He encouraged decision makers to, “Take it away, it’s going to have consequences.”
Where Can Investors Hide
Paul Singer said in his interview there may be a few places for investors to ride out what he sees as a coming storm. One place comes as no surprise, “At such times, some consider the safest bet to be relatively short-term U.S. government debt,” he said, adding that “such debt pays a decent return with virtually no chance of a negative outcome.” He is likely speaking of U.S. Treasuries two years and shorter as the longer duration bonds would be more volatile as rates shift, and other government debt like GNMAs are fraught with extension risk.
Singer also believes some gold in portfolios may make sense.
Take Away
Without some rain, nothing could flourish. Without an occasional brush fire, the risk of massive forest fire greatly increases. Paul Singer, in his interview with the WSJ, indicates he believes the economic brushfires that decision-makers have been preventing should have been allowed to run their course. Preventing them is a big mistake and a collapse may not be far off.
This collapse in easy credit and crypto, among other bubble-type excesses Singer believes could be destructive but preferred by society over continuing to move toward hyperinflation.
Owning a Balanced Diversified Investment Portfolio Has Been Like Watching a Train Wreck
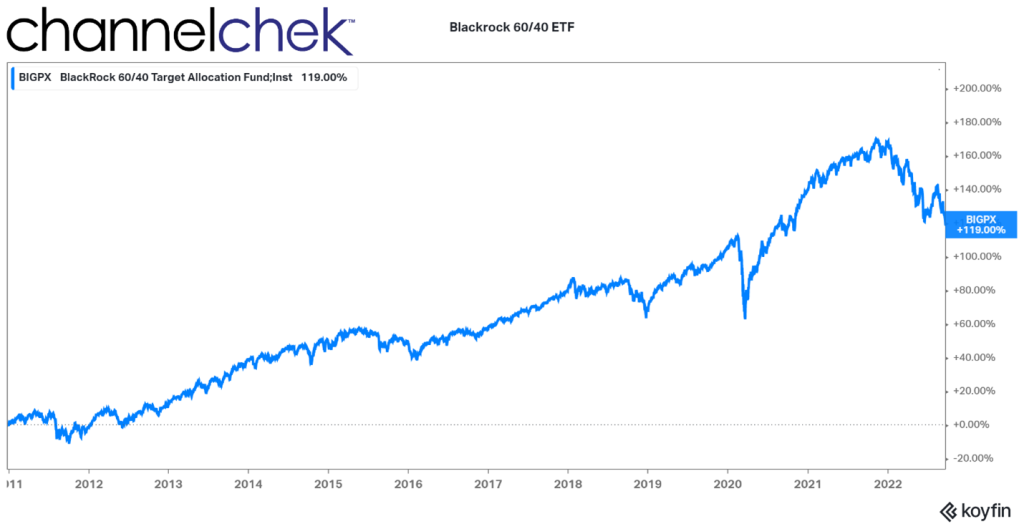
From the time that most realized the Fed would aggressively deal with inflation, watching the classic 60/40 balanced portfolio has been like watching a slow train wreck.
Diversification, balance, a 60/40 allocation have been the marching orders from those “in the know.” But what do you do when you’re terribly sure that the 40% in bonds will be worth less tomorrow, and the 60% in a standard stock index is more likely to be down than up? This is the question investors, wealth managers, and retirees have been faced with since early in 2022. The Chair of the Federal Reserve promised to raise rates, so the 40% allocation in bonds has been almost guaranteed by a Federal agency to perform worse than cash in your pillow case, and when interest rates rise, the economy does worse, which at first weighs down stock indexes.
Advisors want their customers to sleep better at night, so they tell them not to worry, no one can call the market, you don’t want to miss the up days. Every time, the markets have bailed them out, and there is no reason not to think that there won’t continue to be eventual increases on one side or the other of the investment pie chart. Meanwhile, missing predictable down periods are just as important to exceptional long-term results as being invested when values rise.
60/40 101
The classic portfolio of 60% stocks and 40% bonds touted in articles by wealth managers and certified by textbooks on investing may no longer provide the same level of returns that it delivered previously. Or it may be going through a period where the direction of stocks and bonds is highly correlated – and it will at some point turn the corner to balanced performance.
From the 1980s until recently, a portfolio of 60% stocks and 40% bonds did well for investors and for good reason. The mix consistently provided investors with attractive risk-adjusted returns, with total returns often equal to or better than those of the S&P 500 Index and with lower volatility. In a more natural market, rates come down (bond bull market) when the economy is weak, which brings stock prices down (stock bear market) and visa versa. The investor always has positions in a bull market to partially offset losses from the other side of the portfolio.
Recent History of Balanced Portfolios
But this strategy hasn’t really worked for decades. Many haven’t noticed because its not working has benefitted investors. Debt and equity prices have moved in the same direction. Both stocks and bonds have reached new highs through last year. Investors aren’t critical when they’re making money, but both markets joined hands long ago and have been mostly moving in the same direction. Here’s your evidence; in 1982, a 30 year-treasury bond was issued, paying over 14%. Today the 30-year is paying 3.65%. So the bond market, with slight ups and downs, has been strong for most of the last 40 years. The S&P 500 in 1982 closed at 120. Today, the same index is at 3,675. Both markets, although not always trading hand in hand, more often than not rise and fall together.
Image: 60:40 Blackrock portfolio performance since 2011 (Koyfin
60/40 in 2022
The protection of hiding behind a broad, diversified index of stocks and conservative (supposedly uncorrelated) bonds is certainly showing its weakness this year. Persistent structural inflation adding to interest rates and negative GDP growth have battered both markets. It exposes that 60/40 is not perfect and that set-it and forget-it could cause many to have large drawdowns that will require huge percentage increases in the future.
What to Do
When the most powerful mover of assets transparently says they are going to do something that will impact the markets, believe that the odds are that they will. In other words, don’t fight the Fed. This could mean a slight to a total reduction in bonds, why watch your bond portfolio become a train wreck. And if you are in bond funds, a move to individual bonds offers the solace of at least knowing they mature at par.
The stock portfolio is trickier. The equities market will turn around when there are signs that the economy has bottomed out. Currently, there are some signs of weakness, but mostly expectations of great weakness as we know the Fed is resolved to tame inflation. Investors will race to be first in on the most recent dip. Selectively picking stocks that have a good reason to outperform now and be strong later when bullishness returns is likely smarter than holding a broad-based index. The broad-based economy is headed lower, so it stands to reason the broad-based indexes have further to fall.
Don’t be a stranger to analysts’ reports on individual companies. Expert, unbiased analysis of sectors and individual stocks can help you uncover those that are unlinked to negative world events or are taking advantage of global changes.
Cash was trash when rates were near zero. Currently, a three-month T-Bill yields around 3.75%. Other short and safe securities are closer to 4%. When there is a recognizable turnaround, you’ll want ammunition. Keep some dry powder to be able to pounce; today’s short interest rates provide returns above those expected in the major indexes. Check with your broker to find out how to invest in short-term agencies, T-Bills, or broker CDs so you are ready for when the Fed says they are in a wait-and-see mode, for when GDP shows we are clearly not in a recession, for when corporate earnings are on the rise, and for when interest rates on bonds are closer to a level that produces low inflation numbers.
Take Away
Stocks and bonds have mostly been moving in the same direction for a very long time. Both were moving up, so no one noticed.
Cash is also an option in any portfolio, and you’re now getting paid more. If the Fed continues to suggest rates are rising, it practically ensures lower bond prices. Move to cash or carefully selected equities. Look for quality analysis of sectors and stocks before jumping into a stock. News stories, statistics, and often research and analysis on small-cap opportunities are available for those signed-up for Channelchek emails, along with many other no-cost perks.
What’s the Best Inflation Fighter for Your Savings? Stocks or TIPS?
At a minimum, an investor with an eye toward having more, not less, in the future needs to beat the rate of inflation. Ideally, since the investor ties up their money, the buying power in their account should provide the current inflation rate plus a risk premium over the medium to long term. During the past few months, a number of long-term savers/investors have asked me what I thought about TIPS as a means of exceeding inflation. I have strong opinions on these Treasury securities. My thoughts are rooted in having been a portfolio manager for the country’s second-largest fixed income fund manager back in 1996 when the U.S. Treasury asked for our input on the design of the new bond. The Treasury wanted us to approve of the bonds enough to invest in them – in early 1997 I pulled the trigger on $100 million in the first ever TIPS auction – that was 25 years ago, and there is now enough data to compare the performance of Stocks, TIPS and the rate of inflation. Which one provides better inflation “protection”?
Some Details on TIPS
If you aren’t aware of the intricacies and history of the Treasury Inflation-Indexed Securities, dubbed TIPS, as the working name for the project back in 1996, here’s what you should know in a two paragraphs.
Interest rates were declining through the late 1990s and the Treasury Secretary Robert Rubin had a plan to lessen the government’s interest rate burden by issuing a bond with costs that would be lower with the declining inflation and interest rates. The Canadians, British, and Australians all had a bond type that floated with the countries’ inflation index. The Canadian-style bond had a fixed rate of interest where the principal accreted upward with an inflation index. On this new principal, an unaffected fixed-rate (coupon) would pay interest. The British and the Aussies paid the inflation addition with the coupon, the bondholder didn’t have to wait until maturity to be compensated for price increases. The U.S. adopted the Canadian system of accreting to principal.
The new bond was to be helpful to the U.S. Treasury, the conservative investor, and even the Federal Reserve. Inflation was sinking at the time, so investors were attracted in part to the idea that the securities effectively have a floor since the Treasury would never lower the principal accretion to below zero even if deflation became a problem. Retirees were told they should be thrilled to have a low-risk investment to choose from that paid inflation plus. The U.S. Treasury was looking forward to being able to reduce the interest costs of its debt as there were still bonds outstanding that were paying 14%. As for the Chairman of the Federal Reserve, Alan Greenspan, he was thrilled he’d have a constantly updating investor-driven mechanism that would indicate the market’s current expectation of inflation.
Inflation “Get Real”
Through the late seventies and into the early eighties, inflation was a big influencer on all household decisions. Durable items like washing machines were purchased sooner rather than later because they may cost much more later. Even borrowing to buy made good financial sense. As for investing or saving, buying short bonds or CDs that always paid more than inflations and then reinvesting similarly when it came due provided the investor with a little more income than inflation (and sometimes a free toaster). The stock market had years where it had negative returns, but for the medium or long-term saver, it far exceeded inflation. This has not seemed to have changed.
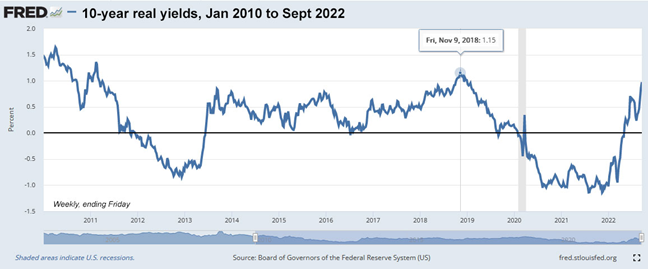
“Get Real” is a slogan that had been used by brokers trying to build enthusiasm for TIPS when they first came out. It refers to real yield, or put another way, the yield after inflation. TIPS were designed to pay the inflation rate plus an interest rate, so the investor earns a real yield. What no one anticipated when the securities were designed is the real yield could go negative, thus providing the investor with inflation minus whatever supply and demand decided.
The chart below demonstrates that over a recent 11-year period, TIPS paid negative real rates about a third of the time. They did not provide the investors with a return above the rate of inflation as originally envisioned.
Source: St. Louis Federal Reserve
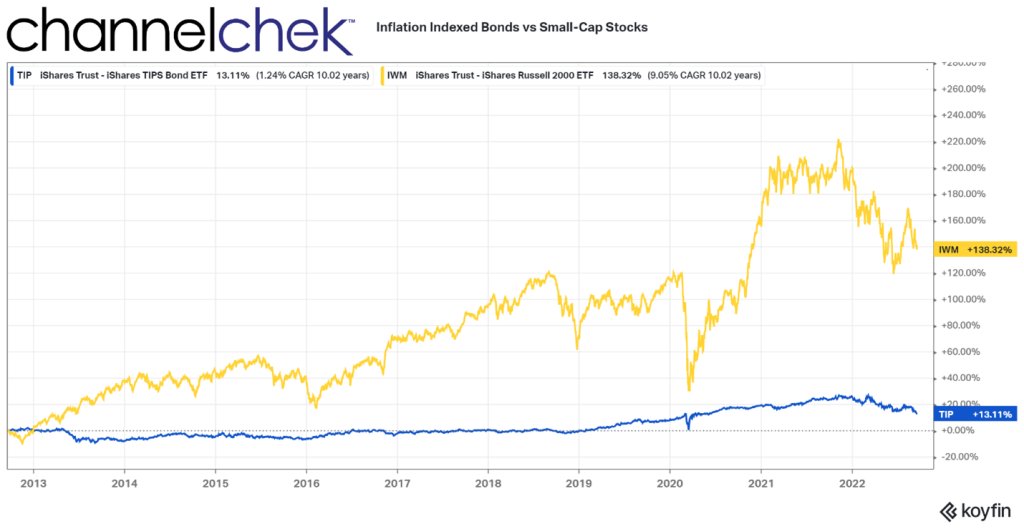
Stocks are not designed to be correlated with the rate of inflation, but they generally do well when the economy is flourishing or expected to flourish (these periods tend to be associated with inflation). And equities fall off when there is a contraction or expectations of a bad business climate. The chart below uses the Russell 2000 Small-Cap Index as a measure of stock market performance. The period shown demonstrates that if one is looking to keep up with or beat inflation by any margin, Small-Cap stocks can be viewed as far superior to TIPS.
During the period from August 2012 until August 2022, prices have risen a combined amount of 28.558%, according to a calculator provided by the Bureau of Labor Statistics. During the same period, an investment in TIPS provided 13.11% to the saver/investor. This equates to a real return of negative 15% over ten years. If the purpose of the investor is to keep up with and beat inflation, TIPS have failed as a decent option.
As for stocks, the downside over short periods has been much larger and deeper declines than TIPS. However, after year one, the declines were never large enough to show underperformance. TIPS failed its main goal of inflation plus. If an investor instead put money in small-cap stocks, they would have exceeded inflation by 110%.
While this is not predictive of the future, it is compelling evidence for anyone with a time horizon beyond a few years to look at the true risk profile of each. TIPS have performed worse than inflation. One reason for this is that bond prices have been held lower than the market would naturally have them because the Fed has taken so many on its balance sheet.
Take Away
The performance of the stock market over the medium to long term has a long history of beating returns of other assets, especially those of bonds. Treasury Inflation-Indexed Securities, the official name for the bond, does not have a “P” in it. The “P” was supposed to stand for “Protected.” Just prior to the first auction, the name was changed as government lawyers pointed out these may not protect the investor from inflation.
The Federal Reserve owns a third of the outstanding U.S. Treasuries, including a large allocation of TIPS. This unnatural demand holds prices artificially below where the market would price them without the Fed’s impact. This skewing of the results would have been upsetting to former Fed head Alan Greenspan who felt the main appeal to the security was their ability to help predict future inflation.
Stocks have risks, and bonds have risks, if it’s inflation you’re looking to overcome, inflation-linked bonds have been historically off the mark.