

Noble Capital Markets Media Sector Review – Q4 2021
INTERNET AND DIGITAL MEDIA COMMENTARY
Past Performance is Not Indicative of Future Results
When it comes to investing, It is often said that “prior performance may not be reflective of future results”, and that was certainly the case in 2021. Stocks in the Internet and Digital Media sectors performed well in 2021, but not nearly as well as the broader market (the S&P 500), which finished the year up 27%. Only the Noble’s Digital Media Index (+47%), outperformed the S&P 500, while stocks in the Social Media (+17%), Mar Tech (+14%), Ad Tech (+10%) and eSports & Gaming (-29%) Indices underperformed. In many respects, Internet and Digital Media stocks were victims of their own success. In 2020, when the S&P 500 finished up 16%, Noble’s Ad Tech (+178%), Mar Tech (+65%), Social Media (+41%) and Digital Media (+38%) Indices all significantly outperformed the S&P 500 (NOTE: Noble launched the eSports & Gaming sector in 1Q 2021).
Many stocks in the Internet & Digital Media were “Covid beneficiaries” and benefited from increased time spent at home viewing on-demand video content or playing video games. As consumers began to resume their normal lives in 2021, the Covid beneficiaries began to face difficult comparisons. Zoom Communications (ZM) is the poster boy for this effect: shares of Zoom increased nearly 400% in 2020 but fell by 46% in 2021.
Noble’s Internet & Digital Media indices are market cap weighted, so their performance is often driven by the FAANG stocks (Facebook, Apple, Amazon, Netflix and Google). Interestingly, only Google (GOOG: +65%) and Apple (APPL: +34%) outperformed the S&P 500 in 2021, with Facebook (FB: +23%), Netflix (NFLX: +11%) and Amazon (AMZN: +2%) failing to keep pace.
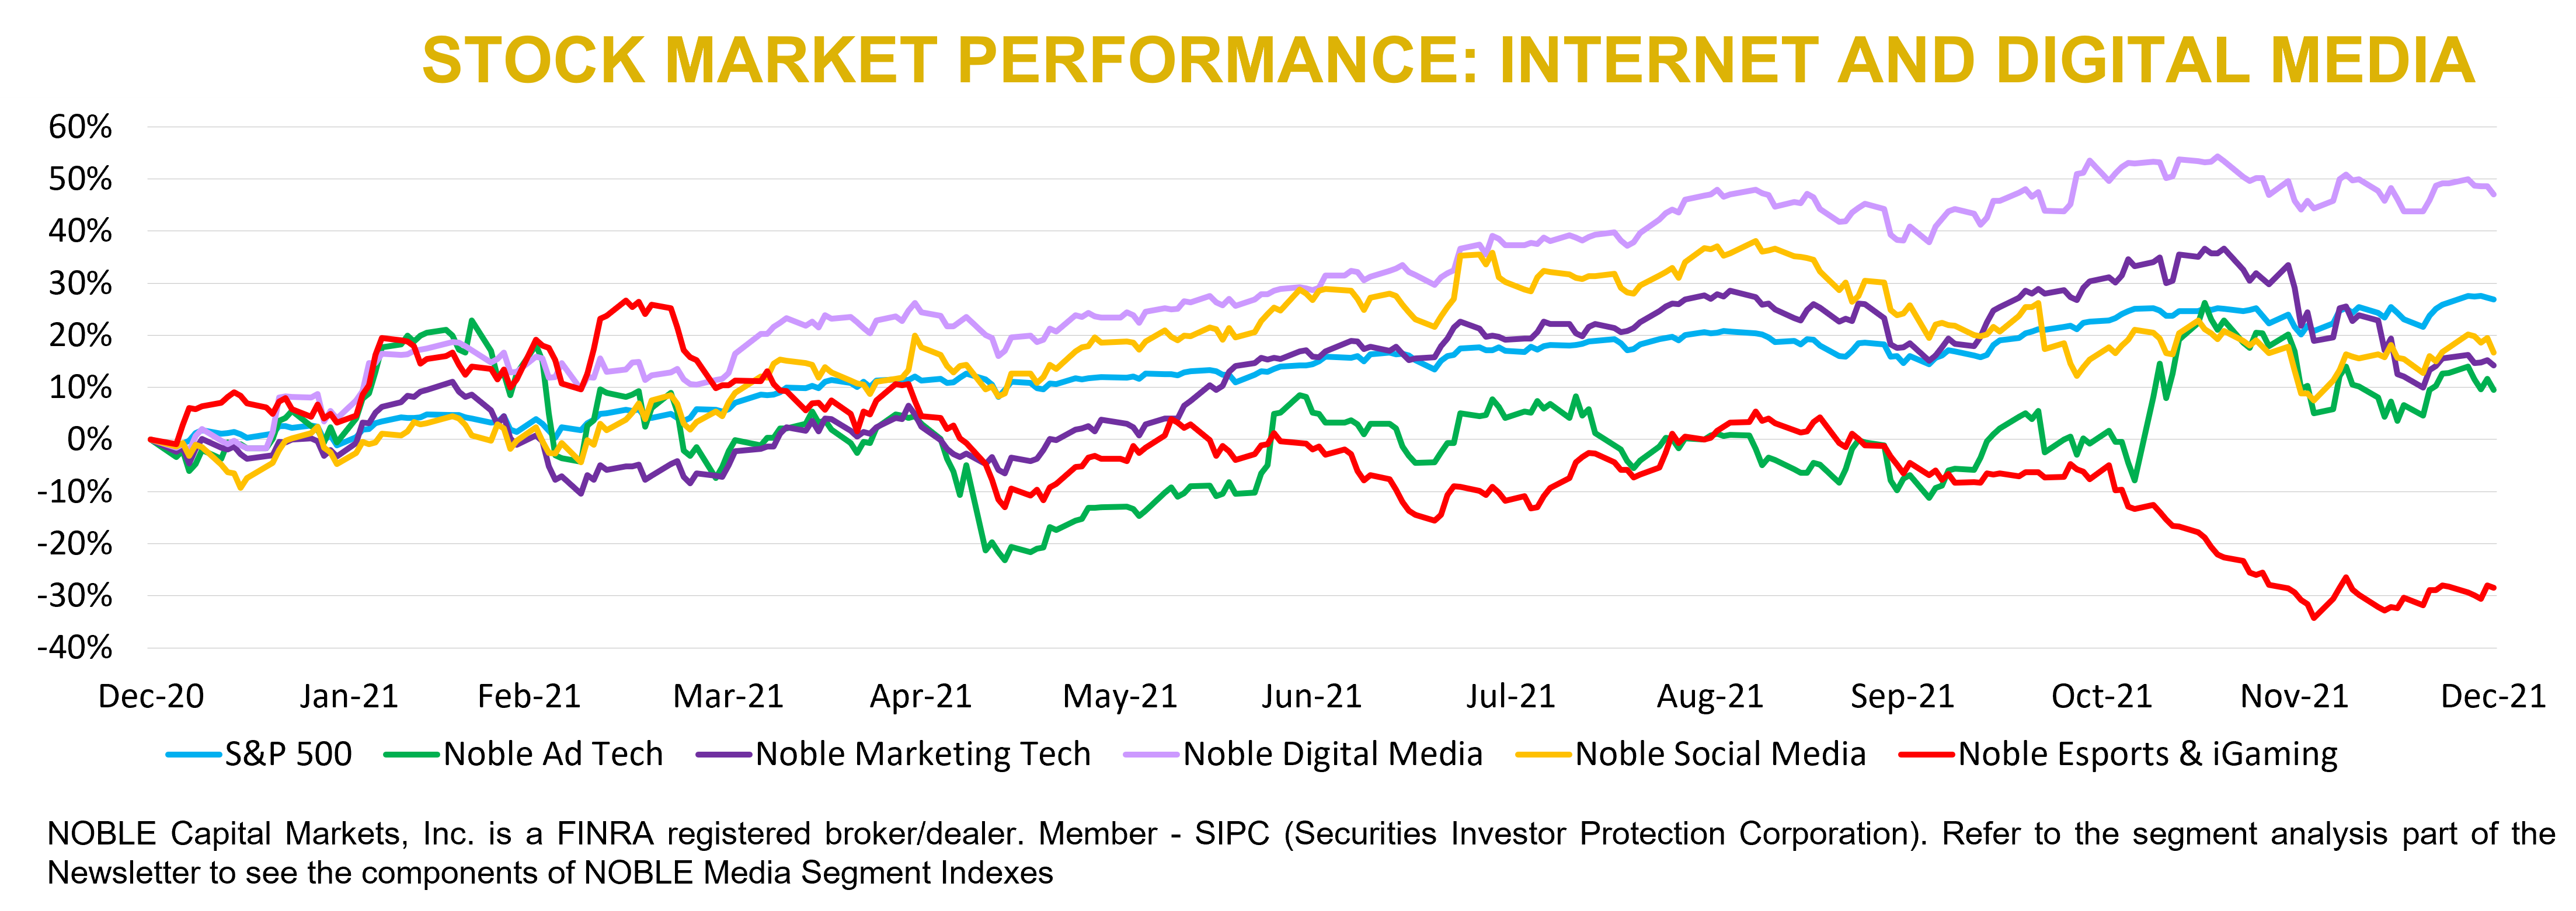
Noble’s market cap weighted Digital Media Index performed well primarily on the strength of Google’s shares, despite only 3 of the 11 stocks in the index increasing for the year. A few of high-fliers in 2020 failed to repeat in 2021. For example, FuboTV (FUBO) saw its shares increase by 214% in 2020 but came back to earth in 2021 (-45%). Spotify saw a similar trend, as shares increased by 110% in 2020, only to fall by 26% in 2021.
Noble’s eSports & Gaming Index shared similar traits as the Digital Media sector; only the sector experienced both a boom and bust in the same year. The index was up 25% through mid-March, only to finish the year down a similar amount (-29%), reflecting a nearly halving of stock prices in the last 3 quarters of the year. While Noble only created this index in 2021, we note that the average increase for stocks in this sector in 2020 was 117%. Again, another sector that fell victim to pandemic-related investor enthusiasm.
In general, Noble’s Internet & Digital Media Indices finished the year rather poorly. In 4Q21, the S&P 500 finished up 11%. Only Noble’s Ad Tech Index outperformed the broader market, increasing by 18%. Indices that underperformed the broader market include Digital Media (+6%), Mar Tech (-3%), Social Media (-6%), and eSports & Gaming (-24%). We would note that every stock in the Social Media and eSports & Gaming sectors fell during the fourth quarter of 2021.
We attribute much of the weakness in these indices to the Fed’s pivot to a more hawkish stance on inflation, first during the September meeting, and again in mid-December, when it opined that it no longer considered inflation transitory and would double the pace of tapering (reducing bond purchases) and signaling three rate hikes in 2022. Investors appear to have responded by moving into large cap defensive names at the expense of smaller cap growth companies. Companies that are not yet profitable were hit hardest. If prior year’s performance is not reflective of future results, then there’s hope for better performance in 2022.
2021 – A Robust Year for Internet & Digital Media M&A Transactions
According to Dealogic, global deal value increased 63% to $5.6 trillion in 2021, exceeding $5 trillion in deal value for the first time and easily surpassing the previous record of $4.4 trillion in 2007. Overall deal values in the U.S. nearly doubled to $2.6 trillion.
2021 was an active year for mergers and acquisitions in the Internet and Digital Media sectors. Noble breaks down our universe into 9 categories and we tracked 646 deals in 2021 a 21% increase in deal activity compared to the 535 deals we tracked in 2020. The dollar value of the deals we tracked in 2021 increased by 15% to $132.7 billion, up from $115.5 billion in 2020. From a deal value perspective, the most active sectors were Digital Content ($41.5B), Marketing Tech ($35.7B) and Ad Tech ($21.4B).
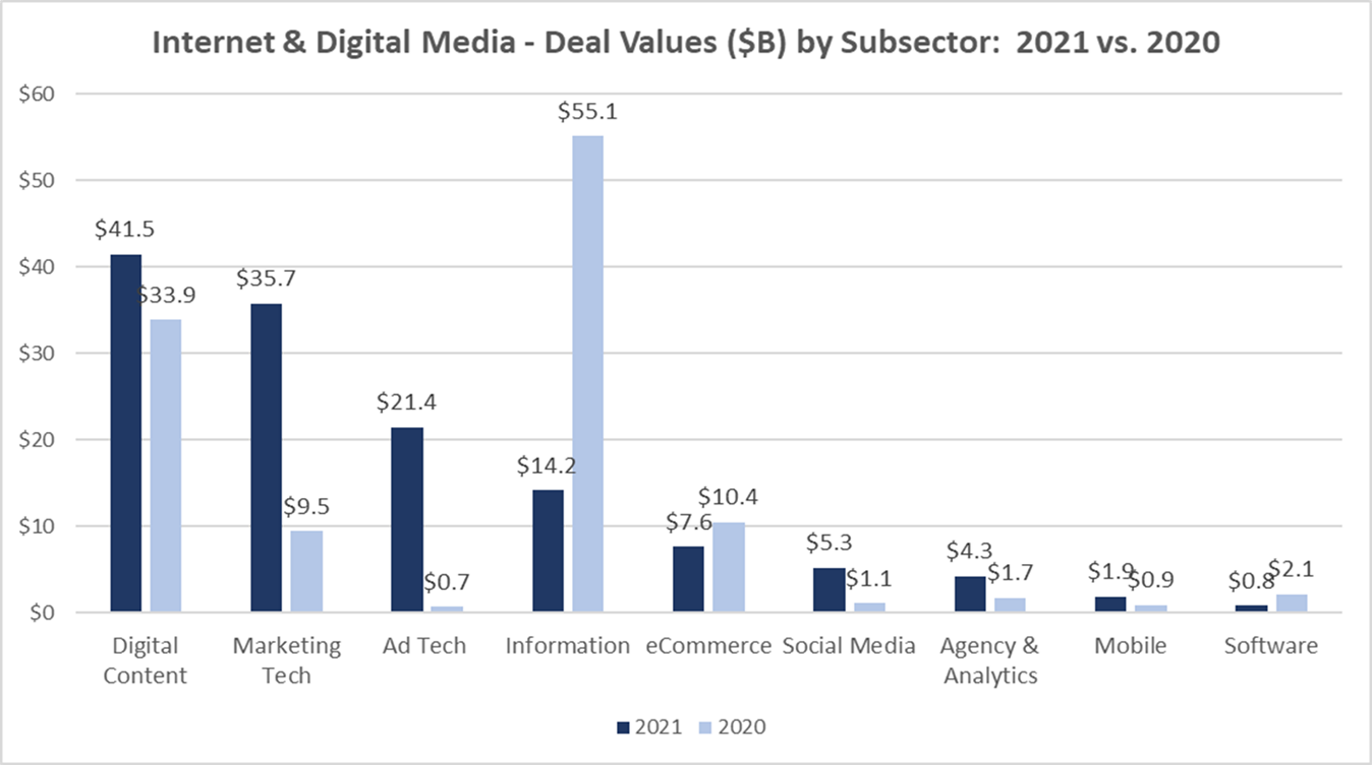
As shown in the chart on the previous page, deal values increased by over 30x in the Ad Tech sector in 2021 relative to 2020. Reverse mergers with SPACs were behind the growth in deal value, driven by the $10B reverse merger involving in-app advertising company AppLovin (APP) and the $2B reverse merger involving content discovery company Taboola (TBLA).
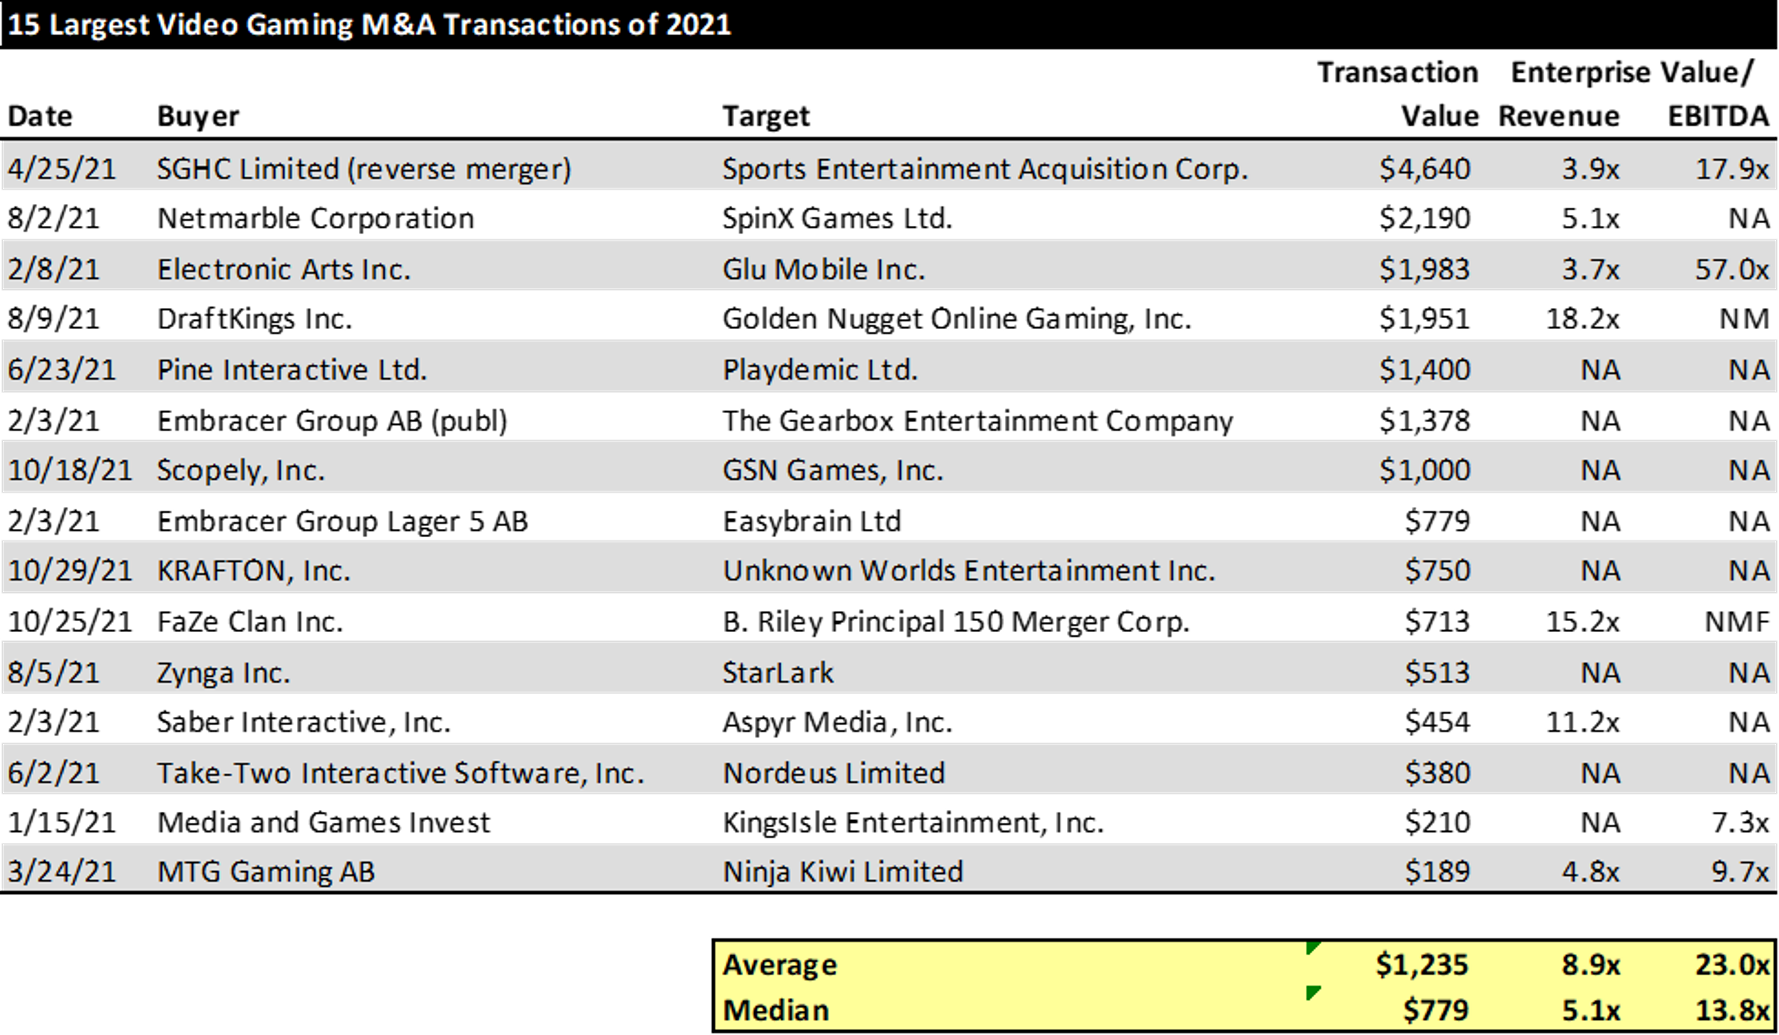
What is notable about the $41.5 billion in Digital Content deals is that much like 2020, the video gaming sector represented the largest subsector by far, coming in at $19.6 billion, or 47% of the Digital Content sector’s total deal value. The $19.6 billion is an 11% increase over the $17.7 billion in deal value in the gaming sector in 2020, when gaming deals represented 52% of all Digital Content transactions.
2022 is off to a strong start with Take-Two Interactive’s (TTWO) $12 billion announced acquisition of Zynga to start the week. A look at the largest Gaming M&A transactions of 2021 is provided in the chart below.
4Q 2021 – Deal Activity Remained Elevated
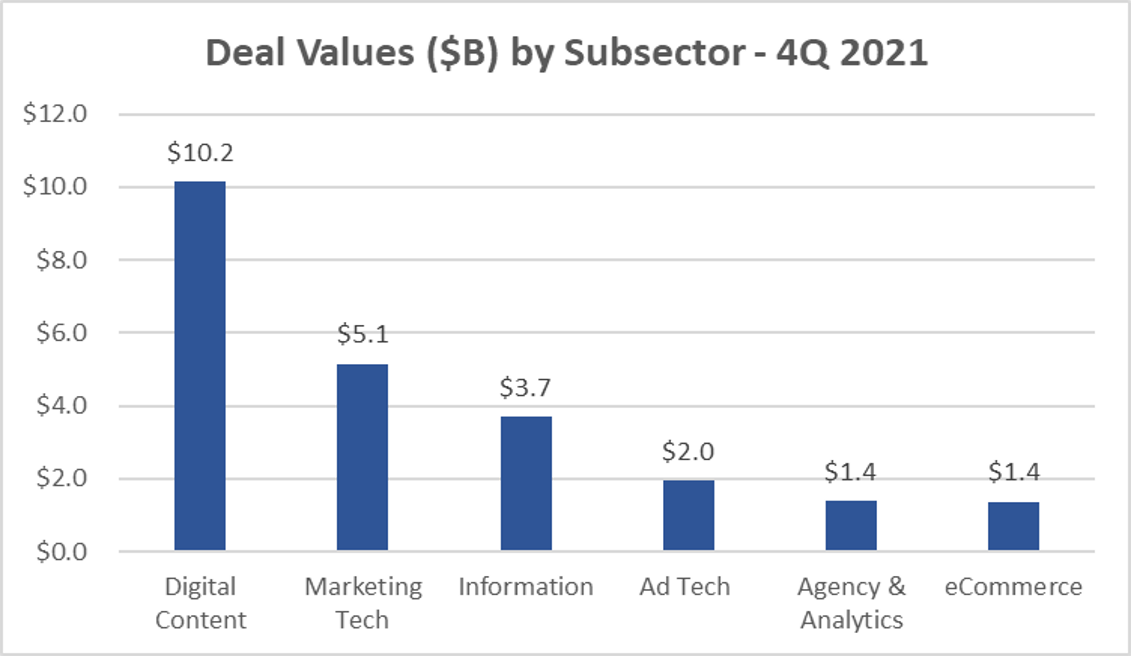
Deal activity remained elevated in the fourth quarter of 2021, as Noble tracked 168 transactions, which was a 6% increase over 4Q 2020 deal activity of 158 deals. Deal values in 4Q 2021 were $24.1 billion, a decrease of 63% versus 4Q 2020 deal value of $65.6 billion, which primarily reflects the $44 billion announced acquisition of IHS Market by S&P Global in 4Q 2020. Excluding the IHS Market deal from 4Q 2020, deal value increased by 11%, despite there being a fewer number of deals in 4Q21 (45) where purchase prices were revealed than in 4Q 2020 (58 deals).
In the fourth quarter of 2021, the most active sectors from a deal volume perspective were Digital Content sector with 53 deals, followed by Marketing Technology (35 deals) and the Agency & Analytics sector (28). These three sub-sectors have consistently been the most active sectors for M&A in recent years. From a deal value perspective, the strongest sectors were Digital Content ($10.2 billion), Marketing Tech ($5.1 billion) and Information Services ($3.7 billion).
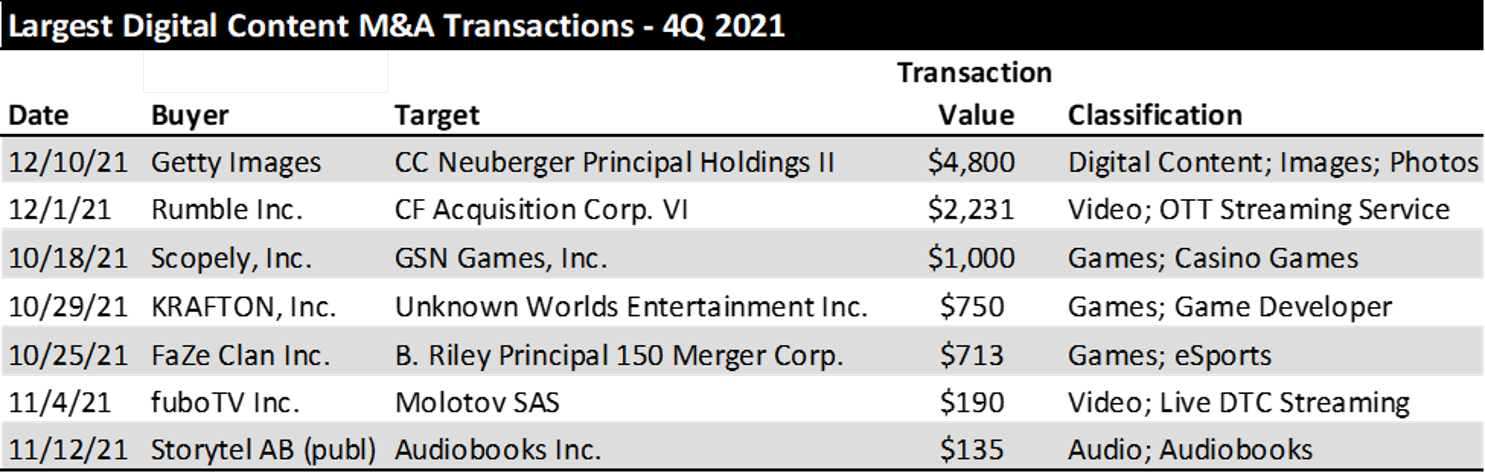
Deals in the digital content sector with deal values more than $100 million are shown below. It is notable that the biggest deals in the digital content sector were M&A deals in the video gaming sector and the streaming video or over-the-top (OTT) sectors. It is also notable that 3 of 7 largest deals in the sector were driven by SPACs, including the $4.8 billion acquisition of photo/imaging company Getty Images, the $2.2 billion acquisition of “content neutral” streaming service Rumble, and the $713 million acquisition of eSports company FaZe Clan.
We expect continued M&A activity in 2022, particularly given significant amounts of unspent capital at private equity funds and the record amount of SPAC IPOs in 2021, many of which are looking to acquire companies in the Internet and Digital Media sector.
For Key Growth Drivers, Continue to Watch Retail Media and Connected TV
Retail Media: A year ago we mentioned Retail Media and Connected TV (CTV) as sectors to keep an eye on. The pandemic related surge in ecommerce sales led to accelerated growth in retail media (also known as ecommerce channel advertising). Retail media is display or search ads that appear on retailer platforms and direct users to products available for purchase there. Earlier this week, Best Buy announced that it was launching its own in-house ad business, Best Buy Ads. Best Buy has now joined major retailers such as Amazon, Kroger, CVS and others that are taking advantage of increasing ecommerce sales and the importance of first-party data. eMarketer projects retail media increased by over 50% to $31.5 billion in 2021 and will exceed $50 billlion in spending in 2023, with 2/3 of the revenues coming from sponsored ads and 1/3 coming from display ads, with display gaining share in coming years.
Connected TV: Growing slightly faster albeit it off a smaller base is Connected TV advertising, which eMarketer expects to have increased by 60% or by $5 billion to $14.4 billion in 2021. eMarketer projects it go grow by another $5 billion or 32% to $19 billion in 2022, and is projected to reach nearly $30 billion by 2024. The three biggest players in this space are Roku, YouTube and Hulu, which should account for approximately half the revenues. However, several ad tech companies are well positioned to reap the benefits of connected TV advertising. Growth in this sector is being driven by 1) a large and growing base of households with CTV devices; 2) the proliferation of subscription and ad-supported streaming media content, and 3) the robustness of CTV ad monetization, as advertisers “follow eyeballs” to CTV viewing.
TRADITIONAL MEDIA COMMENTARY
The following is an excerpt from a recent note by Noble’s Media Equity Research Analyst Michael Kupinski
Overview
A Promising 2022 Outlook
Looking back on 2021, it was a disappointing year. The advertising recovery was strong, but did not rebound as nicely as one would expect. The level of government stimulus supported the prospect of a very strong economic and advertising recovery. Supply chain issues, waves of Covid infections as variants emerged and vaccine mandates kept workers and businesses in a tepid environment. The important auto category did not bounce back as the new car supply was hampered by semiconductor chip shortages. Most advertising mediums did not fully recover revenues to 2019 levels as initially hoped given the rebounding economy. As we look forward toward 2022, most media executives anticipate a strong advertising year, fueled by a continued favorable economy, a return of auto advertising as supply chain issues abate, and due to the influx of political advertising. This is the year that advertising recovers to exceed 2019 levels. That is the promise of 2022. If it doesn’t recover to above 2019 levels, especially with the influx of political advertising, there are bigger problems.
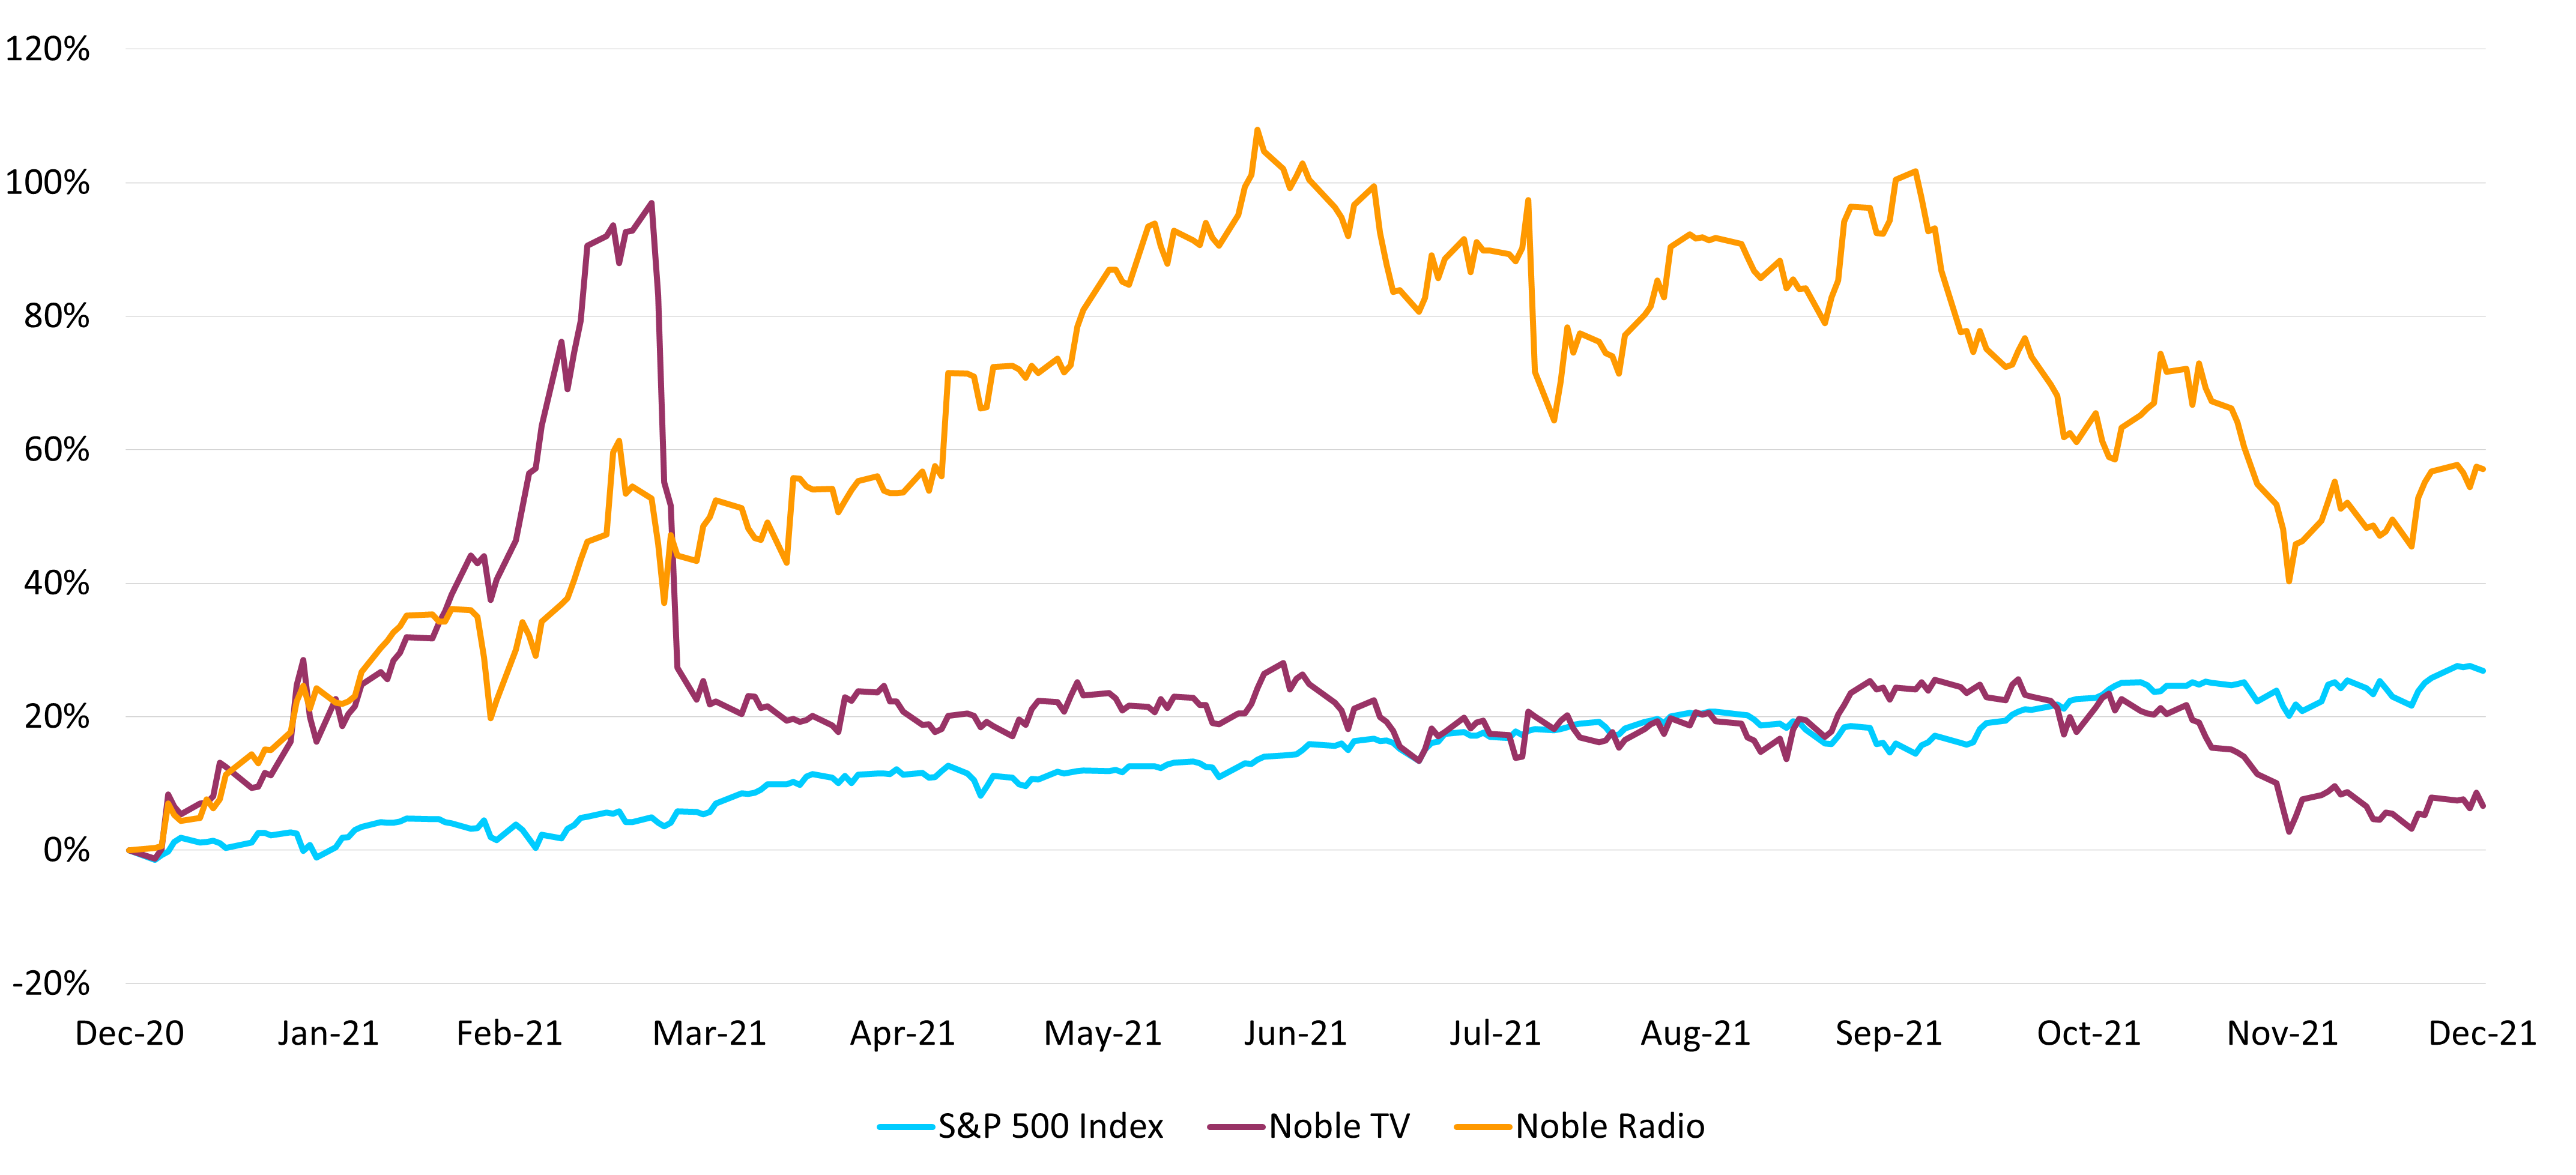
Investors already appear concerned about inflation and the prospect of a rising interest rate environment. The Federal Reserve has hinted that there may be as many as 3 interest rate increases in 2022. In the past, consumer cyclicals do not do well during these periods. As such, investors appear to be setting expectations low for market returns. To some degree, media stocks already anticipate the rising interest rate environment. Over the past year, many mediums have underperformed the general market as measured by the S&P 500 Index, with Television stocks particularly disappointing. This is very unusual for Television stocks. Typically, TV stocks do well in the year prior to Olympic and election years. But, after an early strong stock performance in the first part of the year, TV stocks faded in the fourth quarter 2021, which we address in the Broadcast TV section of this report. We would note that many of our closely followed media stocks had some of the strongest performance in 2021, beating the general market and outperforming respective media peer sets. We believe that the media stocks will climb the wall of worry in 2022. Stock valuations do not appear to be extended and the fundamental environment appears favorable. As such, Noble’s research analysts remain constructive on selective media stocks for 2022.
Broadcast Television
Will it be a Gray Year?
TV stocks started the year nicely, but the performance faded in the second half of the year. Noble’s market-cap weighted Broadcast TV Index was heavily influenced by the weak performance of the shares of Viacom and Sinclair Broadcasting, both were down near 20% for the year. Notably, the average TV stock was up 31% for the year, which is more in line with the historic performance for the group in the year prior to an Olympic and election year. For the past 20 years, the TV stocks gain an average 22% in the odd number year. Furthermore, there were some notable stock performance stand outs. Entravision (EVC) led the stock performance for the year up a remarkable 145%. The extraordinary performance was driven by the company’s digital transformation through attractive acquisitions.
As we look forward toward 2022, we believe that the fundamental environment for the TV broadcasters appears favorable. In our view, the key auto advertising category should gain traction as supply issues abate. In addition, a rising interest rate environment may actually serve to increase auto advertising as dealerships step up efforts to get consumers in the door and to build brand awareness. Furthermore, the industry should benefit from the influx of political advertising. While all indications are that political advertising will exceed 2020 levels, we are still somewhat cautious about that prospect, but expect an outsized political advertising year, nonetheless. One of our current favorites in the industry did not perform as well in 2021, namely Gray Television (GTN), which increased a moderate 12% in 2021. We believe that the shares may have underperformed due to the fog of acquisitions. The company has an incredible platform to participate in the influx of political advertising. In addition, the company has an incredible history of integrating acquisitions and outperforming the fundamentals of the industry.
Broadcast Radio
An “A” for Performance
Radio stocks had an extraordinary year as investors regained confidence that the industry will still be around. The Noble Radio Index increased 57% for the full year 2021, nicely outperforming the general market, as measured by the S&P 500 Index, which was up 28%. During the depths of the pandemic in 2020, some broadcasters tripped debt covenants creating concern that some high-profile companies will need to be reorganized. As such, the Radio stocks rebounded as the economy and advertising environment improved and as companies sought debt covenant waivers or refinanced. The Noble Radio Index is market weighted. As such, there were some extraordinary stock performances that exceeded the Noble Index in 2021. Salem Media, one of our closely followed stocks, increased an incredibly strong 194% and led the list of the strongest performer in 2021. In addition, the shares of Townsquare Media increased 100%.
We do not look for such extraordinary stock performances to recur in 2022. The fourth quarter stock performance highlights some of the issues that investors will need to grapple with. The Noble Radio index decreased 22% in the fourth quarter reflecting concern over a rising interest rate environment and the prospect of a slowing economy. Many in the industry still have significant debt leverage. As such, concern over the economy and the advertising environment likely will have an outsized impact on the industry. We believe that 2022 will be a year of moderating revenue trends and likely moderating stock price performances. Nonetheless, we believe that there will be a generally favorable environment for Radio stocks and room for attractive upside appreciation potential. Most radio broadcasters are likely to continue to expand into areas of faster revenue and cash flow growth, namely Digital, with some moving well beyond advertising supported media.
DOWNLOAD THE FULL REPORT (PDF)
View the PDF version for segment analysis, M&A activity, and more…
Noble Capital Markets Media Newsletter Q4 2021
![]()
This newsletter was prepared and provided by Noble Capital Markets, Inc. For any questions and/or requests regarding this news letter, please contact >Chris Ensley
DISCLAIMER
All statements or opinions contained herein that include the words “ we”,“ or “ are solely the responsibility of NOBLE Capital Markets, Inc and do not necessarily reflect statements or opinions expressed by any person or party affiliated with companies mentioned in this report Any opinions expressed herein are subject to change without notice All information provided herein is based on public and non public information believed to be accurate and reliable, but is not necessarily complete and cannot be guaranteed No judgment is hereby expressed or should be implied as to the suitability of any security described herein for any specific investor or any specific investment portfolio The decision to undertake any investment regarding the security mentioned herein should be made by each reader of this publication based on their own appraisal of the implications and risks of such decision This publication is intended for information purposes only and shall not constitute an offer to buy/ sell or the solicitation of an offer to buy/sell any security mentioned in this report, nor shall there be any sale of the security herein in any state or domicile in which said offer, solicitation or sale would be unlawful prior to registration or qualification under the securities laws of any such state or domicile This publication and all information, comments, statements or opinions contained or expressed herein are applicable only as of the date of this publication and subject to change without prior notice Past performance is not indicative of future results.
Please refer to the above PDF for a complete list of disclaimers pertaining to this newsletter