INTERNET AND DIGITAL MEDIA COMMENTARY
Internet & Digital Media Stocks – Investors Rewarded with Exceptional Returns in 2023
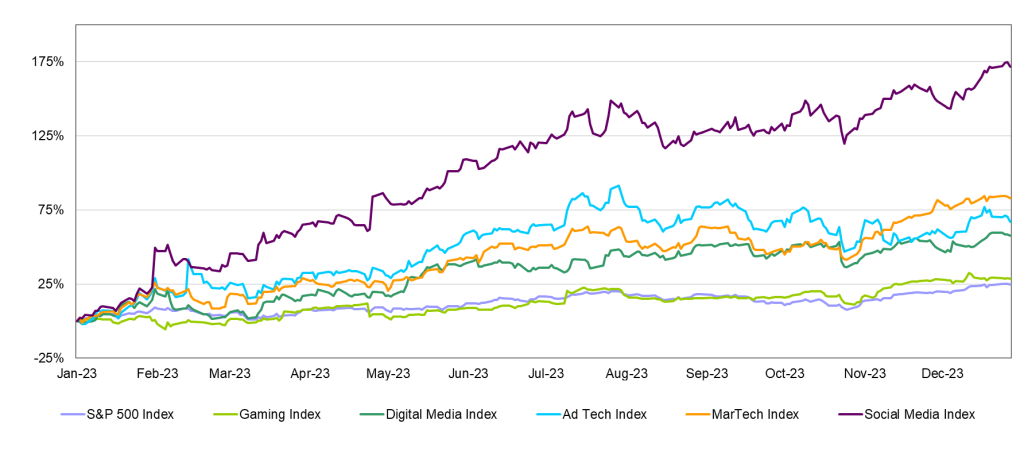
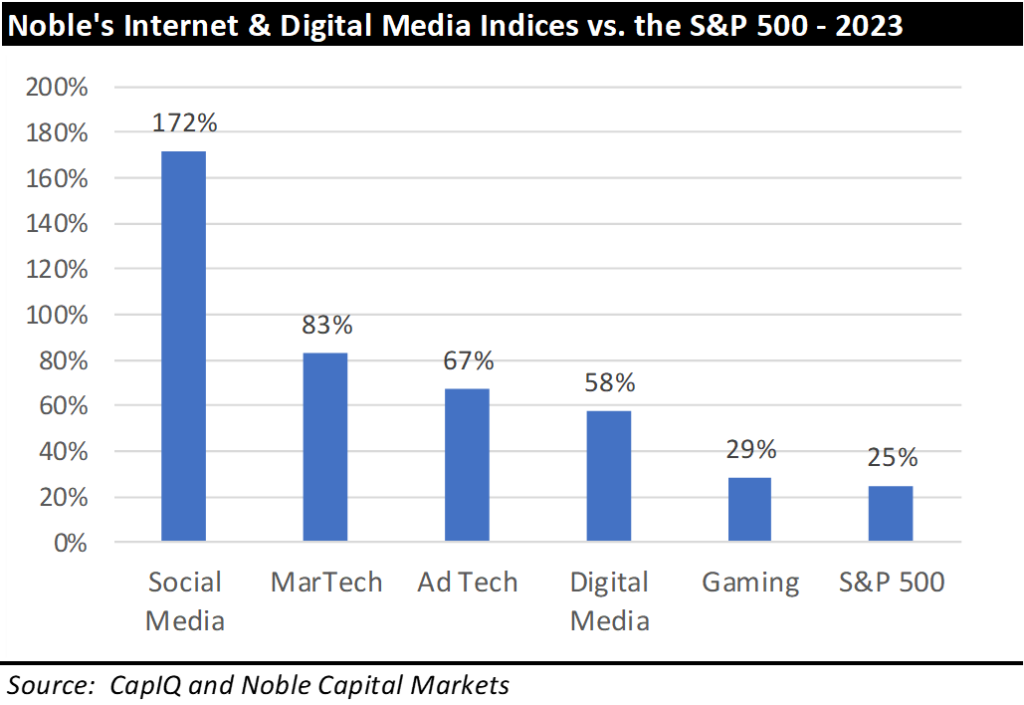
A year ago, we wrote that we were seeing signs of life in the Internet and Digital Media sectors and saw the possibility of a better year ahead. Not only was it a good year, but it was a great year for investors in these sectors. The S&P 500 was up 25% in 2023, a healthy return but one that pales in comparison to the performance of each of Noble’s Internet and Digital Media Indices. Noble’s Social Media Index finished the year up 172%, followed by Noble’s MarTech (+83%), AdTech (+67%), Digital Media (+58%) and Video Gaming (+29%) indices.
Noble’s indices are market cap driven, and last quarter we noted that while each sector performed well, it was primarily due to the largest cap stocks in each of them. In 4Q 2023, we saw that strength broaden and deepen, with mid- and small-cap stocks also joining the “party”.
STOCK MARKET PERFORMANCE: INTERNET AND DIGITAL MEDIA

Interestingly, this increase in performance from mid- and smaller cap stocks did not result in a material outperformance relative to the S&P 500 in the fourth quarter. The S&P 500 increased by 11% in 4Q 2023, but only two of these indices outperformed the broader market during this period: Noble’s MarTech Index (+24%) and Social Media Index (+19%). Noble’s Video Gaming Index (+11%) was up in-line with the S&P 500, while Noble’s Digital Media (+9%) and Ad Tech (+0%) indices underperformed. In short, while the mega cap stocks continued to outperform, this outperformance was matched or exceeded by mid- and small-cap stocks in the fourth quarter.

Meta, Snap, and Grindr All Lead the Social Media Index Higher
Noble Indices are market cap weighted, and we attribute the relative strength of the Social Media Index to its largest constituent, Meta (META, +194%). Meta shares were up 194% for the year, including 18% in the fourth quarter. As noted before in this newsletter, Meta shares bottomed in November 2022 at $89 per share and began to recover when management decided to no longer invest as heavily in the metaverse and instead ordered a major cost-cutting initiative that included thousands of layoffs and re-focused the company’s resources toward new social media products (i.e., Threads) and generative AI (artificial intelligence).
Other social media stocks such as Snap (SNAP, +89%) and Grindr (GRND, also +89%) significantly outperformed. Snap shares increased as the company’s revenue returned to growth in the third quarter after declines in the first and second quarter of the year. Grindr went public via SPAC in 4Q 2022 and its shares stumbled out of the gate but performed exceptionally well, especially in 4Q 2023 (+53%) as the company continued to post 40%+ revenue growth and 50%+ EBITDA growth. There is no better recipe for share price appreciation than beating Street estimates and raising guidance.
MarTech Stocks Recover Strongly After Challenging 2022
Investors in the marketing technology sector were also rewarded in 2023. Noble’s MarTech Index increased by 83%, led by Shopify (SHOP, +124%), Hubspot (HUBS, +111%), Salesforce (CRM, +99%) and Adobe (+77%). MarTech stocks suffered in 2022 from a market reset in revenue multiples that began when the Fed began raising rates.
Another reason Noble’s MarTech Index was down 52% in 2022 was that most every company in this sector did not have operating profits or positive EBITDA, as companies in this sector, like most SaaS-based businesses were being operated to maximize revenues, not profitability. MarTech companies appear to have gotten the message in 2023 and made great strides in terms of operating profits. On average, operating margins significantly improved from low double-digit negative margins in 2022, to low single digit negative margins in 2023.
AdTech Stocks Rebounded Strongly in 2023
Noble’s Ad Tech Index increased by 67% in 2023, and returns were relatively widespread with more than half the stocks in the index posting double digit returns, led by Direct Digital Holdings (DRCT, +514%), AppLovin (APP, +278%), Inuvo (+92%), Double Verify (DSP, +68%), Interactive Ad Science (IAS, +64%) and The Trade Desk (+61%). Shares of Direct Digital Holdings increased by 481% in the fourth quarter alone, as the company reported significantly stronger than expected revenue and EBITDA and guided to significantly higher than expected 4Q 2023 revenue and EBITDA as well. Companies such as Double Verify, and Interactive Ad Science likely benefited as their ad platforms are designed to verify inventory and reduce fraud and waste. The Trade Desk has also developed initiatives to address “cookie deprecation” (in which Google will end support for third-party cookies, or tracking tags). It would appear that investors in the second half of 2024, investors sought out Ad Tech companies that are well positioned for this change.
A Widespread Recovery in the Digital Media Sector
Noble’s Digital Media Index increased by 58% in 2023 with 8 of the 12 stocks in the index posting double digit stock price returns, led by Spotify (SPOT, +138%), Travelzoo (TZOO, +114%), Fubo (FUBO, +83%), and Netflix (NFLX, +65%). Spotify posted double digit revenue growth while keeping expenses in check which resulted in a solid operating profit in 2023. The company is making progress on converting its growing user base to a healthy profit. Consensus Street estimates have Spotify’s EBITDA improving from a loss of nearly $250 million in 2022 to a gain of $650 million in 2024. Meanwhile, Travelzoo appears to be firing on all cylinders with revenue increasing by double digits in each of their U.S., European and Jack’s Fight Club businesses. Travelzoo appears to be in the sweet spot of the economic cycle in which demand for travel is strong, but not so strong that the company’s clients (airlines, hotels, cruise lines, car rental companies, etc.) don’t need to advertise to drive incremental demand.
We attribute much of the strong performance in 2023 in the Internet and Digital Media sectors to a change in investor sentiment most likely based upon the view that rather than go into recession, the U.S. economy may be more likely to incur a soft landing. How this plays out in 2023 is likely to be the key to the performance of these industries in 2024.
2023 M&A – Deal Activity Flat while Deal Values Decline by Nearly 80%
It should not surprise anyone that M&A in the Internet and Digital Media sectors was down in 2023. For starters, 2022 was a very strong year for M&A, with deal values up 71% over 2021 levels. On top of this difficult comparison, the M&A market in 2023 had to contend with numerous headwinds, including geopolitical tensions, inflation, rising interest rates, increased regulatory scrutiny and an uncertain economic outlook. In light of all of these obstacles, it is surprising then, that the number of deals we monitored in the Internet and Digital Media sectors in 2023 was flat compared to 2022 (685 deals announced in 2023 vs. 683 deals announced in 2022). This result would appear to be heroic were it not for the fact that total M&A deal values were down 79% in 2023 ($51 billion in announced deal values in 2023 vs. $243 billion in announced deal values in 2022). Given the aforementioned headwinds, perhaps it is not surprising that the animal spirits to conduct large transactions waned in 2023.
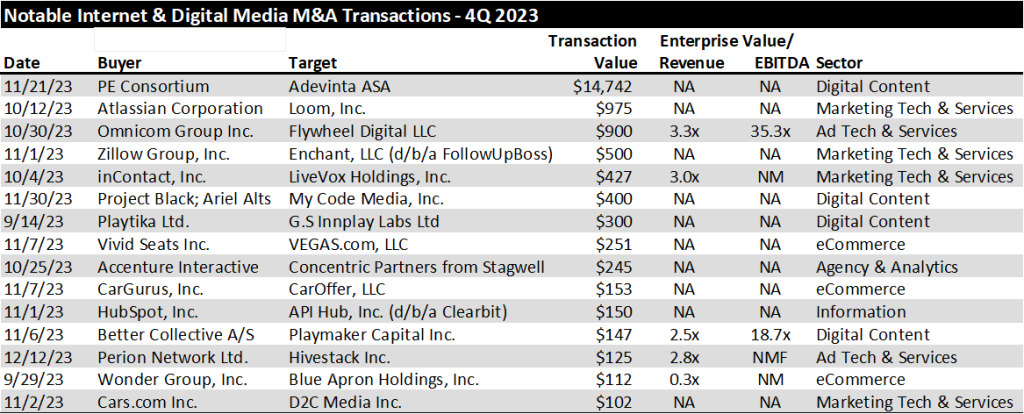
The biggest difference in the announced deal values was the number of “scaled transactions” in 2022 vs. 2023. A year ago we called 2022 the Year of the Mega Deal. For example, the were 6 announced deals in the Internet and Digital Media sectors with deal values exceeding $10 billion in 2022 vs. only one deal in 2023. In 2022, Microsoft announced its $69 billion acquisition of Activision Blizzard and Elon Musk announced his $46 billion acquisition of Twitter. In 2023, the only “scaled transaction” in the Internet and Digital Media sectors was the $14.6 billion acquisition of online classifieds company Adevinta ASA from a consortium of U.S. based private equity firms (General Atlantic, Permira and Blackstone).
4Q 2023 M&A: Greenshoots?
Fortunately, there was a silver lining in the fourth quarter of 2023. Deal activity picked up substantially on a sequential basis. We monitored 199 announced transactions in 4Q 2023, up 50% over the 132 announced deals 3Q 2023. Deal values in the fourth quarter of 2023 were also encouraging. We monitored $20.1 billion in announced deal values last quarter, up 132% from the $8.7 billion in announced deals in 3Q 2023, as shown in the chart below.

From a deal activity perspective, the most active sectors we tracked were Digital Content (56 deals), Marketing Tech (54 deals), Agency & Analytics (46 deals), followed by eCommerce (16 deals) and Information (16 deals). From a deal value perspective, the Digital Content sector had the largest dollar value of transactions ($15.8 billion, driven by the Adevinta deal), followed by MarTech ($2.2 billion), and AdTech ($1 billion).

The largest deals by dollar value in the fourth quarter of 2023 are shown below.

With stock prices recovering and the prospects for a soft landing improving, we believe the stage is being set for an improvement in the M&A environment in 2024. A key to this outlook will be how soon and how fast the Federal Reserve begins to lower interest rates. If inflation remains stubborn and rates remain higher for longer, then the recovery in M&A deal values is likely to take longer. However, if rates begin to ease, it will remove a key impediment to closing transactions in 2024.
TRADITIONAL MEDIA COMMENTARY
The following is an excerpt from a recent note by Noble’s Media Equity Research Analyst Michael Kupinski
Overview – Optimism for a Good 2024
The fortunes of advertising-based companies are driven by the economy and the health of the consumer. As such, we start this report with our take on the economy in 2024. On December 4th, at Florida Atlantic University (FAU) in Boca Raton, Florida, Noblecon19 hosted an economic panel to discuss the business environment outlook for 2024. The economic panel consisted of a diverse group of industry professionals with a wide range of expertise and experience. In our economic outlook for 2024, we take into consideration the perspective of Jose Torres, Senior Economist at Interactive Brokers.
Mr. Torres highlighted 2023 as a resilient year for consumer spending, which was driven by excess pandemic savings accumulated in 2020 and 2021. Mr. Torres anticipates a slowdown in consumer spending and a strong labor market in 2024. Notably, he believes a resilient labor market will keep consumers spending and will keep the country from falling into a recession. Additionally, Mr. Torres highlighted that Personal Consumption Expenditures (PCE) annualized inflation over the last six months is running near 2.5%, which is very close to the Fed’s goal of 2.0%. With moderating inflation pressures, Mr. Torres highlighted that the Fed is likely to cut rates in March of 2024, which would be beneficial for small and mid-cap companies. While Mr. Torres largely has a positive outlook for 2024 and beyond, a point of concern was the federal government’s growing interest expense on debt, he noted that the government will eventually have to reduce spending or accept 3% – 3.5% inflation over the long-term.
The general U.S. economy is expected to soften in 2024, particularly in the first half, with a prospect that the economy could slip into recession. Our economic scenario for 2024 anticipates the economy will soften in the first half of the year and rebound in the second half of the year due to the prospect of a lower interest rate environment and resilient labor market.
The video of the Economic Perspectives panel may be viewed here.
STOCK MARKET PERFORMANCE: TRADITIONAL MEDIA

Small Cap Cycle?
Small cap investors have gone through a rough period. For the past several years, investors have anticipated an economic downturn. With these concerns, investors turned toward “safe haven” large cap stocks, which by and large can weather economic downturns and have significant trading volume should investors need to sell the stock. Notably, there is a sizable valuation disparity between the two classes, large cap and small cap, one of the largest since 1999. Some of the small cap stocks we follow trade at a modest 2.5 times Enterprise Value to EBITDA, compared with large cap valuations as high as 15 times. We believe the disparity is due to higher risk in the small cap stocks, given that some companies may not be cash flow positive, have capital needs, or have limited share float.
However, investors seem to have overlooked small cap stocks with favorable fundamentals. While small cap stocks are more speculative than large caps, many are growing revenues and cash flow, have capable balance sheets, and/or are cash flow positive. In our view, the valuation gap should resolve itself over time for attractive emerging growth stocks. Some market strategists suggest that small cap stocks trade at the most undervalued in the market.
Dan Thelen, Managing Director of small cap equity at Ancora Advisors, highlighted the valuation gap between small cap and large cap stocks during the economic panel at Noblecon 19. Mr. Thelen noted that investors haven’t recognized the risk mitigation efforts small cap companies have undertaken in the high interest rate environment. He believes that changes small cap companies have implemented are not reflected in stock prices and should be a tailwind moving forward.
2024 Advertising Outlook
In our advertising outlook for 2024, we take into consideration the perspective of Lisa Knutson, Chief Operating Officer (COO) of E.W Scripps. Ms. Knutson is on the frontline of the economy as one of the largest TV broadcasters in the country. As a speaker on the Noblecon 19 economic panel, she depicted the local and national advertising markets as a tale of two cities. Notably, Ms. Knutson highlighted resilience in local advertising and sequential improvement over the past few quarters in the auto advertising category. Additionally, she highlighted green shoots in local advertising, particularly in the services, home improvement and retail advertising categories. Importantly, political ad spend for the 2024 election cycle is expected to be approximately $10 billion, which is roughly a 13% increase from 2020. About half of the high margin political advertising dollars are expected to be spent with television broadcasters.
Digital Advertising – Decelerating Revenue Growth, But Faster Than Other Advertising Categories
Digital advertising has been growing rapidly over the past several years, bolstered by chord-cutting trends and generally, by an increasingly digital world. Digital Advertising includes various categories of advertising, such as audio, video, influencer, search, banner, and others. According to Statista, U.S. Digital Advertising spending is expected to grow at 15% Compound Annual Growth Rate (CAGR), from 2017-2028, from $90.1 billion to $402.1 billion. The chart below illustrates U.S. Digital Advertising Spend from 2017 to 2028, which is inclusive of the various different sub-categories of digital advertising.

Specifically in 2024, U.S. digital advertising is expected to grow a healthy 10% above 2023 levels, according to Statista. There are some categories of digital advertising that are expected to grow especially fast in 2024, such as Connected TV (CTV) advertising, programmatic advertising, and influencer advertising. All three categorizations of digital advertising are estimated to have above-average growth in 2024. According to Statista, influencer advertising in the U.S. will grow at 14% in 2024, while, according to eMarketer, U.S. programmatic and CTV advertising will grow at 13% and 17%, respectively.
In our view, there are several key factors strengthening these verticals. For example, influencer advertising allows brands to reach younger demographics through personalities those demographics trust. Moreover, during a time when there is uncertainty around the future of cookies and other forms of User IDs for targeted advertising, influencer advertising offers an alternative vehicle for audience targeting. Google has indicated plans to no longer use cookies to deliver advertising in 2024, although the implementation of this plan has been delayed before. Additionally, we believe chord cutting is major factor in the growth of connected TV. We believe this could be a strong growth vertical for programmatic digital advertising.
Traditional Media
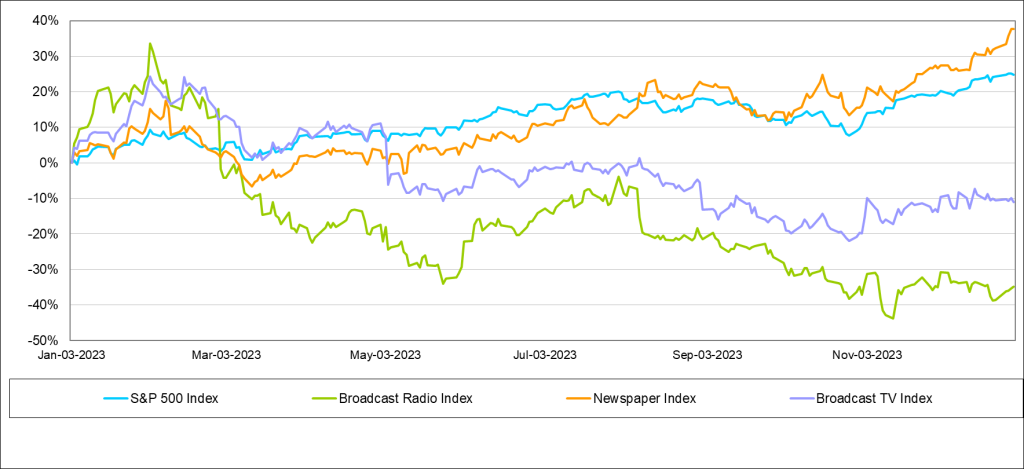
The Newspaper Index was the only traditional media sector that outperformed the general market in the past quarter and trailing 12 months. In the latest quarter, Newspaper stocks outperformed the general market, up 20% versus down 11% for the general market as measured by the S&P 500 Index. Notably, our index performances are market cap weighted, meaning larger cap stocks have a greater impact on index return than small cap stocks. In Q4, only two stocks in the Newspaper index, NYT and NWSA, posted positive returns. These are the largest cap stocks in the index. In Q4, NWSA and NYT were up 22% and 19%, respectively. For full-year 2023, four out of the five companies in the Newspaper index posted positive returns, with the strongest performers being NYT and NWSA, up 51% and 35%, respectively. The Broadcast TV Index was up a modest 5% for the fourth quarter and down 11% over the past year. The worst performing index over the last quarter was the Radio Broadcast index, down on 11% in the fourth quarter. Additionally, the Radio Index was the worst performing group over the last year as well, down 35%. While the Radio Broadcast Index and Broadcast TV Index had a tough year in 2023, we believe both indices should improve in 2024.
Broadcast Television
The Television industry had a tough year with soft core advertising and the absence of the year earlier political advertising. Television revenues are estimated to have declined as much as 20% in 2023 inclusive of the absence of year earlier political advertising. Total core television advertising is expected to have declined 3% in 2023, which excludes Political advertising, reflecting disproportionately weak national advertising and resilient local advertising. Importantly, television advertising accounts for less than 50% of total television revenue, with retransmission revenue largely accounting for the balance. With growth in retransmission revenue, we estimate that total television revenue declined roughly 10% in 2023.
We believe that revenue trends will improve in 2024 for the TV industry, supported by an influx of political advertising and moderating trends in core national advertising. Nonetheless, given the exceptional political advertising year that is expected, core advertising is expected to decline in 2024, with some advertising being displaced by the large volume of political. We anticipate that core advertising will decline roughly 2.3% in 2024, with total TV advertising up nearly 30% (including the influx of Political). Total television revenue, which includes retransmission revenues, are expected to increase roughly 20%.
We believe that the TV industry has some long-term fundamental headwinds, which include continued weak audience trends, cord cutting (which adversely affects retransmission revenue growth opportunities) and shifts in national advertising toward digital advertising. Offsetting these trends are Connected TV and prospects for new revenue opportunities offered by the new broadcast standard, ATSC 3.0. Importantly, the very high margin political advertising every even year allows the industry to reduce debt and/or return capital to shareholders.
Broadcast Radio
Based on our estimates and our closely followed companies, radio advertising is expected to have decreased 5.5% for the full year 2023 as illustrated in the chart below. This decline reflected the adverse impact of rising interest rates and significant inflation, which hurt many consumer-oriented advertising categories, as well as financials. In addition, we believe that radio struggled with some headwinds from declines in listenership, as many consumers continue to work remotely post Covid pandemic. Local advertising was more resilient than national advertising, which tends to be more economically sensitive.
We estimate that local advertising was down 6%, while national was down 19%. The results are expected to reflect the absence of political advertising from the year earlier biennial elections. Broadcast digital advertising was a bright spot, increasing 6%, largely offsetting the decline in national revenue.
Looking forward toward 2024, we expect radio advertising trends to improve throughout the year, with the expectation that December 2023 may have been the trough for this economic cycle. Both local and national advertisers should begin to anticipate improved economic conditions with the expectation that the Fed will lower interest rates late in the first quarter. Even though the economy is anticipated to continue to weaken in the first half 2024, advertisers may advertise to drive customer traffic in anticipation of improved economic conditions. We anticipate that the year will start off weak, with the first quarter 2024 revenue expected to be down, but at a more moderate decrease of between 3% to 4%. Notably, the industry does not receive a significant amount of political advertising in the first quarter.
In 2024, we expect consumer spending to soften, which will have an adverse effect on consumer-oriented advertising, particularly retail. Auto advertising is expected to buck that trend. In our view, auto manufacturers and dealers will likely increase advertising and promotions to lure consumers. Assuming lowered interest rates, we expect that the financial category should improve in the second half of the year as well. Revenues are expected to be second half weighted, with improving core advertising trends and the benefit of the influx of political advertising.
Radio does not typically receive a significant amount of political advertising, but it accounts for a meaningful 3% of total core advertising for the year. Political advertising largely falls in the third and fourth quarter. In addition, national advertising trends should improve in the second half as economic prospects improve. Digital advertising is expected to grow but more moderately than 2023, which is expected to be up 6%. We believe that Digital will increase near 5%, but some companies that have less developed digital businesses, should report faster growth.
In total, based on our closely followed companies, we anticipate Radio revenue growth of 5.6% in 2024. Our estimate is inclusive of our political advertising outlook.
DOWNLOAD THE FULL REPORT (PDF)
View the PDF version for segment analysis, M&A activity, and more…
Noble Capital Markets Media Newsletter Q4 2023

This newsletter was prepared and provided by Noble Capital Markets, Inc. For any questions and/or requests regarding this news letter, please contact Chris Ensley
DISCLAIMER
All statements or opinions contained herein that include the words “ we”,“ or “ are solely the responsibility of NOBLE Capital Markets, Inc and do not necessarily reflect statements or opinions expressed by any person or party affiliated with companies mentioned in this report Any opinions expressed herein are subject to change without notice All information provided herein is based on public and non public information believed to be accurate and reliable, but is not necessarily complete and cannot be guaranteed No judgment is hereby expressed or should be implied as to the suitability of any security described herein for any specific investor or any specific investment portfolio The decision to undertake any investment regarding the security mentioned herein should be made by each reader of this publication based on their own appraisal of the implications and risks of such decision This publication is intended for information purposes only and shall not constitute an offer to buy/ sell or the solicitation of an offer to buy/sell any security mentioned in this report, nor shall there be any sale of the security herein in any state or domicile in which said offer, solicitation or sale would be unlawful prior to registration or qualification under the securities laws of any such state or domicile This publication and all information, comments, statements or opinions contained or expressed herein are applicable only as of the date of this publication and subject to change without prior notice Past performance is not indicative of future results.
Please refer to the above PDF for a complete list of disclaimers pertaining to this newsletter.
