image credit: Brett Rogers (Pexel)
Some Color on Prices and the Market’s Fixation on Inflation
Stock market investors as a whole tend to rotate their worries and fixations. At times they place heightened importance on economic releases such as unemployment, consumer confidence, exchange rates, or inflation, at other times the focus is on other factors that will impact the economy and stock prices. We’ve recently seen these other factors include Covid19 vaccine availability, natural resource scarcity, and interest rates.
The current fixation is inflation. Is this worry appropriate under the current circumstances? We’ll explore this with an eye toward where further price increases may come from.
Demand-Pull Inflation
The market’s current fixation is on inflation – more specifically it’s on something called demand-pull inflation. Equity investors have become nervous that the money that continues to be created in trillion-dollar increments will pull prices upward as the increased ability or desire to spend remains in place. Demand-pull, which in the most simple terms means increased availability of money (wage increases, stimulus checks, higher employment levels) can spark inflation causing demand. The primary concerns that many view are at work now are money supply expansion, the growing economy, inflation expectations, government spending, and asset price increases.
Outside of the demand-pull theory, there are also supply-driven shortages caused by shutdowns and uneven demand that have driven up prices on lumber, paint, electronics, cars, and more. These are viewed as more temporary.
Causes of Demand-Pull Inflation
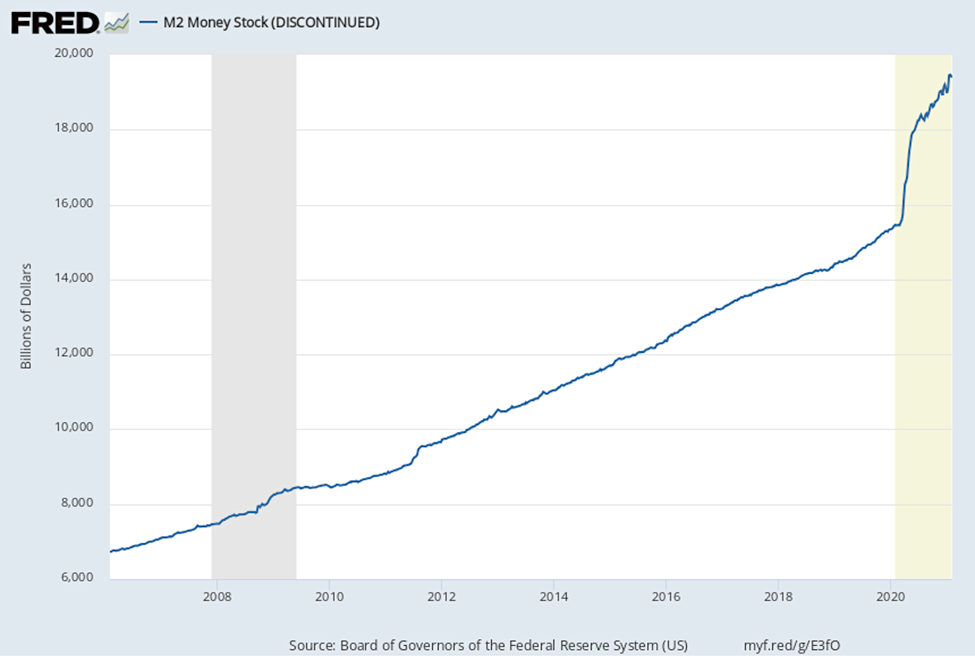
Money Supply Expansion- If there is an excess of money created and in circulation, prices of goods and services are bid up as demand for those goods and services increases. The same effect is created if interest rates are low and credit is easy; in these cases, more people have the ability to purchase a limited amount of goods.
The chart below shows the growth of M2, a money supply measure that includes cash, bank deposits, and other “cash-like” instruments such as money market accounts. The chart covers the period from February 2006 through February 2021. There is a very steep spike in the supply of M2 beginning in March of last year. The chart is not current as the Federal Reserve discontinued reporting this popular data series.

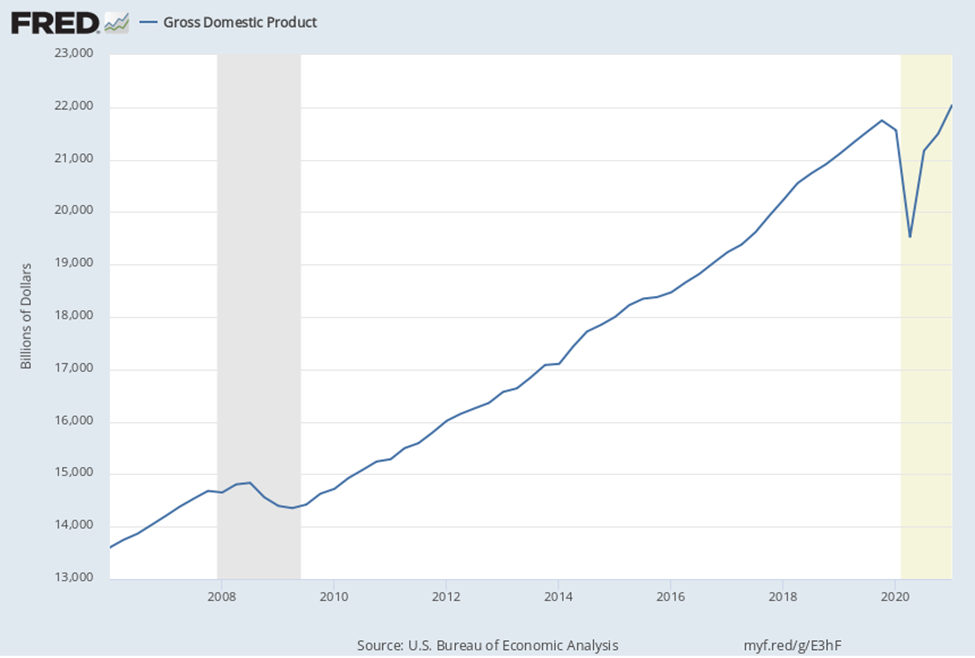
Growing Economy- An economy where jobs are being created and confidence is escalating feeds on itself as more people have a higher income to spend. This creates demand for products and services and the ability for businesses to increase prices. Workers may also review the price tag they put on their own labor as demand for employees grows. The employer then decides if the increased wage costs are passed along to the customers. In a growing economy, it’s much easier to pass along the increased cost of employees, which adds to consumer prices.
The chart below is of quarterly GDP and demonstrates just how remarkably strong the economic growth has been.

Inflation Expectations- Last month there was a dramatic increase in the price of used cars (10%), lumber prices have been climbing as well. Overall the consumer price index (CPI) has been surprised the markets by being even higher than expected. Seeing reported inflation tick up along with the increased money supply and economic growth causes consumers to buy sooner rather than later. This increases demand and of course, this demand pulls prices up.
The excerpt below is from the Bureau of Labor Statistics (BLS) released in mid-May. It highlights that the increase in used car prices for April 2021 is the highest ever recorded.

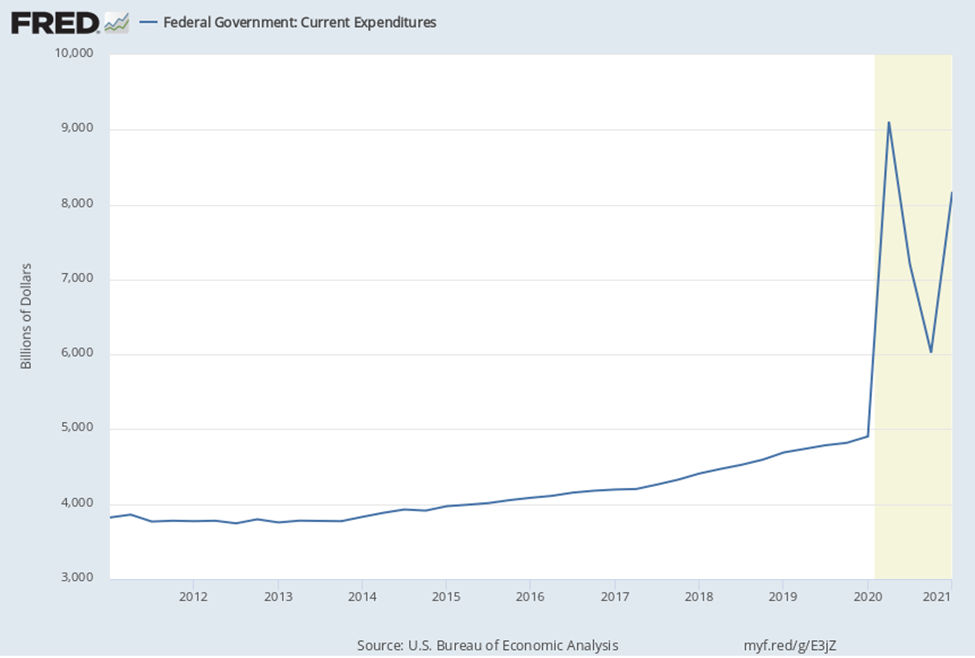
Government Spending- Increased spending increases demand for both raw materials and products. For example, if there are government-led infrastructure projects that require copper and steel, the cost for these may increase, this would then increase the cost of manufacturing homes, cars, and electronics that use the same raw materials. When those costs are passed along, it contributes to consumer inflation.
Similarly, a tax cut places more money in the hands of consumers; this also has a demand-pull impact on prices.
The chart below is of government expenditures. The peak period is Q2 2020, the dip and turnaround were Q4 2020. The trend appears to be continuing upward; recent announcements and proposals out of Washington suggest that it will accelerate sharply.

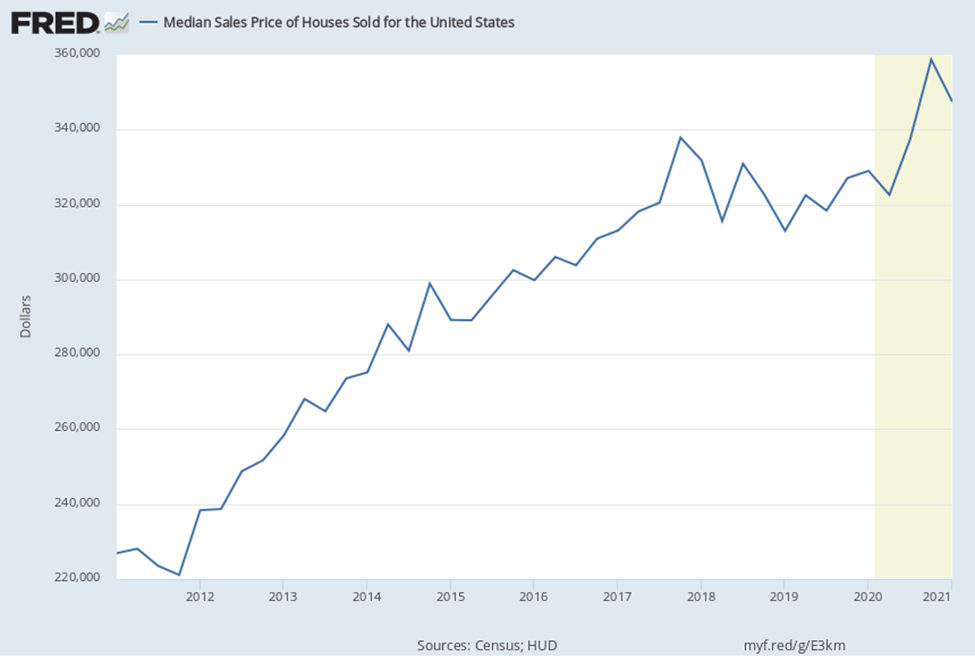
Asset Inflation- The changes that households are going through to make remote working easier and more productive is a good example of demand-pull inflation. With the new need for workspace at home, prices of larger homes have increased faster than smaller homes. In the case of furniture and electronics, they are also experiencing supply shortages which creates an almost frenzy-like behavior from consumers.
Below is a chart of median home prices over the past 10 years. Prices began accelerating in March of 2020 and appear to have tapered recently.

Take-Away
The behavior of the stock market, despite the inflation worries, has been remarkably strong. Most of the concern is that inflation would cause interest rates to rise, higher rates on bonds would give investors an alternative, and at the same time, higher interest rates paid would cut into company earnings. The bond market, which is impacted more directly by inflation, has not been panicking. Financial markets, although nervous and maybe even keeping one finger on the “sell” trigger may be taking the Fed at its word. Fed Chairman Powell has said, “An episode of one-time price increases as the economy reopens, is not likely to lead to persistently higher year-over-year inflation into the future.”
Whether this is true remains to be seen. The official stance is in line with what one would expect out of the nation’s central bank chair. If Powell in any way indicates concern over price increases, demand-pull would increase as inflation expectations would take firmer root in people’s minds, increased demand and higher prices would then become self-fulfilling.
Managing Editor, Channelchek
Suggested Reading:

|

|
A Look at Real Estate Risks to the Stock Market
|
The Limits of Government Economic Tinkering (June 2020)
|

|

|
Long Term Retirement Money and Fledgling Companies
|
$1.9 Trillion in Terms We Can Better Relate To
|
Sources:
Stay up to date. Follow us:
 |
 |
 |
 |
 |
 |
Stay up to date. Follow us:
 |
 |
 |
 |
 |
 |


