Dire Financial Expectations May Have Gone Out the Window
Add this to the list of economic data defying dire expectations people held six months ago: The net worth of households in the U.S. hit the highest level ever during the second quarter. This followed a record drop in household wealth during the first quarter.
The details, released in the quarterly Federal Reserve Flow of Funds report that reviews American households, forms a clear “V”. This, of course, follows the novel coronavirus influenced financial activity on the markets, businesses, households, and applied government stimulus.

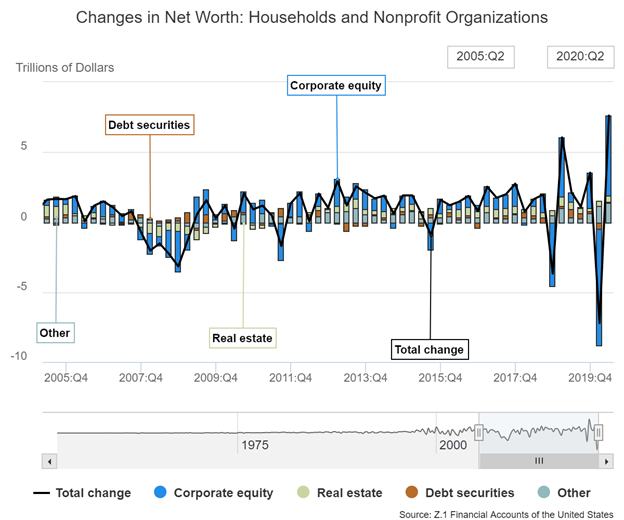
Note: The last three quarters of household net worth demonstrate a solid “V” as values tumbled at a record pace in the first quarter from a relatively high point in 2019 to new record highs at the end of Q2 2020.
| Changes in net worth consist of transactions, revaluations, and other volume changes. Corporate equity and debt securities include directly and indirectly held securities. Real estate is the value of owner-occupied real estate. Other includes equity in noncorporate businesses, consumer durable goods, fixed assets of nonprofit organizations, and all other financial assets apart from corporate equities and debt securities, net of liabilities, as shown on table B.101 Balance Sheet of Households and Nonprofit Organizations. |
Where Wealth Grew
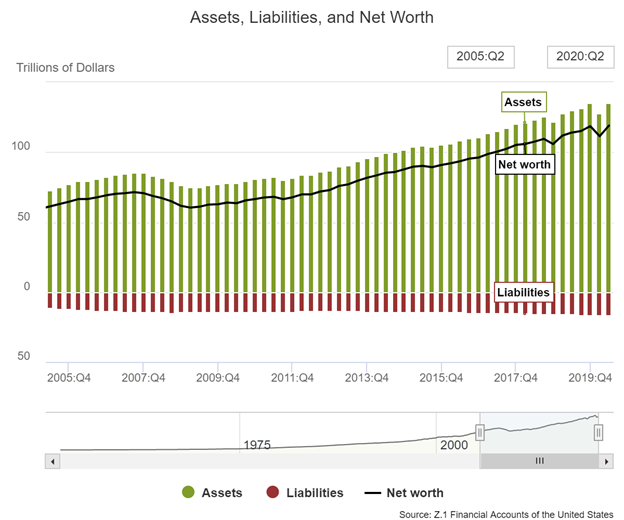
The net worth of households in the U.S. and non-profits shot up 6.8% in the second to $118.96 trillion. This is approximately $380 billion higher than at the end of 2019 before the reaction to the pandemic eroded more than $7 trillion of household wealth.
The asset class that most severely caused the dip then later surged was equity values of securities owned by households. These fell 25% in the first quarter from the end of 2019. Then, most of those losses were recouped in the second quarter, when the value of U.S. equities rose to $19.52 trillion — 8.3% below their year-end valuation.

Last Update: September 21, 2020, Represents Households and Non-Profits
Household real estate and bank-account values have also continued to rise, with some credit given to stimulus checks and enhanced unemployment benefits through the second quarter. The personal saving rate grew to a record 26% in Q2 from 9.6% in Q1. Part of this growth can be attributed to a decline in discretionary spending on clothes and restaurants.
Most of the increase in debt during the first half of 2020 has been business and government entities, according to the Fed. Household debt rose just 0.5% in the second quarter from the first, business debt climbed 14%, and federal-government debt surged 59%.
Take-Away
This recovery is far quicker and of greater magnitude than economists expected. Other measurements and activity, such as the labor market, are also springing back at an unexpected pace from the downturn. Economists from both academia and business were polled by The Wall Street Journal; on average, they expect gross domestic product to increase at an annualized rate of 23.9% in the third quarter, following a decline of 31.7% in the second quarter. We’re still not through all the impacts of the abrupt changes to household and business activity started during Q1, but many of the surprises continue to be on the unexpectedly-positive side.
Suggested Reading:
Job Market Stats Suggest More Clarity
The Fed is Experimenting with Digital
Money
COVID, Sex, and the Business Cycle
Enjoy Premium Channelchek Content at No Cost
 Each event in our popular Virtual Road Shows Series has maximum capacity of 100 investors online. To take part, listen to and perhaps get your questions answered, see which virtual investor meeting intrigues you here.
Sources:
Federal Reserve Board issues Report on the Economic Well-Being of U.S. Households
Survey of Household Economics and Decisionmaking
Changes in Net Worth: Households and Nonprofit Organizations, 1952 – 2020
U.S. Households’ Net Worth Had Record Fall in First Quarter
WSJ Survey: Overall Economy Is Recovering Faster Than Economists Expected