

Monday, April 24, 2022
Michael Kupinski, Director of Research, Noble Capital Markets, Inc.
Jacob Mutchler, Research Associate, Noble Capital Markets, Inc.
Refer to the bottom of the report for important disclosures
Overview: Key takeaways from the NAB. Media investors are unpacking the information from the National Association of Broadcaster’s (NAB) convention. While there are promising new technologies that are sure to create shiny new objects to catch investor’s attention, particularly AI, the chatter is about the current advertising environment. Looking for the key takeaways? Sign up here for the virtual conference on April 27th.
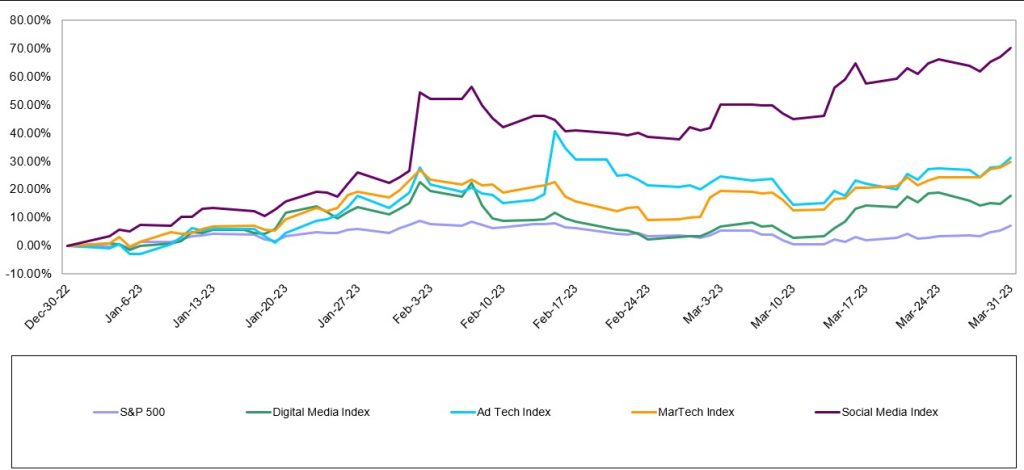
Digital Media & Technology: Head fake? Every one of Noble’s Internet and Digital Media Indices not only finished the quarter up, but significantly outperformed the S&P 500. The best performing index was Noble’s Social Media Index, which increased by 70% in the first quarter of 2023, followed by Noble’s Ad Tech Index (+31%), MarTech Index (+30%), and Digital Media Index (+18%).
Television Broadcasting: Weak current revenue trends. While auto advertising appears to be faring better, the weight of the economic challenges appear to be causing further moderation in advertising. Will auto and, potentially Political, carry the second half 2023 revenue performance?
Radio Broadcasting: All out of love. The industry is reeling from a Wall Street research downgrade to an underperform on iHeart Media, which sent all radio stocks tumbling. Some stocks performed better than others. What’s behind the downgrade and which stocks performed better?
Publishing:Advertising takes a hit. After a period of moderating revenue trends, Publishers reported a weakened advertising environment. The downturn was due to Print advertising which took a nose dive. As a result, publishing companies implemented another round of expense cuts to bolster cash flow. There is a bright spot as Digital continues to perform strongly.
Overview
The NAB Show Stopper
Media investors are unpacking all of the information from last week’s National Association of Broadcaster’s (NAB) convention. There is a lot to digest given that there were over 1,400 exhibits, 140 new exhibitors this year. Because of the overwhelming number of exhibitors, many that go to Vegas for this annual convention do not go to the convention floor. It is a shame. There was a lot to see and learn. As Noble’s Media & Entertainment Analyst I walked the convention floor, which covers 4.6 million square feet of exhibit halls and meeting rooms. I stopped by booths and taped presentations to explain the new technologies, the plan for implementation of new services, and the prospect for revenue monetization. One important demonstration focused on the new broadcast standard, ATSC 3.0, the hope for a bright future for the television industry. This new standard should allow the industry to become more contemporary in terms of how its audience consumes video and information. In addition, it offers the ability for the industry to participate in new revenue streams, including Datacasting, which may become bigger than Retransmission revenue in the future.
In addition to touring the floor, I attended NAB panel discussions and hosted meetings with media management teams in a fireside chat format to discuss current business trends, the new technologies (including Artificial Intelligence (AI) and the new broadcast standard). In addition, these C-suite management teams provided their key takeaways from the NAB convention and offered why they participated in the conference this year. These discussions are available to you for free on Channelchek.com on April 27th in a virtual conference. In this upcoming Channelchek Takeaway Series on the NAB Show, I offer my key takeaways, including the current advertising outlook, my take on the monetization of the new technologies and what media investors should do now given the current economic and advertising environment. Your free registration to this informative event is available here.
This report highlights the performance of the media sectors over the past 12 months and past quarter. Overall, media stocks struggled in the past year, but there has been some improved quarterly performance, particularly in Digital Media and Broadcast Television, discussed later. All media stocks are struggling to offset losses over the course of the past year with trailing 12 months stocks down in the range of 5% on the low end to down 68% on the high end. The best performing sector in the past 12 months were Social Media stocks, down 5% versus the general market decline of 9% over the comparable period.
In the first quarter, stock performance was mixed. The best performers in the traditional media sectors were Broadcast Television stocks, up nearly 10% versus the general market which increased 7% in the comparable period. But, the individual TV stock performance reflected a different story, explained later in this report. The worse performer for the quarter were the radio stocks, driven by a Wall Street downgrade of one of the leading radio broadcasters. The Digital Media stocks had another good performance. We believe that stock performance will be a roller coaster for at least another quarter or two as the weight of the Fed rate increases begin to adversely affect the economy.
While National advertising has remained weak, we believe that Local advertising is now beginning to moderate as well. The Local advertising weakness appears to be in the smaller markets as well as the larger markets. This is somewhat different than the most recent economic cycles whereby the smaller markets were somewhat resilient. It seems that the smaller markets are feeling the adverse affects from inflation, rising employment costs and tightening bank credit. In our view, the disappointing advertising outlook likely will cause second quarter revenue estimates to come down, creating a difficult environment for media stocks. As such, we encourage investors to be opportunistic and take an accumulation approach to building positions for the prospective economic and advertising improvement. Our favorites have digital media exposure, given that we expect Digital Advertising (while softening as well) will be more resilient than traditional advertising mediums. Our favorites include Travelzoo (TZOO), Townsquare Media (TSQ), Harte Hanks (HHS), E.W. Scripps (SSP), and Direct Digital (DRCT).
Digital Media
Head fake?
Last quarter we wrote that the S&P 500 increased for the first time since the fourth quarter of 2021 and that we were beginning to see signs of life in Noble’s Internet and Digital Media Indices as well. Those signs of life continued to bear fruit throughout the first quarter, as every one of Noble’s Internet and Digital Media Indices not only finished the quarter up, but significantly outperformed the S&P 500. Figure #1 LTM Digital Media Performance highlights that many of the Digital Media sectors are now approaching year earlier levels given the most recent favorable performance. The best performing index was Noble’s Social Media Index, which increased by 70% in the first quarter of 2023, followed by Noble’s Ad Tech Index (+31%), MarTech Index (+30%), and Digital Media Index (+18%).
Figure #1 LTM Digital Media Performance
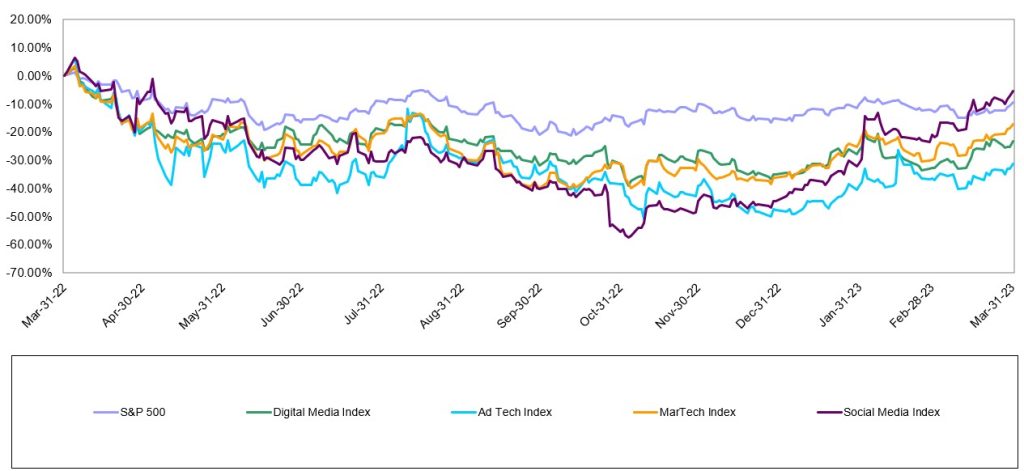
Source: Capital IQ
Noble’s Indices are market cap weighted, and we attribute the strength of the Social Media Index to its largest constituent, Meta Platforms (META; a.k.a. Facebook) whose shares increased by 76% in the first quarter. Figure #2 Q1 Digital Media Performancehighlights the first quarter performance for the digital stocks.Meta’s management stirred interest in the shares from its 4Q 2022 earnings call when they spent most of their time talking about “efficiency”, which investors interpreted to mean that Meta was newly focused on profitability. After a relatively disastrous 3Q 2022 earnings call, after which shares fell by 25%, the company demonstrated on its 4Q 2022 earnings call that it clearly had gotten the message: investors were not enamored about the company’s plans in October 2022 to spend billions of dollars to develop its Metaverse initiatives. Rather, on its fourth quarter call, management focused on driving its short form video initiative, Reels (i.e., becoming more TikTok like), reducing its headcount by reducing layers of management, lowering its operating expenses and reducing its capital expenditures. Investors applauded this newfound focus on profitability and shares rebounded from a low of $88.90 per share in early November to $211.94 at the March quarter-end.
The next best performing index was Noble’s Ad Tech Index which increased by 31% during 1Q 2023. Fourteen of the 23 stocks in the index were up in the first quarter. Standouts during the quarter were Integral Ad Science (IAS; +62%) and Perion Networks (PERI; +56%). Integral Ad Science exceeded expectations in its fourth quarter results and guided to better-than-expected results in 1Q 2023. The company continues to expand its product suite, scale its social media offerings (i.e., for TikTok) and is well positioned to continue to benefit from the shift from linear TV to connected TV (CTV). Perion shares continued their winning: Perion was the only ad tech stock whose shares were up in 2022. Perion’s 56% increase in 1Q 2023 reflected beat on both revenues (by 2%) and EBITDA (by 10%) as well as improved guidance for 1Q 2023. Perion’s profitability increased significantly in 2022, with EBITDA nearly doubling (+90%) from 2021 ($70M) to 2022 ($132M).
Noble’s MarTech Index increased by 30% with 14 of the 22 stocks in the index posting increases in 1Q 2023. The best performing stocks were Qualtrics (XM; +70%) Sprinklr (CXM; +59%), Salesforce (CRM; +51%), Hubspot (HUBS; +48%) and Yext (YEXT; +47%). Qualtrics agreed to be acquired for $12.5 billion by Silver Lake and the Canadian Pension Plan Investment Board, which came at a 73% premium to its 30-day volume weighted stock price. Sprinklr beat revenue expectations and significantly beat EBITDA expectations (doubling the Street expectations) and guided to a current year forecast that focuses more on efficiency and profitability.
MarTech stocks have been victims of their own success. Two years ago at this time the sector was trading at 11.3x forward revenue estimates, and a year ago the group was trading at 6.5x forward revenues. Today the group trades at 4x forward revenues and investors appear to be wading back into the sector. Figure #3 Marketing Tech Comparables highlights the compelling stock valuations.One of the laggards in the sector has been Harte Hanks (HHS), which declined 20% in the first quarter. We believe that the shares have not gained traction following the successful rebound toward profitability in 2022. The shares advanced a powerful 136% in 2022 from lows in May to highs achieved in August 2022. Since that time, investors appear to be taking chips off the table. In our view, the HHS shares appear to be oversold. Its business appears to be resilient. Given the recent weakness in the shares, the shares appear to be undervalued and offer a favorable risk reward relationship. As such, the HHS shares are among our favorites in the sector.
Another one of our current favorites is Direct Digital Holdings (DRCT). As Figure #4 Advertising Tech Comparables illustrates, the DRCT shares trade in line with the averages for the group at roughly 5.4 times 2024 adj. EBITDA. Notably, the company recently restated upward its 2022 full year revenue and adj. EBITDA results. Given the favorable operating momentum, we raised our full year 2023 and 2024 revenue and adj. EBITDA estimates, keeping our previous growth estimates. With the higher 2024 adj. EBITDA, we tweaked upward our price target from $5.50 to $6.00. Given a favorable fundamental outlook and compelling stock valuation, we view the shares as among our favorites.
Finally, Noble’s Digital Media Index, while lagging that of its digital peers at an 18% increase, significantly outperformed the S&P 500 (+7%), with a broad based recovery in which 9 of the sector’s 11 stocks increased during 1Q 2023. The best performing stock was Spotify (SPOT; +69%), whose revenues fell short of expectations by less than 1%, significantly beat consensus Street EBITDA expectations by $58M and more importantly pivoted towards demonstrating operating leverage. Spotify, which posted an EBITDA loss of nearly $500 billion in 2022, is expected to generate $650 billion in EBITDA in 2024, according to Street estimates. A deteriorating ad market in 2022 combined with higher interest rates likely prompted the company to shift its priorities to running a profitable company and doing it more quickly and with some urgency. The second best performing stock was Travelzoo (TZOO; +36%), as the company’s 4Q 2022 revenues and EBITDA increased by 31% and 328%, respectively. Notably, Travelzoo’s EBITDA came in 58% higher than Street consensus. The company appears to be benefiting from pent up travel demand for travel and management highlighted the opportunity for margin expansion in the coming quarters. Given the favorable outlook, we raised our price target to $10. Near current levels, the TZOO shares appear to offer above average returns and we reiterate our Outperform rating.
Figure #2 Q1 Digital Media Performance
Source: Capital IQ
Figure #3 Marketing Tech Comparables
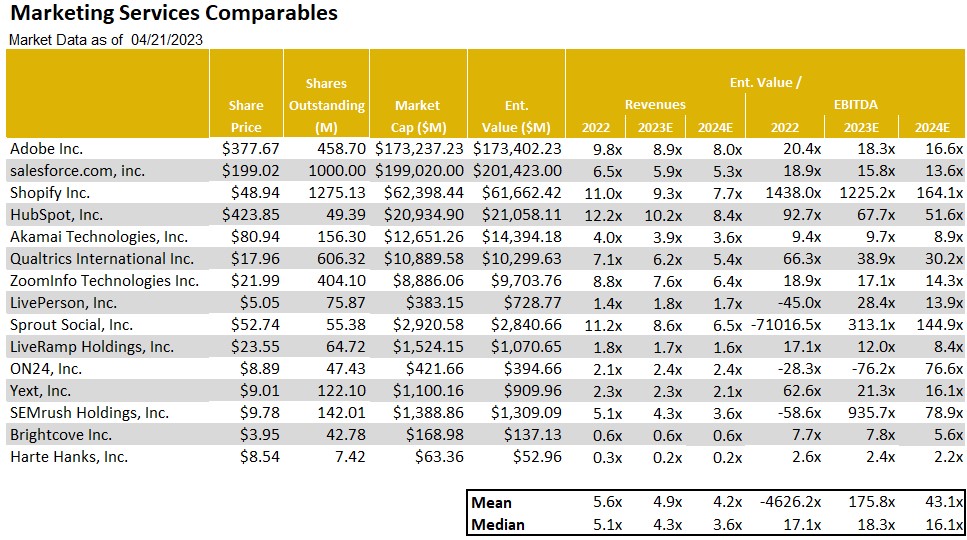
Source: Eikon, Company filings & Noble estimates
Figure #4 Advertising Tech Comparables
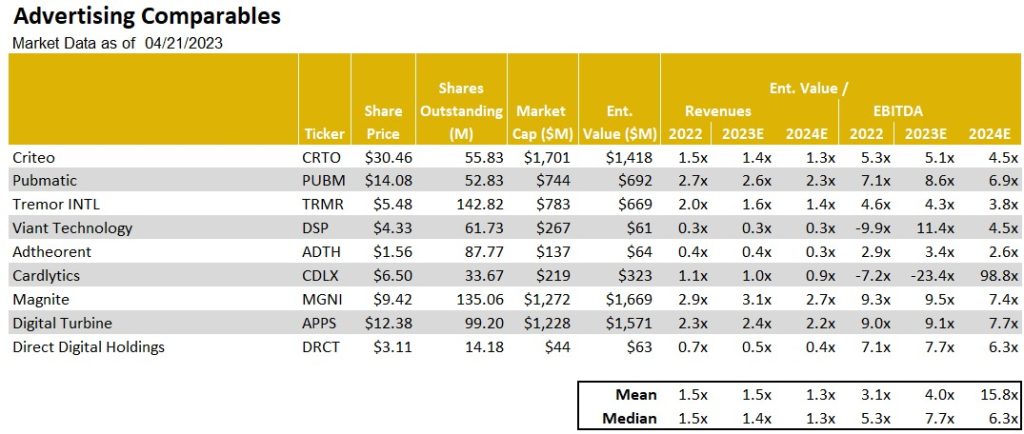
Source: Eikon, Company filings & Noble estimates
Traditional Media
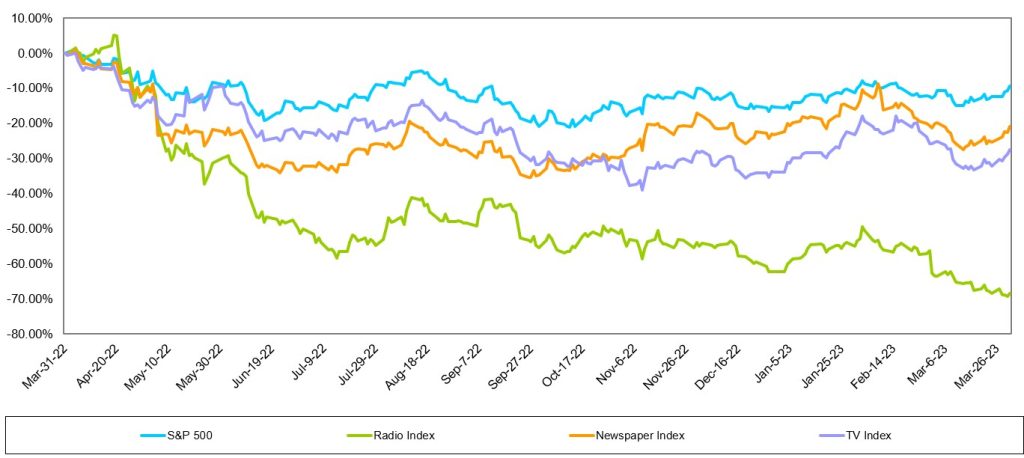
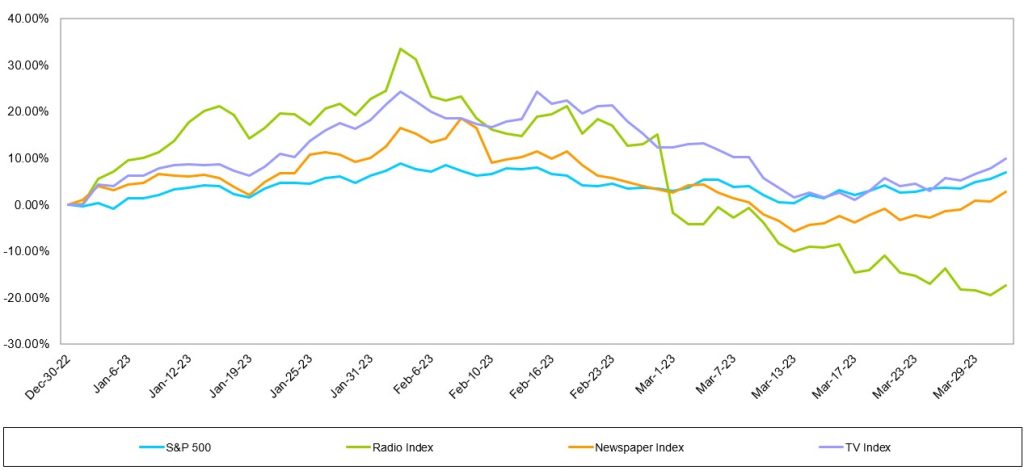
As Figure #5 LTM Traditional Media Performance illustrates, these stocks have struggled to gain sea legs, trending lower over the course of the past year. All traditional media sectors have underperformed over the past year, with Radio the poorest performing group. As Figure #6 Q1 Traditional Media Performance illustrates, only the TV Broadcast stocks edged out the general market performance in the latest quarter.
Figure #5 LTM Traditional Media Performance
Source: Capital IQ
Figure #6 Q1 Traditional Media Performance
Source: Capital IQ
Television Broadcast
Weak current revenue trends
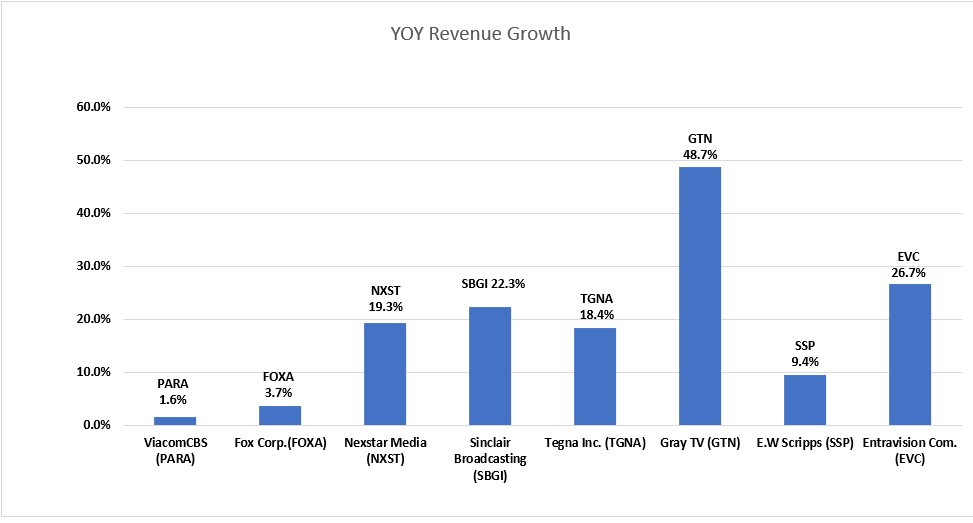
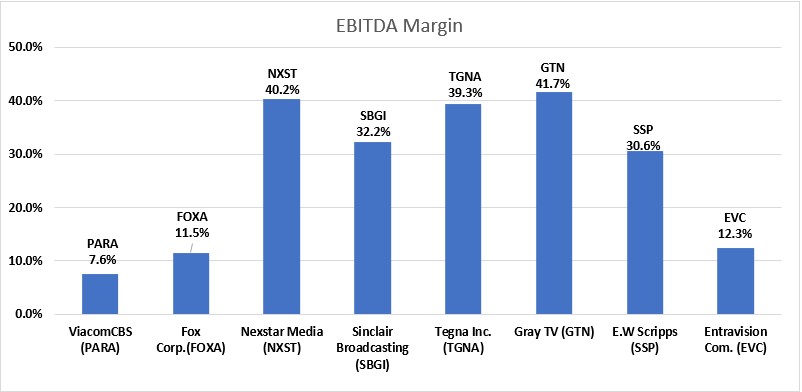
As illustrated in the previous chart, the TV stocks outperformed the general market in the first quarter. This market cap weighted index masked the performance of many poor performing stocks in the quarter. Sinclair Broadcasting (SBGI; up 10%), Entravision (EVC; up a strong 26%), and Fox (FOX; up 12%) were among the best performing stocks and favorably influenced the TV index in the quarter. But, there were many poor performing stocks including E.W. Scripps (SSP; down 29%), Gray Television (GTN; down 22%) and Tegna (TGNA; down 20%). We believe that there was heightened interest in Entravision given its favorable Q1 results which was fueled by its fast growing Digital business. Figure #7 TV Q4 YoY Revenue Growth illustrates the Entravision’s Q4 revenue performance was among the best in the industry. While Entravision was among the best revenue performers, its margins are below that of its peer group as illustrated in Figure #8 TV Q4 EBITDA Margins. This is due to the accounting treatment of its Digital revenues given that it is an agency business. Given that Digital represents roughly 80% of the company’s total company revenue, we plan to put the EVC shares into the Digital Media sector to more accurately reflect its business. The poorer performing stocks are among the higher debt levered in the industry. As such, we believe the underperformance reflects concern of a slowing economy and investors flight to quality in the sector.
We do not believe that we are out of the woods with the TV stocks and the market is expected to be volatile. The advertising environment appears to be deteriorating given weakening economic conditions. There are bright spots which include some improvement in the Auto category. Dealerships appear to be stepping up advertising given higher inventory levels. In addition, broadcasters appear optimistic about Political advertising, which could begin in the third quarter 2023. There is a planned Republican presidential candidate debate scheduled in August. As such, there is some promise that candidates will advertise in advance of that debate and into the fourth quarter given the early primary season. We do not believe that Political and Auto will be enough to offset the weakness in National and in the weakening Local category. In our view, Q2 and full year 2023 estimates are likely to come down. Furthermore, we believe that broadcasters will be shy about predicting Political advertising even into 2024 given the past disappointments in management forecasts in the last Political cycle.
We encourage investors to take an accumulation approach to the sector. Notably, as Figure #9 TV Comparables highlights, nearly all of the stocks are trading near each other, with the exception of the larger media stocks. In our view, the valuations are near recession type valuations and appear to have limited downside risk. Our current favorite is E.W. Scripps (SSP). While the company is not immune to the current weak advertising environment, we believe that there is a favorable Retransmission revenue opportunity as 75% of its subscribers are due in the next 12 months. In addition, we believe that Retransmission margins will improve. Given the relatively small float for the shares, the SSP shares tend to underperform when the industry is out of favor, but then outperform when the industry is back in favor. In our view, the SSP shares offer a favorable risk/reward relationship and top our favorites in the sector.
Figure #7 TV Q4 YoY Revenue Growth
Source: Eikon & Company filings
Figure #8 TV Q4 EBITDA Margins
Source: Eikon & Company filings
Figure #9 TV Comparables
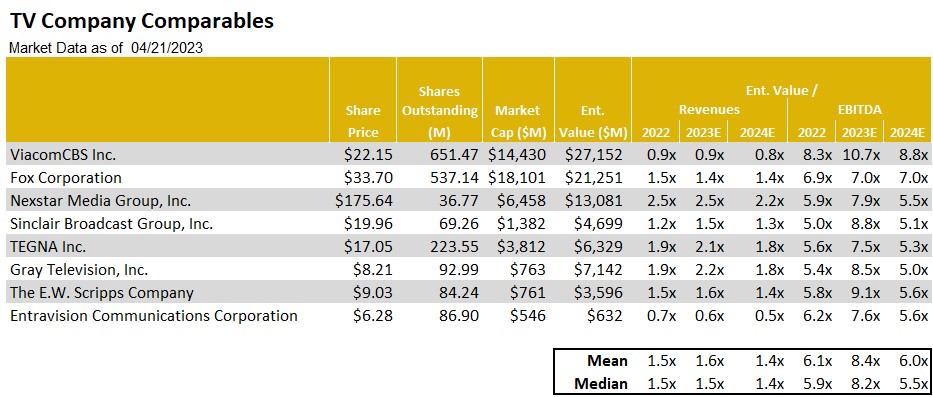
Source: Noble Estimates & Eikon
Radio Broadcasting
All out of love
The Radio stocks had another tough quarter, down 17% versus a 7% gain for the general market. Notably, there was a wide variance in the individual stock performance, with the largest stocks in the group having the worst performance in the quarter, including Audacy (AUD; down 40%), Cumulus Media (CMLS; down 41%) and iHeart Media (IHRT; down 36%). The first quarter stock performance did not appear to reflect the fourth quarter results. As Figure #10 Radio Industry Q4 YoY Revenue Growth illustrates, revenues were relatively okay, with some exceptions. Some of the larger Radio companies which have a large percentage of National advertising, underperformed relative to the more diversified Radio companies, especially those with a strong Digital segment presence. Figure #11 Radio Industry Q4 YoY EBITDA Margins illustrate that the margins for the industry remain relatively healthy.
The weakness in the Radio stocks was fueled in the quarter from a downgrade to under perform on the shares of iHeart by a Wall Street firm. Many radio stocks were down in sympathy. The analyst attributed the downgrade to the current macro environment and its heavy floating rate debt burden. The company is not expected to generate enough free cash flow to de-lever its balance sheet. We believe the downgrade as well as the excessive debt profile of Audacy, another industry leader which likely will need to restructure, sent all radio stocks tumbling. Some stocks performed better than others. While Cumulus Media’s debt profile is not as levered as iHeart or Audacy, the shares were caught in the net of a weak advertising outlook. Cumulus is among the most sensitive to National advertising, which currently continues to be weak.
Some of our favorite stocks which are diversified and have developing digital businesses performed better. Those stocks included Townsquare Media (TSQ; up 10%), and Salem Media (SALM; up 4%). Notably, while the shares of Beasley Broadcasting (BBGI) were down 10%, the shares performed better than the 17% decline for the industry in the quarter. Importantly, Beasley recently provided favorable updated Q1 guidance for the first quarter. Q1 revenues are expected to increase 1% to 2.5% and EBITDA growth is expected to be in the range of 40% to 50%, significantly better than our estimates. Furthermore, management provided a sanguine outlook for 2023 and 2024. Digital revenue is expected to reach 20% to 30% of total revenue with a goal of reaching 40% in 2024. By comparison, Digital revenue was 17% of total revenue in the fourth quarter 2022. Furthermore, the company is sitting on roughly $35 million in cash. It has opportunistically repurchased $10 million of its bonds at a significant discount. We believe that it is likely to maintain a strong cash position given the economic uncertainty.
We view Townsquare Media (TSQ), Salem Media (SALM) and Beasley Broadcast (BBGI) as among our favorites in the industry given the diverse revenue streams. While these companies are not immune to the economic headwinds, we believe that its Digital businesses should offer some ballast to its more sensitive Radio business. In the case of Salem, 30% of its revenues are relatively stable with block programming. As Figure #12 Broadcast Radio Comparables illustrates, the shares of Townsquare are among the cheapest in the industry, trading below peer group averages. Notably, the company instituted a hefty dividend. As a result, investors get paid while we await a favorable upturn in fundamentals. As such, the shares of TSQ tops our list of favorites.
Figure #10 Radio Industry Q4 YoY Revenue Growth
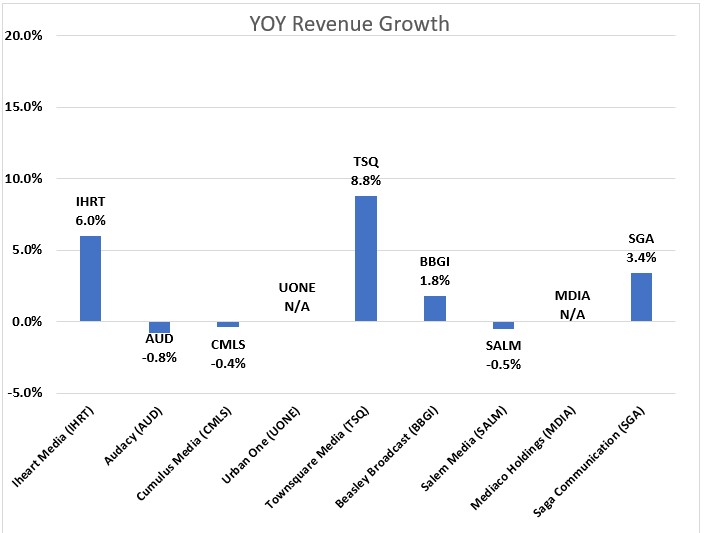
Source: Eikon & Company filings
Figure #11 Radio Industry Q4 YoY EBITDA Margins
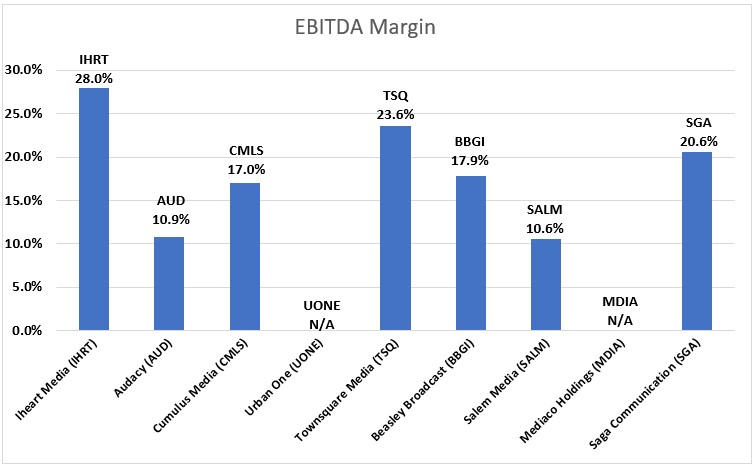
Source: Eikon & Company filings
Figure #12 Broadcast Radio Comparables
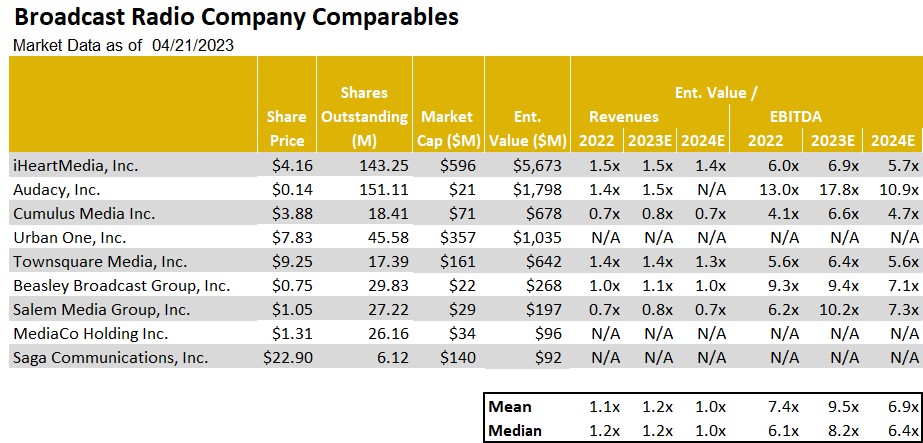
Source: Noble estimates & Eikon
Publishing
Advertising takes a hit
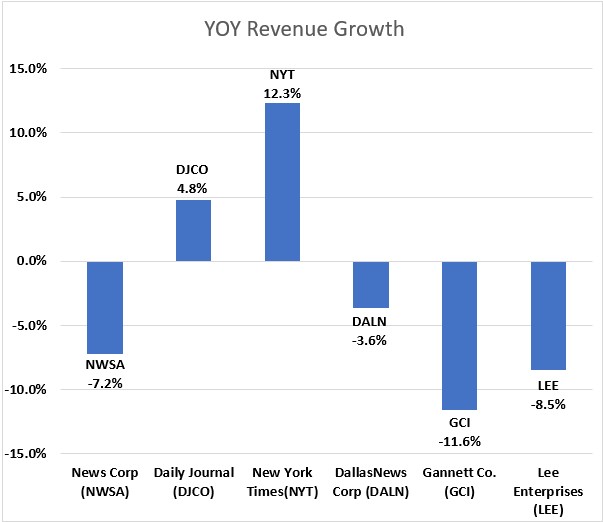
After a period of moderating revenue trends, Publishers reported a weakened advertising environment. As illustrated in Figure #13 Publishing Industry YOY Revenue Growth, illustrates that revenue trends deteriorated with Print advertising taking a nose dive. This trend was illustrative in the results from Lee Enterprises, one of our current favorites in the sector. After a fiscal fourth quarter flat revenue performance, the company reported a 8.5% decline in its fiscal first quarter. The Q1 revenue performance reflected an 18.5% decrease in Print advertising, an acceleration in the rate of the 11% decline in the previous quarter.
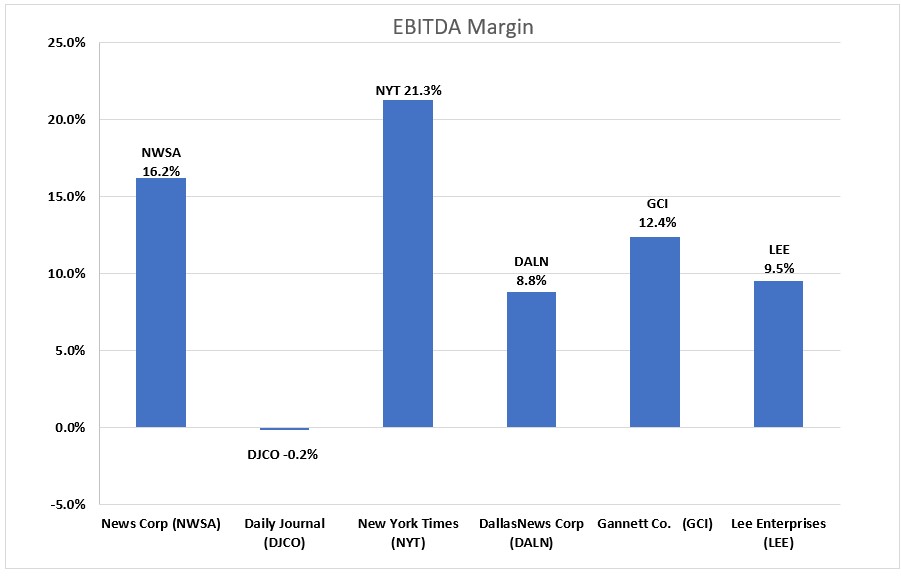
The surprisingly weak quarter hit the company’s adj. EBITDA margins. Traditionally, Lee maintained some of the best margins in the industry. As Figure #14 Q4 Publishing Industry EBITDA Margins illustrates, the company fell in ranking to among the lowest in the sector. Importantly, in spite of the revenue weakness, the company maintains its previous adj. EBITDA guidance of $94 million to $100 million. To achieve its cash flow target in light of the soft revenue outlook, Lee implemented a round of expense cuts to bolster cash flow. Cost reductions are expected to result in $40 million of savings in FY23, and $60 million in annualized savings going forward. While we are disappointed that the company’s Print business is not moderating as previously expected, the company’s Digital businesses remain favorably robust. In addition, its Digital business is turning toward contributing margins. As such, we remain sanguine about the company’s digital transition.
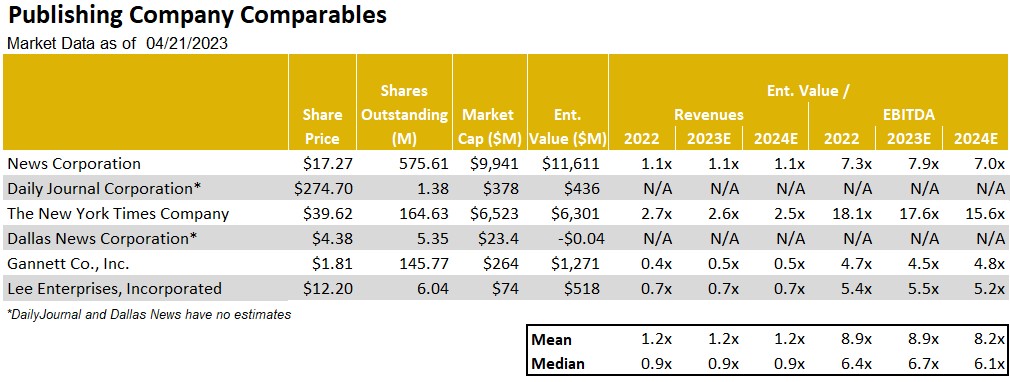
As Figure #15 Publishing Comparables highlights, there is a wide gap between the valuation of the New York Times (NYT) and the rest of the industry, including Lee. While the highly debt levered shares of Gannett appear cheaper, we believe that Lee has a more favorable debt profile with a fixed 9% annual rate, no fixed principal payments, no performance covenants and a 25 year maturity. With the shares trading at 5.3 times our 2024 adj. EBITDA estimate compared with 15.4 times at the New York Times, we believe that there is limited downside risk in the LEE shares. Furthermore, we believe that the company is well positioned as economic and advertising prospects improve. Given the company’s favorable outlook for its Digital transition, we believe that the shares should close the gap in valuations with the leadership stock in the group. Consequently, the shares of LEE are among our favorite play for an improving economic outlook.
Figure #13 Publishing Industry YoY Revenue Growth
Source: Eikon & Company filings
Figure #14 Q4 Publishing Industry EBITDA Margins
Source: Eikon & Company filings
Figure #15 Publishing Comparables
Source: Noble estimates & Eikon
For more information on companies mentioned in this report click on the following:
GENERAL DISCLAIMERS
All statements or opinions contained herein that include the words “we”, “us”, or “our” are solely the responsibility of Noble Capital Markets, Inc.(“Noble”) and do not necessarily reflect statements or opinions expressed by any person or party affiliated with the company mentioned in this report. Any opinions expressed herein are subject to change without notice. All information provided herein is based on public and non-public information believed to be accurate and reliable, but is not necessarily complete and cannot be guaranteed. No judgment is hereby expressed or should be implied as to the suitability of any security described herein for any specific investor or any specific investment portfolio. The decision to undertake any investment regarding the security mentioned herein should be made by each reader of this publication based on its own appraisal of the implications and risks of such decision.
This publication is intended for information purposes only and shall not constitute an offer to buy/sell or the solicitation of an offer to buy/sell any security mentioned in this report, nor shall there be any sale of the security herein in any state or domicile in which said offer, solicitation or sale would be unlawful prior to registration or qualification under the securities laws of any such state or domicile. This publication and all information, comments, statements or opinions contained or expressed herein are applicable only as of the date of this publication and subject to change without prior notice. Past performance is not indicative of future results. Noble accepts no liability for loss arising from the use of the material in this report, except that this exclusion of liability does not apply to the extent that such liability arises under specific statutes or regulations applicable to Noble. This report is not to be relied upon as a substitute for the exercising of independent judgement. Noble may have published, and may in the future publish, other research reports that are inconsistent with, and reach different conclusions from, the information provided in this report. Noble is under no obligation to bring to the attention of any recipient of this report, any past or future reports. Investors should only consider this report as single factor in making an investment decision.
IMPORTANT DISCLOSURES
This publication is confidential for the information of the addressee only and may not be reproduced in whole or in part, copies circulated, or discussed to another party, without the written consent of Noble Capital Markets, Inc. (“Noble”). Noble seeks to update its research as appropriate, but may be unable to do so based upon various regulatory constraints. Research reports are not published at regular intervals; publication times and dates are based upon the analyst’s judgement. Noble professionals including traders, salespeople and investment bankers may provide written or oral market commentary, or discuss trading strategies to Noble clients and the Noble proprietary trading desk that reflect opinions that are contrary to the opinions expressed in this research report.
The majority of companies that Noble follows are emerging growth companies. Securities in these companies involve a higher degree of risk and more volatility than the securities of more established companies. The securities discussed in Noble research reports may not be suitable for some investors and as such, investors must take extra care and make their own determination of the appropriateness of an investment based upon risk tolerance, investment objectives and financial status.
Company Specific Disclosures
The following disclosures relate to relationships between Noble and the company (the “Company”) covered by the Noble Research Division and referred to in this research report.
Noble is not a market maker in any of the companies mentioned in this report. Noble intends to seek compensation for investment banking services and non-investment banking services (securities and non-securities related) with any or all of the companies mentioned in this report within the next 3 months
ANALYST CREDENTIALS, PROFESSIONAL DESIGNATIONS, AND EXPERIENCE
Senior Equity Analyst focusing on Basic Materials & Mining. 20 years of experience in equity research. BA in Business Administration from Westminster College. MBA with a Finance concentration from the University of Missouri. MA in International Affairs from Washington University in St. Louis.
Named WSJ ‘Best on the Street’ Analyst and Forbes/StarMine’s “Best Brokerage Analyst.”
FINRA licenses 7, 24, 63, 87
WARNING
This report is intended to provide general securities advice, and does not purport to make any recommendation that any securities transaction is appropriate for any recipient particular investment objectives, financial situation or particular needs. Prior to making any investment decision, recipients should assess, or seek advice from their advisors, on whether any relevant part of this report is appropriate to their individual circumstances. If a recipient was referred to Noble Capital Markets, Inc. by an investment advisor, that advisor may receive a benefit in respect of
transactions effected on the recipients behalf, details of which will be available on request in regard to a transaction that involves a personalized securities recommendation. Additional risks associated with the security mentioned in this report that might impede achievement of the target can be found in its initial report issued by Noble Capital Markets, Inc.. This report may not be reproduced, distributed or published for any purpose unless authorized by Noble Capital Markets, Inc..
RESEARCH ANALYST CERTIFICATION
Independence Of View
All views expressed in this report accurately reflect my personal views about the subject securities or issuers.
Receipt of Compensation
No part of my compensation was, is, or will be directly or indirectly related to any specific recommendations or views expressed in the public
appearance and/or research report.
Ownership and Material Conflicts of Interest
Neither I nor anybody in my household has a financial interest in the securities of the subject company or any other company mentioned in this report.