The recent announcement of Lockheed Martin’s acquisition of Terran Orbital for $450 million highlights a common phenomenon in the business world: large corporations absorbing smaller, often struggling companies. While such moves can be seen as predatory, they often offer significant benefits to both parties involved, as well as to the broader industry and consumers. The Lockheed-Terran deal provides a compelling case study to examine why these acquisitions can be advantageous.
For smaller companies like Terran Orbital, which was facing a severe cash crunch with less than $15 million in reserves and $300 million in debt, acquisition by a larger entity can be a financial lifesaver. The infusion of capital and the settling of debts provide immediate stability, allowing the company to continue operations and potentially thrive under new ownership. This financial security can preserve jobs and maintain the company’s contributions to the industry.
But larger companies bring more than just financial resources to the table. They often possess advanced technologies, established distribution networks, and seasoned management teams. For Terran Orbital, becoming part of Lockheed Martin means access to a wealth of aerospace expertise and resources that could accelerate its growth and innovation potential. This synergy can lead to improved products and services, benefiting customers and advancing the industry as a whole.
Acquisitions can significantly enhance the market position of both companies involved. For Lockheed Martin, absorbing Terran Orbital strengthens its capabilities in small satellite manufacturing, a growing sector in the space industry. This move allows Lockheed to diversify its portfolio and potentially capture new market segments. For Terran, becoming part of a larger entity provides the backing needed to compete more effectively in a challenging market landscape.
Larger companies often have more efficient operations due to economies of scale. By integrating Terran Orbital, Lockheed Martin can potentially streamline production processes, reduce overhead costs, and optimize supply chains. These efficiencies can lead to cost savings that may be passed on to customers or reinvested in research and development.
The combination of resources and talent from both companies can create a fertile ground for innovation. Terran Orbital’s expertise in small satellites, combined with Lockheed’s extensive research capabilities and funding, could lead to breakthrough technologies and applications in the space sector. This accelerated innovation benefits not just the companies involved but can push the entire industry forward.
For investors and stakeholders, the acquisition of a smaller, struggling company by a larger, stable one can mitigate risks. Terran Orbital’s shareholders, who saw the company’s valuation plummet from $1.8 billion at its SPAC debut to the current $450 million, now have a clear exit strategy. While the return may not be what they initially hoped for, it provides certainty in an otherwise precarious situation.
Acquisitions like this can contribute to a healthier overall market by consolidating resources and capabilities. In industries with high barriers to entry and significant capital requirements, such as aerospace, this consolidation can lead to more robust companies better equipped to tackle major projects and withstand market fluctuations.
While the acquisition of smaller companies by larger ones can sometimes be viewed negatively, the Lockheed Martin-Terran Orbital deal illustrates the potential benefits of such moves. From financial stability and resource access to enhanced market positioning and accelerated innovation, these strategic acquisitions can create value for the companies involved, their stakeholders, and the broader industry ecosystem. As the business landscape continues to evolve, such synergistic mergers may play an increasingly important role in driving progress and maintaining market health across various sectors.
Ultimately, the success of such acquisitions depends on careful integration and strategic alignment. When executed well, they can breathe new life into struggling companies, enhance the capabilities of industry leaders, and ultimately drive innovation and progress in ways that benefit not just the businesses involved, but the entire market and its consumers.
Bedtime TNX-102 SL (sublingual cyclobenzaprine HCl) treatment in the Phase 3 RESILIENT study resulted in statistically significant improvement in the primary endpoint of fibromyalgia nociplastic pain and in all six key secondary endpoints, including sleep quality
Post hoc analyses highlight the strong correlations between improvements in nociplastic pain and sleep quality
Nociplastic pain originates from altered pain perception in the brain and is the type of pain that manifests in fibromyalgia and other chronic overlapping pain conditions (COPCs)
FDA granted TNX-102 SL Fast Track designation for the management of fibromyalgia; NDA submission on track for second half 2024
CHATHAM, N.J., Aug. 12, 2024 (GLOBE NEWSWIRE) — Tonix Pharmaceuticals Holding Corp. (Nasdaq: TNXP) (Tonix or the Company), a fully-integrated biopharmaceutical company with marketed products and a pipeline of development candidates, presented data in a poster presentation at the International Association for the Study of Pain (IASP) 2024 World Congress on Pain, held August 5-9, 2024 in Amsterdam, the Netherlands. A copy of the Company’s poster presentation titled, “Targeting Fibromyalgia Non-Restorative Sleep with Bedtime TNX-102 SL (Sublingual Cyclobenzaprine HCl): Results of the Positive Phase 3 RESILIENT Trial Consistent with Syndromal Improvement”, is available under the Scientific Presentations tab of the Tonix website at www.tonixpharma.com.
TNX-102 SL met the pre-specified primary endpoint in the Phase 3 RESILIENT study, significantly reducing daily pain compared to placebo (p-value=0.00005) in participants with fibromyalgia. TNX-102 SL also demonstrated broad syndromal benefits with statistically significant improvement in all six pre-specified key secondary endpoints including those related to improving sleep quality, reducing fatigue, and improving patient global ratings and overall fibromyalgia symptoms and function. A new post hoc analysis showed correlations between improvements in pain and sleep quality at Week 14, supporting the concept that targeting sleep quality has the potential to achieve syndromal improvement in fibromyalgia. TNX-102 SL was well tolerated with an adverse event profile comparable to prior studies and no new safety signals observed.
“Approximately 50 years ago, the central role of nonrestorative sleep in the pathogenesis and persistence of fibromyalgia was recognized by Dr. Harvey Moldofsky1,2”, said Seth Lederman, M.D., Chief Executive Officer of Tonix Pharmaceuticals. “TNX-102 SL was designed as a bedtime treatment to target non-restorative sleep and improve sleep quality. The statistically significant results of TNX-102 SL in two positive Phase 3 studies provide evidence of the activity and tolerability of TNX-102 SL in fibromyalgia and also support the critical role of sleep quality in the pathogenesis, persistence and exacerbations of fibromyalgia originally proposed by Dr. Moldofsky.”
Greg Sullivan, M.D., Chief Medical Officer, added, “Today, fibromyalgia is recognized as the prototypic ‘nociplastic syndrome’. Understanding nociplastic syndromes is crucial for developing effective treatment strategies for chronic overlapping pain conditions (COPCs)3,4,5. Traditional analgesics like NSAIDs or opioids often prove ineffective if not deleterious in these conditions. In contrast, TNX-102 SL provided broad-spectrum symptom relief in the RESILIENT study. We believe TNX-102 SL has the potential to be the first new treatment option for fibromyalgia patients in 15 years.”
TNX-102 SL was recently granted Fast Track designation by the U.S. Food and Drug Administration (FDA) for the management of fibromyalgia. Tonix remains on track to submit an NDA to the FDA in the second half of 2024 for TNX-102 SL for the management of fibromyalgia.
1Moldofsky H, et al. Psychosom Med. 1975;37:341-51
2Moldofsky H, Scarisbrick P. Psychosom Med. 1976;38:35-44
3Fitzcharles MA, et al. Lancet. 2021;397:2098-110
4Clauw DJ. Ann Rheum Dis. Published Online First: 2024
5Kaplan CM, et al. Nat Rev Neurol. 2024;20, 347–363
About Fibromyalgia
Fibromyalgia is a chronic pain disorder that is understood to result from amplified sensory and pain signaling within the central nervous system. Fibromyalgia afflicts more than 10 million adults in the U.S., the majority of whom are women. Symptoms of fibromyalgia include chronic widespread pain, non-restorative sleep, fatigue, and brain fog (or cognitive dysfunction). Other associated symptoms include mood disturbances, including anxiety and depression, headaches, and abdominal pain or cramps. Individuals suffering from fibromyalgia struggle with their daily activities, have impaired quality of life, and frequently are disabled. Physicians and patients report common dissatisfaction with currently marketed products. According to the recent report from the U.S. National Academies of Sciences, fibromyalgia is a diagnosable condition that may also occur in the context of Long COVID
About TNX-102 SL
TNX-102 SL is a centrally acting, non-opioid, non-addictive, bedtime investigational drug. The tablet is a patented sublingual formulation of cyclobenzaprine hydrochloride developed for the management of fibromyalgia. In December 2023, the company announced highly statistically significant and clinically meaningful topline results in RESILIENT, the second pivotal Phase 3 clinical trial of TNX-102 SL for the management of fibromyalgia. In the study, TNX-102 SL met its pre-specified primary endpoint, significantly reducing daily pain compared to placebo (p=0.00005) in participants with fibromyalgia. Statistically significant and clinically meaningful results were also seen in all six key secondary endpoints related to improving sleep quality, reducing fatigue and improving overall fibromyalgia symptoms and function. RELIEF, the first statistically significant Phase 3 trial of TNX-102 SL in fibromyalgia, was completed in December 2020. It met its pre-specified primary endpoint of daily pain reduction compared to placebo (p=0.010) and showed activity in key secondary endpoints. In both pivotal studies, the most common treatment-emergent adverse event was tongue or mouth numbness at the administration site, which was temporally related to dosing, self-limited, never rated as severe, and rarely led to study discontinuation (one participant in each study). TNX-102 SL was recently granted Fast Track Designation by the FDA for the management of fibromyalgia and remains on track to submit an NDA to the U.S. Food and Drug Administration in the second half of 2024.
About Nociplastic Pain
Nociplastic pain is the third category of pain distinct from nociceptive pain and neuropathic pain. Nociplastic pain is characterized by pain arising from altered nociception despite no evidence of actual or threatened tissue damage causing activation of peripheral nociceptors or somatosensory system disease or lesion. Its underlying pathophysiology involves altered pain processing by the central nervous system (CNS). Nociplastic syndromes, officially recognized by the International Association for the Study of Pain (IASP) in 2017, also include several other chronic overlapping pain conditions: myalgic encephalomyelitis/chronic fatigue syndrome, irritable bowel syndrome, temporomandibular disorders, forms of chronic back pain and chronic headache. The pathophysiology of nociplastic pain involves central sensitization (CS), where neurons of the CNS become hyperexcitable, amplifying pain signals. CS can be triggered by peripheral pain stimuli, emotional stress, or other factors, leading to persistent pain despite no peripheral nociceptive input.
Tonix Pharmaceuticals Holding Corp.*
Tonix is a fully-integrated biopharmaceutical company focused on developing, licensing and commercializing therapeutics to treat and prevent human disease and alleviate suffering. Tonix’s development portfolio is focused on central nervous system (CNS) disorders. Tonix’s priority is to submit a New Drug Application (NDA) to the FDA in the second half of 2024 for TNX-102 SL, a product candidate for which two statistically significant Phase 3 studies have been completed for the management of fibromyalgia. The FDA has granted Fast Track designation to TNX-102 SL for the management of fibromyalgia. TNX-102 SL is also being developed to treat acute stress reaction. Tonix’s CNS portfolio includes TNX-1300 (cocaine esterase), a biologic designed to treat cocaine intoxication that has Breakthrough Therapy designation. Tonix’s immunology development portfolio consists of biologics to address organ transplant rejection, autoimmunity and cancer, including TNX-1500, which is a humanized monoclonal antibody targeting CD40-ligand (CD40L or CD154) being developed for the prevention of allograft rejection and for the treatment of autoimmune diseases. Tonix also has product candidates in development in the areas of rare disease and infectious disease. Tonix Medicines, our commercial subsidiary, markets Zembrace® SymTouch® (sumatriptan injection) 3 mg and Tosymra® (sumatriptan nasal spray) 10 mg for the treatment of acute migraine with or without aura in adults.
*Tonix’s product development candidates are investigational new drugs or biologics and have not been approved for any indication.
Zembrace SymTouch and Tosymra are registered trademarks of Tonix Medicines. All other marks are property of their respective owners.
This press release and further information about Tonix can be found at www.tonixpharma.com.
Forward Looking Statements
Certain statements in this press release are forward-looking within the meaning of the Private Securities Litigation Reform Act of 1995. These statements may be identified by the use of forward-looking words such as “anticipate,” “believe,” “forecast,” “estimate,” “expect,” and “intend,” among others. These forward-looking statements are based on Tonix’s current expectations and actual results could differ materially. There are a number of factors that could cause actual events to differ materially from those indicated by such forward-looking statements. These factors include, but are not limited to, risks related to the failure to obtain FDA clearances or approvals and noncompliance with FDA regulations; risks related to the failure to successfully market any of our products; risks related to the timing and progress of clinical development of our product candidates; our need for additional financing; uncertainties of patent protection and litigation; uncertainties of government or third party payor reimbursement; limited research and development efforts and dependence upon third parties; and substantial competition. As with any pharmaceutical under development, there are significant risks in the development, regulatory approval and commercialization of new products. Tonix does not undertake an obligation to update or revise any forward-looking statement. Investors should read the risk factors set forth in the Annual Report on Form 10-K for the year ended December 31, 2023, as filed with the Securities and Exchange Commission (the “SEC”) on April 1, 2024, and periodic reports filed with the SEC on or after the date thereof. All of Tonix’s forward-looking statements are expressly qualified by all such risk factors and other cautionary statements. The information set forth herein speaks only as of the date thereof.
Key Points: – Retail investors remain net buyers during recent market volatility – Tech stocks and Treasury ETFs attract individual investor interest – Mixed signals emerge from different research reports and platforms
The recent turbulence in U.S. stock markets has put a spotlight on the behavior of retail investors, who have emerged as a significant force in shaping market dynamics. As major indexes experienced sharp swings, including a notable sell-off that saw declines of 2.6% to 3.4% in a single day, individual investors have demonstrated both resilience and adaptability. This article delves into the various strategies and trends observed among retail investors during this period of market volatility, drawing insights from multiple research reports and trading platforms. For investors seeking to navigate these complex markets, resources like Channelchek offer valuable research and analysis to inform investment decisions.
Vanda Research, a New York-based market analysis firm, reported that retail investors continued to be net buyers of popular tech stocks such as Nvidia, Intel, and Advanced Micro Devices during the market downturn. Marco Iachini, senior vice president of research at Vanda, noted that “There was no retail capitulation,” emphasizing the persistent “dip-buying spree” among individual investors.
This trend was further corroborated by data from Robinhood Markets, which saw a significant influx of new cash from retail clients. The popular trading platform received $1 billion in the first week of August, with half of that amount deposited during Monday’s sell-off alone. This surge in deposits far exceeded Robinhood’s second-quarter daily average of less than $350 million.
However, the picture is not uniformly bullish. A separate report from JP Morgan analysts suggested that retail investors were “aggressive net sellers” during the first hour of Monday’s trading session. This conflicting data highlights the complex and diverse nature of retail investor behavior during periods of market stress, underscoring the importance of comprehensive research platforms like Channelchek in providing investors with well-rounded insights.
Interestingly, as markets recovered on Tuesday and Wednesday, retail investors showed increased interest in the iShares 20+ Year Treasury Bond ETF. Vanda Research reported that by Thursday morning, this ETF had become the second-most-actively purchased security after Nvidia shares. This shift towards a traditionally safer asset class may indicate growing anxiety among individual investors about the stock market’s outlook.
Further evidence of a cautious approach comes from Alight Solutions, which tracks trading activity in approximately 2 million 401(k) retirement accounts. Rob Austin, head of research at Alight, noted that investors were actively moving assets out of stock funds and into money markets and fixed-income products. While the volume of these shifts was significant – about eight times the average – it represented only a small fraction (0.1%) of the $200 billion in assets tracked by the firm.
The divergent behaviors observed across different platforms and research reports underscore the complexity of retail investor sentiment in the current market environment. While many individual investors continue to see buying opportunities in market dips, particularly in the tech sector, others are beginning to hedge their bets by allocating funds to more conservative investments.
This nuanced approach reflects a growing sophistication among retail investors, who are increasingly able to navigate volatile markets with a combination of opportunism and risk management. As market uncertainties persist, driven by factors such as economic data, earnings reports, and global trade dynamics, the actions of retail investors will likely continue to play a significant role in shaping market trends.
For market observers and professional investors, understanding these retail investor behaviors has become increasingly crucial. The ability of individual investors to quickly mobilize capital and their growing influence on market dynamics make them a force that cannot be ignored in today’s financial landscape.
Key Points: – Eli Lilly reports blowout Q2 earnings and revenue, crushing analyst estimates – Strong Mounjaro diabetes and Zepbound weight loss drug sales drive guidance hike – Company boosts full-year revenue outlook by $3 billion, adjusts earnings higher
Eli Lilly, the pharmaceutical industry leader, has delivered a remarkable performance in the second quarter of 2024, with earnings and revenue results that have easily surpassed Wall Street’s expectations. The driving force behind the company’s stellar Q2 2024 financial figures was the skyrocketing demand for its blockbuster diabetes treatment Mounjaro and weight loss injection Zepbound.
Eli Lilly reported second-quarter earnings per share of $3.92, far exceeding the $2.60 expected by analysts. Revenue for the period came in at $11.30 billion, a 36% increase from the same quarter a year earlier and well above the $9.92 billion consensus estimate. This strong showing prompted the company to significantly raise its full-year revenue outlook, increasing the range by $3 billion to between $45.4 billion and $46.6 billion. Additionally, Eli Lilly hiked its adjusted earnings guidance for 2024 to $16.10 to $16.60 per share, up from the previous range of $13.50 to $14 per share.
The exceptional sales of Mounjaro and Zepbound were the primary drivers behind Eli Lilly’s blowout Q2 2024 results. Mounjaro, the company’s in-demand diabetes drug, generated $3.09 billion in revenue during the second quarter, more than tripling the sales it recorded a year earlier. Meanwhile, Zepbound, Eli Lilly’s weight loss injection, raked in $1.24 billion, significantly exceeding the $922.2 million that analysts had anticipated.
The surging demand for these incretin-based therapies has compelled Eli Lilly to rapidly scale up its production capabilities to meet market needs. The company has built six new manufacturing plants and hired thousands of additional workers to increase its output. CEO David Ricks stated that the company expects incretin drug production in the second half of 2024 to be 50% higher than it was during the same period last year, with further ramp-ups planned for 2025.
Eli Lilly’s ability to quickly adapt and expand its manufacturing capacity has been a key factor in its success. The company’s agility in addressing supply constraints and delivering a steady stream of its in-demand Mounjaro and Zepbound products has resonated with both healthcare providers and patients. As the market for incretin-based treatments continues to grow, Eli Lilly’s strategic investments in production and its relentless focus on meeting demand have positioned the company as a dominant player in the field of metabolic disorder therapies.
Looking ahead, Eli Lilly remains optimistic about the long-term prospects for its diabetes and weight loss drugs. The company is not only working to further increase its manufacturing capabilities but is also developing more convenient weight loss pills, which could help it capitalize on the skyrocketing demand for effective obesity treatments.
For investors, Eli Lilly’s stellar Q2 2024 performance and guidance hike underscore the company’s ability to navigate the evolving healthcare landscape and deliver consistent growth. As the pharmaceutical industry continues to evolve, Eli Lilly’s focus on innovation, agility, and meeting the needs of patients and healthcare providers has solidified its position as a leader in the field of metabolic disorder treatments.
Key Points: – Rate cuts typically stimulate economic growth by reducing borrowing costs. – In today’s market, rate cuts may have limited impact due to already low rates and economic uncertainties. – Potential consequences include increased inflation risk and asset bubbles.
The Federal Reserve’s decision to cut interest rates is a powerful tool in monetary policy, often employed to stimulate economic growth during periods of slowdown or recession. Traditionally, rate cuts have been associated with increased borrowing, spending, and investment. However, in today’s unique economic landscape, the effects of such a move may be more nuanced and less predictable than in the past.
Typically, when the Fed lowers its benchmark interest rate, it sets off a chain reaction throughout the economy. Banks respond by reducing their prime lending rates, which in turn lowers the cost of borrowing for businesses and consumers. This cheaper access to credit can lead to increased spending and investment, potentially boosting economic growth and employment.
For businesses, lower interest rates can make it more attractive to take out loans for expansion, equipment purchases, or research and development. Consumers may find it easier to finance big-ticket items like homes and cars, or to refinance existing debt at more favorable terms. Additionally, lower rates often lead to a depreciation in the value of the dollar, which can benefit U.S. exporters by making their products more competitive in global markets.
However, the current economic environment presents unique challenges that may alter the effectiveness of rate cuts. Interest rates are already at historically low levels, leaving less room for significant reductions. The COVID-19 pandemic has introduced unprecedented uncertainties into the global economy, affecting consumer behavior, supply chains, and business operations in ways that may not be easily addressed by traditional monetary policy tools.
In today’s market conditions, a rate cut might have limited impact on stimulating growth. Many businesses and consumers are hesitant to take on new debt or make major investments due to ongoing economic uncertainties. The effectiveness of rate cuts may also be dampened by other factors such as high levels of existing debt, concerns about future tax increases to address growing government deficits, or fears of potential asset bubbles.
One potential consequence of further rate cuts in the current environment is an increased risk of inflation. As more money enters the economy through easier credit, there’s a possibility that prices could rise more rapidly, especially if supply chain disruptions persist. This could erode purchasing power and potentially lead to economic instability if not carefully managed.
Another consideration is the impact on savers and retirees who rely on interest income. Lower rates mean reduced returns on savings accounts, certificates of deposit, and other fixed-income investments. This can be particularly challenging for older adults who depend on these income streams to supplement their retirement.
The stock market often reacts positively to rate cuts in the short term, as lower borrowing costs can boost corporate profits and make stocks more attractive compared to bonds. However, this effect may be less pronounced in today’s market, where stock valuations are already high and investors are weighing numerous other factors beyond interest rates.
For the housing market, lower rates typically lead to increased affordability and demand. However, in the current climate of limited housing supply and already high home prices in many areas, further rate cuts may have a muted effect on home sales and could potentially contribute to unsustainable price increases.
In conclusion, while Federal Reserve rate cuts have historically been a reliable tool for stimulating economic growth, their effectiveness in today’s unique market conditions is less certain. Policymakers and market participants alike must carefully consider the potential benefits and risks of further rate reductions, given the complex interplay of factors affecting the current economy. As always, a balanced approach that considers monetary policy alongside fiscal measures and structural reforms may be necessary to navigate the challenges and opportunities presented by today’s economic landscape.
Key Points: – Seres Therapeutics to sell VOWST assets to Nestlé Health Science for an undisclosed sum – Transaction expected to retire Seres’ debt and extend cash runway into Q4 2025 – Company to refocus on developing SER-155 and other cultivated microbiome therapeutics
Seres Therapeutics has announced plans to sell its groundbreaking microbiome therapy VOWST to Nestlé Health Science. This transaction, detailed in a non-binding memorandum of understanding, marks a significant shift in Seres’ business strategy and financial outlook.
VOWST, approved by the FDA in April 2023, made history as the first orally administered microbiome therapeutic for preventing recurrent Clostridioides difficile infection (CDI). The drug’s development and initial commercialization were part of a license agreement between Seres and Nestlé Health Science, established in July 2021. Now, Nestlé Health Science is poised to take full ownership of VOWST, consolidating its position in the microbiome therapeutics market.
For Seres, this deal represents more than just a product sale. It’s a calculated decision to strengthen its financial position and refocus its efforts on developing new microbiome-based treatments. The company expects to receive capital infusions, including an upfront payment, which will be used to fully retire its existing debt facility with Oaktree Capital Management. This financial restructuring is projected to extend Seres’ cash runway into the fourth quarter of 2025, providing crucial time and resources for its next phase of development.
Eric Shaff, President and CEO of Seres, emphasized the company’s pride in bringing VOWST to market and assured a smooth transition of the product to Nestlé Health Science. He highlighted the exciting new chapter ahead for Seres, focusing on advancing SER-155 and other wholly-owned cultivated microbiome therapeutic candidates.
The company’s future pipeline targets several underserved patient groups, including those with chronic liver disease, cancer neutropenia, and solid organ transplants. Seres’ approach aims to protect medically vulnerable patients from life-threatening infections while addressing the global challenge of antimicrobial resistance (AMR).
SER-155, currently in a Phase 1b study, is at the forefront of Seres’ new direction. The drug is being evaluated in patients receiving allogeneic hematopoietic stem cell transplantation, with the potential to reduce gastrointestinal and related bloodstream infections, as well as the incidence of acute graft-versus-host disease.
This strategic pivot allows Seres to concentrate its resources on developing innovative microbiome therapeutics that could have far-reaching impacts on patient care. By divesting VOWST, the company is betting on its ability to create value through its pipeline of cultivated oral microbiome therapeutics.
The transaction, expected to close within 90 days, is subject to negotiation of definitive agreements, Seres’ shareholder approval, and other customary conditions. During the transition, Seres will support the full transfer of VOWST to Nestlé Health Science and ensure continuity of the supply chain through a transition service agreement.
This deal underscores the dynamic nature of the biotech industry, where companies must often make bold moves to secure their financial future and pursue promising research avenues. For Seres Therapeutics, selling VOWST represents both an end and a beginning – closing the chapter on its first FDA-approved product while opening new possibilities in microbiome therapeutics development.
As the microbiome therapeutics field continues to evolve, all eyes will be on Seres to see how this strategic shift plays out in the coming years. The success of this transaction and the company’s future pipeline could have significant implications not just for Seres, but for the broader landscape of microbiome-based treatments.
DENVER, July 30, 2024 (GLOBE NEWSWIRE) — Medicine Man Technologies, Inc., operating as Schwazze, (OTC: SHWZ) (Cboe CA: SHWZ) (“Schwazze” or the “Company”), will host a conference call on Tuesday, August 13, 2024 at 5:00 p.m. Eastern time to discuss its financial and operational results for the second quarter ended June 30, 2024. The Company’s results will be reported in a press release prior to the call.
The Schwazze management team will host the conference call, followed by a question-and-answer period. Interested parties may submit questions to the Company prior to the call by emailing ir@schwazze.com.
Date: Tuesday, August 13, 2024 Time: 5:00 p.m. Eastern time Toll-free dial-in: (844) 825-9789 International dial-in: (412) 317-5180 Conference ID: 10191294 Webcast: SHWZ Q2 2024 Earnings Call
The conference call will also be broadcast live and available for replay on the investor relations section of the Company’s website at https://ir.schwazze.com.
If you have any difficulty registering or connecting with the conference call, please contact Elevate IR at (720) 330-2829.
About Schwazze
Schwazze (OTC: SHWZ) (Cboe CA: SHWZ) is building a premier vertically integrated regional cannabis company with assets in Colorado and New Mexico and will continue to take its operating system to other states where it can develop a differentiated regional leadership position. Schwazze is the parent company of a portfolio of leading cannabis businesses and brands spanning seed to sale.
Schwazze is anchored by a high-performance culture that combines customer-centric thinking and data science to test, measure, and drive decisions and outcomes. The Company’s leadership team has deep expertise in retailing, wholesaling, and building consumer brands at Fortune 500 companies as well as in the cannabis sector.
Medicine Man Technologies, Inc. was Schwazze’s former operating trade name. The corporate entity continues to be named Medicine Man Technologies, Inc. Schwazze derives its name from the pruning technique of a cannabis plant to enhance plant structure and promote healthy growth. To learn more about Schwazze, visit http://www.schwazze.com/.
Investor Relations Contact
Sean Mansouri, CFA or Aaron D’Souza Elevate IR (720) 330-2829 ir@schwazze.com
Key Points: – Lundin Mining and BHP form a C$4.1 billion joint venture to acquire Filo Corp. – The deal focuses on developing the Filo del Sol and Josemaria copper projects in the Vicuña District. – This transaction reflects industry trends towards consolidation, copper focus, and long-term district-scale development.
The recent announcement of Lundin Mining and BHP’s joint acquisition of Filo Corp. and the formation of a 50/50 joint venture marks a significant milestone in the global mining industry, particularly in the copper sector. This C$4.1 billion deal, valuing Filo at C$33.00 per share, represents a strategic move to consolidate and develop one of the world’s most promising copper districts. At the heart of this transaction are two key projects: the Filo del Sol (FDS) copper-gold-silver deposit and the Josemaria copper project, located along the Argentina-Chile border. Together, these projects form part of the emerging Vicuña District, which has the potential to become one of the world’s largest copper mining complexes.
The deal structure is multifaceted, with Lundin Mining and BHP jointly acquiring Filo Corp. Filo shareholders have the option to receive cash, Lundin Mining shares, or a combination thereof. Concurrently, BHP will pay Lundin Mining US$690 million for a 50% stake in the Josemaria project, forming a joint venture that will control both FDS and Josemaria.
This transaction offers valuable insights into the current state and future direction of the mining sector. It exemplifies the ongoing trend of consolidation in the industry, particularly in copper mining. As easily accessible deposits become scarcer, major players are joining forces to tackle more challenging, but potentially more rewarding, projects. The significant premium paid for Filo Corp. underscores the growing importance of copper in the global economy, with the metal playing a crucial role in renewable energy and electric vehicle technologies.
The joint venture’s focus on developing the entire Vicuña District, rather than individual projects, reflects a shift towards more comprehensive, long-term approaches in mining. This strategy allows for greater operational synergies and more efficient use of infrastructure. By partnering, Lundin Mining and BHP are effectively sharing both the risks and rewards of these large-scale projects. BHP brings its extensive experience in developing major mining operations, while Lundin Mining contributes its regional expertise and the advanced stage of the Josemaria project.
The commitment to develop the projects “in accordance with sound mining principles consistent with international industry standards” highlights the increasing importance of environmental, social, and governance (ESG) factors in mining operations. This focus on sustainability and responsible mining practices is becoming a key consideration for investors and stakeholders in the industry.
The location of these projects in Argentina and Chile underscores the continued importance of South America in global copper production, despite recent political uncertainties in some countries in the region. With the potential for a “multi-generational mining district,” this deal reflects a long-term outlook in the mining sector, looking beyond current market conditions to secure resources for future decades.
As the global demand for copper continues to grow, driven by green energy transitions and technological advancements, deals of this magnitude and strategic importance are likely to become more common. The success of this joint venture could set a precedent for future partnerships in the industry, as companies seek to balance the immense capital requirements and risks associated with developing world-class deposits against the potential long-term rewards.
The mining sector, particularly in copper, is clearly entering a new era characterized by larger, more complex projects that require collaboration among major players. This deal between Lundin Mining and BHP could reshape the landscape of the global mining industry in the years to come, potentially inspiring similar collaborations and strategic partnerships. As the world increasingly turns to electrification and renewable energy, the importance of securing and developing large-scale copper resources will only continue to grow, making deals like this one crucial for meeting future global demand.
Investor / Attendee registration for NobleCon20 – Noble Capital Markets’ 20th Annual Emerging Growth Equity Conference – is now open!
Your paid registration includes access to all NobleCon20 events, including company presentations, scheduled 1×1 meetings with corporate executives (for qualified investors only), opening panels on both days, the headlining event featuring 2 of the original “Sharks” from ABC’s Shark Tank, and the Tuesday evening “After” networking hangar party. Registration also includes lunch on both days of the conference.
Investor / Attendee registration for NobleCon20 is $399 – As a Channelchek member you are entitled to a $250 discount – simply enter code CCMEMBERDISC at checkout.
Also Available: VIP “Shark” Package – Exclusive Seating and Meet & Greet
World famous investors and stars of the ABC hit series Shark Tank will hit the NobleCon stage for a first – following a moderated fireside chat, venture capitalist “Mr. Wonderful,” Kevin O’Leary, information tech mogul Robert Herjavec, and FUBU founder Daymond John will travel down “Alligator Alley” to adjudicate a selection of pitches from the business community and Florida Atlantic students and alumni. This is your opportunity for best-in-the-house seating in the auditorium (seats 2400) and an EXCLUSIVE MEET & GREET / PHOTO OP with the “Sharks,” immediately following the stage event. Strictly limited to 100. $750 per person.
WESTON, Fla., July 25, 2024 (GLOBE NEWSWIRE) — ZyVersa Therapeutics, Inc. (Nasdaq: ZVSA, or “ZyVersa”), a clinical stage specialty biopharmaceutical company developing first-in-class drugs for treatment of inflammatory and renal diseases, announces that obesity and its related metabolic complications has been selected as the lead indication for Inflammasome ASC Inhibitor IC 100.
“Obesity, a well-established risk factor for an array of different metabolic disorders, including insulin resistance, type 2 Diabetes, hypertension, cardiovascular disease, and cancer, has reached pandemic proportions, affecting up to two-thirds of the adult population in developed countries,” stated Stephen C. Glover, ZyVersa’s Co-founder, Chairman, CEO and President. “Published research demonstrating that inflammasome activation in fat tissue triggers cell death and systemic release of proinflammatory IL-1β, and ASC specks, which can perpetuate and spread inflammation leading to metabolic disturbances associated with obesity provides support for Inflammasome ASC Inhibitor IC 100 as a potential therapeutic option. We are excited about progressing our development program in this area of high unmet needs.”
Following is the rationale behind selection of obesity and related metabolic complications, and an overview of the development program.
Why Obesity and Related Metabolic Complications as an Indication?
Large Growing Market: The global obesity drug market reached nearly $24 billion in 2023, more than a sevenfold growth in just three years, and it is forecasted by IQVIA t to reach up to $131 Billion by 2028 (24 – 27% CAGR).
Significant Health and Economic Impact: Obesity, which now affects over 40% of Americans (CDC), is associated with multiple chronic medical conditions, including type 2 diabetes, heart disease, and some forms of cancer, at an annual cost and economic impact exceeding 1.4 trillion in the United States including healthcare expenditures, loss of productivity (Milken Institute).
Need for Alternative Mechanisms of Action to Complement GLP-1 agonists: While GLIP-1 drugs deliver meaningful weight loss, improve glucose control, and help to mitigate cardiovascular disease, they do not address the chronic tissue inflammation observed in adipose tissue, liver, muscle, and pancreatic islet cells that has emerged as a key feature of obesity. This chronic tissue inflammation, termed, “immunometabolism,” leads to insulin resistance, beta cell dysfunction, and development of type 2 diabetes and long-term inflammatory complications including microvascular disease (retinopathy, nephropathy, and neuropathy), macrovascular disease (stroke, myocardial infarction, and peripheral arterial disease), heart failure, and nonalcoholic fatty liver disease. As such, anti-inflammatory drugs have potential to provide additional benefits in obesity management (Immunity. 2022 Jan 11;55(1):31-55).
Rationale for Inflammasome Inhibitors as a Treatment for Obesity and Related Metabolic Complications
Inflammasomes, which are activated by nutrients, such as glucose and free fatty acids, trigger activation and stimulation of downstream inflammatory pathways, leading to chronic inflammation in obesity (Front Endocrinol (Lausanne). 2023 Aug 31;14:1232171).
Nutrient overload triggers inflammasome-induced inflammation in the brain’s hypothalamus, causing increased appetite and food intake, increasing the number and size of fat cells associated with weight gain and obesity.
The fat cells become hypoxic, resulting in cell death and macrophage recruitment. This leads to inflammasome activation, death of inflamed cells, and systemic release of proinflammatory cytokines, such as IL-1β, and ASC specks, spreading inflammation throughout the body. If unresolved, sustained inflammation leads to the metabolic complications of obesity.
Why Inflammasome ASC Inhibitor IC 100?
Multiple types of inflammasomes, not just NLRP3, are activated in obesity and related metabolic complications (NLRP1, NLRP3, NLRC4, and AIM2). Because IC 100 targets the inflammasome ASC component, it inhibits each of these inflammasomes, including NLRP3, with potential to better attenuate the damaging inflammation associated with obesity and its complications (Immunology. 2021 Aug;163(4):348-362).
Inflammation is spread and perpetuated by systemic release of proinflammatory IL-1β and ASC specks during death of inflamed cells, leading to obesity-related complications. IC 100 disrupts the structure and function of ASC specks, thereby attenuating spread and perpetuation of inflammation (Transl Res. 2022 Jul 3:S1931-5244(22)00150-5).
ZyVersa believes that inflammasome ASC Inhibitor IC 100 administered concurrently with GLIP-1 agonists will lead to incremental weight loss, and more importantly, attenuate the chronic tissue inflammation not addressed by GLIP-1 agonists to reduce the long-term micro- and macrovascular inflammatory complications.
Inflammasome ASC Inhibitor IC 100 Development Plans for Obesity and Related Complications
IC 100’s preclinical program is nearing completion, with a planned Investigational New Drug (IND) submission Q4-2024, and Phase 1 clinical trial initiation shortly thereafter.
Preclinical scientific collaboration to assess IC 100 as a potential treatment for atherosclerosis, a common obesity-related metabolic complication, is expected to conclude H2-2024.
Preclinical scientific collaboration with University of Miami Miller School of Medicine to assess IC 100 as a potential treatment for obesity and metabolic syndrome is expected to begin H2-2024, with a second study looking at concomitant treatment with IC 100 and a GLIP-1 agonist to begin shortly thereafter.
ZyVersa has recruited six top-tiered experts in obesity and related metabolic complications for a scientific advisory board to guide clinical development plans for IC 100, which will be announced in the next few weeks.
About Inflammasome ASC Inhibitor IC 100
IC 100 is a novel humanized IgG4 monoclonal antibody that inhibits the inflammasome adaptor protein ASC. IC 100 was designed to attenuate both initiation and perpetuation of the inflammatory response. It does so by binding to a specific region of the ASC component of multiple types of inflammasomes, including NLRP1, NLRP2, NLRP3, NLRC4, AIM2, and Pyrin. Intracellularly, IC 100 binds to ASC monomers, inhibiting inflammasome formation, thereby blocking activation of IL-1β early in the inflammatory cascade. IC 100 also binds to ASC in ASC Specks, both intracellularly and extracellularly, further blocking activation of IL-1β and the perpetuation of the inflammatory response that is pathogenic in inflammatory diseases. Because active cytokines amplify adaptive immunity through various mechanisms, IC 100, by attenuating cytokine activation, also attenuates the adaptive immune response. The lead indication for IC 100 is obesity and its associated metabolic complications. To review a white paper summarizing the mechanism of action and preclinical data for IC 100, Click Here.
About ZyVersa Therapeutics, Inc.
ZyVersa (Nasdaq: ZVSA) is a clinical stage specialty biopharmaceutical company leveraging advanced proprietary technologies to develop first-in-class drugs for patients with inflammatory or kidney diseases with high unmet medical needs. We are well positioned in the rapidly emerging inflammasome space with a highly differentiated monoclonal antibody, Inflammasome ASC Inhibitor IC 100, and in kidney disease with phase 2 Cholesterol Efflux MediatorTM VAR 200. The lead indication for IC 100 is obesity and its associated metabolic complications, and for VAR 200, focal segmental glomerulosclerosis (FSGS). Each therapeutic area offers a “pipeline within a product,” with potential for numerous indications. The total accessible market is over $100 billion. For more information, please visit www.zyversa.com.
Certain statements contained in this press release regarding matters that are not historical facts, are forward-looking statements within the meaning of Section 21E of the Securities Exchange Act of 1934, as amended, and the Private Securities Litigation Reform Act of 1995. These include statements regarding management’s intentions, plans, beliefs, expectations, or forecasts for the future, and, therefore, you are cautioned not to place undue reliance on them. No forward-looking statement can be guaranteed, and actual results may differ materially from those projected. ZyVersa Therapeutics, Inc (“ZyVersa”) uses words such as “anticipates,” “believes,” “plans,” “expects,” “projects,” “future,” “intends,” “may,” “will,” “should,” “could,” “estimates,” “predicts,” “potential,” “continue,” “guidance,” and similar expressions to identify these forward-looking statements that are intended to be covered by the safe-harbor provisions. Such forward-looking statements are based on ZyVersa’s expectations and involve risks and uncertainties; consequently, actual results may differ materially from those expressed or implied in the statements due to a number of factors, including ZyVersa’s plans to develop and commercialize its product candidates, the timing of initiation of ZyVersa’s planned preclinical and clinical trials; the timing of the availability of data from ZyVersa’s preclinical and clinical trials; the timing of any planned investigational new drug application or new drug application; ZyVersa’s plans to research, develop, and commercialize its current and future product candidates; the clinical utility, potential benefits and market acceptance of ZyVersa’s product candidates; ZyVersa’s commercialization, marketing and manufacturing capabilities and strategy; ZyVersa’s ability to protect its intellectual property position; and ZyVersa’s estimates regarding future revenue, expenses, capital requirements and need for additional financing.
New factors emerge from time-to-time, and it is not possible for ZyVersa to predict all such factors, nor can ZyVersa assess the impact of each such factor on the business or the extent to which any factor, or combination of factors, may cause actual results to differ materially from those contained in any forward-looking statements. Forward-looking statements included in this press release are based on information available to ZyVersa as of the date of this press release. ZyVersa disclaims any obligation to update such forward-looking statements to reflect events or circumstances after the date of this press release, except as required by applicable law.
This press release does not constitute an offer to sell, or the solicitation of an offer to buy, any securities.
Corporate, Media, and IR Contact: Karen Cashmere Chief Commercial Officer kcashmere@zyversa.com 786-251-9641
Key Points: – Nasdaq falls nearly 3% after disappointing earnings from Alphabet and Tesla – Tech sector leads market decline, potentially signaling a shift in investor sentiment – Economic data adds to concerns about U.S. economic health
The U.S. stock market experienced a significant downturn on Wednesday, primarily driven by underwhelming earnings reports from major technology companies. This event highlights the influential role these firms play in overall market performance.
The Nasdaq Composite, which is heavily weighted towards technology stocks, dropped by almost 3%, marking its largest single-day decline since late 2022. The broader S&P 500 index also fell by 1.7%, while the Dow Jones Industrial Average decreased by 0.8%.
Two key players in the tech sector, Alphabet (Google’s parent company) and Tesla, reported earnings that fell short of investor expectations. Alphabet’s shares declined despite beating overall revenue and profit forecasts, as YouTube advertising revenue underperformed. Tesla’s stock price fell more sharply, following weaker-than-anticipated results and a decrease in automotive revenue compared to the previous year.
The disappointing performance of these tech giants had a ripple effect across the sector. Other major technology companies, including Nvidia, Meta Platforms, and Microsoft, also saw their stock prices decline in sympathy.
It’s worth noting that these large technology companies have been the primary drivers of market gains this year. Their outsized influence means that when they underperform, it can have a significant impact on overall market indices.
Interestingly, while large-cap tech stocks struggled, smaller companies showed resilience. The Russell 2000 small-cap index has performed well this month, potentially indicating a shift in investor focus towards a broader range of stocks.
Adding to market concerns, recent economic data painted a mixed picture of the U.S. economy. A report showed manufacturing activity unexpectedly contracting, while new home sales came in below expectations. These indicators raised questions about the overall health of the economy.
However, it’s important to maintain perspective. Despite the disappointing results from some tech giants, the broader earnings season has started positively. Over 25% of S&P 500 companies have reported second-quarter earnings, with about 80% exceeding expectations.
For investors, particularly those new to the market, this event serves as a reminder of the importance of diversification. Relying too heavily on a small group of high-performing stocks can increase risk. It also demonstrates that even the most successful companies can face challenges.
As we move forward, market participants will be closely monitoring upcoming earnings reports and economic data. The next few weeks will be crucial in determining whether this is a temporary setback or the beginning of a more significant market shift.
In conclusion, while days like this can be unsettling, they are a normal part of market dynamics. Understanding these fluctuations and maintaining a balanced, long-term perspective is key to navigating the complexities of the stock market.
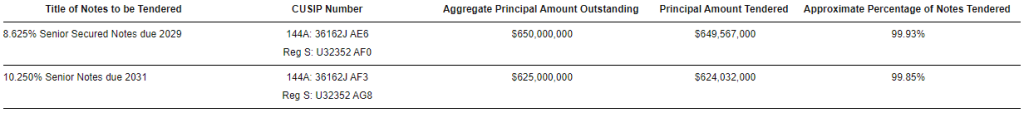
BOCA RATON, Fla.–(BUSINESS WIRE)–Jul. 17, 2024– The GEO Group (NYSE: GEO) (“GEO” or the “Company”) announced today that it has extended its offers to exchange (the “Exchange Offer”) (i) up to $650.0 million aggregate principal amount of registered 8.625% Senior Secured Notes due 2029 (the “Secured Exchange Notes”) for any and all of its $650.0 million aggregate principal amount of unregistered 8.625% Senior Secured Notes due 2029 that were issued in a private placement on April 18, 2024 (the “Secured Original Notes”), and (ii) up to $625.0 million aggregate principal amount of registered 10.250% Senior Notes due 2031 (the “Unsecured Exchange Notes” and, together with the Secured Exchange Notes, the “Exchange Notes”) for any and all of its $625.0 million aggregate principal amount of unregistered 10.250% Senior Notes due 2031 that were issued in a private placement on April 18, 2024 (the “Unsecured Original Notes” and, together with the Secured Original Notes, the “Original Notes”).
The Exchange Offer, which was previously scheduled to expire at 5:00 p.m., New York City time, on July 16, 2024, will now expire at 5:00 p.m., New York City time, on July 23, 2024, unless earlier terminated or extended by the Company (such date and time, including any extension, the “Expiration Date”). Any Original Notes tendered may be withdrawn at any time prior to the Expiration Date, but not thereafter (the “Withdrawal Deadline”). Except for the extension of the Expiration Date and Withdrawal Deadline, all other terms of the Exchange Offer remain in full force and effect.
As of 5:00 p.m., New York City time, on July 16, 2024, which was the previous expiration date for the Exchange Offer, the aggregate principal amount of the Original Notes validly tendered and not validly withdrawn, as advised by D.F. King & Co., Inc., the Exchange Agent for the Exchange Offer, was as set forth in the table below:
The terms and conditions of the Exchange Offer are described in the Prospectus, dated June 14, 2024 and the Prospectus Supplement, dated June 27, 2024, which forms a part of the Registration Statement on Form S-4 filed with the Securities and Exchange Commission on May 31, 2024 and declared effective on June 13, 2024 (the “Registration Statement”). The Expiration Date for the Exchange Offer is being extended to provide time for remaining outstanding Original Notes to be tendered for exchange. The Exchange Offer is not conditioned upon any minimum amount of Original Notes being tendered. Subject to applicable law, the Company may waive certain other conditions applicable to the Exchange Offer or extend, terminate or otherwise amend the Exchange Offer in its sole discretion.
This news release is for informational purposes only and does not constitute an offer to sell or a solicitation of an offer to participate in the Exchange Offer, nor shall there be any sale of the Exchange Notes or exchange of the Original Notes in any state or jurisdiction in which such an offer, solicitation or sale would be unlawful. The Exchange Offer is being made solely pursuant to the Registration Statement. Copies of the Registration Statement and related prospectus can be obtained without charge by visiting the SEC website at www.sec.gov; by contacting D.F. King & Co., Inc., 48 Wall Street, 22nd Floor, New York, NY 10005; by calling toll-free at (800) 848-3405; or by e-mail at geo@dfking.com.
About The GEO Group
The GEO Group, Inc. (NYSE: GEO) is a leading diversified government service provider, specializing in design, financing, development, and support services for secure facilities, processing centers, and community reentry centers in the United States, Australia, South Africa, and the United Kingdom. GEO’s diversified services include enhanced in-custody rehabilitation and post-release support through the award-winning GEO Continuum of Care®, secure transportation, electronic monitoring, community-based programs, and correctional health and mental health care. GEO’s worldwide operations include the ownership and/or delivery of support services for 100 facilities totaling approximately 81,000 beds, including idle facilities and projects under development, with a workforce of up to approximately 18,000 employees.
Use of Forward-Looking Statements
This news release may contain “forward-looking statements” within the meaning of Section 21E of the Securities Exchange Act of 1934, as amended, and the U.S. Private Securities Litigation Reform Act of 1995. Readers are cautioned not to place undue reliance on these forward-looking statements and any such forward-looking statements are qualified in their entirety by reference to the following cautionary statements. All forward-looking statements speak only as of the date of this news release and are based on current expectations and involve a number of assumptions, risks and uncertainties that could cause the actual results to differ materially from such forward-looking statements. Risks and uncertainties that could cause actual results to vary from current expectations and forward-looking statements contained in this press release include, but are not limited to, risk factors contained in GEO’s filings with the U.S. Securities and Exchange Commission, including its Form 10-K, 10-Q, and 8-K reports. GEO disclaims any obligation to update or revise any forward-looking statements, except as required by law.
MCLEAN, Va., July 16, 2024 /PRNewswire/ — V2X, Inc., (NYSE: VVX), a leading provider of global mission solutions, will report second quarter 2024 financial results on Tuesday, August 6, 2024, before market open. Senior management will conduct a conference call at 8:00 a.m. ET that same day.
U.S.-based participants may dial in to the conference call at 877-506-6380, while international participants may dial 412-542-4198. A live webcast of the conference call as well as an accompanying slide presentation will be available at https://app.webinar.net/Aba2LPOkBXe and on the Investors section of the V2X website at https://gov2x.com/.
A replay of the conference call will be posted on the V2X website shortly after completion of the call and will be available for one year. A telephonic replay will also be available through August 20, 2024, at 844-512-2921 (domestic) or 412-317-6671 (international) with passcode 10190283.
About V2X V2X builds innovative solutions that integrate physical and digital environments by aligning people, actions, and technology. V2X is embedded in all elements of a critical mission’s lifecycle to enhance readiness, optimize resource management, and boost security. The company provides innovation spanning national security, defense, civilian, and international markets. With a global team of approximately 16,000 professionals, V2X enables mission success by injecting AI and machine learning capabilities to meet today’s toughest challenges across all operational domains.
Investor Contact Mike Smith, CFA Vice President, Treasury, Corporate Development and Investor Relations IR@goV2X.com 719-637-5773
Media Contact Angelica Spanos Deoudes Director, Corporate Communications Angelica.Deoudes@goV2X.com 571-338-5195