In a major step forward for the future of mRNA-based medicine, BioNTech SE has announced it will acquire fellow German biotech firm CureVac N.V. in an all-stock deal valued at approximately $1.25 billion. The transaction is set to bolster BioNTech’s capabilities in cancer immunotherapy and mRNA research, positioning the company for deeper innovation and broader commercialization in oncology.
Under the terms of the agreement, CureVac shareholders will receive approximately $5.46 in BioNTech American Depositary Shares (ADSs) for each CureVac share—representing a 55% premium over CureVac’s three-month average trading price. The exchange ratio will be adjusted depending on the 10-day average trading price of BioNTech stock leading up to the deal’s closure. Upon completion, CureVac shareholders are expected to own between 4% and 6% of BioNTech’s outstanding shares.
Both companies are pioneers in mRNA-based technologies, with BioNTech gaining international prominence for its COVID-19 vaccine co-developed with Pfizer. CureVac has long focused on developing mRNA therapeutics for cancer and infectious diseases. The deal unites two complementary platforms, merging BioNTech’s commercial success and oncology pipeline with CureVac’s expertise in mRNA design and lipid nanoparticle (LNP) delivery systems.
“This transaction is another building block in BioNTech’s oncology strategy and an investment in the future of cancer medicine,” said Prof. Ugur Sahin, CEO and Co-Founder of BioNTech. “By combining our strengths, we aim to accelerate the development of innovative and transformative cancer treatments that could become new standards of care.”
CureVac CEO Dr. Alexander Zehnder echoed Sahin’s sentiment, describing the acquisition as a shared mission rather than just a financial deal. “For more than 20 years, both companies have worked toward unlocking the potential of mRNA. This union represents a powerful convergence of technologies, cultures, and visions to push the boundaries of what’s possible in medicine,” Zehnder said.
The acquisition will integrate CureVac’s advanced R&D and manufacturing site in Tübingen into BioNTech’s broader operations. CureVac will become a wholly owned subsidiary of BioNTech, and a full corporate reorganization will follow the completion of the exchange offer, expected later this year.
The deal already has substantial shareholder backing. CureVac’s largest investor, dievini Hopp BioTech, and its affiliates—which collectively hold over 36% of CureVac shares—have agreed to support the transaction. Including other key stakeholders and the German government’s investment arm, BioNTech expects support from shareholders holding more than 50% of CureVac’s shares, positioning the company well to meet the 80% acceptance threshold required to finalize the transaction.
The boards of both companies have unanimously approved the deal, which now awaits regulatory approval and final shareholder votes. Legal and financial advisors for the deal include Covington & Burling LLP and PJT Partners for BioNTech, and Goldman Sachs and Skadden for CureVac.
This acquisition cements BioNTech’s strategy to lead the next generation of cancer therapies, leveraging the full power of mRNA science in the fight against some of the world’s most challenging diseases.
Key Points: – Quantum computing stocks surged after Nvidia’s CEO said the field is nearing an “inflection point.” – IBM’s announcement of a fault-tolerant quantum computer by 2029 marks a breakthrough toward real-world applications. – Big Tech and investors alike are ramping up bets on quantum as its commercial potential begins to materialize.
Shares of quantum computing companies soared midweek following a wave of renewed optimism about the sector’s near-term potential. The rally was sparked by remarks from Nvidia CEO Jensen Huang, who highlighted the accelerating pace of progress in quantum technology during the company’s developer conference in Paris.
Huang told attendees that quantum computing is approaching a pivotal stage in its development — a shift from theoretical promise to tangible application. His statements mark a notable departure from his more conservative estimates earlier this year, when he suggested commercially viable quantum machines could be decades away. This change in tone sent investor sentiment surging.
As a result, several companies in the space saw their stock prices jump significantly. Quantum Computing Inc. gained over 30% in early trading Wednesday, while Rigetti Computing and IonQ also posted strong single- and double-digit gains. The moves stand out against a largely flat broader market, reflecting growing confidence in the industry’s progress and future revenue potential.
The renewed excitement comes just one day after IBM revealed plans to launch the world’s first large-scale quantum computer designed to run without the common errors that have plagued existing systems. That machine is expected to debut by 2029, representing what analysts view as a meaningful advance toward practical, scalable quantum computing.
Unlike traditional computers, which process information in binary form, quantum computers harness the principles of quantum mechanics to perform calculations at exponentially faster speeds. Their unique architecture holds the potential to revolutionize fields that require complex computation, such as cryptography, materials science, drug discovery, and optimization problems in logistics.
However, the path to that reality has been hindered by a major obstacle: quantum systems are notoriously sensitive to external interference, often producing inaccurate results. IBM’s announcement, alongside accelerated efforts from major players like Google, Amazon, and Microsoft, signals a growing industry-wide push to solve these reliability challenges.
Nvidia’s increasing involvement in the sector further underscores the growing convergence between quantum and classical computing. In March, the company hosted its first-ever “Quantum Day” and announced plans to establish a quantum research hub in Boston. The move reflects Nvidia’s strategy to remain at the forefront of next-generation computing platforms as it expands beyond AI chips into quantum-ready infrastructure.
While fully fault-tolerant quantum systems may still be years away, the latest developments suggest progress is unfolding faster than many previously expected. If the momentum continues, quantum computing could become one of the most disruptive technologies of the next decade.
Key Points: – CPI and PPI inflation reports for May are due this week, with modest increases expected but upside risks from tariffs. – Treasury auctions of 10- and 30-year bonds will test investor demand amid rising deficits and higher yields. – The results may influence Federal Reserve policy and market volatility, especially if inflation surprises to the upside.
Investors are bracing for a potentially volatile week as key inflation reports and large government bond auctions test the strength of the U.S. fixed income market. With concerns rising around growing fiscal deficits, tariffs, and monetary policy uncertainty, both data and demand will be under a microscope.
The Bureau of Labor Statistics is set to release two important indicators: the Consumer Price Index (CPI) for May on Wednesday, followed by the Producer Price Index (PPI) on Thursday. These readings come at a delicate time for markets already on edge over the potential long-term impact of President Trump’s recent tariffs and record government spending.
Economists forecast modest increases, with CPI expected to rise 0.2% month-over-month and 2.4% year-over-year. The core CPI, which excludes food and energy, is projected to climb 0.3% from April and 2.9% annually. Producer prices, which declined in April, are expected to bounce back slightly, with consensus pointing to a 0.2% monthly gain in headline PPI and 0.3% in the core reading.
However, any upward surprise in the data could disrupt fragile investor sentiment, especially as rising inflationary pressures threaten to delay future interest rate cuts by the Federal Reserve. Traders will be closely analyzing the data for signs of whether the recent tariffs are starting to flow through to consumer and producer prices.
Compounding the pressure, the U.S. Treasury will hold two major auctions this week: $39 billion in 10-year notes on Wednesday and $22 billion in 30-year bonds on Thursday. These long-duration securities will act as a litmus test for investor demand at a time when U.S. debt levels are drawing increased scrutiny from both markets and policymakers.
Key metrics from the auctions — such as the bid-to-cover ratio, the level of indirect bids, and the yield “tail” — will offer insight into how much appetite exists for U.S. debt amid rising deficits. Yields have already surged in recent weeks as investors demand greater compensation for holding Treasurys amid growing fiscal and geopolitical risks.
While the market remains relatively stable for now, analysts warn that a sudden jump in yields — driven either by weak auction demand or unexpected inflationary pressure — could send ripple effects across equities, credit markets, and consumer borrowing costs.
The bond market has been adjusting ever since the Fed’s rate cut last September, with yields taking another leg higher following Trump’s early April tariff announcement. The impact of these policies may be further amplified if inflation data begins trending upward over the coming months.
Even amid concerns, some analysts remain cautiously optimistic. Strong relative yields on U.S. Treasurys compared to global peers and signs of a cooling economy may continue to attract foreign and institutional investors seeking safety and steady returns.
Still, with inflation readings, bond supply, and fiscal policy all converging this week, investors are likely to remain on high alert. The outcomes of these events could shape not only the direction of yields but also the Federal Reserve’s monetary roadmap heading into the second half of 2025.
Key Points: – Consumers now expect inflation to rise 3.2% over the next year, down from 3.6% in April, signaling easing price concerns. – President Trump’s decision to pause aggressive tariff plans appears to have calmed inflation fears. – Fewer Americans expect job losses or missed debt payments, and optimism about the stock market has ticked up.
Americans appeared more optimistic about inflation in May, as expectations for rising prices declined across the board, according to a new report from the Federal Reserve Bank of New York. The improvement coincides with President Donald Trump’s decision to ease back on his sweeping tariff threats, providing some relief to consumers and policymakers alike.
The Fed’s Survey of Consumer Expectations, released Monday, showed that the anticipated inflation rate one year from now fell to 3.2%, down from 3.6% in April. It marks one of the sharpest monthly drops in recent years and suggests Americans are growing more confident that inflation may not spiral out of control.
Longer-term inflation outlooks also improved. The three-year expectation ticked down to 3%, while the five-year projection eased to 2.6%. While still above the Federal Reserve’s 2% target, the declines point to a growing belief among households that price pressures could be moderating.
The shift comes after the White House softened its stance on some of its more aggressive trade proposals. In April, President Trump announced sweeping 10% tariffs on all U.S. imports and floated the idea of “reciprocal” duties on specific countries. But by early May, the administration introduced a 90-day negotiation period and paused additional tariff hikes, calming fears of an escalating trade war.
The easing rhetoric appears to have had a measurable effect on consumer sentiment, at a time when officials at the Federal Reserve are closely monitoring expectations to determine the future path of interest rates.
“The inflation outlook is coming down, even as tariff collections rise,” said National Economic Council Director Kevin Hassett in an interview Monday. “It runs counter to the narrative that tariffs automatically lead to higher inflation.”
April’s core Personal Consumption Expenditures (PCE) index, the Fed’s preferred inflation measure, remained at 2.5% — stable, but not accelerating. Headline PCE, which includes food and energy, dipped slightly to 2.1%, one of the lowest levels in over three years.
The New York Fed’s survey also found that inflation expectations declined across several major spending categories. While Americans still expect food prices to climb by 5.5% over the next year — up slightly from April — they foresee smaller increases in gas, rent, medical care, and college tuition.
In addition to inflation, the report included promising data on labor market confidence and household finances. The percentage of respondents who believe they’ll lose their job in the next 12 months dropped to 14.8%, a slight but notable improvement. Meanwhile, fewer Americans expect to miss a minimum debt payment in the near term, with that figure falling to 13.4%, the lowest since January.
Consumers also seem to be gaining confidence in the markets. The share of respondents expecting stock prices to be higher a year from now rose to 36.3%, reflecting optimism despite geopolitical uncertainty.
As policymakers weigh inflation, tariffs, and rate decisions, these improving expectations may offer a signal: Americans are cautiously optimistic that the worst inflation fears could be fading.
RTO Trends. While overall office occupancy improvement trends have somewhat flattened, Steelcase’s key end market, firms in Class A office space, are improving as more large companies are becoming more aggressive about employees returning to the office. And split working environments can be a benefit to Steelcase as employees need to set up work-from-home offices. Steelcase continues to lead the transformation of the workplace.
Equity Research is available at no cost to Registered users of Channelchek. Not a Member? Click ‘Join’ to join the Channelchek Community. There is no cost to register, and we never collect credit card information.
This Company Sponsored Research is provided by Noble Capital Markets, Inc., a FINRA and S.E.C. registered broker-dealer (B/D).
*Analyst certification and important disclosures included in the full report. NOTE: investment decisions should not be based upon the content of this research summary. Proper due diligence is required before making any investment decision.
Resources Connection, Inc. provides agile consulting services in North America, Europe, and the Asia Pacific. The company offers finance and accounting services, including process transformation and optimization, financial reporting and analysis, technical and operational accounting, merger and acquisition due diligence and integration, audit readiness, preparation and response, implementation of new accounting standards, and remediation support. It also provides information management services, such as program and project management, business and technology integration, data strategy, and business performance management. In addition, the company offers corporate advisory, strategic communications, and restructuring services; and corporate governance, risk, and compliance management services, such as contract and regulatory compliance, enterprise risk management, internal controls management, and operation and information technology (IT) audits. Further, it provides supply chain management services comprising strategy development, procurement and supplier management, logistics and materials management, supply chain planning and forecasting, and unique device identification compliance; and human capital services, including change management, organization development and effectiveness, compensation and incentive plan strategies, and optimization of human resources technology and operations. Additionally, the company offers legal and regulatory supporting services for commercial transactions, global compliance initiatives, law department operations, and law department business strategies and analytics. It also provides policyIQ, a proprietary cloud-based governance, risk, and compliance software application. The company was formerly known as RC Transaction Corp. and changed its name to Resources Connection, Inc. in August 2000. Resources Connection, Inc. was founded in 1996 and is headquartered in Irvine, California.
Joe Gomes, CFA, Managing Director, Equity Research Analyst, Generalist , Noble Capital Markets, Inc.
Refer to the full report for the price target, fundamental analysis, and rating.
Transformation. RGP’s business transformation has uniquely positioned the Company to capitalize on shifting demand in its end markets. RGP’s diversified client base and high retention reduce risk and drive long-term value, in our view. The Company’s business is diversified across industries, regions, and service lines, while high retention is growing the lifetime value of clients.
Equity Research is available at no cost to Registered users of Channelchek. Not a Member? Click ‘Join’ to join the Channelchek Community. There is no cost to register, and we never collect credit card information.
This Company Sponsored Research is provided by Noble Capital Markets, Inc., a FINRA and S.E.C. registered broker-dealer (B/D).
*Analyst certification and important disclosures included in the full report. NOTE: investment decisions should not be based upon the content of this research summary. Proper due diligence is required before making any investment decision.
Key Points: – Stocks rose Monday as U.S. and Chinese officials met in London to address trade tensions and discuss resuming critical mineral exports. – Semiconductor and Chinese tech stocks outperformed, with major gains from Qualcomm, AMD, and Alibaba amid optimism over eased restrictions. – Investors await key inflation data later this week, while the S&P 500 continues to approach record highs despite lingering tariff uncertainties.
Stocks climbed on Monday as investors closely monitored renewed trade negotiations between the United States and China. The diplomatic meeting, held in London, marked another key step in the ongoing effort to ease tensions between the world’s two largest economies.
The S&P 500 rose 0.3%, while the Nasdaq Composite added nearly 0.4%. The Dow Jones Industrial Average was also higher, gaining 84 points, or 0.2%, by the end of the trading session.
Representatives from both countries met to resolve outstanding trade issues, including the flow of critical mineral exports. The U.S. delegation included Treasury Secretary Scott Bessent, Commerce Secretary Howard Lutnick, and Trade Representative Jamieson Greer. Discussions centered around verifying China’s commitment to restoring exports of rare earth elements, which are essential for electronics and clean energy technologies.
This round of talks follows a recent phone conversation between President Donald Trump and Chinese President Xi Jinping. In that call, both leaders agreed to pause tariff escalations while negotiations progressed. The latest diplomatic push appears to be an attempt to move beyond high-stakes disputes and toward more sustainable trade cooperation.
Investors responded positively, especially in sectors with direct exposure to China and global supply chains. Semiconductor stocks rallied, with Qualcomm jumping over 4% after announcing its $2.4 billion acquisition of chipmaker Alphawave. Other chipmakers, including Advanced Micro Devices and Texas Instruments, also gained more than 4%. Nvidia saw more modest gains, while Chinese tech giant Alibaba advanced 2%.
The strength in semiconductors and Chinese equities reflects a broader investor belief that trade de-escalation could benefit high-growth sectors reliant on stable cross-border commerce. Market analysts noted increased appetite for risk, particularly in areas sensitive to trade dynamics.
However, not all sectors shared in Monday’s gains. Apple stock declined by 1.5% following the company’s keynote at its 2025 Worldwide Developers Conference. The event featured the first major iOS redesign since 2013, but investors appeared underwhelmed by the announcements.
Looking ahead, inflation remains a key concern for markets. The Consumer Price Index (CPI) is scheduled for release on Wednesday, followed by the Producer Price Index (PPI) on Thursday. These data points will help clarify whether current tariffs are feeding through to consumer and producer prices — a key consideration for Federal Reserve policy decisions in the months ahead.
Despite lingering uncertainties, Wall Street’s mood remains cautiously optimistic. Last week, all three major indexes posted their second consecutive weekly gains. The S&P 500 even closed above the 6,000 mark for the first time since February, now less than 3% from its all-time high. Many investors appear to be looking past short-term trade noise and focusing instead on a more resilient and potentially stimulative economic environment.
Median overall survival (OS) from ateganosine (THIO) treatment extends to 17.8 months in latest data
CHICAGO–(BUSINESS WIRE)– MAIA Biotechnology, Inc. (NYSE American: MAIA) (“MAIA”, the “Company”), a clinical-stage biopharmaceutical company focused on developing targeted immunotherapies for cancer, today announced updated data from its THIO-101 pivotal Phase 2 clinical trial evaluating its lead clinical candidate, ateganosine (THIO), sequenced with Regeneron’s immune checkpoint inhibitor (CPI) cemiplimab (Libtayo®) in patients with advanced non-small cell lung cancer (NSCLC) who are resistant to immune therapy and chemotherapy.
As of May 15, 2025, third line (3L) data showed median overall survival (OS) of 17.8 months for the 22 NSCLC patients who received at least one dose of ateganosine (the intent-to-treat population) in parts A and B of the trial. The updated analysis continues to demonstrate a 95% confidence interval (CI) lower bound of 12.5 months and a 99% CI lower bound of 10.8 months. The treatment has been generally well-tolerated to date in this heavily pre-treated population.1 Studies of standard-of-care (SOC) chemotherapy treatments for NSCLC in a similar setting have shown OS of 5 to 6 months.2-3
“It is gratifying to see that our treatment further extends lives for these hard-to-treat patient populations, especially in third-line NSCLC treatment where patients are most resistant to therapy,” said MAIA Chairman and CEO Vlad Vitoc, M.D. “This new benchmark of 17.8 months median OS is nearly triple the recognized SOC data for third-line NSCLC found in medical literature. We believe this is a substantial indicator of the potential ateganosine has to shift the NSCLC treatment landscape.”
MAIA’s multiple potential regulatory pathways for ateganosine could provide accelerated FDA approval and robust exclusivity in NSCLC, with a potential FDA decision as early as next year.
About Ateganosine
Ateganosine (THIO, 6-thio-dG or 6-thio-2’-deoxyguanosine) is a first-in-class investigational telomere-targeting agent currently in clinical development to evaluate its activity in non-small cell lung cancer (NSCLC). Telomeres, along with the enzyme telomerase, play a fundamental role in the survival of cancer cells and their resistance to current therapies. The modified nucleotide 6-thio-2’-deoxyguanosine induces telomerase-dependent telomeric DNA modification, DNA damage responses, and selective cancer cell death. Ateganosine-damaged telomeric fragments accumulate in cytosolic micronuclei and activates both innate (cGAS/STING) and adaptive (T-cell) immune responses. The sequential treatment of ateganosine followed by PD-(L)1 inhibitors resulted in profound and persistent tumor regression in advanced, in vivo cancer models by induction of cancer type–specific immune memory. Ateganosine is presently developed as a second or later line of treatment for NSCLC for patients that have progressed beyond the standard-of-care regimen of existing checkpoint inhibitors.
About MAIA Biotechnology, Inc.
MAIA is a targeted therapy, immuno-oncology company focused on the development and commercialization of potential first-in-class drugs with novel mechanisms of action that are intended to meaningfully improve and extend the lives of people with cancer. Our lead program is ateganosine (THIO), a potential first-in-class cancer telomere targeting agent in clinical development for the treatment of NSCLC patients with telomerase-positive cancer cells. For more information, please visit www.maiabiotech.com.
Forward Looking Statements
MAIA cautions that all statements, other than statements of historical facts contained in this press release, are forward-looking statements. Forward-looking statements are subject to known and unknown risks, uncertainties, and other factors that may cause our or our industry’s actual results, levels or activity, performance or achievements to be materially different from those anticipated by such statements. The use of words such as “may,” “might,” “will,” “should,” “could,” “expect,” “plan,” “anticipate,” “believe,” “estimate,” “project,” “intend,” “future,” “potential,” or “continue,” and other similar expressions are intended to identify forward looking statements. However, the absence of these words does not mean that statements are not forward-looking. For example, all statements we make regarding (i) the initiation, timing, cost, progress and results of our preclinical and clinical studies and our research and development programs, (ii) our ability to advance product candidates into, and successfully complete, clinical studies, (iii) the timing or likelihood of regulatory filings and approvals, (iv) our ability to develop, manufacture and commercialize our product candidates and to improve the manufacturing process, (v) the rate and degree of market acceptance of our product candidates, (vi) the size and growth potential of the markets for our product candidates and our ability to serve those markets, and (vii) our expectations regarding our ability to obtain and maintain intellectual property protection for our product candidates, are forward looking. All forward-looking statements are based on current estimates, assumptions and expectations by our management that, although we believe to be reasonable, are inherently uncertain. Any forward-looking statement expressing an expectation or belief as to future events is expressed in good faith and believed to be reasonable at the time such forward-looking statement is made. However, these statements are not guarantees of future events and are subject to risks and uncertainties and other factors beyond our control that may cause actual results to differ materially from those expressed in any forward-looking statement. Any forward-looking statement speaks only as of the date on which it was made. We undertake no obligation to publicly update or revise any forward-looking statement, whether as a result of new information, future events or otherwise, except as required by law. In this release, unless the context requires otherwise, “MAIA,” “Company,” “we,” “our,” and “us” refers to MAIA Biotechnology, Inc. and its subsidiaries.
1Details on safety can be found on the previously announced ASCO 2025 poster available on MAIA’s website.
2Girard N, et al. J Thorac Onc 2009;12:1544-1549.
3A.T. Freeman et al. Curr Oncol. 2020 May 1;27(2):76–82
Cellebrite (NASDAQ: CLBT), a global leader in digital investigative solutions, announced on Thursday that it has entered into an agreement to acquire Corellium, a privately held innovator in Arm-based virtualization technology. The acquisition, valued at $170 million in cash with an additional $30 million tied to performance milestones, marks a significant expansion of Cellebrite’s capabilities in mobile vulnerability research, digital forensics, and security testing.
The deal brings together two powerhouses in digital investigation and device security, promising a new wave of innovation for both public and private sector customers. Corellium is known for its highly advanced virtualization software that allows users to create and interact with virtual iOS, Android, automotive, and IoT devices—without needing the physical hardware. This approach not only accelerates vulnerability detection and mobile penetration testing, but also enables development and security teams to conduct testing in a fully forensically sound environment.
Cellebrite interim CEO Thomas E. Hogan said the acquisition will help the company’s clients “secure both their communities and institutions,” calling Corellium’s platform “industry-unique.” He emphasized that the merger adds not just game-changing technology, but also top-tier talent in malware analysis and security research. “The combination of our respective talent and IP changes the game in the efficient securing and analysis of all Arm-based devices which are pervasive across a vast range of applications from cloud to edge,” Hogan said.
Chris Wade, founder and CTO of Corellium, will take on the role of Chief Technology Officer at Cellebrite following the acquisition. “With Cellebrite’s offerings, users have the blueprints—technical schematics of what’s on a device,” Wade said. “With Corellium, they can now virtually walk through the device, explore every room, and open every door safely and without altering a thing.”
The acquisition signals Cellebrite’s intent to significantly broaden its total addressable market. In the public sector, Corellium’s technology will be integrated into Cellebrite’s Digital Investigation Platform to support defense, intelligence, and law enforcement agencies in navigating increasingly complex mobile environments. On the enterprise side, Corellium’s virtualization capabilities are expected to expand Cellebrite’s presence beyond traditional eDiscovery use cases, enabling more robust DevSecOps and security workflows for mobile and embedded systems.
The deal is also drawing attention from the broader tech community. Mohamed Awad, SVP and GM of Infrastructure at Arm, praised Corellium’s contributions to the Arm ecosystem. “As AI continues to transform markets and deliver new experiences, the safety and security of our devices has never been more critical,” said Awad. “Corellium’s virtualization solutions leverage the unique footprint Arm has from cloud to edge.”
The transaction, expected to close this summer, is subject to approval from the Committee on Foreign Investment in the United States (CFIUS) and other standard closing conditions. Cellebrite plans to share more details about Corellium’s financial contribution following the completion of the deal.
J.P. Morgan Securities LLC served as exclusive financial advisor to Corellium.
Cellebrite also noted that it is nearing the conclusion of its search for a permanent CEO and expects to make an announcement before reporting its second-quarter 2025 results in mid-August.
In a strategic move set to reshape the industrial process technology sector, Chart Industries and Flowserve Corporation announced on June 4, 2025, that they will merge in an all-stock transaction, forming a combined company valued at approximately $19 billion. This merger of equals brings together two highly complementary businesses to create a global leader in flow and thermal management solutions.
The newly combined entity will boast an extensive installed base of over 5.5 million assets across more than 50 countries, offering a comprehensive platform that spans the full customer lifecycle—from process design to mission-critical equipment, aftermarket support, and digital monitoring solutions. With combined last twelve months (LTM) revenue of $8.8 billion, the new company is set to make a significant impact across a wide array of high-growth industries, including energy, power generation, chemical processing, data centers, and carbon capture.
At the heart of this merger is a shared commitment to delivering world-class technologies and services. Chart’s expertise in cryogenic, thermal, and specialty solutions blends seamlessly with Flowserve’s core strengths in flow management, including pumps, valves, and seals. This merger creates a differentiated industrial technology platform that is expected to enhance performance, increase predictability through market cycles, and expand customer reach globally.
A major benefit of the transaction is the expansion of aftermarket services, which will now account for roughly $3.7 billion annually, or 42% of total revenue. This significant recurring revenue stream positions the company for stable cash flow and long-term growth. Further, the merger is expected to generate approximately $300 million in annual cost synergies within three years, driven by procurement efficiencies, facility consolidations, and operational streamlining. On top of that, incremental revenue synergies of at least 2% are anticipated over time.
The transaction has been unanimously approved by both boards of directors. Upon completion, Chart shareholders will own 53.5% and Flowserve shareholders will own 46.5% of the combined company. Jill Evanko, current CEO of Chart, will serve as Chair of the Board, while Scott Rowe, CEO of Flowserve, will become the Chief Executive Officer. The board will be evenly split, with six directors from each company.
Financially, the combined company will aim to maintain an investment-grade balance sheet with a leverage ratio of 2.0x net debt to adjusted EBITDA at closing. The firm expects strong cash generation, supporting growth initiatives, debt reduction, and a continued shareholder dividend.
Headquartered in Dallas, Texas, with continued operations in Atlanta and Houston, the new company is poised to become a global industrial technology giant. A new brand identity will be unveiled upon closing, which is expected by Q4 2025, pending shareholder and regulatory approvals.
This transformative merger marks a significant step forward in innovation, scale, and service within the industrial process sector, positioning the company to capitalize on growing demand for integrated and sustainable technologies worldwide.
Joe Gomes, CFA, Managing Director, Equity Research Analyst, Generalist , Noble Capital Markets, Inc.
Refer to the full report for the price target, fundamental analysis, and rating.
Initiation of Research Coverage. We are initiating research coverage of Titan International with an Outperform rating and an $11 price target. Titan is a worldwide leader in the manufacture of off road wheels, tires, and undercarriages for the agriculture, construction, mining, and consumer space.
Transformation. Titan has undergone a strategic transformation since 2019. Management has restructured the Company, eliminating non-core assets, improving the balance sheet, and diversifying the business through acquisitions. Though still subject to cyclicality of its end markets, we believe Titan is well positioned to capitalize on improving end market demand.
Equity Research is available at no cost to Registered users of Channelchek. Not a Member? Click ‘Join’ to join the Channelchek Community. There is no cost to register, and we never collect credit card information.
This Company Sponsored Research is provided by Noble Capital Markets, Inc., a FINRA and S.E.C. registered broker-dealer (B/D).
*Analyst certification and important disclosures included in the full report. NOTE: investment decisions should not be based upon the content of this research summary. Proper due diligence is required before making any investment decision.
SAN DIEGO, June 03, 2025 (GLOBE NEWSWIRE) — Kratos Defense & Security Solutions, Inc. (Nasdaq: KTOS), a Technology Company in the Defense, National Security and Global Markets, and GE Aerospace (NYSE: GE) today announced a formal teaming agreement to advance propulsion technologies for the next generation of affordable unmanned aerial systems and Collaborative Combat Aircraft-type (CCA-type) aircraft.
Eric DeMarco, President and CEO of Kratos, said, “Kratos’ strategically important Teaming Agreement with GE Aerospace continues to rapidly advance and expand, with the GEK family of engines targeting certain of the most important, mission critical and highest priority needs and requirements of United States National Security. At Kratos, affordability is a technology and delivering more capability for less cost as quickly as possible are key contributions we are bringing for truly industry leading GEK offerings with our partner and global leader GE Aerospace.”
“The formalization of this teaming agreement and initiation of development of these new engines mark another step forward in our dedication to providing affordable, adaptable, high-performance propulsion systems for the future force,” said Amy Gowder, President and CEO of Defense & Systems at GE Aerospace. “We’re thrilled to continue our collaboration with Kratos and accelerate development across various classes of unmanned systems.”
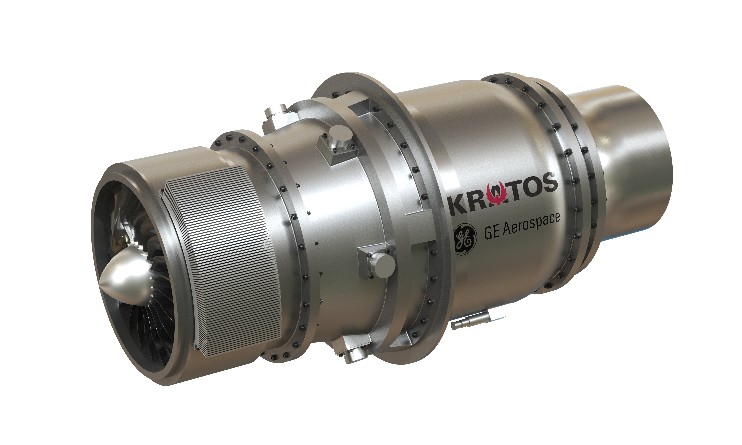
This collaboration strengthens Kratos’ ongoing partnership with GE Aerospace – building on last year’s Memorandum of Understanding (MOU) to advance the development and production of small, cost-effective engines for unmanned platforms. The new teaming agreement expands on that MOU and provides the framework for the two companies to develop, manufacture, test, and field the GEK800 Engine, as well as collaborate on other low-cost expendable turbofan engines.
In addition to the joint work on the GEK800, the companies have commenced work on another new engine, the GEK1500. The engines under development support unmanned aerial systems (UAS), collaborative combat aircraft, and similar applications, positioning Kratos and GE Aerospace to offer affordable mass propulsion solutions across a range of next-generation defense applications for the Department of Defense.
Kratos brings more than 20 years of experience developing and producing small, affordable engines for UAS, drones, and missile platforms. GE Aerospace adds a century of expertise in propulsion technology and the ability to scale advanced designs into high-rate production —helping bridge the gap from prototype to deployment.
About Kratos Defense & Security Solutions Kratos Defense & Security Solutions, Inc. (NASDAQ: KTOS) is a technology, products, system and software company addressing the defense, national security, and commercial markets. Kratos makes true internally funded research, development, capital and other investments, to rapidly develop, produce and field solutions that address our customers’ mission critical needs and requirements. At Kratos, affordability is a technology, and we seek to utilize proven, leading edge approaches and technology, not unproven bleeding edge approaches or technology, with Kratos’ approach designed to reduce cost, schedule and risk, enabling us to be first to market with cost effective solutions. We believe that Kratos is known as an innovative disruptive change agent in the industry, a company that is an expert in designing products and systems up front for successful rapid, large quantity, low-cost future manufacturing which is a value add competitive differentiator for our large traditional prime system integrator partners and also to our government and commercial customers. Kratos intends to pursue program and contract opportunities as the prime or lead contractor when we believe that our probability of win (PWin) is high and any investment required by Kratos is within our capital resource comfort level. We intend to partner and team with a large, traditional system integrator when our assessment of PWin is greater or required investment is beyond Kratos’ comfort level. Kratos’ primary business areas include virtualized ground systems for satellites and space vehicles including software for command & control (C2) and telemetry, tracking and control (TT&C), jet powered unmanned aerial drone systems, advanced vehicles and rocket systems, propulsion systems for drones, missiles, loitering munitions, supersonic systems, space craft and launch systems, C5ISR and microwave electronic products for missile, radar, missile defense, space, satellite, counter UAS, directed energy, communication and other systems, and virtual & augmented reality training systems for the warfighter. For more information, visit www.KratosDefense.com.
About GE Aerospace GE Aerospace is a global aerospace propulsion, services, and systems leader with an installed base of approximately 45,000 commercial and 25,000 military aircraft engines. With a global team of approximately 53,000 employees building on more than a century of innovation and learning, GE Aerospace is committed to inventing the future of flight, lifting people up, and bringing them home safely. Learn more about how GE Aerospace and its partners are defining flight for today, tomorrow, and the future at www.geaerospace.com.
Notice Regarding Forward-Looking Statements Certain statements in this press release may constitute “forward-looking statements” within the meaning of the Private Securities Litigation Reform Act of 1995. These forward-looking statements are made on the basis of the current beliefs, expectations and assumptions of the management of Kratos and are subject to significant risks and uncertainty. Investors are cautioned not to place undue reliance on any such forward-looking statements. All such forward-looking statements speak only as of the date they are made, and Kratos undertakes no obligation to update or revise these statements, whether as a result of new information, future events or otherwise. Although Kratos believes that the expectations reflected in these forward-looking statements are reasonable, these statements involve many risks and uncertainties that may cause actual results to differ materially from what may be expressed or implied in these forward-looking statements. For a further discussion of risks and uncertainties that could cause actual results to differ from those expressed in these forward-looking statements, as well as risks relating to the business of Kratos in general, see the risk disclosures in the Annual Report on Form 10-K of Kratos for the year ended December 29, 2024, and in subsequent reports on Forms 10-Q and 8-K and other filings made with the SEC by Kratos.
The U.S. manufacturing sector continues to show signs of stress, with May’s ISM Manufacturing PMI slipping further into contraction territory at 48.5 — down from April’s 48.7. This persistent decline highlights the fragility of the sector amid deepening global trade tensions and domestic economic uncertainty. Perhaps more alarmingly, U.S. imports plunged to their lowest levels since 2009, registering a reading of 39.9, a significant drop from April’s 47.1.
This steep decline in imports reflects both softening demand and the growing impact of tariffs, many of which have been reintroduced or expanded under President Trump’s revised trade policy. According to Susan Spence of the ISM Manufacturing Business Survey Committee, tariffs were the most cited concern among respondents — with 86% mentioning them. Several likened the current climate to the disarray of the early pandemic.
For small-cap stocks, especially those tied to industrials, materials, and manufacturing, this environment spells both challenge and opportunity. Small caps are often more domestically focused than their large-cap counterparts and tend to be more sensitive to economic cycles. When manufacturing slows, these companies typically suffer more acutely from reduced orders, higher input costs due to tariffs, and tighter margins.
However, the current backdrop is more nuanced. While ISM’s index showed contraction, S&P Global’s separate gauge of manufacturing activity rose to 52, indicating slight expansion. Yet, even that report carried warnings: Chief economist Chris Williamson noted that the uptick is likely temporary, driven by inventory hoarding amid fears of supply chain issues and rising prices.
This divergence reveals how mixed signals are becoming the norm — complicating investment strategies in the small-cap space. On one hand, small manufacturers that rely on imported materials face margin pressure from rising input costs due to tariffs. On the other, those able to localize supply chains or produce domestically could benefit from reshoring trends and domestic inventory build-up.
For investors, the key takeaway is caution, not panic. Many small-cap industrials are already priced for a slowdown, but those with strong balance sheets and pricing power may weather the storm — or even gain market share as competitors falter. Meanwhile, increased inventory levels could provide short-term tailwinds, though that may evaporate quickly if demand doesn’t keep pace.
Marketwide, prolonged manufacturing contraction can pressure broader economic indicators, especially employment and capital spending, ultimately weighing on the S&P 500 and Dow. The Nasdaq, less exposed to traditional manufacturing, may prove more resilient.
In conclusion, the state of U.S. manufacturing is flashing caution signs, especially for small-cap stocks in the sector. While short-term inventory surges and reshoring trends may offer brief relief, the longer-term picture remains clouded by tariff uncertainties and fragile global trade relations. Investors would be wise to look for companies with flexible supply chains, diversified revenue streams, and strong cash positions as potential outperformers in this challenging landscape.