|
|
|
Pyxis Tankers (PXS) CEO Eddie Valentis and CFO Henry Williams at NobleCon17 – Noble Capital Markets 17th Annual Small & Microcap Investor Conference – January 2021. Following the formal presentation, Noble Capital Markets Senior Research Analyst Poe Fratt joins Eddie and Henry to moderate a Q&A session. NobleCon 17 Complete Rebroadcast
|
Category: Transportation
Pangaea Logistics (PANL) NobleCon17 Presentation Replay
|
|
|
Pangaea Logistics (PANL) CFO Gianni Del Signore and Managing Director Mads Petersen at NobleCon17 – Noble Capital Markets 17th Annual Small & Microcap Investor Conference – January 2021. Following the formal presentation, Noble Capital Markets Senior Research Analyst Poe Fratt joins Gianni and Mads to moderate a Q&A session. NobleCon 17 Complete Rebroadcast
|
Orion Group Holdings (ORN) NobleCon17 Presentation Replay
|
|
|
Orion Group Holdings (ORN) VP & CFO Robert Tabb at NobleCon17 – Noble Capital Markets 17th Annual Small & Microcap Investor Conference – January 2021. Following the formal presentation, Noble Capital Markets Senior Research Analyst Poe Fratt joins Robert to moderate a Q&A session. NobleCon 17 Complete Rebroadcast
|
International Seaways (INSW) NobleCon17 Presentation Replay
|
|
|
International Seaways (INSW) CEO Lois Zabrocky at NobleCon17 – Noble Capital Markets 17th Annual Small & Microcap Investor Conference – January 2021. Following the formal presentation, Noble Capital Markets Senior Research Analyst Poe Fratt joins Lois to moderate a Q&A session. NobleCon 17 Complete Rebroadcast
|
Great Lakes Dredge & Dock (GLDD) NobleCon17 Presentation Replay
|
|
|
Great Lakes Dredge & Dock (GLDD) CFO Mark Marinko at NobleCon17 – Noble Capital Markets 17th Annual Small & Microcap Investor Conference – January 2021. Following the formal presentation, Noble Capital Markets Senior Research Analyst Poe Fratt joins Mark to moderate a Q&A session. NobleCon 17 Complete Rebroadcast
|
Grande West Transportation Group (BUSXF) NobleCon17 Presentation Replay
|
|
|
Grande West Transportation Group (BUSXF) CEO Willian Trainer at NobleCon17 – Noble Capital Markets 17th Annual Small & Microcap Investor Conference – January 2021. Following the formal presentation, Noble Capital Markets Senior Research Analyst Poe Fratt joins Willian to moderate a Q&A session. NobleCon 17 Complete Rebroadcast
|
Global Crossing Airlines (JETMF) NobleCon17 Presentation Replay
|
|
|
Global Crossing Airlines (JETMF) EVP, CFO Ryan Goepel at NobleCon17 – Noble Capital Markets 17th Annual Small & Microcap Investor Conference – January 2021. Following the formal presentation, Noble Capital Markets Senior Research Analyst Poe Fratt joins Ryan to moderate a Q&A session. NobleCon 17 Complete Rebroadcast
|
EuroDry (EDRY) NobleCon17 Presentation Replay
EuroSeas (ESEA) NobleCon17 Presentation Replay
NobleCon17 Transportation Panel Replay
|
|
|
Transportation Panel Discussion from NobleCon17 – Noble Capital Markets 17th Annual Small & Microcap Investor Conference – January 2021. A panel of distinguished experts discuss a number of topics including the impact of COVID-19 on supply and demand. Moderated by Noble Senior Research Analyst Poe Fratt. NobleCon 17 Complete Rebroadcast
|
Seanergy Maritime (SHIP) – Debt Refinancings Completed and Impact is Favorable

Thursday, January 14, 2021
Seanergy Maritime (SHIP)
Debt Refinancings Completed and Impact is Favorable
Seanergy Maritime Holdings Corp., an international shipping company, provides marine dry bulk transportation services through the ownership and operation of dry bulk vessels. Seanergy Maritime Holdings Corp. is the only pure-play Capesize shipping company listed in the US capital markets. Seanergy provides marine dry bulk transportation services through a modern fleet of 10 Capesize vessels, with total capacity of approximately 1,748,581 dwt and an average fleet age of about 9.8 years. The Company is incorporated in the Marshall Islands with executive offices in Athens, Greece and an office in Hong Kong. The Company’s common shares trade on the Nasdaq Capital Market under the symbol “SHIP” and class A warrants under “SHIPW”.
Poe Fratt, Senior Research Analyst, Noble Capital Markets, Inc.
Refer to the full report for the price target, fundamental analysis, and rating.
Total debt of $179 million, including secured debt of $117 million and subordinated debt of $62 million, was restructured. While secured debt of $60 million was refinanced last year, agreements to restructure additional secured debt of $57 million and subordinated debt of $62 million were recently finalized. As a result, secured debt is $119 million, subordinated debt is $17 million and convert debt is $39 million, or total debt of $175 million.
Favorable outcome is a reflection of solid bank group relationships and the forging of a new relationship with Jelco. Other goals achieved include preserving cash, pushing out maturities, lowering interest expense and improving financial flexibility. While negotiations took longer than expected, the agreements create some financial breathing room, establish a solid financial platform, and …

This research is provided by Noble Capital Markets, Inc., a FINRA and S.E.C. registered broker-dealer (B/D).
*Analyst certification and important disclosures included in the full report. NOTE: investment decisions should not be based upon the content of this research summary. Proper due diligence is required before making any investment decision.
Great Lakes Dredge and Dock (GLDD) – New Awards of $61 Million – Increasing Price Target
Tuesday, January 12, 2021
Great Lakes Dredge & Dock (GLDD)
New Awards of $61 Million – Increasing Price Target
Great Lakes Dredge & Dock Corp is a provider of dredging services in the United States. The company only’s operating segments is Dredging. Dredging involves the enhancement or preservation of navigability of waterways or the protection of shorelines through the removal or replenishment of soil, sand or rock. Its projects portfolio includes Coastal Restoration, Coastal Protection, Port expansion, and others.
Poe Fratt, Senior Research Analyst, Noble Capital Markets, Inc.
Refer to the full report for the price target, fundamental analysis, and rating.
Four awards for $60.9 million to be included in year-end 2020 backlog. The four awards (three maintenance and one coastal protection) include a total work of $60.9 million in Florida and Georgia. Three of the four awards should be completed in 1Q2021 and the fourth extending out into 3Q2021.
Dredging market outlook remains solid and potential infrastructure spending creates tailwind. The awards are positive signals after the loss on the Spanish Ridge work in Louisiana in December. Other positives include stronger global LNG prices that could help move the NextDecade (NEXT) LNG project to FID and the potential higher infrastructure spending in fiscal stimulus plans …
This Company Sponsored Research is provided by Noble Capital Markets, Inc., a FINRA and S.E.C. registered broker-dealer (B/D).
*Analyst certification and important disclosures included in the full report. NOTE: investment decisions should not be based upon the content of this research summary. Proper due diligence is required before making any investment decision.
Seanergy Maritime Holdings (SHIP) Scheduled To Present at NobleCon17
|
|
|
|
|
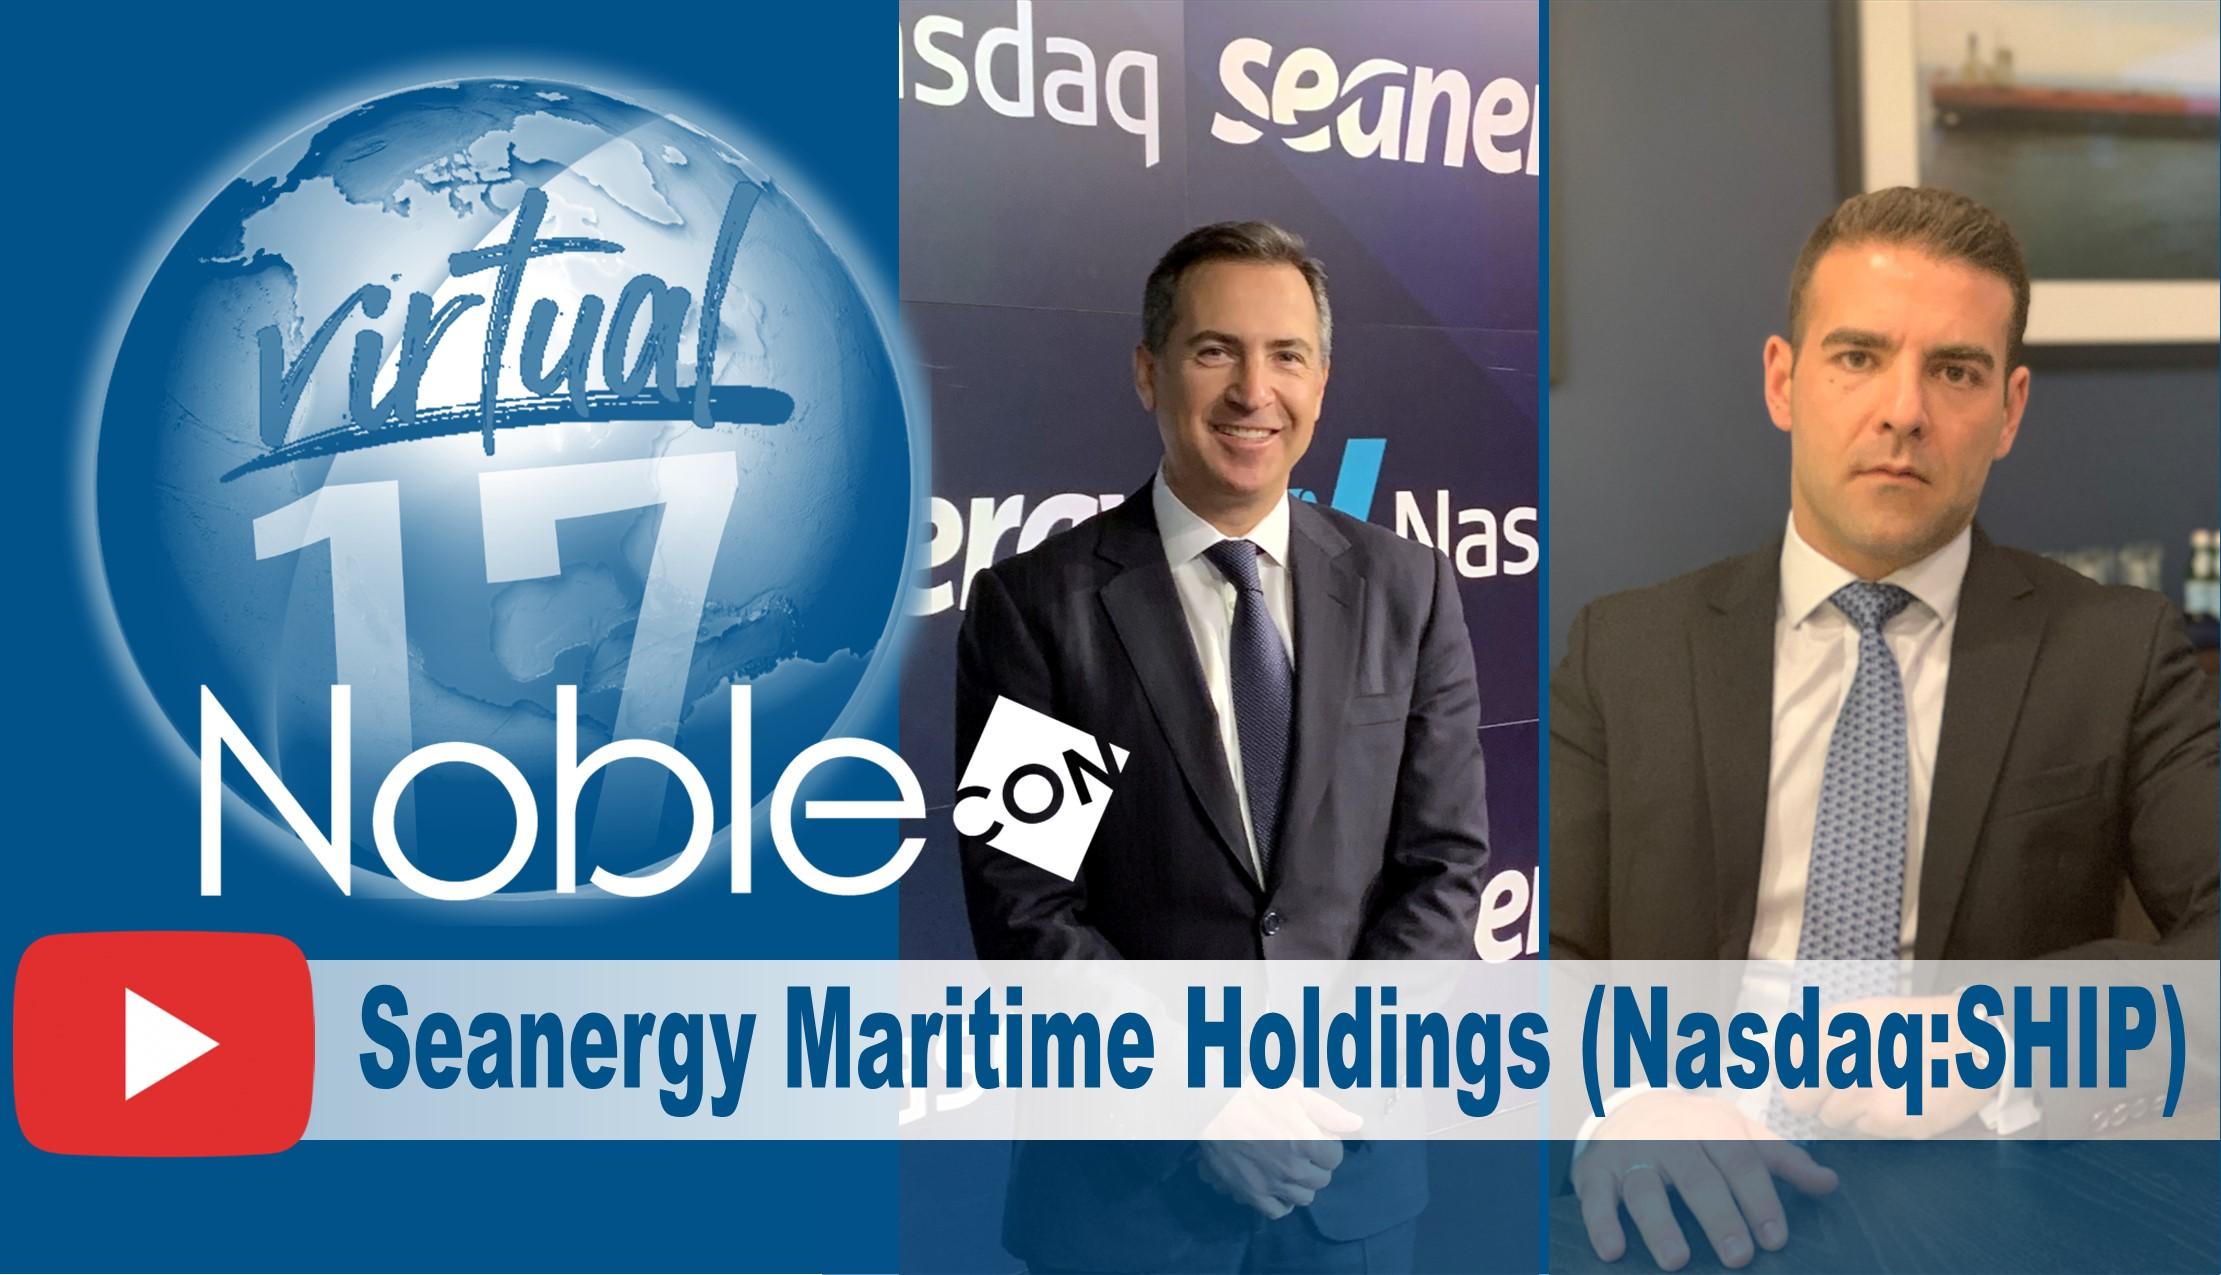
Join Seanergy (SHIP) CEO Stamatis Tsantanis & CFO Stavros Gyftakis at NobleCon17 – Noble Capital Markets 17th Annual Small & Microcap Investor Conference – January 19&20, 2021. Following a formal presentation, a seasoned Wall Street research analyst will join Stamatis and Stavros to moderate a LIVE Q&A session. If you want to be added to the roster of presenters… or if you would like to join the virtual audience of investors, at no cost, go to nobleconference.com. NobleCon 17 Complete Presenting Company Schedule
|