Seanergy Maritime Announces $16.6 Million Buyback of Convertible Notes, Warrants and Common Shares, as well as Open-Market Stock Purchases by the CEO
Research, News, and Market Data on Seanergy Maritime
Seanergy Maritime Announces $16.6 Million Buyback of
Convertible Notes, Warrants and Common Shares, as well as
Open-Market Stock Purchases by the CEO
Highlights:
- Buyback of $13.95 million of Convertible Notes
- Buyback of Warrant to purchase 4.3 million shares
- Buyback of 1.6 million of common shares
- Elimination of potential dilution by 17.5 million shares
- CEO open market purchases of 0.3 million shares
- Seanergy BOD approves new buyback plan of $10 million
December 7, 2021 – Glyfada, Greece – Seanergy Maritime Holdings Corp. (the “Company” or “Seanergy”) (NASDAQ: SHIP) announced today an aggregate of $16.6 million in buyback and elimination of:
(i) two outstanding convertible notes with 5.5% coupon and a conversion price of $1.20 per share (the “Notes”),
(ii) the entire amount of warrants to purchase common shares at an exercise price of $0.70 (the “Warrant”) held by the holder of the Notes and
(iii) buyback of common shares, fully utilizing its previously announced share repurchase plan.
Moreover, Seanergy’s Chairman & CEO, Stamatis Tsantanis, has purchased in 2021 to date an additional 300,000 of the Company’s common shares in the open market.
Following the completion of the previously announced repurchase plan, the Board of Directors has authorized an additional repurchase plan (the “Plan”), under which the Company may repurchase up to $10 million of its common shares, convertible notes or warrants.
Notes
The Company will buyback and eliminate the Notes with an aggregate outstanding principal of $13.95 million held by Jelco Delta Holding Corp. (“Jelco”) at their full-face value, without any prepayment cost or additional consideration. The prepayment is expected to take place on December 10, 2021.
Based on an exercise price of $1.20 per share, the buyback will pre-empt potential dilution of 11.63 million shares. In conjunction with the repurchase of the Notes the Company expects to record a non-cash accounting loss of approximately $6.75 million in the fourth quarter of 2021. However, since the Notes carry a fixed coupon of 5.5% p.a., the Company will realise annual interest savings of $767,250 per year. In addition, the prepayment will have a positive impact on the income statement for the subsequent periods through the elimination of non-cash charges of an average of $2.9 million per year.
Warrant
The Company is also buying back from the holder of the Notes their sole outstanding Warrant to purchase 4,285,714 million shares for $1,023,136.
Common Shares
Following the end of the blackout period associated with the issuance of the financial results of the third quarter of 2021 and to-date, the Company has repurchased 1,595,803 of its outstanding common shares at an average price of approximately $0.998 pursuant to its previously-announced share repurchase program.
Stamatis Tsantanis, the Company’s Chairman & Chief Executive Officer, stated:
“As previously communicated to our shareholders, these strategic transactions are aimed to enhance shareholder value, reduce potential dilution from outstanding share-linked instruments and eliminate legacy overhang on our share price. At the same time, we generate significant savings in interest expense.
“The completion of the first phase of our buyback program of common shares, convertible notes and warrants reflects our firm belief that our share price is significantly undervalued. In this context, I have also continued my open market purchases of Seanergy’s shares, which indicates my strong confidence in the Company and its fundamentals.
“Our strong balance sheet coupled with our fleet’s robust cash-flow generating capacity reinforce our Company’s ability to continue on the same path without compromising our solid liquidity position.”
Summary of Repurchases:
The following table summarizes the repurchases of the various instruments:
| |
Purchase price |
Price per share |
Shares |
| Warrants |
$1,023,136 |
$0.939** |
4,285,714* |
| Note 1 |
$200,000 |
$1.200 |
166,666* |
| Note 3 |
$13,750,000 |
$1.200 |
11,458,333* |
| Common Shares |
$1,593,150 |
$0.998 |
1,595,803 |
| Total / Average |
$16,566,286 |
$1.118 |
17,506,516 |
*Not issued: shares underlying convertible securities
**Including $0.70 warrant exercise price per share
The Plan
The Company may repurchase common shares in open-market transactions pursuant to Rule 10b-18 of the Securities Exchange Act of 1934, as amended, or pursuant to a trading plan adopted in accordance with Rule 10b5?1 of the Securities Exchange Act of 1934.
Any repurchases pursuant to the Plan will be made at management’s discretion at prices considered to be attractive and in the best interests of both the Company and its shareholders, subject to the availability of stock, general market conditions, the trading price of the stock, alternative uses for capital, applicable securities laws and the Company’s financial performance. The Plan may be suspended, terminated, or modified at any time for any reason, including market conditions, the cost of repurchasing shares, the availability of alternative investment opportunities, liquidity, and other factors deemed appropriate. These factors may also affect the timing and amount of share repurchases. The Plan does not obligate the Company to purchase any of its shares, and the Company may repurchase other outstanding securities of the Company, including its outstanding convertible notes, under the Plan. The Board of Directors’ authorization of the Plan is effective immediately and expires on December 31, 2022.
About Seanergy Maritime Holdings Corp.
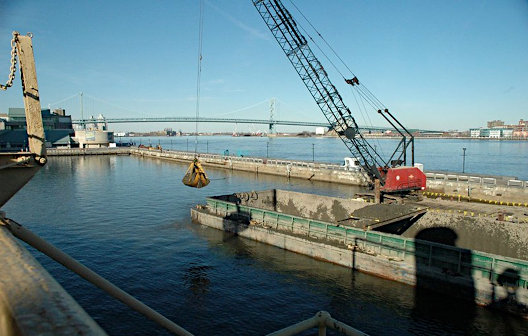
Seanergy Maritime Holdings Corp. is the only pure-play Capesize ship-owner publicly listed in the US. Seanergy provides marine dry bulk transportation services through a modern fleet of Capesize vessels. The Company’s operating fleet consists of 17 Capesize vessels with an average age of 11.7 years and aggregate cargo carrying capacity of approximately 3,011,083 dwt.
The Company is incorporated in the Marshall Islands and has executive offices in Glyfada, Greece. The Company’s common shares trade on the Nasdaq Capital Market under the symbol “SHIP”, its Class A warrants under “SHIPW” and its Class B warrants under “SHIPZ”.
Please visit our company website at: www.seanergymaritime.com.
Forward-Looking Statements
This press release contains forward-looking statements (as defined in Section 27A of the Securities Act of 1933, as amended, and Section 21E of the Securities Exchange Act of 1934, as amended) concerning future events. Words such as “may”, “should”, “expects”, “intends”, “plans”, “believes”, “anticipates”, “hopes”, “estimates” and variations of such words and similar expressions are intended to identify forward-looking statements. These statements involve known and unknown risks and are based upon a number of assumptions and estimates, which are inherently subject to significant uncertainties and contingencies, many of which are beyond the control of the Company. Actual results may differ materially from those expressed or implied by such forward-looking statements. Factors that could cause actual results to differ materially include, but are not limited to, the Company’s operating or financial results; the Company’s liquidity, including its ability to service its indebtedness; competitive factors in the market in which the Company operates; shipping industry trends, including charter rates, vessel values and factors affecting vessel supply and demand; future, pending or recent acquisitions and dispositions, business strategy, areas of possible expansion or contraction, and expected capital spending or operating expenses; risks associated with operations outside the United States; risks associated with the length and severity of the ongoing novel coronavirus (COVID-19) outbreak, including its effects on demand for dry bulk products and the transportation thereof; and other factors listed from time to time in the Company’s filings with the SEC, including its most recent annual report on Form 20-F. The Company’s filings can be obtained free of charge on the SEC’s website at www.sec.gov. Except to the extent required by law, the Company expressly disclaims any obligations or undertaking to release publicly any updates or revisions to any forward-looking statements contained herein to reflect any change in the Company’s expectations with respect thereto or any change in events, conditions or circumstances on which any statement is based.
For further information please contact:
Seanergy Investor Relations
Tel: +30 213 0181 522
E-mail: [email protected]
Capital Link, Inc.
Paul Lampoutis
230 Park Avenue Suite 1536
New York, NY 10169
Tel: (212) 661-7566


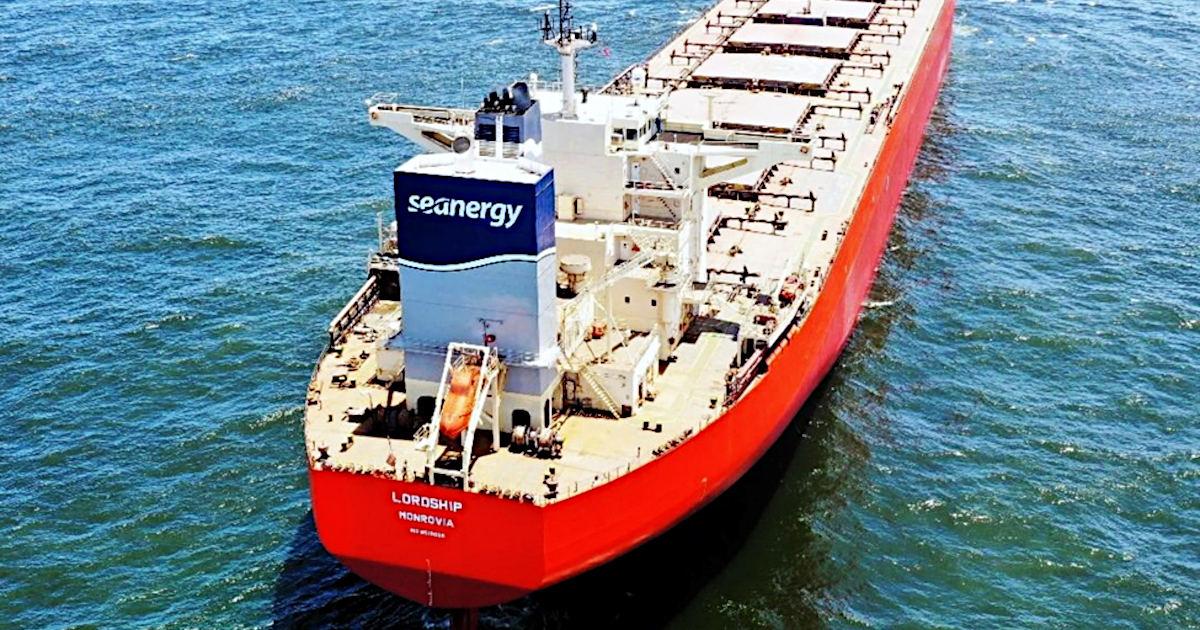

 Chart:
 Chart: