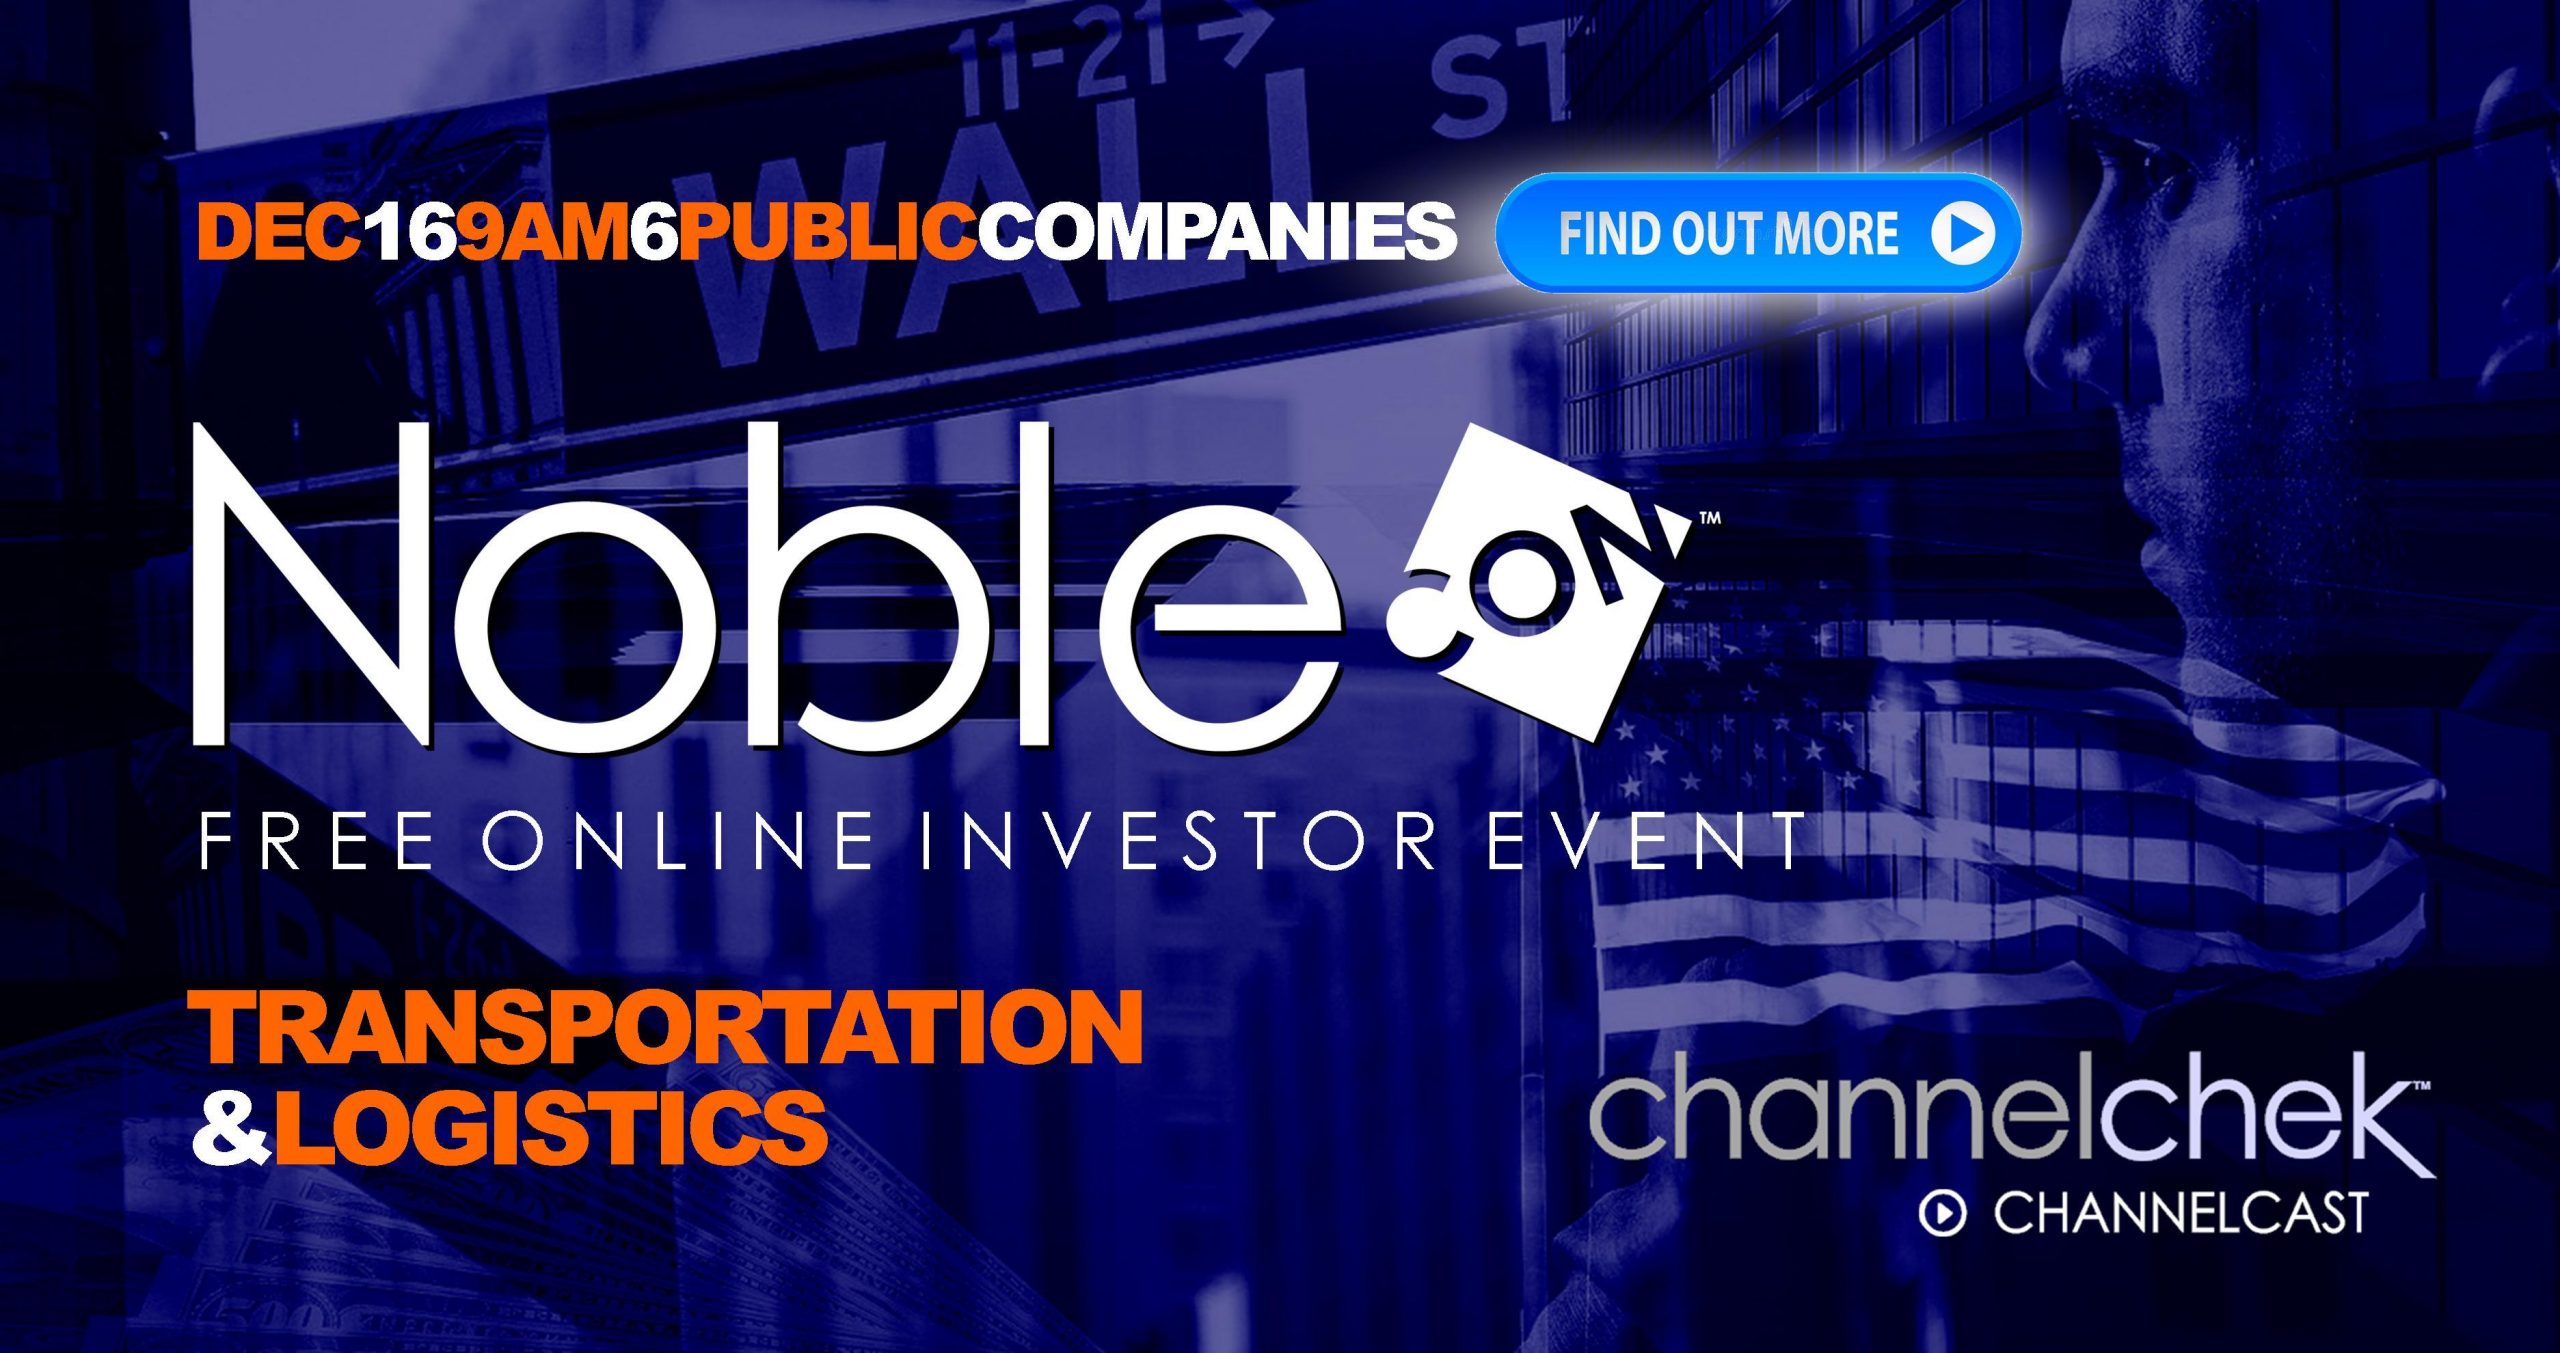
Great Lakes Dredge & Dock (GLDD) – Weather and COVID-19 Hit Quarter, But Strong Finish to Year

Wednesday, November 03, 2021

Great Lakes Dredge & Dock (GLDD)
Weather and COVID-19 Hit Quarter, But Strong Finish to Year

Great Lakes Dredge & Dock Corp is a provider of dredging services in the United States. The company only’s operating segments is Dredging. Dredging involves the enhancement or preservation of navigability of waterways or the protection of shorelines through the removal or replenishment of soil, sand or rock. Its projects portfolio includes Coastal Restoration, Coastal Protection, Port expansion, and others.

Poe Fratt, Senior Research Analyst, Noble Capital Markets, Inc.

Refer to the full report for the price target, fundamental analysis, and rating.

    3Q2021 Results hit by stormy weather and COVID-19. Revenue was flattish with higher US Capital more than offsetting lower Coastal Protection. Maintenance and Rivers and Lakes were flat, while international remains dormant. Revenue hit from weather disruptions included an unexpected dry dock and COVID-19 cost drag was $2.1 million, but gross margin of $36.3 million and gross margin of 21.5% were positives. Same with EBITDA of $32.2 million and EBITDA margin of 19.1%.

    4Q2021 Guidance sets tone for strong finish to year.  Revenue should jump into the $225-$235 million range with gross margin close to 3Q2021, implying gross profit in the $48 million range. COVID-19 cost drag is moderating and our EBITDA estimate is $42 million, or EBITDA margin of 18.8%. Looks like the strongest quarter in almost two years, and full year EBITDA estimate is $121.6 million based on …


This Company Sponsored Research is provided by Noble Capital Markets, Inc., a FINRA and S.E.C. registered broker-dealer (B/D).

*Analyst certification and important disclosures included in the full report. NOTE: investment decisions should not be based upon the content of this research summary.  Proper due diligence is required before making any investment decision. 

Release – Seanergy Maritime Holdings Corp. Reports Record Financial Results for the Third Quarter and Nine-Month Period Ended September 30 2021


Seanergy Maritime Holdings Corp. Reports Record Financial Results for the Third Quarter and Nine-Month Period Ended September 30, 2021


Seanergy Maritime Holdings Corp. Reports Record Financial Results for the Third Quarter and NineMonth Period Ended September 30, 2021

Highlights of the Third Quarter of 2021:

  • Gross revenues: $50 million in Q3 2021, as compared to $20.4 million in Q3 2020, up 146%

  • Net Income: $20.1 million in Q3 2021, as compared to $3.6 million in Q3 2020, up 459%

  • EBITDA1: $30.1 million in Q3 2021, as compared to $12.7 million in Q3 2020, up 137%

  • Adjusted EBITDA1: $32.2 million in Q3 2021, as compared to $7.8 million in Q3 2020, up 312%

Highlights of the Nine Months ended September 30, 2021:

  • Gross revenues: $100 million in 9M 2021, as compared to $43.5 million in 9M 2020, up 130%

  • Net Income: $20.7 million in 9M 2021, as compared to a net loss of $16 million in 9M 2020

  • EBITDA1: $47.4 million in 9M 2021, as compared to $11.6 million in 9M 2020, up 307%

  • Adjusted EBITDA1: $51.4 million in 9M 2021, as compared to $7.3 million in 9M 2020, up 602%

First Nine Months of 2021 and Recent Developments:

  • Acquisition of 7 modern Japanese Capesizes and sale of our oldest vessel in 2021 to daterepresenting total investment of $193.2 million and fleet increase of 55%

  • Ten new time-charter employment agreements with world-renowned charterers

  • 100% of the fleet employed under time-charters (“T/Cs”), 88% of which at index-linked rates

  • Financing and refinancing transactions of $134.2 million

November 2, 2021 – Glyfada, Greece – Seanergy Maritime Holdings Corp. (the “Company”) (NASDAQ: SHIP), announced today its financial results for the third quarter ended September 30, 2021.

For the quarter ended September 30, 2021, the Company generated gross revenues of $50.0 million, a 146% increase compared to the third quarter of 2020. Adjusted EBITDA for the quarter was $32.2 million, from $7.8 million in the same period of 2020 . Net income for the third quarter was $20.1 million compared to net income of $3.6 million in the third quarter of 2020. The daily Time Charter Equivalent (“TCE”)1 of the fleet for the third quarter of 2021 was $30,764, marking a 90% increase compared to $16,219 for the same period of 2020.

For the nine-month period ended September 30, 2021, gross revenues were $100.0 million, increased by 130% when compared to $43.5 million in the same period of 2020. Adjusted EBITDA for the first nine months of 2021 was $51.4 million, compared to an adjusted EBITDA of $7.3 million in the same period of 2020. The daily TCE of the fleet for the first nine months of 2021 was $23,449 compared to $10,267 in the first nine months of 2020. The average daily OPEX was $5,806 compared to $5,573 in the respective period of 2020.

Cash and cash-equivalents, restricted cash, term deposits, including a short-term receivable from vessel sale proceeds as of September 30, 2021, stood at $52.6 million. The M/V Leadership was delivered to her new owners on September 30, 2021 and due to timing of payments, the gross proceeds of $13.3 million, including bunkers and other inventories, were received in the beginning of October. Shareholders’ equity at the end of the third quarter was $222.3 million, compared to $95.7 million on December 31, 2020. Long-term debt (senior and junior loans and other financial liabilities) net of deferred charges stood at $204.6 million as of September 30, 2021, from $169.8 million as of the end of 2020, representing a 20% increase. In the same period, following the addition of six of our new acquisitions and the removal of the M/V Leadership, the book value of our fleet increased by 55% to $396.8 million from $256.7 million.

Fourth Quarter 2021 TCE Guidance:

As of the date hereof, approximately 69% of the Company fleet’s expected operating days in the fourth quarter of 2021 have been fixed at an estimated TCE of approximately $38,440. Assuming that for the remaining operating days of our index-linked T/Cs, the respective vessels’ TCE will be equal to the average Forward Freight Agreement (“FFA”) rate of approximately $28,000 per day (based on the FFA curve of November 1, 2021), our estimated TCE for the fourth quarter will be approximately $35,2002. Our TCE guidance for the fourth quarter of 2021 includes certain conversions (6 vessels) of index-linked charters to fixed, which were concluded in the third quarter of 2021 as part of our freight hedging strategy. The following table provides the break-down:

Operating Days

TCE

TCE – fixed rate (index-linked conversion)

552

$31,273

TCE – fixed rate

184

$29,761

TCE – index linked unhedged

778

$39,281

Total / Average

1,514

$35,205


Stamatis Tsantanis, the Company’s Chairman & Chief Executive Officer, stated:

“I am very excited to announce our financial results for the third quarter and nine-month period that ended on September 30, 2021, marking a record profit for Seanergy since we started acquiring our current fleet in 2015. The exceptional financial performance of our Company is attributed to the combination of the well-timed acquisitions that we executed in the past year, as well as the highest dry bulk market of the last decade.

As far as our results for the third quarter of 2021 are concerned, our daily TCE was $30,764, outperforming our guidance for the quarter and marking an increase of 90% compared to the TCE of the third quarter of 2020. The TCE of the fleet for the first nine months of 2021 was $23,449 per day, increased by 128% when compared to a daily TCE of $10,267 in the same period of 2020. Our fourth quarter TCE performance to date and TCE guidance for the entire quarter is equally strong at $38,440 and $35,200 per day respectively. Adjusted EBITDA for the third quarter and first nine months of 2021 was $32.2 million and $51.4 million, respectively, as compared to an adjusted EBITDA of $7.8 million and $7.3 million in the respective periods of 2020. Net result for the quarter was a profit of $20.1 million increased by 459%, from $3.6 million in the same period of 2020. This impressive increase underscores the operating leverage of the Company and its tremendous upside potential in today’s earnings environment.

Regarding our fleet growth strategy, investment in vessel acquisitions in 2021 to date has totalled approximately $193.2 million for seven high quality Japan-built Capesize vessels with an average age of 11.1 years, with the most recent acquisition being that of the 2010-built M/V Dukeship. Within the third quarter, we took timely delivery of two Capesize vessels, while we also delivered the M/V Leadership to its new owners. The total investment has been fully funded by our strong cash reserves, as well as our new financing arrangements.

Concerning our commercial developments in 2021 to date, we have concluded ten new time-charter employment agreements with at least one-year duration, in each case with leading charterers in the Capesize sector. Following the recently agreed employment contracts for the M/Vs Dukeship and Goodship, 15 vessels will be employed on index-linked charters. This strategy has proven to be very efficient since our fleet’s earnings best reflect daily movements of the BCI and we are able to capitalize on market spikes. In most cases, the agreements entail options to convert the index-linked rate to a fixed one, based on the prevailing FFA curve, allowing us, at our option, to lock our future market exposure at profitable rates. By this, we have achieved what we believe to be the optimal positioning of our fleet for a commodities super-cycle.

On the financing front, since the beginning of 2021 we have concluded new financings and refinancings of $134.2 million while repaying $82.3 million on existing debt facilities. Since the start of the third quarter, we have agreed two new financings of approximately $30 million, while repaying $12.6 million on our existing financings. Specifically, we completed the financing of the M/V Friendship with one of our long-term lenders, while receiving a commitment letter from a major Greek Bank for a sustainability-linked loan to be secured by the M/V Worldship. Our weighted average interest rate for the first nine months of 2021 was reduced by approximately 130 basis points over the same period of 2020 and we expect this trend to continue in 2022.

With respect to our ESG initiatives, we have always been at the forefront of all major environmental regulations, and we are intensifying our efforts to meet IMO’s decarbonization targets for 2030. We have recently endorsed the Call to Action for Shipping Decarbonization, a global coalition of over 190 industry leaders and organizations representing the entire maritime value chain. In addition, we have signed agreements with DeepSea for the installation of Artificial Intelligence performance systems on our fleet and with Marsoft for the screening of selected vessels, which promotes transparency of our energy efficiency upgrades.

With a view to optimising the energy efficiency of our fleet, we have decided, in some cases in cooperation with our charterers, to install Energy Saving Devices (“ESDs”) on the entire fleet. This upgrade program will progress gradually, with the installation of the ESDs taking place during each vessel’s upcoming drydocking and is intended to ensure that the speed of our expanded fleet will not be materially impacted by the upcoming environmental regulations. Finally, we are investing in the research and development of emission reduction technologies, including biofuel blend trials, which is expected to contribute considerably to the transition to a greener shipping industry.

Regarding market conditions and future prospects, we have recently experienced the highest market levels of the last 12 years in the Capesize sector, with daily rates reaching $87,000 per day at the start of the fourth quarter. Notwithstanding the short-term correction of recent weeks, we believe that the Capesize market is supported by the most favourable demand-supply fundamentals of its recent history. More specifically, the Capesize orderbook still stands at the lowest level of the last 25 years and the upcoming environmental regulations are expected to lead to a significant vessel supply squeeze in the following years. In addition, demand for dry raw materials is supported by the global energy supply shortages, as well as the worldwide stimuli and infrastructure projects.

On that basis, we feel confident about the prospects of the Capesize market for years to come.”

Company Fleet following M/V Dukeship delivery:

Vessel Name

Vessel Class

Capacity (DWT)

Year Built

Yard

Scrubber Fitted

Employment Type

FFA conversion option(19)

Earliest T/C expiration

Patriotship

Capesize

181,709

2010

Imabari

Yes

T/C – fixed rate(1)

06/2022

Worldship

Capesize

181,415

2012

Koyo – Imabari

Yes

T/C – fixed rate(2)

09/2022

Hellasship

Capesize

181,325

2012

Imabari

T/C Index Linked(3)

04/2022

Fellowship

Capesize

179,701

2010

Daewoo

T/C Index Linked(4)

Yes

06/2022

Championship

Capesize

179,238

2011

Sungdong SB

Yes

T/C Index Linked(5)

Yes

11/2023

Partnership

Capesize

179,213

2012

Hyundai

Yes

T/C Index Linked(6)

Yes

06/2022

Knightship

Capesize

178,978

2010

Hyundai

Yes

T/C Index Linked(7)

05/2023

Lordship

Capesize

178,838

2010

Hyundai

Yes

T/C Index Linked(8)

Yes

05/2022

Goodship

Capesize

177,536

2005

Mitsui

T/C Index Linked(9)

Yes

08/2022

Friendship

Capesize

176,952

2009

Namura

T/C Index Linked(10)

12/2022

Tradership

Capesize

176,925

2006

Namura

T/C Index Linked(11)

Yes

05/2022

Flagship

Capesize

176,387

2013

Mitsui

T/C Index Linked(12)

Yes

05/2026

Gloriuship

Capesize

171,314

2004

Hyundai

T/C Index Linked(13)

Yes

01/2022

Geniuship

Capesize

170,057

2010

Sungdong SB

T/C Index Linked(14)

Yes

02/2022

Premiership

Capesize

170,024

2010

Sungdong SB

Yes

T/C Index Linked(15)

11/2022

Squireship

Capesize

170,018

2010

Sungdong SB

Yes

T/C Index Linked(16)

12/2022

Dukeship(17)

Capesize

181,453

2010

Japanese yard

T/C Index Linked(18)

Yes

12/2022

Total / Average age

3,011,083

11.7

(1) Chartered by a European cargo operator and delivered to the charterer on June 7, 2021 for a period of about 12 to about 18 months. The daily charter hire is fixed at $31,000.

(2) Chartered by a U.S. commodity trading company and delivered to the charterer on September 2, 2021 for a period of about 12 to about 16 months. The daily charter hire is fixed at $31,750.

(3) Chartered by NYK Line and delivered to the charterer on May 10, 2021 for a period of minimum 11 to maximum 15 months. The daily charter hire is based on the BCI.

(4) Chartered by Anglo American, a leading global mining company, and delivered to the charterer in June 2021 for a period of minimum 12 to about 15 months from the delivery date. The daily charter hire is based on the BCI.

(5) Chartered by Cargill and delivered to the charterer on November 7, 2018 for a period of employment of 60 months, with an additional period of about 24 to about 27 months at the charterer’s option. The daily charter hire is based on the BCI plus a net daily scrubber premium of $1,740.

(6) Chartered by a major European utility and energy company and delivered to the charterer on September 11, 2019 for a period of minimum 33 to maximum 37 months with an optional period of about 11 to maximum 13 months. The daily charter hire is based on the BCI.

(7) Chartered by Glencore and delivered to the charterer on May 15, 2020 for a period of about 36 to about 42 months with two optional periods of 11 to 13 months. The daily charter hire is based on the BCI.

(8) Chartered by a major European utility and energy company and delivered on August 4, 2019 for a period of minimum 33 to maximum 37 months with an optional period of about 11 to maximum 13 months. The daily charter hire is based on the BCI plus a net daily scrubber premium of $3,735 until May 2021.

(9) Chartered by an International commodities trader and will be delivered to the charterer by November 10, 2021 for a period of about 9 to about 12 months. The daily charter hire is based on the BCI.

(10) Chartered by NYK Line and was delivered to the charterer on July 29, 2021 for a period of minimum 17 to maximum 24 months. The daily charter hire is based on the BCI.

(11) Chartered by a major South Korean industrial company and was delivered to the charterer on June 15, 2021 for a period employment of minimum 11 to about 15 months. The daily charter hire is based on the BCI.

(12) Chartered by Cargill. The vessel was delivered to the charterer on May 10, 2021 for a period of 60 months. The daily charter hire is based at a premium over the BCI minus $1,325 per day.

(13) Chartered by Pacbulk Shipping and delivered to the charterer on April 23, 2020 initially for a period of about 4 to about 7 months, then for a further time charter period of about 10 to about 14 months. Upon expiration of the previous T/C period, in June 2021, the vessel commenced the second extension period up to minimum January 1, 2022 to maximum April 30, 2022. The daily charter hire is based on the BCI.

(14) Chartered by Pacbulk Shipping and delivered to the charterer on March 22, 2021 for a period of about 11 to about 14 months from the delivery date. The daily charter hire is based on the BCI.

(15) Chartered by Glencore and delivered to the charterer on November 29, 2019 for a period of minimum 36 to maximum 42 months with two optional periods of minimum 11 to maximum 13 months. The daily charter hire is based on the BCI plus a net daily scrubber premium of $2,055.

(16) Chartered by Glencore and delivered to the charterer on December 19, 2019 for a period of minimum 36 to maximum 42 months with two optional periods of minimum 11 to maximum 13 months. The daily charter hire is based on the BCI plus a net daily scrubber premium of $2,055.

(17) Expected delivery within November 2021.

(18) Chartered by NYK Line and will be delivered to the charterer upon its delivery to the Company for a period of about 13 to about 18 months. The daily charter hire is based on the BCI.

(19) The Company has the option to convert the index-linked rate to a fixed one for a period ranging between 2 and 12 months, based on the prevailing Capesize FFA Rate for the selected period.

Fleet Data:

(U.S. Dollars in thousands)

Q3 2021

Q3 2020

9M 2021

9M 2020

Ownership days (1)

1,477

975

3,632

2,795

Operating days (2)

1,439

973

3,494

2,737

Fleet utilization (3)

97.4%

99.8%

96.2%

97.9%

TCE rate (4)

$30,764

$16,219

$23,449

$10,267

Daily Vessel Operating Expenses (5)

$5,865

$5,984

$5,806

$5,573

(1) Ownership days are the total number of calendar days in a period during which the vessels in a fleet have been owned or chartered in. Ownership days are an indicator of the size of the Company’s fleet over a period and affect both the amount of revenues and the amount of expenses that the Company recorded during a period.

(2) Operating days are the number of available days in a period less the aggregate number of days that the vessels are off-hire due to unforeseen circumstances. Operating days includes the days that our vessels are in ballast voyages without having finalized agreements for their next employment.

(3) Fleet utilization is the percentage of time that the vessels are generating revenue and is determined by dividing operating days by ownership days for the relevant period.

(4) TCE rate is defined as the Company’s net revenue less voyage expenses during a period divided by the number of the Company’s operating days during the period. Voyage expenses include port charges, bunker (fuel oil and diesel oil) expenses, canal charges and other commissions. The Company includes the TCE rate, a non-GAAP measure, as it believes it provides additional meaningful information in conjunction with net revenues from vessels, the most directly comparable U.S. GAAP measure, and because it assists the Company’s management in making decisions regarding the deployment and use of the Company’s vessels and in evaluating their financial performance. The Company’s calculation of TCE rate may not be comparable to that reported by other companies. The following table reconciles the Company’s net revenues from vessels to the TCE rate.

(In thousands of U.S. Dollars, except operating days and TCE rate)

Q3 2021

Q3 2020

9M 2021

9M 2020

Net revenues from vessels

48,179

19,651

96,409

42,032

Less: Voyage expenses

3,910

3,870

14,477

13,930

Net operating revenues

44,269

15,781

81,932

28,102

Operating days

1,439

973

3,494

2,737

TCE rate

$30,764

$16,219

$23,449

$10,267

(5) Vessel operating expenses include crew costs, provisions, deck and engine stores, lubricants, insurance, maintenance and repairs. Daily Vessel Operating Expenses are calculated by dividing vessel operating expenses by ownership days for the relevant time periods. The Company’s calculation of daily vessel operating expenses may not be comparable to that reported by other companies. The following table reconciles the Company’s vessel operating expenses to daily vessel operating expenses.

(In thousands of U.S. Dollars, except ownership days and Daily Vessel Operating Expenses)

Q3 2021

Q3 2020

9M 2021

9M 2020

Vessel operating expenses

10,042

6,399

24,470

16,141

Less: Pre-delivery expenses

1,379

565

3,381

565

Vessel operating expenses before pre-delivery expenses

8,663

5,834

21,089

15,576

Ownership days

1,477

975

3,632

2,795

Daily Vessel Operating Expenses

$5,865

$5,984

$5,806

$5,573

Net Income / (Loss) to EBITDA and Adjusted EBITDA Reconciliation:

(In thousands of U.S. Dollars)

Q3 2021

Q3 2020

9M 2021

9M 2020

Net income/(loss)

20,064

3,592

20,704

(16,037)

Add: Net interest and finance cost

4,560

5,296

12,867

16,540

Add: Depreciation and amortization

5,490

3,835

13,827

11,143

EBITDA

30,114

12,723

47,398

11,646

Add: stock based compensation

2,773

236

4,704

825

Less: Gain on sale of vessel

(716)

(716)

Less: Gain on debt refinancing

(5,150)

(5,150)

Adjusted EBITDA

32,171

7,809

51,386

7,321

Earnings Before Interest, Taxes, Depreciation and Amortization (“EBITDA”) represents the sum of net income / (loss), interest and finance costs, interest income, depreciation and amortization and, if any, income taxes during a period. EBITDA is not a recognized measurement under U.S. GAAP. Adjusted EBITDA represents EBITDA adjusted to exclude stock-based compensation and the non-recurring gain on sale of vessel and gain on debt refinancing, which the Company believes are not indicative of the ongoing performance of its core operations.

EBITDA and adjusted EBITDA are presented as we believe that these measures are useful to investors as a widely used means of evaluating operating profitability. EBITDA and adjusted EBITDA as presented here may not be comparable to similarly titled measures presented by other companies. These non-GAAP measures should not be considered in isolation from, as a substitute for, or superior to, financial measures prepared in accordance with U.S. GAAP.

Interest and Finance Costs to Cash Interest and Finance Costs Reconciliation:

(In thousands of U.S. Dollars)

Q3 2021

Q3 2020

9M 2021

9M 2020

Interest and finance costs, net

(4,560)

(5,296)

(12,867)

(16,540)

Add: Amortization of deferred finance charges

739

189

2,441

538

Add: Amortization of convertible note beneficial conversion feature

772

1,457

2,010

3,873

Add: Amortization of other deferred charges (shares issued to third party)

77

129

251

430

Cash interest and finance costs

(2,972)

(3,521)

(8,165)

(11,699)

Third Quarter and Recent Developments:

Fleet Updates

M/V Friendship

In July 2021, the Company took delivery of the 176,952 dwt Capesize bulk carrier, built in 2009 in Japan, which was renamed M/V Friendship. The vessel has been fixed on a T/C with NYK Line, a leading Japanese charterer, with earliest redelivery to the Company in December 2022. The gross daily rate of the T/C is based on 102% of the BCI.

M/V Worldship

In August 2021, the Company took delivery of the 181,415 dwt Capesize bulk carrier, built in 2012 in Japan, which was renamed M/V Worldship. The M/V Worldship has been fixed on a T/C with a world-leading U.S. commodity trading company, at a gross daily rate of $31,750 with earliest redelivery to the Company in September 2022.

M/V Leadership

In June 2021, the Company agreed to sell the 2001-built M/V Leadership to an unaffiliated party for a net sale price of approximately $12.0 million. The vessel was delivered to her new owners on September 30, 2021. The sale improved the average age of the Company’s fleet.

M/V Dukeship

In October 2021, the Company agreed to acquire the 181,453 dwt Capesize bulk carrier, built in 2010 in Japan, which will be renamed M/V Dukeship. The purchase price of $34.3 million is expected to be funded with cash on hand. The M/V Dukeship is expected to be delivered within November 2021.

Commercial Updates

M/V Dukeship

The M/V Dukeship has been chartered to NYK at a rate linked to the BCI, for a period of about 13 to about 18 months starting as of the vessel’s delivery to the Company. In addition, the Company has the option to convert to a fixed rate based on the prevailing Capesize FFA for the selected period.

M/V Goodship

The M/V Goodship has been chartered to an international commodities trader and will be delivered to the charterer within November 2021 for a period of about 9 to about 12 months. The daily charter hire is based on the BCI. In addition, the Company has the option to convert to a fixed rate based on the prevailing Capesize FFA for the selected period

Financing Updates

Alpha Bank S.A.

On August 9, 2021, the Company entered into a $44.12 million credit facility to (i) refinance the previous facility of $31.12 million secured by the M/V Squireship and the M/V Lordship (“Tranche A”) and (ii) finance the acquisition of the 2009-built Capesize M/V Friendship (“Tranche B”). Tranche A has the same terms as the previous loan facility. The interest rate for Tranche B is LIBOR plus 3.25% per annum, and the term is four years. Tranche B is repayable through 4 quarterly instalments of $0.7 million followed by 12 quarterly instalments of $0.38 million and a balloon of $5.7 million payable together with the last instalment.

Commitment Letter – M/V Worldship

In October 2021, the Company obtained a commitment letter from a leading Greek bank for a sustainability- linked loan facility to finance part of the acquisition cost of the M/V Worldship. Pursuant to the commitment letter, the sustainability-linked loan will be for an amount of $16.85 million with a five-year term. The principal will be repaid through 4 quarterly instalments of $1.0 million, 2 quarterly instalments of $0.75 million, 14 quarterly instalments of $0.38 million and a final balloon payment of $6.1 million payable at maturity. The loan will be secured by, among other things, a mortgage on the M/V Worldship and a corporate guarantee by the Company. The interest rate will be 3.05% plus LIBOR per annum, which can be further improved based on certain emission reduction thresholds. The approval is subject to definitive documentation, which the Company expects to be completed within November 2021.

Update on Number of Shares Outstanding

As of November 1, 2021, the Company has 174,688,240 shares of common stock issued and outstanding. This includes 3,000,000 shares issued in October 2021 to Jelco Delta Holding Corp. (“Jelco”) following the conversion of $3,600,000 of the principal amount of the convertible note issued to Jelco on March 12, 2015, as amended to date, at the conversion price of $1.20 per share. As a result, the principal amount of the note was reduced from $3,800,000 to $200,000.

Seanergy Maritime Holdings Corp.

Unaudited Condensed Consolidated Balance Sheets
(In thousands of U.S. Dollars)

September 30,
2021

December 31, 2020*

ASSETS

Cash and cash equivalents, restricted cash, term deposits and short-term receivable from vessel sale proceeds

52,560

23,651

Vessels, net

396,792

256,737

Other assets

15,705

14,857

TOTAL ASSETS

465,057

295,245

LIABILITIES AND STOCKHOLDERS’ EQUITY

Long-term debt and other financial liabilities

204,639

169,762

Convertible notes

17,235

14,516

Other liabilities

20,932

15,273

Stockholders’ equity

222,251

95,694

TOTAL LIABILITIES AND STOCKHOLDERS’ EQUITY

465,057

295,245

* Derived from the audited consolidated financial statements as of the period as of that date

Seanergy Maritime Holdings Corp.
Unaudited Condensed Consolidated Statements of Operations
(In thousands of U.S. Dollars, except for share and per share data, unless otherwise stated)

Three months ended
September 30,

Nine months ended
September 30,

2021

2020

2021

2020

Revenues:

Vessel revenues

50,020

20,352

100,043

43,500

Commissions

(1,841

)

(701

)

(3,634

)

(1,468

)

Vessel revenue, net

48,179

19,651

96,409

42,032

Expenses:

Voyage expenses

(3,910

)

(3,870

)

(14,477

)

(13,930

)

Vessel operating expenses

(10,042

)

(6,399

)

(24,470

)

(16,141

)

Management fees

(400

)

(270

)

(1,029

)

(773

)

General and administrative expenses

(4,419

)

(1,537

)

(9,715

)

(4,682

)

Depreciation and amortization

(5,490

)

(3,835

)

(13,827

)

(11,143

)

Gain on sale of vessel

716

716

Operating income/(loss)

24,634

3,740

33,607

(4,637

)

Other expenses:

Interest and finance costs, net

(4,560

)

(5,296

)

(12,867

)

(16,540

)

Gain on debt refinancing

5,150

5,150

Other, net

(10

)

(2

)

(36

)

(10

)

Total other expenses, net:

(4,570

)

(148

)

(12,903

)

(11,400

)

Net income/(loss)

20,064

3,592

20,704

(16,037

)

Net income/(loss) per common share, basic

0.12

0.08

0.14

(0.57

)

Weighted average number of common shares outstanding, basic

166,710,006

46,144,608

147,403,541

28,118,984

Net income/(loss) per common share, diluted

0.10

0.04

0.13

(0.57

)

Weighted average number of common shares outstanding, diluted

205,974,543

89,041,036

186,370,709

28,118,984

About Seanergy Maritime Holdings Corp.

Seanergy Maritime Holdings Corp. is the only pure-play Capesize ship-owner publicly listed in the US. Seanergy provides marine dry bulk transportation services through a modern fleet of Capesize vessels. On a ‘fully-delivered’ basis, the Company’s fleet will consist of 17 Capesize vessels with an average age of 11.7 years and aggregate cargo carrying capacity of 3,011,083 dwt.

The Company is incorporated in the Marshall Islands and has executive offices in Glyfada, Greece. The Company’s common shares trade on the Nasdaq Capital Market under the symbol “SHIP”, its Class A warrants under “SHIPW” and its Class B warrants under “SHIPZ”.

Please visit our company website at: www.seanergymaritime.com.

Forward-Looking Statements

This press release contains forward-looking statements (as defined in Section 27A of the Securities Act of 1933, as amended, and Section 21E of the Securities Exchange Act of 1934, as amended) concerning future events. Words such as “may”, “should”, “expects”, “intends”, “plans”, “believes”, “anticipates”, “hopes”, “estimates” and variations of such words and similar expressions are intended to identify forward-looking statements. These statements involve known and unknown risks and are based upon a number of assumptions and estimates, which are inherently subject to significant uncertainties and contingencies, many of which are beyond the control of the Company. Actual results may differ materially from those expressed or implied by such forward-looking statements. Factors that could cause actual results to differ materially include, but are not limited to, the Company’s operating or financial results; the Company’s liquidity, including its ability to service its indebtedness; competitive factors in the market in which the Company operates; shipping industry trends, including charter rates, vessel values and factors affecting vessel supply and demand; future, pending or recent acquisitions and dispositions, business strategy, areas of possible expansion or contraction, and expected capital spending or operating expenses; risks associated with operations outside the United States; risks associated with the length and severity of the ongoing novel coronavirus (COVID-19) outbreak, including its effects on demand for dry bulk products and the transportation thereof; and other factors listed from time to time in the Company’s filings with the SEC, including its most recent annual report on Form 20-F. The Company’s filings can be obtained free of charge on the SEC’s website at www.sec.gov. Except to the extent required by law, the Company expressly disclaims any obligations or undertaking to release publicly any updates or revisions to any forward-looking statements contained herein to reflect any change in the Company’s expectations with respect thereto or any change in events, conditions or circumstances on which any statement is based.

For further information please contact:

Seanergy Investor Relations
Tel: +30 213 0181 522
E-mail: ir@seanergy.gr

Capital Link, Inc.
Paul Lampoutis
230 Park Avenue Suite 1536
New York, NY 10169
Tel: (212) 661-7566
E-mail: seanergy@capitallink.com

1 EBITDA and TCE rate are non-GAAP measures. Please see the reconciliation below of EBITDA to net income and TCE rate to net revenues from vessels, in each case the most directly comparable U.S. GAAP measure.
2 This guidance is based on certain assumptions and there can be no assurance that these TCE estimates, or projected utilization will be realized. TCE estimates include certain floating (index) to fixed rate conversions concluded in previous periods. For vessels on index-linked T/Cs, the TCE realized will vary with the underlying index, and for the purposes of this guidance, the TCE assumed for the remaining operating days of an index-linked T/C is equal to the average FFA rate of $28,000 per day for November and December 2021 as of November1, 2021. Spot estimates are provided using the load-to-discharge method of accounting. Load-to-discharge accounting recognizes revenues over fewer days as opposed to the discharge-to-discharge method of accounting used prior to 2018, resulting in higher rates for these days and only voyage expenses being recorded in the ballast days. Over the duration of the voyage (discharge-to-discharge) there is no difference in the total revenues and costs to be recognized. The rates quoted are for days currently contracted. Increased ballast days at the end of the quarter will reduce the additional revenues that can be booked based on the accounting cut-offs and therefore the resulting TCE will be reduced accordingly.

Seanergy Maritime Holdings Corp. Reports Record Financial Results for the Third Quarter and Nine-Month Period Ended September 30, 2021


Seanergy Maritime Holdings Corp. Reports Record Financial Results for the Third Quarter and Nine-Month Period Ended September 30, 2021


Seanergy Maritime Holdings Corp. Reports Record Financial Results for the Third Quarter and NineMonth Period Ended September 30, 2021

Highlights of the Third Quarter of 2021:

  • Gross revenues: $50 million in Q3 2021, as compared to $20.4 million in Q3 2020, up 146%

  • Net Income: $20.1 million in Q3 2021, as compared to $3.6 million in Q3 2020, up 459%

  • EBITDA1: $30.1 million in Q3 2021, as compared to $12.7 million in Q3 2020, up 137%

  • Adjusted EBITDA1: $32.2 million in Q3 2021, as compared to $7.8 million in Q3 2020, up 312%

Highlights of the Nine Months ended September 30, 2021:

  • Gross revenues: $100 million in 9M 2021, as compared to $43.5 million in 9M 2020, up 130%

  • Net Income: $20.7 million in 9M 2021, as compared to a net loss of $16 million in 9M 2020

  • EBITDA1: $47.4 million in 9M 2021, as compared to $11.6 million in 9M 2020, up 307%

  • Adjusted EBITDA1: $51.4 million in 9M 2021, as compared to $7.3 million in 9M 2020, up 602%

First Nine Months of 2021 and Recent Developments:

  • Acquisition of 7 modern Japanese Capesizes and sale of our oldest vessel in 2021 to daterepresenting total investment of $193.2 million and fleet increase of 55%

  • Ten new time-charter employment agreements with world-renowned charterers

  • 100% of the fleet employed under time-charters (“T/Cs”), 88% of which at index-linked rates

  • Financing and refinancing transactions of $134.2 million

November 2, 2021 – Glyfada, Greece – Seanergy Maritime Holdings Corp. (the “Company”) (NASDAQ: SHIP), announced today its financial results for the third quarter ended September 30, 2021.

For the quarter ended September 30, 2021, the Company generated gross revenues of $50.0 million, a 146% increase compared to the third quarter of 2020. Adjusted EBITDA for the quarter was $32.2 million, from $7.8 million in the same period of 2020 . Net income for the third quarter was $20.1 million compared to net income of $3.6 million in the third quarter of 2020. The daily Time Charter Equivalent (“TCE”)1 of the fleet for the third quarter of 2021 was $30,764, marking a 90% increase compared to $16,219 for the same period of 2020.

For the nine-month period ended September 30, 2021, gross revenues were $100.0 million, increased by 130% when compared to $43.5 million in the same period of 2020. Adjusted EBITDA for the first nine months of 2021 was $51.4 million, compared to an adjusted EBITDA of $7.3 million in the same period of 2020. The daily TCE of the fleet for the first nine months of 2021 was $23,449 compared to $10,267 in the first nine months of 2020. The average daily OPEX was $5,806 compared to $5,573 in the respective period of 2020.

Cash and cash-equivalents, restricted cash, term deposits, including a short-term receivable from vessel sale proceeds as of September 30, 2021, stood at $52.6 million. The M/V Leadership was delivered to her new owners on September 30, 2021 and due to timing of payments, the gross proceeds of $13.3 million, including bunkers and other inventories, were received in the beginning of October. Shareholders’ equity at the end of the third quarter was $222.3 million, compared to $95.7 million on December 31, 2020. Long-term debt (senior and junior loans and other financial liabilities) net of deferred charges stood at $204.6 million as of September 30, 2021, from $169.8 million as of the end of 2020, representing a 20% increase. In the same period, following the addition of six of our new acquisitions and the removal of the M/V Leadership, the book value of our fleet increased by 55% to $396.8 million from $256.7 million.

Fourth Quarter 2021 TCE Guidance:

As of the date hereof, approximately 69% of the Company fleet’s expected operating days in the fourth quarter of 2021 have been fixed at an estimated TCE of approximately $38,440. Assuming that for the remaining operating days of our index-linked T/Cs, the respective vessels’ TCE will be equal to the average Forward Freight Agreement (“FFA”) rate of approximately $28,000 per day (based on the FFA curve of November 1, 2021), our estimated TCE for the fourth quarter will be approximately $35,2002. Our TCE guidance for the fourth quarter of 2021 includes certain conversions (6 vessels) of index-linked charters to fixed, which were concluded in the third quarter of 2021 as part of our freight hedging strategy. The following table provides the break-down:

Operating Days

TCE

TCE – fixed rate (index-linked conversion)

552

$31,273

TCE – fixed rate

184

$29,761

TCE – index linked unhedged

778

$39,281

Total / Average

1,514

$35,205


Stamatis Tsantanis, the Company’s Chairman & Chief Executive Officer, stated:

“I am very excited to announce our financial results for the third quarter and nine-month period that ended on September 30, 2021, marking a record profit for Seanergy since we started acquiring our current fleet in 2015. The exceptional financial performance of our Company is attributed to the combination of the well-timed acquisitions that we executed in the past year, as well as the highest dry bulk market of the last decade.

As far as our results for the third quarter of 2021 are concerned, our daily TCE was $30,764, outperforming our guidance for the quarter and marking an increase of 90% compared to the TCE of the third quarter of 2020. The TCE of the fleet for the first nine months of 2021 was $23,449 per day, increased by 128% when compared to a daily TCE of $10,267 in the same period of 2020. Our fourth quarter TCE performance to date and TCE guidance for the entire quarter is equally strong at $38,440 and $35,200 per day respectively. Adjusted EBITDA for the third quarter and first nine months of 2021 was $32.2 million and $51.4 million, respectively, as compared to an adjusted EBITDA of $7.8 million and $7.3 million in the respective periods of 2020. Net result for the quarter was a profit of $20.1 million increased by 459%, from $3.6 million in the same period of 2020. This impressive increase underscores the operating leverage of the Company and its tremendous upside potential in today’s earnings environment.

Regarding our fleet growth strategy, investment in vessel acquisitions in 2021 to date has totalled approximately $193.2 million for seven high quality Japan-built Capesize vessels with an average age of 11.1 years, with the most recent acquisition being that of the 2010-built M/V Dukeship. Within the third quarter, we took timely delivery of two Capesize vessels, while we also delivered the M/V Leadership to its new owners. The total investment has been fully funded by our strong cash reserves, as well as our new financing arrangements.

Concerning our commercial developments in 2021 to date, we have concluded ten new time-charter employment agreements with at least one-year duration, in each case with leading charterers in the Capesize sector. Following the recently agreed employment contracts for the M/Vs Dukeship and Goodship, 15 vessels will be employed on index-linked charters. This strategy has proven to be very efficient since our fleet’s earnings best reflect daily movements of the BCI and we are able to capitalize on market spikes. In most cases, the agreements entail options to convert the index-linked rate to a fixed one, based on the prevailing FFA curve, allowing us, at our option, to lock our future market exposure at profitable rates. By this, we have achieved what we believe to be the optimal positioning of our fleet for a commodities super-cycle.

On the financing front, since the beginning of 2021 we have concluded new financings and refinancings of $134.2 million while repaying $82.3 million on existing debt facilities. Since the start of the third quarter, we have agreed two new financings of approximately $30 million, while repaying $12.6 million on our existing financings. Specifically, we completed the financing of the M/V Friendship with one of our long-term lenders, while receiving a commitment letter from a major Greek Bank for a sustainability-linked loan to be secured by the M/V Worldship. Our weighted average interest rate for the first nine months of 2021 was reduced by approximately 130 basis points over the same period of 2020 and we expect this trend to continue in 2022.

With respect to our ESG initiatives, we have always been at the forefront of all major environmental regulations, and we are intensifying our efforts to meet IMO’s decarbonization targets for 2030. We have recently endorsed the Call to Action for Shipping Decarbonization, a global coalition of over 190 industry leaders and organizations representing the entire maritime value chain. In addition, we have signed agreements with DeepSea for the installation of Artificial Intelligence performance systems on our fleet and with Marsoft for the screening of selected vessels, which promotes transparency of our energy efficiency upgrades.

With a view to optimising the energy efficiency of our fleet, we have decided, in some cases in cooperation with our charterers, to install Energy Saving Devices (“ESDs”) on the entire fleet. This upgrade program will progress gradually, with the installation of the ESDs taking place during each vessel’s upcoming drydocking and is intended to ensure that the speed of our expanded fleet will not be materially impacted by the upcoming environmental regulations. Finally, we are investing in the research and development of emission reduction technologies, including biofuel blend trials, which is expected to contribute considerably to the transition to a greener shipping industry.

Regarding market conditions and future prospects, we have recently experienced the highest market levels of the last 12 years in the Capesize sector, with daily rates reaching $87,000 per day at the start of the fourth quarter. Notwithstanding the short-term correction of recent weeks, we believe that the Capesize market is supported by the most favourable demand-supply fundamentals of its recent history. More specifically, the Capesize orderbook still stands at the lowest level of the last 25 years and the upcoming environmental regulations are expected to lead to a significant vessel supply squeeze in the following years. In addition, demand for dry raw materials is supported by the global energy supply shortages, as well as the worldwide stimuli and infrastructure projects.

On that basis, we feel confident about the prospects of the Capesize market for years to come.”

Company Fleet following M/V Dukeship delivery:

Vessel Name

Vessel Class

Capacity (DWT)

Year Built

Yard

Scrubber Fitted

Employment Type

FFA conversion option(19)

Earliest T/C expiration

Patriotship

Capesize

181,709

2010

Imabari

Yes

T/C – fixed rate(1)

06/2022

Worldship

Capesize

181,415

2012

Koyo – Imabari

Yes

T/C – fixed rate(2)

09/2022

Hellasship

Capesize

181,325

2012

Imabari

T/C Index Linked(3)

04/2022

Fellowship

Capesize

179,701

2010

Daewoo

T/C Index Linked(4)

Yes

06/2022

Championship

Capesize

179,238

2011

Sungdong SB

Yes

T/C Index Linked(5)

Yes

11/2023

Partnership

Capesize

179,213

2012

Hyundai

Yes

T/C Index Linked(6)

Yes

06/2022

Knightship

Capesize

178,978

2010

Hyundai

Yes

T/C Index Linked(7)

05/2023

Lordship

Capesize

178,838

2010

Hyundai

Yes

T/C Index Linked(8)

Yes

05/2022

Goodship

Capesize

177,536

2005

Mitsui

T/C Index Linked(9)

Yes

08/2022

Friendship

Capesize

176,952

2009

Namura

T/C Index Linked(10)

12/2022

Tradership

Capesize

176,925

2006

Namura

T/C Index Linked(11)

Yes

05/2022

Flagship

Capesize

176,387

2013

Mitsui

T/C Index Linked(12)

Yes

05/2026

Gloriuship

Capesize

171,314

2004

Hyundai

T/C Index Linked(13)

Yes

01/2022

Geniuship

Capesize

170,057

2010

Sungdong SB

T/C Index Linked(14)

Yes

02/2022

Premiership

Capesize

170,024

2010

Sungdong SB

Yes

T/C Index Linked(15)

11/2022

Squireship

Capesize

170,018

2010

Sungdong SB

Yes

T/C Index Linked(16)

12/2022

Dukeship(17)

Capesize

181,453

2010

Japanese yard

T/C Index Linked(18)

Yes

12/2022

Total / Average age

3,011,083

11.7

(1) Chartered by a European cargo operator and delivered to the charterer on June 7, 2021 for a period of about 12 to about 18 months. The daily charter hire is fixed at $31,000.

(2) Chartered by a U.S. commodity trading company and delivered to the charterer on September 2, 2021 for a period of about 12 to about 16 months. The daily charter hire is fixed at $31,750.

(3) Chartered by NYK Line and delivered to the charterer on May 10, 2021 for a period of minimum 11 to maximum 15 months. The daily charter hire is based on the BCI.

(4) Chartered by Anglo American, a leading global mining company, and delivered to the charterer in June 2021 for a period of minimum 12 to about 15 months from the delivery date. The daily charter hire is based on the BCI.

(5) Chartered by Cargill and delivered to the charterer on November 7, 2018 for a period of employment of 60 months, with an additional period of about 24 to about 27 months at the charterer’s option. The daily charter hire is based on the BCI plus a net daily scrubber premium of $1,740.

(6) Chartered by a major European utility and energy company and delivered to the charterer on September 11, 2019 for a period of minimum 33 to maximum 37 months with an optional period of about 11 to maximum 13 months. The daily charter hire is based on the BCI.

(7) Chartered by Glencore and delivered to the charterer on May 15, 2020 for a period of about 36 to about 42 months with two optional periods of 11 to 13 months. The daily charter hire is based on the BCI.

(8) Chartered by a major European utility and energy company and delivered on August 4, 2019 for a period of minimum 33 to maximum 37 months with an optional period of about 11 to maximum 13 months. The daily charter hire is based on the BCI plus a net daily scrubber premium of $3,735 until May 2021.

(9) Chartered by an International commodities trader and will be delivered to the charterer by November 10, 2021 for a period of about 9 to about 12 months. The daily charter hire is based on the BCI.

(10) Chartered by NYK Line and was delivered to the charterer on July 29, 2021 for a period of minimum 17 to maximum 24 months. The daily charter hire is based on the BCI.

(11) Chartered by a major South Korean industrial company and was delivered to the charterer on June 15, 2021 for a period employment of minimum 11 to about 15 months. The daily charter hire is based on the BCI.

(12) Chartered by Cargill. The vessel was delivered to the charterer on May 10, 2021 for a period of 60 months. The daily charter hire is based at a premium over the BCI minus $1,325 per day.

(13) Chartered by Pacbulk Shipping and delivered to the charterer on April 23, 2020 initially for a period of about 4 to about 7 months, then for a further time charter period of about 10 to about 14 months. Upon expiration of the previous T/C period, in June 2021, the vessel commenced the second extension period up to minimum January 1, 2022 to maximum April 30, 2022. The daily charter hire is based on the BCI.

(14) Chartered by Pacbulk Shipping and delivered to the charterer on March 22, 2021 for a period of about 11 to about 14 months from the delivery date. The daily charter hire is based on the BCI.

(15) Chartered by Glencore and delivered to the charterer on November 29, 2019 for a period of minimum 36 to maximum 42 months with two optional periods of minimum 11 to maximum 13 months. The daily charter hire is based on the BCI plus a net daily scrubber premium of $2,055.

(16) Chartered by Glencore and delivered to the charterer on December 19, 2019 for a period of minimum 36 to maximum 42 months with two optional periods of minimum 11 to maximum 13 months. The daily charter hire is based on the BCI plus a net daily scrubber premium of $2,055.

(17) Expected delivery within November 2021.

(18) Chartered by NYK Line and will be delivered to the charterer upon its delivery to the Company for a period of about 13 to about 18 months. The daily charter hire is based on the BCI.

(19) The Company has the option to convert the index-linked rate to a fixed one for a period ranging between 2 and 12 months, based on the prevailing Capesize FFA Rate for the selected period.

Fleet Data:

(U.S. Dollars in thousands)

Q3 2021

Q3 2020

9M 2021

9M 2020

Ownership days (1)

1,477

975

3,632

2,795

Operating days (2)

1,439

973

3,494

2,737

Fleet utilization (3)

97.4%

99.8%

96.2%

97.9%

TCE rate (4)

$30,764

$16,219

$23,449

$10,267

Daily Vessel Operating Expenses (5)

$5,865

$5,984

$5,806

$5,573

(1) Ownership days are the total number of calendar days in a period during which the vessels in a fleet have been owned or chartered in. Ownership days are an indicator of the size of the Company’s fleet over a period and affect both the amount of revenues and the amount of expenses that the Company recorded during a period.

(2) Operating days are the number of available days in a period less the aggregate number of days that the vessels are off-hire due to unforeseen circumstances. Operating days includes the days that our vessels are in ballast voyages without having finalized agreements for their next employment.

(3) Fleet utilization is the percentage of time that the vessels are generating revenue and is determined by dividing operating days by ownership days for the relevant period.

(4) TCE rate is defined as the Company’s net revenue less voyage expenses during a period divided by the number of the Company’s operating days during the period. Voyage expenses include port charges, bunker (fuel oil and diesel oil) expenses, canal charges and other commissions. The Company includes the TCE rate, a non-GAAP measure, as it believes it provides additional meaningful information in conjunction with net revenues from vessels, the most directly comparable U.S. GAAP measure, and because it assists the Company’s management in making decisions regarding the deployment and use of the Company’s vessels and in evaluating their financial performance. The Company’s calculation of TCE rate may not be comparable to that reported by other companies. The following table reconciles the Company’s net revenues from vessels to the TCE rate.

(In thousands of U.S. Dollars, except operating days and TCE rate)

Q3 2021

Q3 2020

9M 2021

9M 2020

Net revenues from vessels

48,179

19,651

96,409

42,032

Less: Voyage expenses

3,910

3,870

14,477

13,930

Net operating revenues

44,269

15,781

81,932

28,102

Operating days

1,439

973

3,494

2,737

TCE rate

$30,764

$16,219

$23,449

$10,267

(5) Vessel operating expenses include crew costs, provisions, deck and engine stores, lubricants, insurance, maintenance and repairs. Daily Vessel Operating Expenses are calculated by dividing vessel operating expenses by ownership days for the relevant time periods. The Company’s calculation of daily vessel operating expenses may not be comparable to that reported by other companies. The following table reconciles the Company’s vessel operating expenses to daily vessel operating expenses.

(In thousands of U.S. Dollars, except ownership days and Daily Vessel Operating Expenses)

Q3 2021

Q3 2020

9M 2021

9M 2020

Vessel operating expenses

10,042

6,399

24,470

16,141

Less: Pre-delivery expenses

1,379

565

3,381

565

Vessel operating expenses before pre-delivery expenses

8,663

5,834

21,089

15,576

Ownership days

1,477

975

3,632

2,795

Daily Vessel Operating Expenses

$5,865

$5,984

$5,806

$5,573

Net Income / (Loss) to EBITDA and Adjusted EBITDA Reconciliation:

(In thousands of U.S. Dollars)

Q3 2021

Q3 2020

9M 2021

9M 2020

Net income/(loss)

20,064

3,592

20,704

(16,037)

Add: Net interest and finance cost

4,560

5,296

12,867

16,540

Add: Depreciation and amortization

5,490

3,835

13,827

11,143

EBITDA

30,114

12,723

47,398

11,646

Add: stock based compensation

2,773

236

4,704

825

Less: Gain on sale of vessel

(716)

(716)

Less: Gain on debt refinancing

(5,150)

(5,150)

Adjusted EBITDA

32,171

7,809

51,386

7,321

Earnings Before Interest, Taxes, Depreciation and Amortization (“EBITDA”) represents the sum of net income / (loss), interest and finance costs, interest income, depreciation and amortization and, if any, income taxes during a period. EBITDA is not a recognized measurement under U.S. GAAP. Adjusted EBITDA represents EBITDA adjusted to exclude stock-based compensation and the non-recurring gain on sale of vessel and gain on debt refinancing, which the Company believes are not indicative of the ongoing performance of its core operations.

EBITDA and adjusted EBITDA are presented as we believe that these measures are useful to investors as a widely used means of evaluating operating profitability. EBITDA and adjusted EBITDA as presented here may not be comparable to similarly titled measures presented by other companies. These non-GAAP measures should not be considered in isolation from, as a substitute for, or superior to, financial measures prepared in accordance with U.S. GAAP.

Interest and Finance Costs to Cash Interest and Finance Costs Reconciliation:

(In thousands of U.S. Dollars)

Q3 2021

Q3 2020

9M 2021

9M 2020

Interest and finance costs, net

(4,560)

(5,296)

(12,867)

(16,540)

Add: Amortization of deferred finance charges

739

189

2,441

538

Add: Amortization of convertible note beneficial conversion feature

772

1,457

2,010

3,873

Add: Amortization of other deferred charges (shares issued to third party)

77

129

251

430

Cash interest and finance costs

(2,972)

(3,521)

(8,165)

(11,699)

Third Quarter and Recent Developments:

Fleet Updates

M/V Friendship

In July 2021, the Company took delivery of the 176,952 dwt Capesize bulk carrier, built in 2009 in Japan, which was renamed M/V Friendship. The vessel has been fixed on a T/C with NYK Line, a leading Japanese charterer, with earliest redelivery to the Company in December 2022. The gross daily rate of the T/C is based on 102% of the BCI.

M/V Worldship

In August 2021, the Company took delivery of the 181,415 dwt Capesize bulk carrier, built in 2012 in Japan, which was renamed M/V Worldship. The M/V Worldship has been fixed on a T/C with a world-leading U.S. commodity trading company, at a gross daily rate of $31,750 with earliest redelivery to the Company in September 2022.

M/V Leadership

In June 2021, the Company agreed to sell the 2001-built M/V Leadership to an unaffiliated party for a net sale price of approximately $12.0 million. The vessel was delivered to her new owners on September 30, 2021. The sale improved the average age of the Company’s fleet.

M/V Dukeship

In October 2021, the Company agreed to acquire the 181,453 dwt Capesize bulk carrier, built in 2010 in Japan, which will be renamed M/V Dukeship. The purchase price of $34.3 million is expected to be funded with cash on hand. The M/V Dukeship is expected to be delivered within November 2021.

Commercial Updates

M/V Dukeship

The M/V Dukeship has been chartered to NYK at a rate linked to the BCI, for a period of about 13 to about 18 months starting as of the vessel’s delivery to the Company. In addition, the Company has the option to convert to a fixed rate based on the prevailing Capesize FFA for the selected period.

M/V Goodship

The M/V Goodship has been chartered to an international commodities trader and will be delivered to the charterer within November 2021 for a period of about 9 to about 12 months. The daily charter hire is based on the BCI. In addition, the Company has the option to convert to a fixed rate based on the prevailing Capesize FFA for the selected period

Financing Updates

Alpha Bank S.A.

On August 9, 2021, the Company entered into a $44.12 million credit facility to (i) refinance the previous facility of $31.12 million secured by the M/V Squireship and the M/V Lordship (“Tranche A”) and (ii) finance the acquisition of the 2009-built Capesize M/V Friendship (“Tranche B”). Tranche A has the same terms as the previous loan facility. The interest rate for Tranche B is LIBOR plus 3.25% per annum, and the term is four years. Tranche B is repayable through 4 quarterly instalments of $0.7 million followed by 12 quarterly instalments of $0.38 million and a balloon of $5.7 million payable together with the last instalment.

Commitment Letter – M/V Worldship

In October 2021, the Company obtained a commitment letter from a leading Greek bank for a sustainability- linked loan facility to finance part of the acquisition cost of the M/V Worldship. Pursuant to the commitment letter, the sustainability-linked loan will be for an amount of $16.85 million with a five-year term. The principal will be repaid through 4 quarterly instalments of $1.0 million, 2 quarterly instalments of $0.75 million, 14 quarterly instalments of $0.38 million and a final balloon payment of $6.1 million payable at maturity. The loan will be secured by, among other things, a mortgage on the M/V Worldship and a corporate guarantee by the Company. The interest rate will be 3.05% plus LIBOR per annum, which can be further improved based on certain emission reduction thresholds. The approval is subject to definitive documentation, which the Company expects to be completed within November 2021.

Update on Number of Shares Outstanding

As of November 1, 2021, the Company has 174,688,240 shares of common stock issued and outstanding. This includes 3,000,000 shares issued in October 2021 to Jelco Delta Holding Corp. (“Jelco”) following the conversion of $3,600,000 of the principal amount of the convertible note issued to Jelco on March 12, 2015, as amended to date, at the conversion price of $1.20 per share. As a result, the principal amount of the note was reduced from $3,800,000 to $200,000.

Seanergy Maritime Holdings Corp.

Unaudited Condensed Consolidated Balance Sheets
(In thousands of U.S. Dollars)

September 30,
2021

December 31, 2020*

ASSETS

Cash and cash equivalents, restricted cash, term deposits and short-term receivable from vessel sale proceeds

52,560

23,651

Vessels, net

396,792

256,737

Other assets

15,705

14,857

TOTAL ASSETS

465,057

295,245

LIABILITIES AND STOCKHOLDERS’ EQUITY

Long-term debt and other financial liabilities

204,639

169,762

Convertible notes

17,235

14,516

Other liabilities

20,932

15,273

Stockholders’ equity

222,251

95,694

TOTAL LIABILITIES AND STOCKHOLDERS’ EQUITY

465,057

295,245

* Derived from the audited consolidated financial statements as of the period as of that date

Seanergy Maritime Holdings Corp.
Unaudited Condensed Consolidated Statements of Operations
(In thousands of U.S. Dollars, except for share and per share data, unless otherwise stated)

Three months ended
September 30,

Nine months ended
September 30,

2021

2020

2021

2020

Revenues:

Vessel revenues

50,020

20,352

100,043

43,500

Commissions

(1,841

)

(701

)

(3,634

)

(1,468

)

Vessel revenue, net

48,179

19,651

96,409

42,032

Expenses:

Voyage expenses

(3,910

)

(3,870

)

(14,477

)

(13,930

)

Vessel operating expenses

(10,042

)

(6,399

)

(24,470

)

(16,141

)

Management fees

(400

)

(270

)

(1,029

)

(773

)

General and administrative expenses

(4,419

)

(1,537

)

(9,715

)

(4,682

)

Depreciation and amortization

(5,490

)

(3,835

)

(13,827

)

(11,143

)

Gain on sale of vessel

716

716

Operating income/(loss)

24,634

3,740

33,607

(4,637

)

Other expenses:

Interest and finance costs, net

(4,560

)

(5,296

)

(12,867

)

(16,540

)

Gain on debt refinancing

5,150

5,150

Other, net

(10

)

(2

)

(36

)

(10

)

Total other expenses, net:

(4,570

)

(148

)

(12,903

)

(11,400

)

Net income/(loss)

20,064

3,592

20,704

(16,037

)

Net income/(loss) per common share, basic

0.12

0.08

0.14

(0.57

)

Weighted average number of common shares outstanding, basic

166,710,006

46,144,608

147,403,541

28,118,984

Net income/(loss) per common share, diluted

0.10

0.04

0.13

(0.57

)

Weighted average number of common shares outstanding, diluted

205,974,543

89,041,036

186,370,709

28,118,984

About Seanergy Maritime Holdings Corp.

Seanergy Maritime Holdings Corp. is the only pure-play Capesize ship-owner publicly listed in the US. Seanergy provides marine dry bulk transportation services through a modern fleet of Capesize vessels. On a ‘fully-delivered’ basis, the Company’s fleet will consist of 17 Capesize vessels with an average age of 11.7 years and aggregate cargo carrying capacity of 3,011,083 dwt.

The Company is incorporated in the Marshall Islands and has executive offices in Glyfada, Greece. The Company’s common shares trade on the Nasdaq Capital Market under the symbol “SHIP”, its Class A warrants under “SHIPW” and its Class B warrants under “SHIPZ”.

Please visit our company website at: www.seanergymaritime.com.

Forward-Looking Statements

This press release contains forward-looking statements (as defined in Section 27A of the Securities Act of 1933, as amended, and Section 21E of the Securities Exchange Act of 1934, as amended) concerning future events. Words such as “may”, “should”, “expects”, “intends”, “plans”, “believes”, “anticipates”, “hopes”, “estimates” and variations of such words and similar expressions are intended to identify forward-looking statements. These statements involve known and unknown risks and are based upon a number of assumptions and estimates, which are inherently subject to significant uncertainties and contingencies, many of which are beyond the control of the Company. Actual results may differ materially from those expressed or implied by such forward-looking statements. Factors that could cause actual results to differ materially include, but are not limited to, the Company’s operating or financial results; the Company’s liquidity, including its ability to service its indebtedness; competitive factors in the market in which the Company operates; shipping industry trends, including charter rates, vessel values and factors affecting vessel supply and demand; future, pending or recent acquisitions and dispositions, business strategy, areas of possible expansion or contraction, and expected capital spending or operating expenses; risks associated with operations outside the United States; risks associated with the length and severity of the ongoing novel coronavirus (COVID-19) outbreak, including its effects on demand for dry bulk products and the transportation thereof; and other factors listed from time to time in the Company’s filings with the SEC, including its most recent annual report on Form 20-F. The Company’s filings can be obtained free of charge on the SEC’s website at www.sec.gov. Except to the extent required by law, the Company expressly disclaims any obligations or undertaking to release publicly any updates or revisions to any forward-looking statements contained herein to reflect any change in the Company’s expectations with respect thereto or any change in events, conditions or circumstances on which any statement is based.

For further information please contact:

Seanergy Investor Relations
Tel: +30 213 0181 522
E-mail: ir@seanergy.gr

Capital Link, Inc.
Paul Lampoutis
230 Park Avenue Suite 1536
New York, NY 10169
Tel: (212) 661-7566
E-mail: seanergy@capitallink.com

1 EBITDA and TCE rate are non-GAAP measures. Please see the reconciliation below of EBITDA to net income and TCE rate to net revenues from vessels, in each case the most directly comparable U.S. GAAP measure.
2 This guidance is based on certain assumptions and there can be no assurance that these TCE estimates, or projected utilization will be realized. TCE estimates include certain floating (index) to fixed rate conversions concluded in previous periods. For vessels on index-linked T/Cs, the TCE realized will vary with the underlying index, and for the purposes of this guidance, the TCE assumed for the remaining operating days of an index-linked T/C is equal to the average FFA rate of $28,000 per day for November and December 2021 as of November1, 2021. Spot estimates are provided using the load-to-discharge method of accounting. Load-to-discharge accounting recognizes revenues over fewer days as opposed to the discharge-to-discharge method of accounting used prior to 2018, resulting in higher rates for these days and only voyage expenses being recorded in the ballast days. Over the duration of the voyage (discharge-to-discharge) there is no difference in the total revenues and costs to be recognized. The rates quoted are for days currently contracted. Increased ballast days at the end of the quarter will reduce the additional revenues that can be booked based on the accounting cut-offs and therefore the resulting TCE will be reduced accordingly.

Seanergy Maritime (SHIP) – Attractive Financing Locked in

Wednesday, October 27, 2021

Seanergy Maritime (SHIP)
Attractive Financing Locked in

Seanergy Maritime Holdings Corp. is the only pure-play Capesize shipping company listed in the US capital markets. Seanergy provides marine dry bulk transportation services through a modern fleet of Capesize vessels. Upon delivery of the M/V Dukeship, the Company’s operating fleet will consist of 17 Capesize vessels with an average age of 11.5 years and aggregate cargo carrying capacity of approximately 3,011,083 dwt. The Company is incorporated in the Marshall Islands and has executive offices in Glyfada, Greece. The Company’s common shares trade on the Nasdaq Capital Market under the symbol “SHIP”, its Class A warrants under “SHIPW” and its Class B warrants under “SHIPZ”.

Poe Fratt, Senior Research Analyst, Noble Capital Markets, Inc.

Refer to the full report for the price target, fundamental analysis, and rating.

    Worldship financing secured. A commitment on a five year term loan for ~$16.9 million has been secured with closing expected in November. Annual amortization is ~$2.2 million with a balloon of $6.1 million at maturity. Pricing of Libor plus 305 basis points is attractive and might drop if emission reduction targets are hit.

    Stock price weakness might trigger buy backs.  Pro forma 4Q2021 cash estimate is $58 million and Dukeship will be unencumbered so financial flexibility is good. While the Dukeship acquisition might have pushed out buy backs since retiring convert debt is the near-term priority, buy backs below the conversion price of $1.20/share would also be attractive …


This research is provided by Noble Capital Markets, Inc., a FINRA and S.E.C. registered broker-dealer (B/D).

*Analyst certification and important disclosures included in the full report. NOTE: investment decisions should not be based upon the content of this research summary.  Proper due diligence is required before making any investment decision. 

Release – Seanergy Maritime Announces New Sustainability-Linked Loan Facility and Signs the Call to Action for Shipping Decarbonization


Seanergy Maritime Announces New Sustainability-Linked Loan Facility and Signs the Call to Action for Shipping Decarbonization

October 26, 2021 – Athens, Greece – Seanergy Maritime Holdings Corp. (“Seanergy” or the “Company”) (NASDAQ: SHIP) announced today that it has received a commitment letter from a leading European bank for a sustainability-linked loan facility to finance part of the acquisition cost of the M/V Worldship.

Moreover, Seanergy became a signatory to the Call to Action for Shipping Decarbonization (“Call to Action”), a global coalition of over 190 industry leaders and organizations representing the entire maritime value chain.

Financing of the M/V Worldship

Pursuant to the commitment letter, the sustainability-linked loan will be for an amount of $16.85 million and will amortize over a five-year term with a final balloon payment of $6.1 million at maturity. The interest rate will be 3.05% plus LIBOR per annum, which can be further improved based on certain emission reduction thresholds. The approval is subject to definitive documentation, which we expect to be completed within November 2021.

Call to Action for Shipping
Decarbonization

The Call to Action was developed by a task force convened by the Getting To Zero Coalition in September 2021 and will be delivered to world Governments in November 2021, in advance of the UN Climate Change Conference (“COP26”) in Glasgow. The signatories to this Call to Action firmly believe that an equitable decarbonization of the maritime supply chain by 2050 is both possible and necessary.

Stamatis Tsantanis, the Company’s
Chairman & Chief Executive Officer, stated:

“We are very pleased to announce another innovative financing for Seanergy which is consistent both with our conservative leverage approach, as well as our commitment to our sustainability objectives. The proceeds of this new loan will further enhance our strong liquidity position. At the same time, we are excited to actively participate along with global industry leaders in the Call to Action, a significant initiative aiming to contribute to our industry’s decarbonization targets.

Seanergy has long ago prioritized its ESG agenda and has implemented concrete actions and collaborations upon this matter. In this context, we are encouraging stakeholder engagement on all levels, including that of our financiers and governmental organizations, as means to support the common goal of a “greener” shipping.”

About Seanergy Maritime Holdings
Corp.

Seanergy Maritime Holdings Corp. is the only pure-play Capesize ship-owner publicly listed in the US. Seanergy provides marine dry bulk transportation services through a modern fleet of Capesize vessels. Upon delivery of the M/V Dukeship, the Company’s operating fleet will consist of 17 Capesize vessels with an average age of 11.5 years and aggregate cargo carrying capacity of approximately 3,011,083 dwt.

The Company is incorporated in the Marshall Islands and has executive offices in Glyfada, Greece. The Company’s common shares trade on the Nasdaq Capital Market under the symbol “SHIP”, its Class A warrants under “SHIPW” and its Class B warrants under “SHIPZ”.

Please visit our company website at: www.seanergymaritime.com.

Forward-Looking Statements

This press release contains forward-looking statements (as defined in Section 27A of the Securities Act of 1933, as amended, and Section 21E of the Securities Exchange Act of 1934, as amended) concerning future events. Words such as “may”, “should”, “expects”, “intends”, “plans”, “believes”, “anticipates”, “hopes”, “estimates” and variations of such words and similar expressions are intended to identify forward-looking statements. These statements involve known and unknown risks and are based upon a number of assumptions and estimates, which are inherently subject to significant uncertainties and contingencies, many of which are beyond the control of the Company. Actual results may differ materially from those expressed or implied by such forward-looking statements. Factors that could cause actual results to differ materially include, but are not limited to, the Company’s operating or financial results; the Company’s liquidity, including its ability to service its indebtedness; competitive factors in the market in which the Company operates; shipping industry trends, including charter rates, vessel values and factors affecting vessel supply and demand; future, pending or recent acquisitions and dispositions, business strategy, areas of possible expansion or contraction, and expected capital spending or operating expenses; risks associated with operations outside the United States; risks associated with the length and severity of the ongoing novel coronavirus (COVID-19) outbreak, including its effects on demand for dry bulk products and the transportation thereof; and other factors listed from time to time in the Company’s filings with the SEC, including its most recent annual report on Form 20-F. The Company’s filings can be obtained free of charge on the SEC’s website at www.sec.gov. Except to the extent required by law, the Company expressly disclaims any obligations or undertaking to release publicly any updates or revisions to any forward-looking statements contained herein to reflect any change in the Company’s expectations with respect thereto or any change in events, conditions or circumstances on which any statement is based.

For further information please
contact:

Seanergy Investor Relations

Tel: +30 213 0181 522

E-mail: ir@seanergy.gr


Capital Link, Inc.

Paul Lampoutis

230 Park Avenue Suite 1536

New York, NY 10169

Tel: (212) 661-7566

E-mail: seanergy@capitallink.com

Seanergy Maritime (SHIP) – Another Cape Acquisition Expands Fleet to 17

Wednesday, October 20, 2021

Seanergy Maritime (SHIP)
Another Cape Acquisition Expands Fleet to 17

Seanergy Maritime Holdings Corp. is the only pure-play Capesize shipping company listed in the US capital markets.
Seanergy provides marine dry bulk transportation services through a modern fleet of Capesize vessels. Upon delivery of the M/V Dukeship, the Company’s operating fleet will consist of 17 Capesize vessels with an average age of 11.5 years and aggregate cargo carrying capacity of approximately 3,011,083 dwt.
The Company is incorporated in the Marshall Islands and has executive offices in Glyfada, Greece. The Company’s common shares trade on the Nasdaq Capital Market under the symbol “SHIP”, its Class A warrants under “SHIPW” and its Class B warrants under “SHIPZ”.

Poe Fratt, Senior Research Analyst, Noble Capital Markets, Inc.

Refer to the full report for the price target, fundamental analysis, and rating.

    Cape acquisition expands Cape fleet to 17. A Cape, built in 2010 in Japan, will be acquired for $34.3 million in mid-November and renamed the Dukeship. A BWTS has been installed and a survey was recently completed so uptime should be high over next two years. The acquisition also expands overall operating leverage; each $1.0k/day change in Cape TCE rates has a $5.9 million EBITDA impact.

    Fine tuning 2021 EBITDA estimate to $87.3 million, but increasing 2022 EBITDA estimate to $102.2 million from $97.5 million based on TCE rates of $24.5k/day.  Higher opex drags down 3Q2021 results, but acquisition pushes up our 4Q2021E EBITDA to $40.3 million based on TCE rates of $35.0k/day. Visibility is limited into next year with only three Capes fixed at a TCE rate north of $30.0k/day, or …


This research is provided by Noble Capital Markets, Inc., a FINRA and S.E.C. registered broker-dealer (B/D).

*Analyst certification and important disclosures included in the full report. NOTE: investment decisions should not be based upon the content of this research summary.  Proper due diligence is required before making any investment decision. 

Noble Capital Markets Analyst Profile – Poe Fratt

C. K. Poe Fratt
Senior Transportation & Logistics Analyst

Bio

Poe Fratt joined Noble Capital Markets in 2017 with extensive experience covering the energy industry for more than 28 years, both on the sell side and buy side. Poe focuses on the Transportation & Logistics Sector, which includes marine shipping and surface transportation. Prior to joining Noble, he established energy research coverage at D.A. Davidson, mainly focused on midstream and Master Limited Partners (MLPs), in 2015 and was an analyst covering energy and industrials at a deep value hedge fund. Prior to moving to the buy side in 2009, he was the Senior Oilfield Service Analyst at A.G. Edwards for nine years. At A.G. Edwards, he was cited as a top stock picker by the Wall Street Journal in the 2005 and 2006 “Best on the Street” surveys. He also worked at other major investment firms in New York, including BT Alex. Brown, Smith Barney, Loews Corporation, and Lehman Brothers. Poe holds a history degree from Stanford University and earned an MBA from Cornell University (Johnson School).

Credentials

Senior Equity Analyst focused in the Transportation & Logistics sector. More than 28 years of experience on the buy-side and sell-side. Holds a history degree from Stanford University and earned an MBA from Cornell University (Johnson School).

Named WSJ ‘Best on the Street’ Analyst twice.

FINRA licenses 7, 63, 65, 86, 87.

Coverage List


EGLE (NasdaqGS)

ESOA (OTCQB)

EDRY (Nasdaq)

ESEA (Nasdaq)

GNK (NYSE)

GEVO (Nasdaq)

GLDD (NasdaqGS)

GRIN (NasdaqGS)

ORN (NYSE)

PANL (Nasdaq)

PXS (Nasdaq)

SHIP (Nasdaq)


About TipRanks: TipRanks uses Natural Language Processing (NLP) algorithms to aggregate and analyze financial data online. This method, according to the TipRanks website, provides a data-driven measure of accuracy based on the statistical ability of an expert to generate profits and make correct stock recommendations. It is important to note that TipRanks “recommendations,” associated with Noble Capital Markets (Noble) analysts, are inconsistent with the equity research reports published by Noble analysts. Noble analysts do not offer “buy”, “sell” or “hold” recommendations. Noble analysts only offer market commentary on the companies they cover. Channelchek is provided at no cost to be used for information purposes only and not as investment advisement. TipRanks is independent and not affiliated in any way with Noble Financial Group, Inc., Noble Capital Markets, Noble analysts or Channelchek. *TipRanks is the source of the statistical data. Noble Financial Group, Inc., Noble Capital Markets and Channelchek have not independently verified the accuracy of the data. Statistical data shown is as of June 29, 2021 and is subject to change.

Release – Seanergy Maritime Announces Acquisition of its 17th Capesize Vessel


Seanergy Maritime Announces Acquisition of its 17th Capesize Vessel with Prompt Delivery and Completion of Previously-Announced Vessel Sale


Seanergy Maritime Announces Acquisition of its 17th Capesize Vessel with Prompt Delivery and Completion of Previously-Announced Vessel Sale

October 19, 2021 – Glyfada, Greece – Seanergy Maritime Holdings Corp. (the “Company”) (NASDAQ: SHIP) announced today that it has entered into a definitive agreement with an unaffiliated third party to purchase a Capesize vessel (the “Vessel”). In addition, the Company has recently completed the sale and delivery of its oldest Capesize vessel, the M/V Leadership, 2001-built, to its new owners.

The Vessel was built in 2010 at a reputable shipyard in Japan, has a cargo-carrying capacity of approximately 181,500 deadweight tons (“dwt”) and will be renamed M/V Dukeship. The M/V Dukeship is expected to be delivered within November 2021, subject to the satisfaction of certain customary closing conditions. Following her delivery, Seanergy’s fleet will increase to 17 Capesize vessels with an aggregate cargo capacity exceeding 3 million dwt.

The Vessel is fitted with a ballast water treatment system, while the special survey was recently completed by the current owner and, therefore, the Company does not anticipate incurring any significant off-hire or capital expenditures for this Vessel for the next two years.

The purchase price of $34.3 million is expected to be funded with cash on hand.

Stamatis Tsantanis, the Company’s Chairman & Chief Executive Officer, stated:

“I am very pleased to announce our 7th Japanese capesize acquisition within 2021. Our total investment since the beginning of our fleet expansion program in 2020 has reached $205 million.

The addition of the M/V Dukeship will further enhance our operating leverage as a leading pure-play Capesize company and, given the Vessel’s prompt delivery in a strong Capesize market, the acquisition is expected to be immediately accretive for our shareholders.

The spot Capesize market currently exceeds $60,000 per day, rendering the latest addition a high revenue-generating investment, while the forward curve indicates that the positive market trend will be sustained for the next years.”

Company fleet upon Vessel’s delivery:

Vessel Name Vessel Class Capacity (DWT) Year Built Yard Employment
Patriotship Capesize 181,709 2010 Imabari T/C – fixed rate
Worldship Capesize 181,415 2012 Koyo – Imabari T/C – fixed rate
Hellasship Capesize 181,325 2012 Imabari T/C Index Linked
Fellowship Capesize 179,701 2010 Daewoo T/C Index Linked
Championship Capesize 179,238 2011 Sungdong SB T/C Index Linked
Partnership Capesize 179,213 2012 Hyundai T/C Index Linked
Knightship Capesize 178,978 2010 Hyundai T/C Index Linked
Lordship Capesize 178,838 2010 Hyundai T/C Index Linked
Goodship Capesize 177,536 2005 Mitsui Voyage/Spot
Friendship Capesize 176,952 2009 Namura T/C Index Linked
Tradership Capesize 176,925 2006 Namura T/C Index Linked
Flagship Capesize 176,387 2013 Mitsui T/C Index Linked
Gloriuship Capesize 171,314 2004 Hyundai T/C Index Linked
Geniuship Capesize 170,057 2010 Sungdong SB T/C Index Linked
Premiership Capesize 170,024 2010 Sungdong SB T/C Index Linked
Squireship Capesize 170,018 2010 Sungdong SB T/C Index Linked
Dukeship* Capesize 181,453 2010 Japanese yard N/A
Total / Average age   3,011,083 11.5    
           

* delivery expected by mid-November 2021

About Seanergy Maritime Holdings Corp.

Seanergy Maritime Holdings Corp. is the only pure-play Capesize ship-owner publicly listed in the US. Seanergy provides marine dry bulk transportation services through a modern fleet of Capesize vessels. Upon delivery of the M/V Dukeship, the Company’s operating fleet will consist of 17 Capesize vessels with an average age of 11.5 years and aggregate cargo carrying capacity of approximately 3,011,083 dwt.

The Company is incorporated in the Marshall Islands and has executive offices in Glyfada, Greece. The Company’s common shares trade on the Nasdaq Capital Market under the symbol “SHIP”, its Class A warrants under “SHIPW” and its Class B warrants under “SHIPZ”.

Please visit our company website at: www.seanergymaritime.com.

Forward-Looking Statements

This press release contains forward-looking statements (as defined in Section 27A of the Securities Act of 1933, as amended, and Section 21E of the Securities Exchange Act of 1934, as amended) concerning future events. Words such as “may”, “should”, “expects”, “intends”, “plans”, “believes”, “anticipates”, “hopes”, “estimates” and variations of such words and similar expressions are intended to identify forward-looking statements. These statements involve known and unknown risks and are based upon a number of assumptions and estimates, which are inherently subject to significant uncertainties and contingencies, many of which are beyond the control of the Company. Actual results may differ materially from those expressed or implied by such forward-looking statements. Factors that could cause actual results to differ materially include, but are not limited to, the Company’s operating or financial results; the Company’s liquidity, including its ability to service its indebtedness; competitive factors in the market in which the Company operates; shipping industry trends, including charter rates, vessel values and factors affecting vessel supply and demand; future, pending or recent acquisitions and dispositions, business strategy, areas of possible expansion or contraction, and expected capital spending or operating expenses; risks associated with operations outside the United States; risks associated with the length and severity of the ongoing novel coronavirus (COVID-19) outbreak, including its effects on demand for dry bulk products and the transportation thereof; and other factors listed from time to time in the Company’s filings with the SEC, including its most recent annual report on Form 20-F. The Company’s filings can be obtained free of charge on the SEC’s website at www.sec.gov. Except to the extent required by law, the Company expressly disclaims any obligations or undertaking to release publicly any updates or revisions to any forward-looking statements contained herein to reflect any change in the Company’s expectations with respect thereto or any change in events, conditions or circumstances on which any statement is based.

For further information please contact:

Seanergy Investor Relations
Tel: +30 213 0181 522
E-mail: ir@seanergy.gr

Capital Link, Inc.
Daniela Guerrero
230 Park Avenue Suite 1536
New York, NY 10169
Tel: (212) 661-7566
E-mail: seanergy@capitallink.com

Seanergy Maritime Announces Acquisition of its 17th Capesize Vessel with Prompt Delivery and Completion of Previously-Announced Vessel Sale


Seanergy Maritime Announces Acquisition of its 17th Capesize Vessel with Prompt Delivery and Completion of Previously-Announced Vessel Sale


Seanergy Maritime Announces Acquisition of its 17th Capesize Vessel with Prompt Delivery and Completion of Previously-Announced Vessel Sale

October 19, 2021 – Glyfada, Greece – Seanergy Maritime Holdings Corp. (the “Company”) (NASDAQ: SHIP) announced today that it has entered into a definitive agreement with an unaffiliated third party to purchase a Capesize vessel (the “Vessel”). In addition, the Company has recently completed the sale and delivery of its oldest Capesize vessel, the M/V Leadership, 2001-built, to its new owners.

The Vessel was built in 2010 at a reputable shipyard in Japan, has a cargo-carrying capacity of approximately 181,500 deadweight tons (“dwt”) and will be renamed M/V Dukeship. The M/V Dukeship is expected to be delivered within November 2021, subject to the satisfaction of certain customary closing conditions. Following her delivery, Seanergy’s fleet will increase to 17 Capesize vessels with an aggregate cargo capacity exceeding 3 million dwt.

The Vessel is fitted with a ballast water treatment system, while the special survey was recently completed by the current owner and, therefore, the Company does not anticipate incurring any significant off-hire or capital expenditures for this Vessel for the next two years.

The purchase price of $34.3 million is expected to be funded with cash on hand.

Stamatis Tsantanis, the Company’s Chairman & Chief Executive Officer, stated:

“I am very pleased to announce our 7th Japanese capesize acquisition within 2021. Our total investment since the beginning of our fleet expansion program in 2020 has reached $205 million.

The addition of the M/V Dukeship will further enhance our operating leverage as a leading pure-play Capesize company and, given the Vessel’s prompt delivery in a strong Capesize market, the acquisition is expected to be immediately accretive for our shareholders.

The spot Capesize market currently exceeds $60,000 per day, rendering the latest addition a high revenue-generating investment, while the forward curve indicates that the positive market trend will be sustained for the next years.”

Company fleet upon Vessel’s delivery:

Vessel Name Vessel Class Capacity (DWT) Year Built Yard Employment
Patriotship Capesize 181,709 2010 Imabari T/C – fixed rate
Worldship Capesize 181,415 2012 Koyo – Imabari T/C – fixed rate
Hellasship Capesize 181,325 2012 Imabari T/C Index Linked
Fellowship Capesize 179,701 2010 Daewoo T/C Index Linked
Championship Capesize 179,238 2011 Sungdong SB T/C Index Linked
Partnership Capesize 179,213 2012 Hyundai T/C Index Linked
Knightship Capesize 178,978 2010 Hyundai T/C Index Linked
Lordship Capesize 178,838 2010 Hyundai T/C Index Linked
Goodship Capesize 177,536 2005 Mitsui Voyage/Spot
Friendship Capesize 176,952 2009 Namura T/C Index Linked
Tradership Capesize 176,925 2006 Namura T/C Index Linked
Flagship Capesize 176,387 2013 Mitsui T/C Index Linked
Gloriuship Capesize 171,314 2004 Hyundai T/C Index Linked
Geniuship Capesize 170,057 2010 Sungdong SB T/C Index Linked
Premiership Capesize 170,024 2010 Sungdong SB T/C Index Linked
Squireship Capesize 170,018 2010 Sungdong SB T/C Index Linked
Dukeship* Capesize 181,453 2010 Japanese yard N/A
Total / Average age   3,011,083 11.5    
           

* delivery expected by mid-November 2021

About Seanergy Maritime Holdings Corp.

Seanergy Maritime Holdings Corp. is the only pure-play Capesize ship-owner publicly listed in the US. Seanergy provides marine dry bulk transportation services through a modern fleet of Capesize vessels. Upon delivery of the M/V Dukeship, the Company’s operating fleet will consist of 17 Capesize vessels with an average age of 11.5 years and aggregate cargo carrying capacity of approximately 3,011,083 dwt.

The Company is incorporated in the Marshall Islands and has executive offices in Glyfada, Greece. The Company’s common shares trade on the Nasdaq Capital Market under the symbol “SHIP”, its Class A warrants under “SHIPW” and its Class B warrants under “SHIPZ”.

Please visit our company website at: www.seanergymaritime.com.

Forward-Looking Statements

This press release contains forward-looking statements (as defined in Section 27A of the Securities Act of 1933, as amended, and Section 21E of the Securities Exchange Act of 1934, as amended) concerning future events. Words such as “may”, “should”, “expects”, “intends”, “plans”, “believes”, “anticipates”, “hopes”, “estimates” and variations of such words and similar expressions are intended to identify forward-looking statements. These statements involve known and unknown risks and are based upon a number of assumptions and estimates, which are inherently subject to significant uncertainties and contingencies, many of which are beyond the control of the Company. Actual results may differ materially from those expressed or implied by such forward-looking statements. Factors that could cause actual results to differ materially include, but are not limited to, the Company’s operating or financial results; the Company’s liquidity, including its ability to service its indebtedness; competitive factors in the market in which the Company operates; shipping industry trends, including charter rates, vessel values and factors affecting vessel supply and demand; future, pending or recent acquisitions and dispositions, business strategy, areas of possible expansion or contraction, and expected capital spending or operating expenses; risks associated with operations outside the United States; risks associated with the length and severity of the ongoing novel coronavirus (COVID-19) outbreak, including its effects on demand for dry bulk products and the transportation thereof; and other factors listed from time to time in the Company’s filings with the SEC, including its most recent annual report on Form 20-F. The Company’s filings can be obtained free of charge on the SEC’s website at www.sec.gov. Except to the extent required by law, the Company expressly disclaims any obligations or undertaking to release publicly any updates or revisions to any forward-looking statements contained herein to reflect any change in the Company’s expectations with respect thereto or any change in events, conditions or circumstances on which any statement is based.

For further information please contact:

Seanergy Investor Relations
Tel: +30 213 0181 522
E-mail: ir@seanergy.gr

Capital Link, Inc.
Daniela Guerrero
230 Park Avenue Suite 1536
New York, NY 10169
Tel: (212) 661-7566
E-mail: seanergy@capitallink.com

Grindrod Shipping (GRIN) – Expected Solid Finish to Year Warrants Higher Target

Friday, October 15, 2021

Grindrod Shipping (GRIN)
Expected Solid Finish to Year Warrants Higher Target

Grindrod Shipping, originated in South Africa with roots dating back to 1910. The company is based in Singapore, with offices around the world including, London, Durban, Cape Town, Tokyo and Rotterdam. Its primary listing is on Nasdaq and secondary listing on the JSE.

Grindrod Shipping owns and operates a diversified fleet of owned, long-term chartered and joint-venture dry-bulk and liquid-bulk vessels across the globe.

Poe Fratt, Senior Research Analyst, Noble Capital Markets, Inc.

Refer to the full report for the price target, fundamental analysis, and rating.

    Dry bulk market thesis intact. Hard to avoid volatility, but intermediate outlook remains promising.  Dry bulk TCE rates have moved higher on firm demand plus port congestion and coal shortages. Also, the order book remains muted, and the new carbon emission regulations (EEXI) in January 2023 could trigger slow steaming that effectively lowers supply. While Chinese industry could be curtailed ahead of 2022 Winter Olympics and volatility/seasonality is possible, there is no doubt that dry bulk bulk rates have been higher than expected. Comments from last Tuesday’s Capital Link Dry Bulk Sector Panel reinforced our positive view.

    3Q2021 forward cover was high at 75%, but commercial strategy should capture higher 4Q2021 TCE rates. Increasing 2021 EBITDA estimate to $182.4 million from $158.8 million.  Our 3Q2021 EBITDA estimate increases slightly to $61.9 million based on TCE rates of $31.3k/day for Supras/Ultras and $25.9k/day for Handys. Our 4Q2021 EBITDA moves much higher to $65.2 million based on…


This Company Sponsored Research is provided by Noble Capital Markets, Inc., a FINRA and S.E.C. registered broker-dealer (B/D).

*Analyst certification and important disclosures included in the full report. NOTE: investment decisions should not be based upon the content of this research summary.  Proper due diligence is required before making any investment decision. 

Great Lakes Dredge & Dock (GLDD) – Incremental Awards of $24.6 million Announced

Friday, October 15, 2021

Great Lakes Dredge & Dock (GLDD)
Incremental Awards of $24.6 million Announced

Great Lakes Dredge & Dock Corp is a provider of dredging services in the United States. The company only’s operating segments is Dredging. Dredging involves the enhancement or preservation of navigability of waterways or the protection of shorelines through the removal or replenishment of soil, sand or rock. Its projects portfolio includes Coastal Restoration, Coastal Protection, Port expansion, and others.

Poe Fratt, Senior Research Analyst, Noble Capital Markets, Inc.

Refer to the full report for the price target, fundamental analysis, and rating.

    Final awards of $88.1 million announced, including known awards of $54.5 million and new work of $24.6 million. Four awards for $71.0 million will add to 3Q2021 backlog and the other work for $17.1 million will add to 4Q2021 backlog.  Please note that three awards were previously discussed in research notes so Oak Island Renourishment ($17.1 million) and Mobile Harbor ($7.5 million) were incremental awards.

    3Q2021 awards now total $308.0 million. Three of four announced 3Q2021 awards were known and included in previous 3Q2021 award estimate  3Q2021 backlog will include Sea Bright to Manasquan, Portsmouth Harbor, South Hutchinson Island, and Mobile Harbor project for $71.0 million. Combined with previously announced 3Q2021 awards of $237.0 million, 3Q2021 awards now total $308.0 million, or close to our previous estimate of $302.9 million. Expanded work of $7.5 million in Mobile Harbor more than offset reduction of…


This Company Sponsored Research is provided by Noble Capital Markets, Inc., a FINRA and S.E.C. registered broker-dealer (B/D).

*Analyst certification and important disclosures included in the full report. NOTE: investment decisions should not be based upon the content of this research summary.  Proper due diligence is required before making any investment decision. 

Great Lakes Dredge Dock (GLDD) – Another Large Award Out in Houston

Thursday, October 14, 2021

Great Lakes Dredge & Dock (GLDD)
Another Large Award Out in Houston

Great Lakes Dredge & Dock Corp is a provider of dredging services in the United States. The company only’s operating segments is Dredging. Dredging involves the enhancement or preservation of navigability of waterways or the protection of shorelines through the removal or replenishment of soil, sand or rock. Its projects portfolio includes Coastal Restoration, Coastal Protection, Port expansion, and others.

Poe Fratt, Senior Research Analyst, Noble Capital Markets, Inc.

Refer to the full report for the price target, fundamental analysis, and rating.

    Large Houston award to be final shortly. On Tuesday, the Port Commission of the Port of Houston Authority held a special meeting and awarded the first dredging contract of up to $95.4 million for Project 11, a multi-billion dollar expansion and deepening of the Houston Ship Channel. The work involves dredging 11.5 miles of the 52-mile channel and widening a major portion of the Galveston Bay reach. The base award and value of the options were not disclosed and a press release will be out once the award is finalized. If not finalized by the quarterly call, the pending award will be added to the low bids pending award total.

    Another low bid was out last week.  GLDD was low bidder at $29.4 million when bids on South Atlantic Regional Harbor Dredging (W912PM21B0008) were opened last week. As described in our last research report, the project, which includes work at five harbors along the east coast, is attractive since it fits environmental windows and hopper dredge availability …


This Company Sponsored Research is provided by Noble Capital Markets, Inc., a FINRA and S.E.C. registered broker-dealer (B/D).

*Analyst certification and important disclosures included in the full report. NOTE: investment decisions should not be based upon the content of this research summary.  Proper due diligence is required before making any investment decision. 

Great Lakes Dredge & Dock (GLDD) – Another Large Award Out in Houston

Thursday, October 14, 2021

Great Lakes Dredge & Dock (GLDD)
Another Large Award Out in Houston

Great Lakes Dredge & Dock Corp is a provider of dredging services in the United States. The company only’s operating segments is Dredging. Dredging involves the enhancement or preservation of navigability of waterways or the protection of shorelines through the removal or replenishment of soil, sand or rock. Its projects portfolio includes Coastal Restoration, Coastal Protection, Port expansion, and others.

Poe Fratt, Senior Research Analyst, Noble Capital Markets, Inc.

Refer to the full report for the price target, fundamental analysis, and rating.

    Large Houston award to be final shortly. On Tuesday, the Port Commission of the Port of Houston Authority held a special meeting and awarded the first dredging contract of up to $95.4 million for Project 11, a multi-billion dollar expansion and deepening of the Houston Ship Channel. The work involves dredging 11.5 miles of the 52-mile channel and widening a major portion of the Galveston Bay reach. The base award and value of the options were not disclosed and a press release will be out once the award is finalized. If not finalized by the quarterly call, the pending award will be added to the low bids pending award total.

    Another low bid was out last week.  GLDD was low bidder at $29.4 million when bids on South Atlantic Regional Harbor Dredging (W912PM21B0008) were opened last week. As described in our last research report, the project, which includes work at five harbors along the east coast, is attractive since it fits environmental windows and hopper dredge availability …


This Company Sponsored Research is provided by Noble Capital Markets, Inc., a FINRA and S.E.C. registered broker-dealer (B/D).

*Analyst certification and important disclosures included in the full report. NOTE: investment decisions should not be based upon the content of this research summary.  Proper due diligence is required before making any investment decision.