Seanergy Maritime Announces Refinancing of Existing Vessel Resulting in Significant Cashflow and P&L Benefit
Research, News, and Market Data on Seanergy Maritime
December 16, 2021 – Glyfada, Greece – Seanergy Maritime Holdings Corp. (the “Company”) (NASDAQ: SHIP) announced today that it has entered into a definitive agreement for the refinancing of a loan facility secured by M/V Geniuship, with a new loan facility secured by the same vessel.
The current outstanding balance is provided by certain nominees of Entrust Global and stands at $14.6 million. The Entrust facility has a remaining duration of 3.5 years, bears interest at a fixed rate of 10.5% per annum and amortizes through quarterly instalments of $515,000.
The new loan facility will be provided by a prominent Far Eastern bank (the ‘New Facility’), has an initial balance of $15 million, a five-year term and bears interest of LIBOR + 3.5% per annum. The New Facility will amortize through 4 quarterly instalments of $530,000 followed by 16 quarterly instalments of $385,000.
The significantly lower interest rate, as well as the reduced quarterly repayments agreed for 2023 onwards, will further improve the break-even rates of the underlying vessel. In addition, the interest savings for the Company are expected to be $0.9 million for 2022 and $0.5 million on average per year for 2023-25.
As of the date of this release and pro-forma for this refinancing, which is expected to close within December, Seanergy’s total indebtedness will be approximately $242.7 million, consisting of $221.0 million debt and other financial leases and $21.7 million in unsecured convertible notes, while total cash and cash equivalents, restricted cash and term deposits of the Company are expected to be approximately $45.0 million.
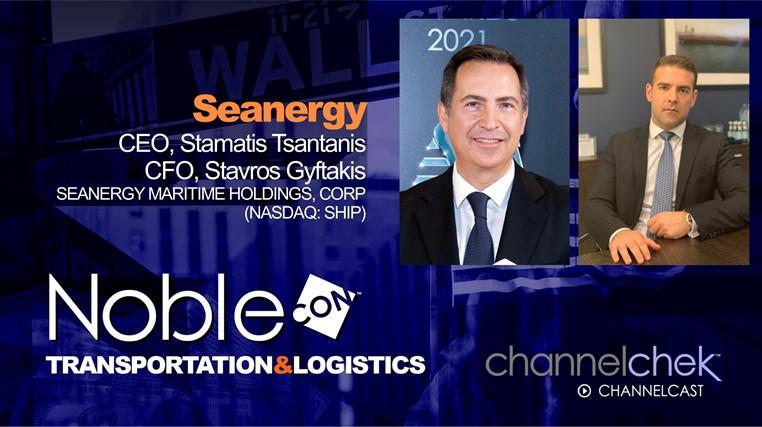
Stamatis Tsantanis, the Company’s Chairman & Chief Executive Officer, stated:
“As part of our continuous efforts to further improve our strong cashflow, we have agreed another successful refinancing for an existing capesize vessel. The New Facility has a considerably lower interest rate, which will benefit immediately the Company’s cash flow and profitability. The total expected interest savings for Seanergy will be approximately $2.3 million over the next 3 years. Consistent with our conservative approach on leverage, we aim in achieving more competitive pricing and overall terms of the loan without increasing the debt on the vessel.
“We remain committed to our strategy to further reduce our financing cost by additional refinancings and buybacks or repayment of debt that are expected to generate improved shareholder returns.”
About Seanergy Maritime Holdings Corp.
Seanergy Maritime Holdings Corp. is the only pure-play Capesize ship-owner publicly listed in the US. Seanergy provides marine dry bulk transportation services through a modern fleet of Capesize vessels. The Company’s operating fleet consists of 17 Capesize vessels with an average age of 11.7 years and aggregate cargo carrying capacity of approximately 3,011,083 dwt.
The Company is incorporated in the Marshall Islands and has executive offices in Glyfada, Greece. The Company’s common shares trade on the Nasdaq Capital Market under the symbol “SHIP” and its Class B warrants under “SHIPZ”.
Please visit our company website at: www.seanergymaritime.com.
Forward-Looking Statements
This press release contains forward-looking statements (as defined in Section 27A of the Securities Act of 1933, as amended, and Section 21E of the Securities Exchange Act of 1934, as amended) concerning future events. Words such as “may”, “should”, “expects”, “intends”, “plans”, “believes”, “anticipates”, “hopes”, “estimates” and variations of such words and similar expressions are intended to identify forward-looking statements. These statements involve known and unknown risks and are based upon a number of assumptions and estimates, which are inherently subject to significant uncertainties and contingencies, many of which are beyond the control of the Company. Actual results may differ materially from those expressed or implied by such forward-looking statements. Factors that could cause actual results to differ materially include, but are not limited to, the Company’s operating or financial results; the Company’s liquidity, including its ability to service its indebtedness; competitive factors in the market in which the Company operates; shipping industry trends, including charter rates, vessel values and factors affecting vessel supply and demand; future, pending or recent acquisitions and dispositions, business strategy, areas of possible expansion or contraction, and expected capital spending or operating expenses; risks associated with operations outside the United States; risks associated with the length and severity of the ongoing novel coronavirus (COVID-19) outbreak, including its effects on demand for dry bulk products and the transportation thereof; and other factors listed from time to time in the Company’s filings with the SEC, including its most recent annual report on Form 20-F. The Company’s filings can be obtained free of charge on the SEC’s website at www.sec.gov. Except to the extent required by law, the Company expressly disclaims any obligations or undertaking to release publicly any updates or revisions to any forward-looking statements contained herein to reflect any change in the Company’s expectations with respect thereto or any change in events, conditions or circumstances on which any statement is based.
For further information please contact:
Seanergy Investor Relations
Tel: +30 213 0181 522
E-mail: [email protected]
Capital Link, Inc.
Paul Lampoutis
230 Park Avenue Suite 1536
New York, NY 10169
Tel: (212) 661-7566
E-mail: [email protected]