Orion Group Holdings (ORN) – Fine Tuning 2022 EBITDA – Soft 1H2022, But 2H2022 Recovery

Wednesday, March 16, 2022

Orion Group Holdings (ORN)
Fine Tuning 2022 EBITDA – Soft 1H2022, But 2H2022 Recovery

Orion Group Holdings, based in Houston, Texas, is a specialty construction company within the Marine and Industrial Construction sectors, with operations focused in the continental United States and Caribbean. Revenue is split roughly 50/50 between a Marine Construction segment that provides marine facility, pipeline and structural construction services and a Commercial Concrete segment that provides turnkey concrete services in the light commercial and structural construction markets.

Poe Fratt, Senior Research Analyst, Logistics, Noble Capital Markets, Inc.

Refer to the full report for the price target, fundamental analysis, and rating.

    Fine tuning 2022 EBITDA estimate to $33.0 million, in line with current guidance. Incorporating the EBITDA guidance in the mid-$30 million range and details from the 10-K, we are moving our 2022 EBITDA estimate to $33.0 million and shifting the quarterly numbers to reflect the combo of a softer 1H2022 and a 2H2022 recovery.

    Estimate is based on Marine EBITDA of $32.5 million and Concrete EBITDA of $0.5 million.  While the recovery in Marine appears underway based on better 4Q2021 results, the outlook for Concrete is less clear and we scaled back our expectations. Please see our March 3rd research note for a more detailed discussion about 4Q2021 operating results and backlog changes …


This Company Sponsored Research is provided by Noble Capital Markets, Inc., a FINRA and S.E.C. registered broker-dealer (B/D).

*Analyst certification and important disclosures included in the full report. NOTE: investment decisions should not be based upon the content of this research summary. Proper due diligence is required before making any investment decision. 

Seanergy Maritime (SHIP) – Dividend Surprise and 2022 Looking Good

Friday, March 11, 2022

Seanergy Maritime (SHIP)
Dividend Surprise and 2022 Looking Good

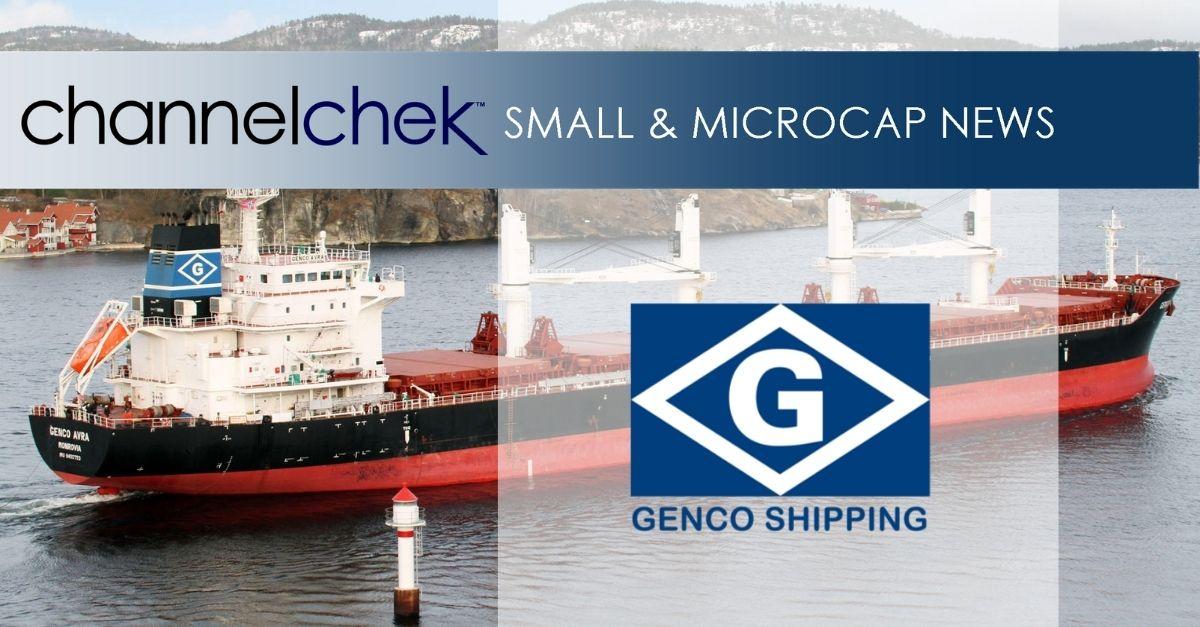
Seanergy Maritime Holdings Corp. is the only pure-play Capesize shipping company listed in the US capital markets. Seanergy provides marine dry bulk transportation services through a modern fleet of Capesize vessels. Upon delivery of the M/V Dukeship, the Company’s operating fleet will consist of 17 Capesize vessels with an average age of 11.5 years and aggregate cargo carrying capacity of approximately 3,011,083 dwt. The Company is incorporated in the Marshall Islands and has executive offices in Glyfada, Greece. The Company’s common shares trade on the Nasdaq Capital Market under the symbol “SHIP”, its Class A warrants under “SHIPW” and its Class B warrants under “SHIPZ”.

Poe Fratt, Senior Research Analyst, Logistics, Noble Capital Markets, Inc.

Refer to the full report for the price target, fundamental analysis, and rating.

    Record 4Q2021 EBITDA in line with expectations. Adjusted EBITDA of $38.8 million was in line with our estimate of $38.7 million. TCE rates of $36.6k/day were higher than expected and ownership days of 1,508 were in line, but opex and G&A expenses were higher than expected.

    Fine tuning 2022 EBITDA estimates to reflect updated forward cover and current market conditions.  We are bumping our 2022 EBITDA estimate to $110.6 million, up from $101.9 million, based on TCE rates of $27.0k/day, up from $24.9k/day. 1Q2022 forward cover increased to 90% of available days booked at $19.8k/day. While 1Q2022 EBITDA will drop sequentially due to seasonality, we expect with a 2Q2022 …


This research is provided by Noble Capital Markets, Inc., a FINRA and S.E.C. registered broker-dealer (B/D).

*Analyst certification and important disclosures included in the full report. NOTE: investment decisions should not be based upon the content of this research summary. Proper due diligence is required before making any investment decision. 

Seanergy Maritime Holdings Corp. Reports Record Fourth Quarter 2021 Financial Results


Seanergy Maritime Holdings Corp. Reports Record Fourth Quarter 2021 Financial Results and Declares Dividend of $0.05 Per Share

Research, News, and Market Data on Seanergy Maritime


Initiates Quarterly Dividend, Declares Special Dividend &
Completes New Buyback of Convertibles totalling $10 million in 2022

Highlights of the Fourth Quarter of 2021:

  • EPS basic: $0.12 and Adjusted EPS1 basic: $0.16 in Q4 2021

  • EPS diluted: $0.11 and Adjusted EPS1 diluted: $0.14 in Q4 2021

  • Net revenues: $56.7 million in Q4 2021, as compared to $21.3 million in Q4 2020, up 166%

  • Net Income: $20.6 million in Q4 2021, as compared to net loss of $2.3 million in Q4 2020

  • Adjusted Net Income1: $27.9 million in Q4 2021, as compared to an adjusted net loss of $2.3 million in Q4 2020

  • EBITDA1: $31.5 million in Q4 2021, as compared to $8.3 million in Q4 2020, up 280%

  • Adjusted EBITDA1: $38.8 million in Q4 2021, as compared to $8.3 million in Q4 2020, up 367%

Highlights of Full Year 2021:

  • EPS basic: $0.27 and Adjusted EPS1 basic: $0.35 in Q4 2021

  • EPS diluted: $0.25 and Adjusted EPS1 diluted: $0.28 in Q4 2021

  • Net revenues: $153.1 million in 2021, as compared to $63.3 million in 2020, up 142%

  • Net Income: $41.3 million in 2021, as compared to a net loss of $18.4 million in 2020

  • Adjusted Net Income1: $53.3 million in 2021, as compared to an adjusted net loss of $22.6 million in 2020

  • EBITDA1: $78.9 million in 2021, as compared to $19.9 million in 2020, up 296%

  • Adjusted EBITDA1: $90.1 million in 2021, as compared to $15.6 million in 2020, up 478%

  • Shareholders’ equity of $244.5 million on December 31, 2021, compared to $95.7 million on December 31, 2020

$35.6 million in Dividends and Recent Repurchases:

  • Initiates a regular quarterly dividend and declares dividend of $0.025 per share for the fourth quarter of 2021

  • Declares a special dividend of $0.025 per share for the fourth quarter of 2021

  • Quarterly and special dividend payable on or about April 5, 2022 to all shareholders of record as of March 25, 2022

  • Additional buyback of $5.0 million of the outstanding convertible note increasing total buybacks to $26.7 million in the past 4 months

Additional highlights:

  • Delivery of 7 Japanese Capesize bulkers in 2021 increasing the fleet by 55%

  • Financing and refinancing transactions of $170.5 million, with improved pricing and overall loan terms

  • Entire fleet under time-charter agreements with first-class charterers, 15 vessels on index-linked rates

GLYFADA, Greece, March 10, 2022 (GLOBE NEWSWIRE) — Seanergy Maritime Holdings Corp. (the “Company”) (NASDAQ: SHIP), announced today its financial results for the fourth quarter and twelve months ended December 31, 2021. The Company also announced $5 million additional repurchases of its outstanding 5.5% convertible note and declared a quarterly dividend of $0.025 per share and a special dividend of $0.025 per share.

For the quarter ended December 31, 2021, the Company generated net revenues of $56.7 million, a 166% increase compared to the fourth quarter of 2020. Adjusted EBITDA for the quarter was $38.8 million, from $8.3 million in the same period of 2020. Adjusted net income for the quarter was $27.9 million, compared to net loss of $2.3 million in the fourth quarter of 2020. The daily Time Charter Equivalent rate (“TCE rate”)2 of the fleet for the fourth quarter of 2021 was $36,642, marking a 122% increase compared to $16,511 for the same period of 2020.

For the twelve-month period ended December 31, 2021, net revenues were $153.1 million, increased by 142% when compared to $63.3 million in the same period of 2020. Adjusted EBITDA for the twelve months of 2021 was $90.1 million, compared to an adjusted EBITDA of $15.6 million in the same period of 2020. The daily TCE of the fleet for the twelve months of 2021 was $27,399 compared to $11,950 in the twelve months of 2020. The average daily OPEX was $6,211, compared to $5,709 in the respective period of 2020.

Cash and cash-equivalents, restricted cash, term deposits, as of December 31, 2021, stood at $47.1 million, compared to $23.7 million as of December 31, 2020. Shareholders’ equity at the end of the fourth quarter was $244.5 million, compared to $95.7 million on December 31, 2020. Long-term debt (senior and junior loans and other financial liabilities) net of deferred charges stood at $215.2 million as of December 31, 2021, increased from $169.8 million as of the end of 2020. In the same period, the book value of our fleet increased by 66% to $426.1 million from $256.7 million.

______________
1 Adjusted EPS, Adjusted Net Income, EBITDA and Adjusted EBITDA are non-GAAP measures. Please see the reconciliation below of Adjusted EPS, Adjusted Net Income, EBITDA and adjusted EBITDA to net income the most directly comparable U.S. GAAP measure.
2 TCE rate is a non-GAAP measure. Please see the reconciliation below of TCE rate to net revenues from vessels, the most directly comparable U.S. GAAP measure.

Stamatis Tsantanis, the Company’s Chairman & Chief Executive Officer, stated:

“Seanergy reported its strongest operational year in 2021, earning an adjusted net income of $53.3 million, an adjusted EBITDA of $90.1 million on net revenue of $153.1 million. In Q4 2021, our fleet TCE was $36,642 and our estimated TCE for the first quarter of 2022 is $19,475. Despite the seasonal softening experienced in the first months of 2022, for which we were proactively hedged, the market is already trending higher.

“Consistent with our stated intention to return capital to our shareholders, our board of directors has initiated a regular quarterly dividend of $0.025 per share for the fourth quarter of 2021. In addition, based on the strong financial performance of Q4 2021 we are also declaring a special dividend of $0.025 per share. As a result, the Company will be paying a dividend of $0.05 per share for the fourth quarter of 2021 to all shareholders of record as of March 25, 2022. The fourth quarter dividend of $8.9 million and the $26.7 million in buybacks of convertible notes, warrants and common shares represent an aggregate of $35.6 million in shareholder-rewarding initiatives that Seanergy’s board of directors undertook over the last 4 months. While the amount and timing of any future dividend payments remains subject to the discretion of our board of directors and will be based on our results, investment opportunities and overall market conditions, we remain committed to continue distributing a significant portion of our earnings to our shareholders.

“In 2021 we successfully executed a substantial fleet growth program. Despite the Covid-related hindrance we took delivery of seven high-quality Japanese Capesize vessels, reducing the average age of our fleet. Investment in vessel acquisitions in 2021 totalled approximately $193.2 million.

“Moreover, we have entered into eleven new time-charter agreements with leading charterers in the Capesize sector and all our fleet operates under period employment agreements. We strongly believe this to be the optimal commercial positioning of our fleet.

“On the buyback front, since the fourth quarter of 2021, we have completed a total of $21.7 million in buybacks of convertible notes, warrants and common shares, while an additional prepayment of $5.0 million of convertible note, was effected on March 10, 2022. The ultimate effect of our buyback program will be the prevention of potential dilution by 25.95 million shares. This reflects our firm belief that our share price continues to be significantly undervalued. As previously announced, in 2021 I continued my open-market purchases of Seanergy’s shares, which indicates my strong confidence in the Company.

“New financings and refinancings since the beginning of 2021 total $170.5 million. All transactions concluded in 2021 and to date underscore our stated intention to optimize the capital structure and further reduce our financing expense. In the fourth quarter of 2021 and in the first quarter to-date, we have concluded three new financings of approximately $53.15 million. The new financings include our first sustainability-linked loan in Greece, as well as two transactions with prominent lenders in Taiwan and Japan, strengthening Seanergy’s footing in the Asian ship-financing market. In the same period, we prepaid $50.6 million of our existing financings, including legacy high-coupon facilities, all junior loans and a large part of the convertible notes. The weighted average interest rate across our indebtedness has seen a significantly year-over-year reduction of 128 basis points.

“Regarding our ESG initiatives, we primarily continue to execute on the installation of Energy Saving Devices (“ESDs”) on vessels undergoing scheduled dry-docking. In most cases the selection of the ESDs is done in cooperation with the underlying charterers, following agreement to adjust the index-linked rate to reflect the improved performance of the vessels. At the same time, we have completed biofuel trials in cooperation with two of our closest charterers. The Company’s first ESG report, analyzing material actions that Seanergy has successfully completed to date, as well as the targets set going forward, will be released within 2022.

“Over the past months we have successfully executed on a number of strategic initiatives, which have resulted in Seanergy’s transformation into one of the leading Capesize players in the U.S. capital markets.

“Our outlook for the Capesize market is very positive based on the strong supply-demand fundamentals. Firstly, the record low orderbook coupled with the upcoming environmental regulations, will significantly limit vessel supply. Secondly, the global energy supply shortages, as well as the worldwide stimuli and infrastructure projects will strongly support demand for dry bulk shipping. Given Seanergy’s significant operating leverage, we are well positioned to capitalise on the favourable dynamics of our sector.”

Company Fleet:

Vessel Name

Vessel Class

Capacity (DWT)

Year Built

Yard

Scrubber Fitted

Employment Type

FFA
conversion
option
(18)

Earliest
T/C
expiration

Patriotship

Capesize

181,709

2010

Imabari

Yes

T/C – fixed rate(1)

06/2022

Worldship

Capesize

181,415

2012

Koyo – Imabari

Yes

T/C – fixed rate(2)

09/2022

Hellasship

Capesize

181,325

2012

Imabari

T/C Index Linked(3)

04/2022

Fellowship

Capesize

179,701

2010

Daewoo

T/C Index Linked(4)

Yes

06/2022

Championship

Capesize

179,238

2011

Sungdong SB

Yes

T/C Index Linked(5)

Yes

11/2023

Partnership

Capesize

179,213

2012

Hyundai

Yes

T/C Index Linked(6)

Yes

06/2022

Knightship

Capesize

178,978

2010

Hyundai

Yes

T/C Index Linked(7)

05/2023

Lordship

Capesize

178,838

2010

Hyundai

Yes

T/C Index Linked(8)

Yes

05/2022

Goodship

Capesize

177,536

2005

Mitsui

T/C Index Linked(9)

Yes

08/2022

Friendship

Capesize

176,952

2009

Namura

T/C Index Linked(10)

12/2022

Tradership

Capesize

176,925

2006

Namura

T/C Index Linked(11)

Yes

05/2022

Flagship

Capesize

176,387

2013

Mitsui

T/C Index Linked(12)

Yes

05/2026

Gloriuship

Capesize

171,314

2004

Hyundai

T/C Index Linked(13)

Yes

12/2022

Geniuship

Capesize

170,057

2010

Sungdong SB

T/C Index Linked(14)

Yes

01/2023

Premiership

Capesize

170,024

2010

Sungdong SB

Yes

T/C Index Linked(15)

11/2022

Squireship

Capesize

170,018

2010

Sungdong SB

Yes

T/C Index Linked(16)

12/2022

Dukeship

Capesize

181,453

2010

Sasebo

T/C Index Linked(17)

Yes

12/2022

Total / Average age

3,011,083

12

(1)

Chartered by a European cargo operator and delivered to the charterer on June 7, 2021 for a period of about 12 to about 18 months. The daily charter hire is fixed at $31,000.

(2)

Chartered by a U.S. commodity trading company and delivered to the charterer on September 2, 2021 for a period of about 12 to about 16 months. The daily charter hire is fixed at $31,750.

(3)

Chartered by NYK and delivered to the charterer on May 10, 2021 for a period of minimum 11 to maximum 15 months. The daily charter hire is based on the BCI.

(4)

Chartered by Anglo American, a leading global mining company, and delivered to the charterer on June 18, 2021 for a period of minimum 12 to about 15 months. The daily charter hire is based on the BCI.

(5)

Chartered by Cargill and delivered to the charterer on November 7, 2018 for a period of employment of 60 months, with an additional period of about 16 to about 18 months. The daily charter hire is based on the BCI plus a net daily scrubber premium of $1,740.

(6)

Chartered by a major European utility and energy company and delivered to the charterer on September 11, 2019 for a period of minimum 33 to maximum 37 months with two optional periods of about 11 to maximum 13 months. The daily charter hire is based on the BCI.

(7)

Chartered by Glencore and delivered to the charterer on May 15, 2020 for a period of about 36 to about 42 months with two optional periods of 11 to 13 months. The daily charter hire is based on the BCI.

(8)

Chartered by a major European utility and energy company and delivered on August 4, 2019 for a period of minimum 33 to maximum 37 months with an optional period of about 11 to maximum 13 months. The daily charter hire is based on the BCI.

(9)

Chartered by an international commodities trader and delivered to the charterer on November 12, 2021 for a period of about 9 to about 12 months. The daily charter hire is based on the BCI.

(10)

Chartered by NYK and delivered to the charterer on July 29, 2021 for a period of minimum 17 to maximum 24 months. The daily charter hire is based on the BCI.

(11)

Chartered by a major South Korean industrial company and delivered to the charterer on June 15, 2021 for a period employment of minimum 11 to about 15 months. The daily charter hire is based on the BCI.

(12)

Chartered by Cargill. The vessel was delivered to the charterer on May 10, 2021 for a period of 60 months. The daily charter hire is based at a premium over the BCI minus $1,325 per day.

(13)

Chartered by Pacbulk Shipping and delivered to the charterer on April 23, 2020 for a period of about 11 to about 15 months. In December 2021, the T/C was further extended until minimum December 16, 2022, up to maximum April 15, 2023. The daily charter hire is based on the BCI.

(14)

Chartered by NYK and delivered to the charterer on February 5, 2022 for a period of about 11 to about 15. The daily charter hire is based on the BCI.

(15)

Chartered by Glencore and delivered to the charterer on November 29, 2019 for a period of minimum 36 to maximum 42 months with two optional periods of minimum 11 to maximum 13 months. The daily charter hire is based on the BCI plus a net daily scrubber premium of $2,055.

(16)

Chartered by Glencore and delivered to the charterer on December 19, 2019 for a period of minimum 36 to maximum 42 months with two optional periods of minimum 11 to maximum 13 months. The daily charter hire is based on the BCI plus a net daily scrubber premium of $2,055.

(17)

Chartered by NYK and delivered to the charterer on December 1, 2021 for a period of about 13 to about 18 months. The daily charter hire is based on the BCI.

(18)

The Company has the option to convert the index-linked rate to a fixed one for a period ranging between 2 and 12 months, based on the prevailing Capesize FFA Rate for the selected period.

Fleet Data:

(U.S. Dollars in thousands)

Q4 2021

Q4 2020

FY 2021

FY 2020

Ownership days (1)

1,508

1,012

5,140

3,807

Operating days (2)

1,493

1,010

4,987

3,747

Fleet utilization (3)

99.0

%

99.8

%

97.0

%

98.4

%

TCE rate (4)

$

36,642

$

16,511

$

27,399

$

11,950

Daily Vessel Operating Expenses (5)

$

7,184

$

6,087

$

6,211

$

5,709

(1)

Ownership days are the total number of calendar days in a period during which the vessels in a fleet have been owned or chartered in. Ownership days are an indicator of the size of the Company’s fleet over a period and affect both the amount of revenues and the amount of expenses that the Company recorded during a period.

(2)

Operating days are the number of available days in a period less the aggregate number of days that the vessels are off-hire due to unforeseen circumstances. Operating days includes the days that our vessels are in ballast voyages without having finalized agreements for their next employment.

(3)

Fleet utilization is the percentage of time that the vessels are generating revenue and is determined by dividing operating days by ownership days for the relevant period.

(4)

TCE rate is defined as the Company’s net revenue less voyage expenses during a period divided by the number of the Company’s operating days during the period. Voyage expenses include port charges, bunker (fuel oil and diesel oil) expenses, canal charges and other commissions. The Company includes the TCE rate, a non-GAAP measure, as it believes it provides additional meaningful information in conjunction with net revenues from vessels, the most directly comparable U.S. GAAP measure, and because it assists the Company’s management in making decisions regarding the deployment and use of the Company’s vessels and in evaluating their financial performance. The Company’s calculation of TCE rate may not be comparable to that reported by other companies. The following table reconciles the Company’s net revenues from vessels to the TCE rate.

(In thousands of U.S. Dollars, except operating days and TCE rate)

Q4 2021

Q4 2020

FY 2021

FY 2020

Net revenues from vessels

56,699

21,313

153,108

63,345

Less: Voyage expenses

1,992

4,637

16,469

18,567

Net operating revenues

54,707

16,676

136,639

44,778

Operating days

1,493

1,010

4,987

3,747

TCE rate

$

36,642

$

16,511

$

27,399

$

11,950

(5)

Vessel operating expenses include crew costs, provisions, deck and engine stores, lubricants, insurance, maintenance and repairs. Daily Vessel Operating Expenses are calculated by dividing vessel operating expenses by ownership days for the relevant time periods. The Company’s calculation of daily vessel operating expenses may not be comparable to that reported by other companies. The following table reconciles the Company’s vessel operating expenses to daily vessel operating expenses.

(In thousands of U.S. Dollars, except ownership days and Daily Vessel Operating Expenses)

Q4 2021

Q4 2020

FY 2021

FY 2020

Vessel operating expenses

11,862

6,206

36,332

22,347

Less: Pre-delivery expenses

1,029

46

4,410

611

Vessel operating expenses before pre-delivery expenses

10,833

6,160

31,922

21,736

Ownership days

1,508

1,012

5,140

3,807

Daily Vessel Operating Expenses

$

7,184

$

6,087

$

6,211

$

5,709

Net Income / (Loss) to EBITDA and Adjusted EBITDA Reconciliation:

(In thousands of U.S. Dollars)

Q4 2021

Q4 2020

FY 2021

FY 2020

Net income/(loss)

20,644

(2,319

)

41,348

(18,356

)

Add: Net interest and finance cost

4,751

6,677

17,618

23,217

Add: Depreciation and amortization

6,117

3,897

19,944

15,040

EBITDA

31,512

8,255

78,910

19,901

Add: Stock based compensation

393

44

5,097

869

Less: Loss/(gain) on sale of vessel

19

(697

)

Add: Loss on extinguishment of debt

6,863

6,863

Less: Loss/(gain) on debt refinancing

6

(5,144

)

Less: Gain on forward freight agreements, net

(24

)

(24

)

Adjusted EBITDA

38,763

8,305

90,149

15,626

Earnings Before Interest, Taxes, Depreciation and Amortization (“EBITDA”) represents the sum of net income / (loss), interest and finance costs, interest income, depreciation and amortization and, if any, income taxes during a period. EBITDA is not a recognized measurement under U.S. GAAP. Adjusted EBITDA represents EBITDA adjusted to exclude stock-based compensation, the non-recurring gain on sale of vessel and gain on debt refinancing and gain on forward freight agreements, net, which the Company believes are not indicative of the ongoing performance of its core operations.

EBITDA and adjusted EBITDA are presented as we believe that these measures are useful to investors as a widely used means of evaluating operating profitability. EBITDA and adjusted EBITDA as presented here may not be comparable to similarly titled measures presented by other companies. These non-GAAP measures should not be considered in isolation from, as a substitute for, or superior to, financial measures prepared in accordance with U.S. GAAP.


Net Income/(Loss) and Adjusted Net income/(Loss) Reconciliation and calculation of Adjusted Earnings/(Loss) Per Share

(In thousands of U.S. Dollars)

Q4 2021

Q4 2020

FY 2021

FY 2020

Net income/(loss)

20,644

(2,319

)

41,348

(18,356

)

Add: Stock based compensation

393

44

5,097

869

Add: Loss on extinguishment of debt

6,863

6,863

Less: Loss/(gain) on debt refinancing

6

(5,144

)

Adjusted net income/(loss)

27,900

(2,269

)

53,308

(22,631

)

Adjusted net income/(loss) per common share, basic

0.16

(0.03

)

0.35

(0.68

)

Weighted average number of common shares outstanding, basic

170,884,012

67,904,450

153,321,907

33,436,278

Adjusted net income/(loss) per common share, diluted

0.14

(0.03

)

0.28

(0.68

)

Weighted average number of common shares outstanding, diluted

205,228,391

67,904,450

191,337,521

33,436,278

To derive Adjusted Net Income/(Loss) and Adjusted Earnings/(Loss) Per Share from Net Income/(Loss), we exclude non-cash items, as provided in the table above. We believe that Adjusted Net Income/(Loss) and Adjusted Earnings/(Loss) Per Share assist our management and investors by increasing the comparability of our performance from period to period since each such measure eliminates the effects of such non-cash items as gain/(loss) on extinguishment of debt and other items which may vary from year to year, for reasons unrelated to overall operating performance. In addition, we believe that the presentation of the respective measure provides investors with supplemental data relating to our results of operations, and therefore, with a more complete understanding of factors affecting our business than with GAAP measures alone. Our method of computing Adjusted Net Income/(Loss) and Adjusted Earnings/(Loss) Per Share may not necessarily be comparable to other similarly titled captions of other companies due to differences in methods of calculation.


Interest and Finance Costs to Cash Interest and Finance Costs Reconciliation:

(In thousands of U.S. Dollars)

Q4 2021

Q4 2020

FY 2021

FY 2020

Interest and finance costs, net

(4,751

)

(6,677

)

(17,618

)

(23,217

)

Add: Amortization of deferred finance charges

892

219

3,333

757

Add: Amortization of convertible note beneficial conversion feature

878

1,645

2,887

5,518

Add: Amortization of other deferred charges (shares issued to third party)

75

120

326

550

Add: Fair value of units – related party (one-off expenses relating to financial restructuring)

596

596

Cash interest and finance costs

(2,906

)

(4,097

)

(11,072

)

(15,796

)

Add: Restructuring expenses

(25

)

1,012

22

1,012

Cash interest and finance costs, net of restructuring expenses

(2,931

)

(3,085

)

(11,050

)

(14,784

)


First Quarter 2022 TCE Guidance:

As of the date hereof, approximately 90% of the Company fleet’s expected operating days in the first quarter of 2022 have been fixed at an estimated TCE of approximately $19,844. Assuming that for the remaining operating days of our index-linked T/Cs, the respective vessels’ TCE will be equal to the average Forward Freight Agreement (“FFA”) rate of approximately $17,500 per day (based on the FFA curve of March 3, 2022), our estimated TCE for the first quarter of 2022 will be approximately $19,4753. Our TCE guidance for the first quarter of 2022 includes certain conversions (5 vessels) of index-linked charters to fixed, which were concluded in the third and fourth quarter of 2021 as part of our freight hedging strategy. The following table provides the break-down:

Operating Days

TCE

TCE – fixed rate (index-linked conversion)

244

$26,512

TCE – fixed rate

269

$28,764

TCE – index linked unhedged

964

$15,209

Total / Average

1,477

$19,475


Fourth Quarter and Recent Developments:

Buybacks of Convertible Notes, Warrants and Common Shares

(A) $17 million Repurchase Plan of August 10, 2021: Completed in December 2021 through the following transactions:

(i) Buyback of two outstanding convertible notes with 5.5% coupon and a conversion price of $1.20 per share (the “Notes”) at face value of $13.95 million;

(ii) Buyback of warrants to purchase 4.3 million common shares at an exercise price of $0.70 held by the holder of the Notes for $1.02 million; and

(iii) Buyback of 1.7 million common shares for $1.69 million

(B) $10 million Repurchase Plan of December 7, 2021:

(i) Buyback of $5 million of the remaining convertible note in January 2022; and

(ii) Buyback of additional $5 million of the remaining convertible Note, on March 10, 2022

______________
3
 This guidance is based on certain assumptions and there can be no assurance that these TCE estimates, or projected utilization will be realized. TCE estimates include certain floating (index) to fixed rate conversions concluded in previous periods. For vessels on index-linked T/Cs, the TCE realized will vary with the underlying index, and for the purposes of this guidance, the TCE assumed for the remaining operating days of the quarter for an index-linked T/C is equal to the average FFA rate of $17,500 per day (FFA curve of March 3, 2022). Spot estimates are provided using the load-to-discharge method of accounting. Load-to-discharge accounting recognizes revenues over fewer days as opposed to the discharge-to-discharge method of accounting used prior to 2018, resulting in higher rates for these days and only voyage expenses being recorded in the ballast days. Over the duration of the voyage (discharge-to-discharge) there is no difference in the total revenues and costs to be recognized. The rates quoted are for days currently contracted. Increased ballast days at the end of the quarter will reduce the additional revenues that can be booked based on the accounting cut-offs and therefore the resulting TCE will be reduced accordingly.

Moreover, Seanergy’s Chairman & CEO, purchased in 2021 an additional 300,000 of the Company’s common shares in the open market.

Fleet Update

M/V Dukeship

In December 2021, the Company announced the delivery of the M/V Dukeship, a 181,453 dwt Capesize bulk carrier, built in 2010 in Japan. At the same time, M/V Dukeship commenced its time charter (“T/C”) employment with NYK, a leading Japanese charterer. The purchase price of $34.3 million was funded with cash on hand.

Commercial Updates

M/V Geniuship

The M/V Geniuship has been delivered to NYK on February 5, 2022 for a period of about 11 to about 15 months. The daily charter hire is based on the BCI. In addition, the Company has the option to convert the index-linked rate to a fixed rate based on the prevailing Capesize FFA for the selected period.

M/V Gloriuship

The M/V Gloriuship has been chartered by Pacbulk since April, 2020. In December 2021 the charterer extended the T/C until minimum December 16, 2022, up to maximum April 15, 2023, in charterer’s option.

Financing Updates

Piraeus Bank S.A.

On November 12, 2021, the Company entered into a $16.85 million sustainability-linked loan facility to finance part of the acquisition cost of the M/V Worldship. The principal will be repaid over a five-year term, through 4 quarterly instalments of $1.0 million, 2 quarterly instalments of $0.75 million, 14 quarterly instalments of $0.38 million and a final balloon payment of $6.1 million payable at maturity. The loan is secured by, among other things, a mortgage on the M/V Worldship and a corporate guarantee from the Company. The interest rate is 3.05% plus LIBOR per annum, which can be further improved based on certain emission reduction thresholds.

Sinopac Capital International (HK) Limited

On December 20, 2021, the Company entered into a $15 million loan facility to refinance a previous loan facility of Entrust Global secured by the M/V Geniuship. The principal will be repaid over a five-year term, through 4 quarterly instalments of $530,000 followed by 16 quarterly instalments of $385,000 and a final balloon payment of $6.72 million. The loan will be secured by, among other things, a mortgage on the M/V Geniuship and a corporate guarantee by the Company. The interest rate is 3.5% plus LIBOR per annum. Considering that the previous loan facility bore a fixed interest of 10.5% per annum, the interest savings for the Company are expected to be approximately $0.9 million for 2022 and $0.5 million on average per year for 2023-2025.

Japanese Lender

On February 25, 2022, the Company entered into a sale and leaseback transaction with a Japanese lender to refinance a previous senior loan facility of Amsterdam Trade Bank N.V. ($15.13 million) and a junior loan facility of Jelco Delta Holding Corp. ($1.85 million) secured by the M/V Partnership. The financing amount is $21.3 million and the interest rate is 2.9% plus SOFR per annum. The principal will be repaid over an eight-year term, through 32 quarterly instalments averaging at approximately $590,000. Following the second anniversary of the bareboat charter, the Company has continuous options to repurchase the vessel. At the end of the 8-year bareboat period, the Company has the option to repurchase the vessel for $2.39 million, which the Company expects to exercise.

Seanergy Maritime Holdings Corp.
Unaudited Condensed Consolidated Balance Sheets
(In thousands of U.S. Dollars)

December 31,
2021

December 31,
2020*

ASSETS

Cash and cash equivalents, restricted cash, term deposits

47,126

23,651

Vessels, net

426,062

256,737

Other assets

13,733

14,857

TOTAL ASSETS

486,921

295,245

LIABILITIES AND STOCKHOLDERS’ EQUITY

Long-term debt and other financial liabilities

215,174

169,762

Convertible notes

7,573

14,516

Other liabilities

19,698

15,273

Stockholders’ equity

244,476

95,694

TOTAL LIABILITIES AND STOCKHOLDERS’ EQUITY

486,921

295,245

* Derived from the audited consolidated financial statements as of the period as of that date

Seanergy Maritime Holdings Corp.
Unaudited Condensed Consolidated Statements of Operations
(In thousands of U.S. Dollars, except for share and per share data, unless otherwise stated)

Three months ended
December 31,

Twelve months ended
December 31,

2021

2020

2021

2020

Vessel revenue, net

56,699

21,313

153,108

63,345

Expenses:

Voyage expenses

(1,992

)

(4,637

)

(16,469

)

(18,567

)

Vessel operating expenses

(11,862

)

(6,206

)

(36,332

)

(22,347

)

Management fees

(406

)

(279

)

(1,435

)

(1,052

)

General and administrative expenses

(4,024

)

(1,925

)

(13,739

)

(6,607

)

Depreciation and amortization

(6,117

)

(3,897

)

(19,944

)

(15,040

)

(Loss)/gain on sale of vessel

(19

)

697

Gain on forward freight agreements, net

24

24

Operating income/(loss)

32,303

4,369

65,910

(268

)

Other (expenses)/income:

Interest and finance costs, net

(4,751

)

(6,677

)

(17,618

)

(23,217

)

Loss on extinguishment of debt

(6,863

)

(6,863

)

(Loss)/gain on debt refinancing

(6

)

5,144

Other, net

(45

)

(5

)

(81

)

(15

)

Total other expenses, net:

(11,659

)

(6,688

)

(24,562

)

(18,088

)

Net income/(loss)

20,644

(2,319

)

41,348

(18,356

)

Net income/(loss) per common share, basic

0.12

(0.03

)

0.27

(0.55

)

Weighted average number of common shares outstanding, basic

170,884,012

67,904,450

153,321,907

33,436,278

Net income/(loss) per common share, diluted

0.11

(0.03

)

0.25

(0.55

)

Weighted average number of common shares outstanding, diluted

205,228,391

67,904,450

191,337,521

33,436,278

About Seanergy Maritime Holdings Corp.

Seanergy Maritime Holdings Corp. is the only pure-play Capesize ship-owner publicly listed in the US. Seanergy provides marine dry bulk transportation services through a modern fleet of Capesize vessels. The Company’s fleet consists of 17 Capesize vessels with an average age of 12 years and aggregate cargo carrying capacity of 3,011,083 dwt.

The Company is incorporated in the Marshall Islands and has executive offices in Glyfada, Greece. The Company’s common shares trade on the Nasdaq Capital Market under the symbol “SHIP” and its Class B warrants under “SHIPZ”.

Please visit our company website at: www.seanergymaritime.com.

Forward-Looking Statements

This press release contains forward-looking statements (as defined in Section 27A of the Securities Act of 1933, as amended, and Section 21E of the Securities Exchange Act of 1934, as amended) concerning future events. Words such as “may”, “should”, “expects”, “intends”, “plans”, “believes”, “anticipates”, “hopes”, “estimates” and variations of such words and similar expressions are intended to identify forward-looking statements. These statements involve known and unknown risks and are based upon a number of assumptions and estimates, which are inherently subject to significant uncertainties and contingencies, many of which are beyond the control of the Company. Actual results may differ materially from those expressed or implied by such forward-looking statements. Factors that could cause actual results to differ materially include, but are not limited to, the Company’s operating or financial results; the Company’s liquidity, including its ability to service its indebtedness; competitive factors in the market in which the Company operates; shipping industry trends, including charter rates, vessel values and factors affecting vessel supply and demand; future, pending or recent acquisitions and dispositions, business strategy, areas of possible expansion or contraction, and expected capital spending or operating expenses; risks associated with operations outside the United States; broader market impacts arising from war (or threatened war) or international hostilities, such as between Russia and Ukraine; risks associated with the length and severity of the ongoing novel coronavirus (COVID-19) outbreak, including its effects on demand for dry bulk products and the transportation thereof; and other factors listed from time to time in the Company’s filings with the SEC, including its most recent annual report on Form 20-F. The Company’s filings can be obtained free of charge on the SEC’s website at www.sec.gov. Except to the extent required by law, the Company expressly disclaims any obligations or undertaking to release publicly any updates or revisions to any forward-looking statements contained herein to reflect any change in the Company’s expectations with respect thereto or any change in events, conditions or circumstances on which any statement is based.

For further information please contact:

Seanergy Investor Relations
Tel: +30 213 0181 522
E-mail: ir@seanergy.gr

Capital Link, Inc.
Paul Lampoutis
230 Park Avenue Suite 1536
New York, NY 10169
Tel: (212) 661-7566
E-mail: seanergy@capitallink.com


Seanergy Maritime Holdings Corp. Reports Record Fourth Quarter 2021 Financial Results and Declares Dividend of $0.05 Per Share


Seanergy Maritime Holdings Corp. Reports Record Fourth Quarter 2021 Financial Results and Declares Dividend of $0.05 Per Share

Research, News, and Market Data on Seanergy Maritime


Initiates Quarterly Dividend, Declares Special Dividend &
Completes New Buyback of Convertibles totalling $10 million in 2022

Highlights of the Fourth Quarter of 2021:

  • EPS basic: $0.12 and Adjusted EPS1 basic: $0.16 in Q4 2021

  • EPS diluted: $0.11 and Adjusted EPS1 diluted: $0.14 in Q4 2021

  • Net revenues: $56.7 million in Q4 2021, as compared to $21.3 million in Q4 2020, up 166%

  • Net Income: $20.6 million in Q4 2021, as compared to net loss of $2.3 million in Q4 2020

  • Adjusted Net Income1: $27.9 million in Q4 2021, as compared to an adjusted net loss of $2.3 million in Q4 2020

  • EBITDA1: $31.5 million in Q4 2021, as compared to $8.3 million in Q4 2020, up 280%

  • Adjusted EBITDA1: $38.8 million in Q4 2021, as compared to $8.3 million in Q4 2020, up 367%

Highlights of Full Year 2021:

  • EPS basic: $0.27 and Adjusted EPS1 basic: $0.35 in Q4 2021

  • EPS diluted: $0.25 and Adjusted EPS1 diluted: $0.28 in Q4 2021

  • Net revenues: $153.1 million in 2021, as compared to $63.3 million in 2020, up 142%

  • Net Income: $41.3 million in 2021, as compared to a net loss of $18.4 million in 2020

  • Adjusted Net Income1: $53.3 million in 2021, as compared to an adjusted net loss of $22.6 million in 2020

  • EBITDA1: $78.9 million in 2021, as compared to $19.9 million in 2020, up 296%

  • Adjusted EBITDA1: $90.1 million in 2021, as compared to $15.6 million in 2020, up 478%

  • Shareholders’ equity of $244.5 million on December 31, 2021, compared to $95.7 million on December 31, 2020

$35.6 million in Dividends and Recent Repurchases:

  • Initiates a regular quarterly dividend and declares dividend of $0.025 per share for the fourth quarter of 2021

  • Declares a special dividend of $0.025 per share for the fourth quarter of 2021

  • Quarterly and special dividend payable on or about April 5, 2022 to all shareholders of record as of March 25, 2022

  • Additional buyback of $5.0 million of the outstanding convertible note increasing total buybacks to $26.7 million in the past 4 months

Additional highlights:

  • Delivery of 7 Japanese Capesize bulkers in 2021 increasing the fleet by 55%

  • Financing and refinancing transactions of $170.5 million, with improved pricing and overall loan terms

  • Entire fleet under time-charter agreements with first-class charterers, 15 vessels on index-linked rates

GLYFADA, Greece, March 10, 2022 (GLOBE NEWSWIRE) — Seanergy Maritime Holdings Corp. (the “Company”) (NASDAQ: SHIP), announced today its financial results for the fourth quarter and twelve months ended December 31, 2021. The Company also announced $5 million additional repurchases of its outstanding 5.5% convertible note and declared a quarterly dividend of $0.025 per share and a special dividend of $0.025 per share.

For the quarter ended December 31, 2021, the Company generated net revenues of $56.7 million, a 166% increase compared to the fourth quarter of 2020. Adjusted EBITDA for the quarter was $38.8 million, from $8.3 million in the same period of 2020. Adjusted net income for the quarter was $27.9 million, compared to net loss of $2.3 million in the fourth quarter of 2020. The daily Time Charter Equivalent rate (“TCE rate”)2 of the fleet for the fourth quarter of 2021 was $36,642, marking a 122% increase compared to $16,511 for the same period of 2020.

For the twelve-month period ended December 31, 2021, net revenues were $153.1 million, increased by 142% when compared to $63.3 million in the same period of 2020. Adjusted EBITDA for the twelve months of 2021 was $90.1 million, compared to an adjusted EBITDA of $15.6 million in the same period of 2020. The daily TCE of the fleet for the twelve months of 2021 was $27,399 compared to $11,950 in the twelve months of 2020. The average daily OPEX was $6,211, compared to $5,709 in the respective period of 2020.

Cash and cash-equivalents, restricted cash, term deposits, as of December 31, 2021, stood at $47.1 million, compared to $23.7 million as of December 31, 2020. Shareholders’ equity at the end of the fourth quarter was $244.5 million, compared to $95.7 million on December 31, 2020. Long-term debt (senior and junior loans and other financial liabilities) net of deferred charges stood at $215.2 million as of December 31, 2021, increased from $169.8 million as of the end of 2020. In the same period, the book value of our fleet increased by 66% to $426.1 million from $256.7 million.

______________
1 Adjusted EPS, Adjusted Net Income, EBITDA and Adjusted EBITDA are non-GAAP measures. Please see the reconciliation below of Adjusted EPS, Adjusted Net Income, EBITDA and adjusted EBITDA to net income the most directly comparable U.S. GAAP measure.
2 TCE rate is a non-GAAP measure. Please see the reconciliation below of TCE rate to net revenues from vessels, the most directly comparable U.S. GAAP measure.

Stamatis Tsantanis, the Company’s Chairman & Chief Executive Officer, stated:

“Seanergy reported its strongest operational year in 2021, earning an adjusted net income of $53.3 million, an adjusted EBITDA of $90.1 million on net revenue of $153.1 million. In Q4 2021, our fleet TCE was $36,642 and our estimated TCE for the first quarter of 2022 is $19,475. Despite the seasonal softening experienced in the first months of 2022, for which we were proactively hedged, the market is already trending higher.

“Consistent with our stated intention to return capital to our shareholders, our board of directors has initiated a regular quarterly dividend of $0.025 per share for the fourth quarter of 2021. In addition, based on the strong financial performance of Q4 2021 we are also declaring a special dividend of $0.025 per share. As a result, the Company will be paying a dividend of $0.05 per share for the fourth quarter of 2021 to all shareholders of record as of March 25, 2022. The fourth quarter dividend of $8.9 million and the $26.7 million in buybacks of convertible notes, warrants and common shares represent an aggregate of $35.6 million in shareholder-rewarding initiatives that Seanergy’s board of directors undertook over the last 4 months. While the amount and timing of any future dividend payments remains subject to the discretion of our board of directors and will be based on our results, investment opportunities and overall market conditions, we remain committed to continue distributing a significant portion of our earnings to our shareholders.

“In 2021 we successfully executed a substantial fleet growth program. Despite the Covid-related hindrance we took delivery of seven high-quality Japanese Capesize vessels, reducing the average age of our fleet. Investment in vessel acquisitions in 2021 totalled approximately $193.2 million.

“Moreover, we have entered into eleven new time-charter agreements with leading charterers in the Capesize sector and all our fleet operates under period employment agreements. We strongly believe this to be the optimal commercial positioning of our fleet.

“On the buyback front, since the fourth quarter of 2021, we have completed a total of $21.7 million in buybacks of convertible notes, warrants and common shares, while an additional prepayment of $5.0 million of convertible note, was effected on March 10, 2022. The ultimate effect of our buyback program will be the prevention of potential dilution by 25.95 million shares. This reflects our firm belief that our share price continues to be significantly undervalued. As previously announced, in 2021 I continued my open-market purchases of Seanergy’s shares, which indicates my strong confidence in the Company.

“New financings and refinancings since the beginning of 2021 total $170.5 million. All transactions concluded in 2021 and to date underscore our stated intention to optimize the capital structure and further reduce our financing expense. In the fourth quarter of 2021 and in the first quarter to-date, we have concluded three new financings of approximately $53.15 million. The new financings include our first sustainability-linked loan in Greece, as well as two transactions with prominent lenders in Taiwan and Japan, strengthening Seanergy’s footing in the Asian ship-financing market. In the same period, we prepaid $50.6 million of our existing financings, including legacy high-coupon facilities, all junior loans and a large part of the convertible notes. The weighted average interest rate across our indebtedness has seen a significantly year-over-year reduction of 128 basis points.

“Regarding our ESG initiatives, we primarily continue to execute on the installation of Energy Saving Devices (“ESDs”) on vessels undergoing scheduled dry-docking. In most cases the selection of the ESDs is done in cooperation with the underlying charterers, following agreement to adjust the index-linked rate to reflect the improved performance of the vessels. At the same time, we have completed biofuel trials in cooperation with two of our closest charterers. The Company’s first ESG report, analyzing material actions that Seanergy has successfully completed to date, as well as the targets set going forward, will be released within 2022.

“Over the past months we have successfully executed on a number of strategic initiatives, which have resulted in Seanergy’s transformation into one of the leading Capesize players in the U.S. capital markets.

“Our outlook for the Capesize market is very positive based on the strong supply-demand fundamentals. Firstly, the record low orderbook coupled with the upcoming environmental regulations, will significantly limit vessel supply. Secondly, the global energy supply shortages, as well as the worldwide stimuli and infrastructure projects will strongly support demand for dry bulk shipping. Given Seanergy’s significant operating leverage, we are well positioned to capitalise on the favourable dynamics of our sector.”

Company Fleet:

Vessel Name

Vessel Class

Capacity (DWT)

Year Built

Yard

Scrubber Fitted

Employment Type

FFA
conversion
option
(18)

Earliest
T/C
expiration

Patriotship

Capesize

181,709

2010

Imabari

Yes

T/C – fixed rate(1)

06/2022

Worldship

Capesize

181,415

2012

Koyo – Imabari

Yes

T/C – fixed rate(2)

09/2022

Hellasship

Capesize

181,325

2012

Imabari

T/C Index Linked(3)

04/2022

Fellowship

Capesize

179,701

2010

Daewoo

T/C Index Linked(4)

Yes

06/2022

Championship

Capesize

179,238

2011

Sungdong SB

Yes

T/C Index Linked(5)

Yes

11/2023

Partnership

Capesize

179,213

2012

Hyundai

Yes

T/C Index Linked(6)

Yes

06/2022

Knightship

Capesize

178,978

2010

Hyundai

Yes

T/C Index Linked(7)

05/2023

Lordship

Capesize

178,838

2010

Hyundai

Yes

T/C Index Linked(8)

Yes

05/2022

Goodship

Capesize

177,536

2005

Mitsui

T/C Index Linked(9)

Yes

08/2022

Friendship

Capesize

176,952

2009

Namura

T/C Index Linked(10)

12/2022

Tradership

Capesize

176,925

2006

Namura

T/C Index Linked(11)

Yes

05/2022

Flagship

Capesize

176,387

2013

Mitsui

T/C Index Linked(12)

Yes

05/2026

Gloriuship

Capesize

171,314

2004

Hyundai

T/C Index Linked(13)

Yes

12/2022

Geniuship

Capesize

170,057

2010

Sungdong SB

T/C Index Linked(14)

Yes

01/2023

Premiership

Capesize

170,024

2010

Sungdong SB

Yes

T/C Index Linked(15)

11/2022

Squireship

Capesize

170,018

2010

Sungdong SB

Yes

T/C Index Linked(16)

12/2022

Dukeship

Capesize

181,453

2010

Sasebo

T/C Index Linked(17)

Yes

12/2022

Total / Average age

3,011,083

12

(1)

Chartered by a European cargo operator and delivered to the charterer on June 7, 2021 for a period of about 12 to about 18 months. The daily charter hire is fixed at $31,000.

(2)

Chartered by a U.S. commodity trading company and delivered to the charterer on September 2, 2021 for a period of about 12 to about 16 months. The daily charter hire is fixed at $31,750.

(3)

Chartered by NYK and delivered to the charterer on May 10, 2021 for a period of minimum 11 to maximum 15 months. The daily charter hire is based on the BCI.

(4)

Chartered by Anglo American, a leading global mining company, and delivered to the charterer on June 18, 2021 for a period of minimum 12 to about 15 months. The daily charter hire is based on the BCI.

(5)

Chartered by Cargill and delivered to the charterer on November 7, 2018 for a period of employment of 60 months, with an additional period of about 16 to about 18 months. The daily charter hire is based on the BCI plus a net daily scrubber premium of $1,740.

(6)

Chartered by a major European utility and energy company and delivered to the charterer on September 11, 2019 for a period of minimum 33 to maximum 37 months with two optional periods of about 11 to maximum 13 months. The daily charter hire is based on the BCI.

(7)

Chartered by Glencore and delivered to the charterer on May 15, 2020 for a period of about 36 to about 42 months with two optional periods of 11 to 13 months. The daily charter hire is based on the BCI.

(8)

Chartered by a major European utility and energy company and delivered on August 4, 2019 for a period of minimum 33 to maximum 37 months with an optional period of about 11 to maximum 13 months. The daily charter hire is based on the BCI.

(9)

Chartered by an international commodities trader and delivered to the charterer on November 12, 2021 for a period of about 9 to about 12 months. The daily charter hire is based on the BCI.

(10)

Chartered by NYK and delivered to the charterer on July 29, 2021 for a period of minimum 17 to maximum 24 months. The daily charter hire is based on the BCI.

(11)

Chartered by a major South Korean industrial company and delivered to the charterer on June 15, 2021 for a period employment of minimum 11 to about 15 months. The daily charter hire is based on the BCI.

(12)

Chartered by Cargill. The vessel was delivered to the charterer on May 10, 2021 for a period of 60 months. The daily charter hire is based at a premium over the BCI minus $1,325 per day.

(13)

Chartered by Pacbulk Shipping and delivered to the charterer on April 23, 2020 for a period of about 11 to about 15 months. In December 2021, the T/C was further extended until minimum December 16, 2022, up to maximum April 15, 2023. The daily charter hire is based on the BCI.

(14)

Chartered by NYK and delivered to the charterer on February 5, 2022 for a period of about 11 to about 15. The daily charter hire is based on the BCI.

(15)

Chartered by Glencore and delivered to the charterer on November 29, 2019 for a period of minimum 36 to maximum 42 months with two optional periods of minimum 11 to maximum 13 months. The daily charter hire is based on the BCI plus a net daily scrubber premium of $2,055.

(16)

Chartered by Glencore and delivered to the charterer on December 19, 2019 for a period of minimum 36 to maximum 42 months with two optional periods of minimum 11 to maximum 13 months. The daily charter hire is based on the BCI plus a net daily scrubber premium of $2,055.

(17)

Chartered by NYK and delivered to the charterer on December 1, 2021 for a period of about 13 to about 18 months. The daily charter hire is based on the BCI.

(18)

The Company has the option to convert the index-linked rate to a fixed one for a period ranging between 2 and 12 months, based on the prevailing Capesize FFA Rate for the selected period.

Fleet Data:

(U.S. Dollars in thousands)

Q4 2021

Q4 2020

FY 2021

FY 2020

Ownership days (1)

1,508

1,012

5,140

3,807

Operating days (2)

1,493

1,010

4,987

3,747

Fleet utilization (3)

99.0

%

99.8

%

97.0

%

98.4

%

TCE rate (4)

$

36,642

$

16,511

$

27,399

$

11,950

Daily Vessel Operating Expenses (5)

$

7,184

$

6,087

$

6,211

$

5,709

(1)

Ownership days are the total number of calendar days in a period during which the vessels in a fleet have been owned or chartered in. Ownership days are an indicator of the size of the Company’s fleet over a period and affect both the amount of revenues and the amount of expenses that the Company recorded during a period.

(2)

Operating days are the number of available days in a period less the aggregate number of days that the vessels are off-hire due to unforeseen circumstances. Operating days includes the days that our vessels are in ballast voyages without having finalized agreements for their next employment.

(3)

Fleet utilization is the percentage of time that the vessels are generating revenue and is determined by dividing operating days by ownership days for the relevant period.

(4)

TCE rate is defined as the Company’s net revenue less voyage expenses during a period divided by the number of the Company’s operating days during the period. Voyage expenses include port charges, bunker (fuel oil and diesel oil) expenses, canal charges and other commissions. The Company includes the TCE rate, a non-GAAP measure, as it believes it provides additional meaningful information in conjunction with net revenues from vessels, the most directly comparable U.S. GAAP measure, and because it assists the Company’s management in making decisions regarding the deployment and use of the Company’s vessels and in evaluating their financial performance. The Company’s calculation of TCE rate may not be comparable to that reported by other companies. The following table reconciles the Company’s net revenues from vessels to the TCE rate.

(In thousands of U.S. Dollars, except operating days and TCE rate)

Q4 2021

Q4 2020

FY 2021

FY 2020

Net revenues from vessels

56,699

21,313

153,108

63,345

Less: Voyage expenses

1,992

4,637

16,469

18,567

Net operating revenues

54,707

16,676

136,639

44,778

Operating days

1,493

1,010

4,987

3,747

TCE rate

$

36,642

$

16,511

$

27,399

$

11,950

(5)

Vessel operating expenses include crew costs, provisions, deck and engine stores, lubricants, insurance, maintenance and repairs. Daily Vessel Operating Expenses are calculated by dividing vessel operating expenses by ownership days for the relevant time periods. The Company’s calculation of daily vessel operating expenses may not be comparable to that reported by other companies. The following table reconciles the Company’s vessel operating expenses to daily vessel operating expenses.

(In thousands of U.S. Dollars, except ownership days and Daily Vessel Operating Expenses)

Q4 2021

Q4 2020

FY 2021

FY 2020

Vessel operating expenses

11,862

6,206

36,332

22,347

Less: Pre-delivery expenses

1,029

46

4,410

611

Vessel operating expenses before pre-delivery expenses

10,833

6,160

31,922

21,736

Ownership days

1,508

1,012

5,140

3,807

Daily Vessel Operating Expenses

$

7,184

$

6,087

$

6,211

$

5,709

Net Income / (Loss) to EBITDA and Adjusted EBITDA Reconciliation:

(In thousands of U.S. Dollars)

Q4 2021

Q4 2020

FY 2021

FY 2020

Net income/(loss)

20,644

(2,319

)

41,348

(18,356

)

Add: Net interest and finance cost

4,751

6,677

17,618

23,217

Add: Depreciation and amortization

6,117

3,897

19,944

15,040

EBITDA

31,512

8,255

78,910

19,901

Add: Stock based compensation

393

44

5,097

869

Less: Loss/(gain) on sale of vessel

19

(697

)

Add: Loss on extinguishment of debt

6,863

6,863

Less: Loss/(gain) on debt refinancing

6

(5,144

)

Less: Gain on forward freight agreements, net

(24

)

(24

)

Adjusted EBITDA

38,763

8,305

90,149

15,626

Earnings Before Interest, Taxes, Depreciation and Amortization (“EBITDA”) represents the sum of net income / (loss), interest and finance costs, interest income, depreciation and amortization and, if any, income taxes during a period. EBITDA is not a recognized measurement under U.S. GAAP. Adjusted EBITDA represents EBITDA adjusted to exclude stock-based compensation, the non-recurring gain on sale of vessel and gain on debt refinancing and gain on forward freight agreements, net, which the Company believes are not indicative of the ongoing performance of its core operations.

EBITDA and adjusted EBITDA are presented as we believe that these measures are useful to investors as a widely used means of evaluating operating profitability. EBITDA and adjusted EBITDA as presented here may not be comparable to similarly titled measures presented by other companies. These non-GAAP measures should not be considered in isolation from, as a substitute for, or superior to, financial measures prepared in accordance with U.S. GAAP.


Net Income/(Loss) and Adjusted Net income/(Loss) Reconciliation and calculation of Adjusted Earnings/(Loss) Per Share

(In thousands of U.S. Dollars)

Q4 2021

Q4 2020

FY 2021

FY 2020

Net income/(loss)

20,644

(2,319

)

41,348

(18,356

)

Add: Stock based compensation

393

44

5,097

869

Add: Loss on extinguishment of debt

6,863

6,863

Less: Loss/(gain) on debt refinancing

6

(5,144

)

Adjusted net income/(loss)

27,900

(2,269

)

53,308

(22,631

)

Adjusted net income/(loss) per common share, basic

0.16

(0.03

)

0.35

(0.68

)

Weighted average number of common shares outstanding, basic

170,884,012

67,904,450

153,321,907

33,436,278

Adjusted net income/(loss) per common share, diluted

0.14

(0.03

)

0.28

(0.68

)

Weighted average number of common shares outstanding, diluted

205,228,391

67,904,450

191,337,521

33,436,278

To derive Adjusted Net Income/(Loss) and Adjusted Earnings/(Loss) Per Share from Net Income/(Loss), we exclude non-cash items, as provided in the table above. We believe that Adjusted Net Income/(Loss) and Adjusted Earnings/(Loss) Per Share assist our management and investors by increasing the comparability of our performance from period to period since each such measure eliminates the effects of such non-cash items as gain/(loss) on extinguishment of debt and other items which may vary from year to year, for reasons unrelated to overall operating performance. In addition, we believe that the presentation of the respective measure provides investors with supplemental data relating to our results of operations, and therefore, with a more complete understanding of factors affecting our business than with GAAP measures alone. Our method of computing Adjusted Net Income/(Loss) and Adjusted Earnings/(Loss) Per Share may not necessarily be comparable to other similarly titled captions of other companies due to differences in methods of calculation.


Interest and Finance Costs to Cash Interest and Finance Costs Reconciliation:

(In thousands of U.S. Dollars)

Q4 2021

Q4 2020

FY 2021

FY 2020

Interest and finance costs, net

(4,751

)

(6,677

)

(17,618

)

(23,217

)

Add: Amortization of deferred finance charges

892

219

3,333

757

Add: Amortization of convertible note beneficial conversion feature

878

1,645

2,887

5,518

Add: Amortization of other deferred charges (shares issued to third party)

75

120

326

550

Add: Fair value of units – related party (one-off expenses relating to financial restructuring)

596

596

Cash interest and finance costs

(2,906

)

(4,097

)

(11,072

)

(15,796

)

Add: Restructuring expenses

(25

)

1,012

22

1,012

Cash interest and finance costs, net of restructuring expenses

(2,931

)

(3,085

)

(11,050

)

(14,784

)


First Quarter 2022 TCE Guidance:

As of the date hereof, approximately 90% of the Company fleet’s expected operating days in the first quarter of 2022 have been fixed at an estimated TCE of approximately $19,844. Assuming that for the remaining operating days of our index-linked T/Cs, the respective vessels’ TCE will be equal to the average Forward Freight Agreement (“FFA”) rate of approximately $17,500 per day (based on the FFA curve of March 3, 2022), our estimated TCE for the first quarter of 2022 will be approximately $19,4753. Our TCE guidance for the first quarter of 2022 includes certain conversions (5 vessels) of index-linked charters to fixed, which were concluded in the third and fourth quarter of 2021 as part of our freight hedging strategy. The following table provides the break-down:

Operating Days

TCE

TCE – fixed rate (index-linked conversion)

244

$26,512

TCE – fixed rate

269

$28,764

TCE – index linked unhedged

964

$15,209

Total / Average

1,477

$19,475


Fourth Quarter and Recent Developments:

Buybacks of Convertible Notes, Warrants and Common Shares

(A) $17 million Repurchase Plan of August 10, 2021: Completed in December 2021 through the following transactions:

(i) Buyback of two outstanding convertible notes with 5.5% coupon and a conversion price of $1.20 per share (the “Notes”) at face value of $13.95 million;

(ii) Buyback of warrants to purchase 4.3 million common shares at an exercise price of $0.70 held by the holder of the Notes for $1.02 million; and

(iii) Buyback of 1.7 million common shares for $1.69 million

(B) $10 million Repurchase Plan of December 7, 2021:

(i) Buyback of $5 million of the remaining convertible note in January 2022; and

(ii) Buyback of additional $5 million of the remaining convertible Note, on March 10, 2022

______________
3
 This guidance is based on certain assumptions and there can be no assurance that these TCE estimates, or projected utilization will be realized. TCE estimates include certain floating (index) to fixed rate conversions concluded in previous periods. For vessels on index-linked T/Cs, the TCE realized will vary with the underlying index, and for the purposes of this guidance, the TCE assumed for the remaining operating days of the quarter for an index-linked T/C is equal to the average FFA rate of $17,500 per day (FFA curve of March 3, 2022). Spot estimates are provided using the load-to-discharge method of accounting. Load-to-discharge accounting recognizes revenues over fewer days as opposed to the discharge-to-discharge method of accounting used prior to 2018, resulting in higher rates for these days and only voyage expenses being recorded in the ballast days. Over the duration of the voyage (discharge-to-discharge) there is no difference in the total revenues and costs to be recognized. The rates quoted are for days currently contracted. Increased ballast days at the end of the quarter will reduce the additional revenues that can be booked based on the accounting cut-offs and therefore the resulting TCE will be reduced accordingly.

Moreover, Seanergy’s Chairman & CEO, purchased in 2021 an additional 300,000 of the Company’s common shares in the open market.

Fleet Update

M/V Dukeship

In December 2021, the Company announced the delivery of the M/V Dukeship, a 181,453 dwt Capesize bulk carrier, built in 2010 in Japan. At the same time, M/V Dukeship commenced its time charter (“T/C”) employment with NYK, a leading Japanese charterer. The purchase price of $34.3 million was funded with cash on hand.

Commercial Updates

M/V Geniuship

The M/V Geniuship has been delivered to NYK on February 5, 2022 for a period of about 11 to about 15 months. The daily charter hire is based on the BCI. In addition, the Company has the option to convert the index-linked rate to a fixed rate based on the prevailing Capesize FFA for the selected period.

M/V Gloriuship

The M/V Gloriuship has been chartered by Pacbulk since April, 2020. In December 2021 the charterer extended the T/C until minimum December 16, 2022, up to maximum April 15, 2023, in charterer’s option.

Financing Updates

Piraeus Bank S.A.

On November 12, 2021, the Company entered into a $16.85 million sustainability-linked loan facility to finance part of the acquisition cost of the M/V Worldship. The principal will be repaid over a five-year term, through 4 quarterly instalments of $1.0 million, 2 quarterly instalments of $0.75 million, 14 quarterly instalments of $0.38 million and a final balloon payment of $6.1 million payable at maturity. The loan is secured by, among other things, a mortgage on the M/V Worldship and a corporate guarantee from the Company. The interest rate is 3.05% plus LIBOR per annum, which can be further improved based on certain emission reduction thresholds.

Sinopac Capital International (HK) Limited

On December 20, 2021, the Company entered into a $15 million loan facility to refinance a previous loan facility of Entrust Global secured by the M/V Geniuship. The principal will be repaid over a five-year term, through 4 quarterly instalments of $530,000 followed by 16 quarterly instalments of $385,000 and a final balloon payment of $6.72 million. The loan will be secured by, among other things, a mortgage on the M/V Geniuship and a corporate guarantee by the Company. The interest rate is 3.5% plus LIBOR per annum. Considering that the previous loan facility bore a fixed interest of 10.5% per annum, the interest savings for the Company are expected to be approximately $0.9 million for 2022 and $0.5 million on average per year for 2023-2025.

Japanese Lender

On February 25, 2022, the Company entered into a sale and leaseback transaction with a Japanese lender to refinance a previous senior loan facility of Amsterdam Trade Bank N.V. ($15.13 million) and a junior loan facility of Jelco Delta Holding Corp. ($1.85 million) secured by the M/V Partnership. The financing amount is $21.3 million and the interest rate is 2.9% plus SOFR per annum. The principal will be repaid over an eight-year term, through 32 quarterly instalments averaging at approximately $590,000. Following the second anniversary of the bareboat charter, the Company has continuous options to repurchase the vessel. At the end of the 8-year bareboat period, the Company has the option to repurchase the vessel for $2.39 million, which the Company expects to exercise.

Seanergy Maritime Holdings Corp.
Unaudited Condensed Consolidated Balance Sheets
(In thousands of U.S. Dollars)

December 31,
2021

December 31,
2020*

ASSETS

Cash and cash equivalents, restricted cash, term deposits

47,126

23,651

Vessels, net

426,062

256,737

Other assets

13,733

14,857

TOTAL ASSETS

486,921

295,245

LIABILITIES AND STOCKHOLDERS’ EQUITY

Long-term debt and other financial liabilities

215,174

169,762

Convertible notes

7,573

14,516

Other liabilities

19,698

15,273

Stockholders’ equity

244,476

95,694

TOTAL LIABILITIES AND STOCKHOLDERS’ EQUITY

486,921

295,245

* Derived from the audited consolidated financial statements as of the period as of that date

Seanergy Maritime Holdings Corp.
Unaudited Condensed Consolidated Statements of Operations
(In thousands of U.S. Dollars, except for share and per share data, unless otherwise stated)

Three months ended
December 31,

Twelve months ended
December 31,

2021

2020

2021

2020

Vessel revenue, net

56,699

21,313

153,108

63,345

Expenses:

Voyage expenses

(1,992

)

(4,637

)

(16,469

)

(18,567

)

Vessel operating expenses

(11,862

)

(6,206

)

(36,332

)

(22,347

)

Management fees

(406

)

(279

)

(1,435

)

(1,052

)

General and administrative expenses

(4,024

)

(1,925

)

(13,739

)

(6,607

)

Depreciation and amortization

(6,117

)

(3,897

)

(19,944

)

(15,040

)

(Loss)/gain on sale of vessel

(19

)

697

Gain on forward freight agreements, net

24

24

Operating income/(loss)

32,303

4,369

65,910

(268

)

Other (expenses)/income:

Interest and finance costs, net

(4,751

)

(6,677

)

(17,618

)

(23,217

)

Loss on extinguishment of debt

(6,863

)

(6,863

)

(Loss)/gain on debt refinancing

(6

)

5,144

Other, net

(45

)

(5

)

(81

)

(15

)

Total other expenses, net:

(11,659

)

(6,688

)

(24,562

)

(18,088

)

Net income/(loss)

20,644

(2,319

)

41,348

(18,356

)

Net income/(loss) per common share, basic

0.12

(0.03

)

0.27

(0.55

)

Weighted average number of common shares outstanding, basic

170,884,012

67,904,450

153,321,907

33,436,278

Net income/(loss) per common share, diluted

0.11

(0.03

)

0.25

(0.55

)

Weighted average number of common shares outstanding, diluted

205,228,391

67,904,450

191,337,521

33,436,278

About Seanergy Maritime Holdings Corp.

Seanergy Maritime Holdings Corp. is the only pure-play Capesize ship-owner publicly listed in the US. Seanergy provides marine dry bulk transportation services through a modern fleet of Capesize vessels. The Company’s fleet consists of 17 Capesize vessels with an average age of 12 years and aggregate cargo carrying capacity of 3,011,083 dwt.

The Company is incorporated in the Marshall Islands and has executive offices in Glyfada, Greece. The Company’s common shares trade on the Nasdaq Capital Market under the symbol “SHIP” and its Class B warrants under “SHIPZ”.

Please visit our company website at: www.seanergymaritime.com.

Forward-Looking Statements

This press release contains forward-looking statements (as defined in Section 27A of the Securities Act of 1933, as amended, and Section 21E of the Securities Exchange Act of 1934, as amended) concerning future events. Words such as “may”, “should”, “expects”, “intends”, “plans”, “believes”, “anticipates”, “hopes”, “estimates” and variations of such words and similar expressions are intended to identify forward-looking statements. These statements involve known and unknown risks and are based upon a number of assumptions and estimates, which are inherently subject to significant uncertainties and contingencies, many of which are beyond the control of the Company. Actual results may differ materially from those expressed or implied by such forward-looking statements. Factors that could cause actual results to differ materially include, but are not limited to, the Company’s operating or financial results; the Company’s liquidity, including its ability to service its indebtedness; competitive factors in the market in which the Company operates; shipping industry trends, including charter rates, vessel values and factors affecting vessel supply and demand; future, pending or recent acquisitions and dispositions, business strategy, areas of possible expansion or contraction, and expected capital spending or operating expenses; risks associated with operations outside the United States; broader market impacts arising from war (or threatened war) or international hostilities, such as between Russia and Ukraine; risks associated with the length and severity of the ongoing novel coronavirus (COVID-19) outbreak, including its effects on demand for dry bulk products and the transportation thereof; and other factors listed from time to time in the Company’s filings with the SEC, including its most recent annual report on Form 20-F. The Company’s filings can be obtained free of charge on the SEC’s website at www.sec.gov. Except to the extent required by law, the Company expressly disclaims any obligations or undertaking to release publicly any updates or revisions to any forward-looking statements contained herein to reflect any change in the Company’s expectations with respect thereto or any change in events, conditions or circumstances on which any statement is based.

For further information please contact:

Seanergy Investor Relations
Tel: +30 213 0181 522
E-mail: ir@seanergy.gr

Capital Link, Inc.
Paul Lampoutis
230 Park Avenue Suite 1536
New York, NY 10169
Tel: (212) 661-7566
E-mail: seanergy@capitallink.com


Seanergy Maritime (SHIP) – 4Q2021 Results Today – Call Should Highlight Positive Outlook

Thursday, March 10, 2022

Seanergy Maritime (SHIP)
4Q2021 Results Today – Call Should Highlight Positive Outlook

Seanergy Maritime Holdings Corp. is the only pure-play Capesize shipping company listed in the US capital markets. Seanergy provides marine dry bulk transportation services through a modern fleet of Capesize vessels. Upon delivery of the M/V Dukeship, the Company’s operating fleet will consist of 17 Capesize vessels with an average age of 11.5 years and aggregate cargo carrying capacity of approximately 3,011,083 dwt. The Company is incorporated in the Marshall Islands and has executive offices in Glyfada, Greece. The Company’s common shares trade on the Nasdaq Capital Market under the symbol “SHIP”, its Class A warrants under “SHIPW” and its Class B warrants under “SHIPZ”.

Poe Fratt, Senior Research Analyst, Logistics, Noble Capital Markets, Inc.

Refer to the full report for the price target, fundamental analysis, and rating.

    4Q2021 Results out BMO today. TCE rates above $35.0k/day should drive EBITDA to $38.7 million despite higher opex. Today’s 11:30am EST call should highlight 2021 achievements and positive 2022 outlook. Also, we will be looking for an update on 1Q2022 forward cover. Call number is (877) 870 9135 and code is 9389462.

    2022 EBITDA estimate reflects higher opex and last forward cover update.  Last update on 1Q2022 forward cover was ~35% including six of 17 Capes fixed at ~$28.0k/day, but it should be higher now. Expect 1Q2022 weakness with a 2Q2022 pickup. Our 2022 EBITDA estimate of $101.9 million is based on TCE rates of $24.9k/day. Typical seasonality factored in, with TCE rates of $19.5k/day in 1Q2022 …


This research is provided by Noble Capital Markets, Inc., a FINRA and S.E.C. registered broker-dealer (B/D).

*Analyst certification and important disclosures included in the full report. NOTE: investment decisions should not be based upon the content of this research summary. Proper due diligence is required before making any investment decision. 

Grindrod Shipping (GRIN) – Price Weakness Creates Attractive Opportunity

Tuesday, March 08, 2022

Grindrod Shipping (GRIN)
Price Weakness Creates Attractive Opportunity

Grindrod Shipping, originated in South Africa with roots dating back to 1910. The company is based in Singapore, with offices around the world including, London, Durban, Cape Town, Tokyo and Rotterdam. Its primary listing is on Nasdaq and secondary listing on the JSE.

Grindrod Shipping owns and operates a diversified fleet of owned, long-term chartered and joint-venture dry-bulk and liquid-bulk vessels across the globe.

Poe Fratt, Senior Research Analyst, Logistics, Noble Capital Markets, Inc.

Refer to the full report for the price target, fundamental analysis, and rating.

    Recent stock price weakness warranted? We don’t think so and see no fundamental reason for the more than 12% drop, including more than 6% yesterday, seen since hitting a multi-year high of $27.10 last Thursday. The weakness is even more surprising since a competitor highlighted solid Supra market fundamentals last Friday.

    Positive bias to 2022 EBITDA and dividend estimates.  Due to strong 4Q2021 results, high 1Q2022 forward cover and management color on the recent earnings call, our 2022 EBITDA estimate is $202.0 million based on TCE rates of $25.5k/day for Supras/Ultras and $22.1k/day for Handys. 1Q2022 is off to a good start with forward cover of 1,474 Supra/Ultra operating days booked at $24.4k/day and 1,103 Handy …


This Company Sponsored Research is provided by Noble Capital Markets, Inc., a FINRA and S.E.C. registered broker-dealer (B/D).

*Analyst certification and important disclosures included in the full report. NOTE: investment decisions should not be based upon the content of this research summary. Proper due diligence is required before making any investment decision. 

Eagle Bulk Shipping (EGLE) – 1Q2022 Looking Good

Monday, March 07, 2022

Eagle Bulk Shipping (EGLE)
1Q2022 Looking Good

Eagle Bulk Shipping Inc. is a US-based drybulk owner-operator focused on the Supramax/Ultramax mid-size asset class, which ranges from 50,000 and 65,000 deadweight tons in size; these vessels are equipped with onboard cranes allowing for the self-loading and unloading of cargoes, a feature which distinguishes them from the larger classes of drybulk vessels and provides for greatly enhanced flexibility and versatility- both with respect to cargo diversity and port accessibility. The Company transports a broad range of major and minor bulk cargoes around the world, including coal, grain, ore, pet coke, cement, and fertilizer. Eagle operates out of three offices, Stamford (headquarters), Singapore, and Hamburg, and performs all aspects of vessel management in-house including: commercial, operational, technical, and strategic.

Poe Fratt, Senior Research Analyst, Logistics, Noble Capital Markets, Inc.

Refer to the full report for the price target, fundamental analysis, and rating.

    Strong end to the year and another dividend declared. Adjusted EBITDA of $91.6 million and TCE rates of $29.4k/day were very strong and in line with expectations. While opex and G&A were higher than expected due to acquisition and refinancing activity, both should moderate this year. 4Q2021 dividend of $2.05/share was declared based on EPS of $6.79/share.

    1Q2022 Forward cover of 95% is high.  Fine Tuning 2022 EBITDA and dividend estimate. Our EBITDA estimate of $366.1 million is based on TCE revenue of $512.1 million, TCE rates of $27.7k/day, ownership days of 19,345 (+1,087) and cash operating costs of $7.4k/day. Based on the dividend payout target of 30% of net income, our 2022 dividend estimate is $6.73/share …


This research is provided by Noble Capital Markets, Inc., a FINRA and S.E.C. registered broker-dealer (B/D).

*Analyst certification and important disclosures included in the full report. NOTE: investment decisions should not be based upon the content of this research summary. Proper due diligence is required before making any investment decision. 

EuroDry (EDRY) – Time Charter In Line With Expectations

Friday, March 04, 2022

EuroDry (EDRY)
Time Charter In Line With Expectations

EuroDry Ltd. was formed on January 8, 2018 under the laws of the Republic of the Marshall Islands and trades on the NASDAQ Capital Market under the ticker EDRY. EDRY is the product of a spin-off of the dry bulk fleet by Euroseas (ESEA) completed in May 2018. For every five ESEA shares, ESEA shareholders received one EDRY share. There are currently ~2.2 million EDRY shares outstanding. EuroDry operates in the dry bulk shipping markets. EuroDry’s operations are managed by Eurobulk Ltd., an affiliated ship management company, and Eurobulk FE (Far East) Ltd, which are responsible for the day-to-day commercial and technical management and operation of the fleet. EuroDry employs the fleet on spot and period charters and through pool arrangements.

Poe Fratt, Senior Research Analyst, Noble Capital Markets, Inc.

Refer to the full report for the price target, fundamental analysis, and rating.

    New time charter on Molyvos Luck. The newly acquired 2014-built Supra has been time chartered for 11-13 months at a TCE rate of $27.75k/day. The time charter should generate revenue of $8.5-$10.0 million and EBITDA of $5.5-$6.5 million.

    Adjusting 2022 EBITDA estimate to $60.7 million based on TCE rates of $26.2k/day.  Forward cover moves up to 29% of 2022 available days booked from 19%. Currently, there is more visibility early in the year, and we estimate that ~59% of 1Q2022 available days of 837 days are booked at average TCE rates of $24.5k/day. Given time charters on the Good Heart into 4Q2022 and the Molyvos Luck into 2Q2023 …


This research is provided by Noble Capital Markets, Inc., a FINRA and S.E.C. registered broker-dealer (B/D).

*Analyst certification and important disclosures included in the full report. NOTE: investment decisions should not be based upon the content of this research summary.  Proper due diligence is required before making any investment decision. 

Eagle Bulk Shipping (EGLE) – Meeting High Expectations

Friday, March 04, 2022

Eagle Bulk Shipping (EGLE)
Meeting High Expectations

Eagle Bulk Shipping Inc. is a US-based drybulk owner-operator focused on the Supramax/Ultramax mid-size asset class, which ranges from 50,000 and 65,000 deadweight tons in size; these vessels are equipped with onboard cranes allowing for the self-loading and unloading of cargoes, a feature which distinguishes them from the larger classes of drybulk vessels and provides for greatly enhanced flexibility and versatility- both with respect to cargo diversity and port accessibility. The Company transports a broad range of major and minor bulk cargoes around the world, including coal, grain, ore, pet coke, cement, and fertilizer. Eagle operates out of three offices, Stamford (headquarters), Singapore, and Hamburg, and performs all aspects of vessel management in-house including: commercial, operational, technical, and strategic.

Poe Fratt, Senior Research Analyst, Noble Capital Markets, Inc.

Refer to the full report for the price target, fundamental analysis, and rating.

    Strong end to year and another dividend declared. Adjusted EBITDA of $91.6 million and TCE rates of $29.4k/day were very strong and in line with expectations. While opex and G&A were higher than expected due to acquisition and refinancing activity, both should moderate this year. 4Q2021 dividend of $2.05/share was declared based on EPS of $6.79/share.

    Call with management today at 8am EST.  Number is 844-282-4411 and code is 2175087. Topics likely to include: 1) Macro dry bulk outlook given recent disruptions in Black Sea; 2) ROY forward cover; 3) 1Q2022 opex and G&A guidance; 4) current FFA book; 5) Fuel spreads and impact of higher oil prices; 6) Tone of asset market and potential for acquisitions/divestitures; and 7) potential for buy backs of …


This research is provided by Noble Capital Markets, Inc., a FINRA and S.E.C. registered broker-dealer (B/D).

*Analyst certification and important disclosures included in the full report. NOTE: investment decisions should not be based upon the content of this research summary.  Proper due diligence is required before making any investment decision. 

Orion Group Holdings (ORN) – Challenges Continued in 4Q2021

Thursday, March 03, 2022

Orion Group Holdings (ORN)
Challenges Continued in 4Q2021

Orion Group Holdings, based in Houston, Texas, is a specialty construction company within the Marine and Industrial Construction sectors, with operations focused in the continental United States and Caribbean. Revenue is split roughly 50/50 between a Marine Construction segment that provides marine facility, pipeline and structural construction services and a Commercial Concrete segment that provides turnkey concrete services in the light commercial and structural construction markets.

Poe Fratt, Senior Research Analyst, Noble Capital Markets, Inc.

Refer to the full report for the price target, fundamental analysis, and rating.

    Challenges prevailed…again in 4Q2021. While revenue of $163.2 million was higher than expected, EBITDA of $0.8 million was in line with our recent revisions. Profitability remained under pressure to COVID related and other issues and EBITDA margin was 20 bps light.

    Update after today’s call, but recovery expected this year and no change to 2022 EBITDA.  Our current EBITDA estimate of $37.0 million sets the bar lower and incorporates the startup of large multi-year projects. Given the 2H2021 increase in backlog, we forecast that total 2022 revenue should rebound into the $665 million range, or Marine revenue of $325 million and Concrete revenue of $340 million …


This Company Sponsored Research is provided by Noble Capital Markets, Inc., a FINRA and S.E.C. registered broker-dealer (B/D).

*Analyst certification and important disclosures included in the full report. NOTE: investment decisions should not be based upon the content of this research summary.  Proper due diligence is required before making any investment decision. 

Seanergy Maritime (SHIP) – Another Refinancing Completed – Positive Outlook Intact

Thursday, March 03, 2022

Seanergy Maritime (SHIP)
Another Refinancing Completed – Positive Outlook Intact

Seanergy Maritime Holdings Corp. is the only pure-play Capesize shipping company listed in the US capital markets. Seanergy provides marine dry bulk transportation services through a modern fleet of Capesize vessels. Upon delivery of the M/V Dukeship, the Company’s operating fleet will consist of 17 Capesize vessels with an average age of 11.5 years and aggregate cargo carrying capacity of approximately 3,011,083 dwt. The Company is incorporated in the Marshall Islands and has executive offices in Glyfada, Greece. The Company’s common shares trade on the Nasdaq Capital Market under the symbol “SHIP”, its Class A warrants under “SHIPW” and its Class B warrants under “SHIPZ”.

Poe Fratt, Senior Research Analyst, Noble Capital Markets, Inc.

Refer to the full report for the price target, fundamental analysis, and rating.

    Debt refinancing boosts liquidity by $4.3 million. Debt secured by the 2012-built Partnership Cape was refinanced with a sale/leaseback with an eight year term. The Partnership will be sold and leased back in March. The lease of $21.3 million will pay off 210 basis point higher cost debt and boost liquidity by $4.3 million. The lease payments will be $590k/quarter and there is a buyback option of $2.4 million at the end of the lease.

    Fine tuning 4Q2021 EBITDA and 2022 EBITDA estimate to reflect higher opex and current market conditions.  4Q2021 TCE rates should be above $35.0k/day, but opex is higher so EBITDA moves to $38.7 million. 1Q2022 forward cover of ~35% included six of 17 Capes fixed at ~$28.0k/day, but 1Q2022 weakness expected with a 2Q2022 pickup. Our new 2022 EBITDA estimate of $101.9 million is based on TCE rates of …


This research is provided by Noble Capital Markets, Inc., a FINRA and S.E.C. registered broker-dealer (B/D).

*Analyst certification and important disclosures included in the full report. NOTE: investment decisions should not be based upon the content of this research summary.  Proper due diligence is required before making any investment decision. 

Release – Seanergy Maritime Sets Date for the Fourth Quarter and Twelve Months Ended December 31 2021 Financial Results


Seanergy Maritime Sets Date for the Fourth Quarter and Twelve Months Ended December 31, 2021 Financial Results, Conference Call and Webcast

Research, News, and Market Data on Seanergy Maritime


Earnings Release: Thursday, March 10th, 2022, Before Market Open in New York
Webcast: Thursday, March 10th, 2022, at 11:30 a.m. Eastern Time

GLYFADA, Greece, March 03, 2022 (GLOBE NEWSWIRE) — Seanergy Maritime Holdings Corp. (the “Company” or “Seanergy”) (NASDAQ: SHIP) announced today that it will release its financial results for the fourth quarter and twelve months ended December 31st, 2021 before the market opens in New York on Thursday, March 10th, 2022. The same day, Thursday, March 10th, 2022, at 11:30 a.m. Eastern Time, the Company’s management will host a conference call to present the financial results.

Audio Webcast and Earnings Presentation:

There will also be a live, and then archived, webcast of the conference call and accompanying earnings presentation available through the Company’s website. To access the earnings presentation and listen to the archived audio file, visit our website, following Webcast & Earnings Presentation. Participants to the live webcast should register on the website approximately 10 minutes prior to the start of the webcast, following this link.

Conference Call Details:
Participants have the option to dial into the call 10 minutes before the scheduled time using the following numbers: +1 (877) 870 9135 (US Toll Free Dial In), +44 (0) 800 2796619 (UK Toll Free Dial In) or +44 (0) 2071 928338 (Standard International Dial In). Confirmation Code: 9389462.

A telephonic replay of the conference call will be available until March 17th, 2022, by dialing 1 (866) 331- 1332 (US Toll Free Dial In), 0(808) 238-0667 (UK Toll Free Dial In) or +44 (0) 3333009785 (Standard International Dial In). Confirmation Code: 9389462.

About Seanergy Maritime Holdings Corp.
Seanergy Maritime Holdings Corp. is the only pure-play Capesize ship-owner publicly listed in the US. Seanergy provides marine dry bulk transportation services through a modern fleet of Capesize vessels. The Company’s operating fleet consists of 17 Capesize vessels with an average age of approximately 12 years and aggregate cargo carrying capacity of approximately 3,011,083 dwt.

The Company is incorporated in the Marshall Islands and has executive offices in Glyfada, Greece. The Company’s common shares trade on the Nasdaq Capital Market under the symbol “SHIP” and its Class B warrants under “SHIPZ”.

Please visit our company website at: www.seanergymaritime.com.

Forward-Looking Statements
This press release contains forward-looking statements (as defined in Section 27A of the Securities Act of 1933, as amended, and Section 21E of the Securities Exchange Act of 1934, as amended) concerning future events. Words such as “may”, “should”, “expects”, “intends”, “plans”, “believes”, “anticipates”, “hopes”, “estimates” and variations of such words and similar expressions are intended to identify forward-looking statements. These statements involve known and unknown risks and are based upon a number of assumptions and estimates, which are inherently subject to significant uncertainties and contingencies, many of which are beyond the control of the Company. Actual results may differ materially from those expressed or implied by such forward-looking statements. Factors that could cause actual results to differ materially include, but are not limited to, the Company’s operating or financial results; the Company’s liquidity, including its ability to service its indebtedness; competitive factors in the market in which the Company operates; shipping industry trends, including charter rates, vessel values and factors affecting vessel supply and demand; future, pending or recent acquisitions and dispositions, business strategy, areas of possible expansion or contraction, and expected capital spending or operating expenses; risks associated with operations outside the United States; and other factors listed from time to time in the Company’s filings with the SEC, including its most recent annual report on Form 20-F. The Company’s filings can be obtained free of charge on the SEC’s website at www.sec.gov. Except to the extent required by law, the Company expressly disclaims any obligations or undertaking to release publicly any updates or revisions to any forward-looking statements contained herein to reflect any change in the Company’s expectations with respect thereto or any change in events, conditions or circumstances on which any statement is based.

For further information please contact:
Seanergy Investor Relations
Tel: +30 213 0181 522
E-mail: ir@seanergy.gr

Capital Link, Inc.
Paul Lampoutis
230 Park Avenue Suite 1536
New York, NY 10169
Tel: (212) 661-7566
E-mail: seanergy@capitallink.com

Release – Orion Group Holdings Inc. Reports Fourth Quarter and Full Year 2021 Results


Orion Group Holdings, Inc. Reports Fourth Quarter and Full Year 2021 Results

Research, News, and Market Data on Orion Group Holdings


HOUSTON–(BUSINESS WIRE)–Mar. 2, 2022– 
Orion Group Holdings, Inc. (NYSE: ORN) (the “Company”), a leading specialty construction company, today reported a net loss of 
$8.8 million (
$0.29 diluted loss per share) for the fourth quarter ended 
December 31, 2021. Fourth quarter highlights are discussed below. For full year results please refer to the financial statements starting on page 7.

Fourth Quarter 2021 Highlights

  • Operating loss was 
    $8.2 million for the fourth quarter of 2021 compared to operating income of 
    $5.1 million for the fourth quarter of 2020.
  • Net loss was 
    $8.8 million (
    $0.29 diluted loss per share) for the fourth quarter of 2021 compared to net income of 
    $3.7 million (
    $0.12 diluted earnings per share) for the fourth quarter of 2020.
  • The fourth quarter 2021 net loss included 
    $1.9 million (
    $0.06 loss per diluted share) of non-recurring items and 
    $1.6 million (
    $0.06 loss per diluted share) of tax expense associated with the movement of certain valuation allowances. Fourth quarter 2021 adjusted net loss was 
    $5.3 million (
    $0.17 diluted loss per share). (Please see page 9 of this release for a reconciliation of adjusted net income).
  • EBITDA, adjusted to exclude the impact of the aforementioned non-recurring items, was 0.8 million in the fourth quarter of 2021, which compares to adjusted EBITDA of 
    $12.6 million for the fourth quarter of 2020. (Please see page 10 of this release for an explanation of EBITDA, adjusted EBITDA and a reconciliation to the nearest GAAP measure).
  • Backlog at the end of the fourth quarter was 
    $590.0 million on a fourth quarter book-to-bill of 1.11x.

“Our fourth quarter reflects the lag effects from the COVID-19 pandemic, which reduced the volume of work in our marine business and pressured project margins in our concrete business,” stated  Mark Stauffer, Orion’s Chief Executive Officer. “Additionally, the Omicron variant of the COVID-19 virus impacted our operations during the latter part of the quarter.

Marine segment revenues began recovering during the quarter but were still down significantly year over year. Concrete project margins, primarily in our 
Houston market, remained under pressure as we emerge from the pandemic.”

Mr. Stauffer continued, “That said, we ended the year with backlog up sequentially and up significantly year over year. Fueled by recent awards, the amount of work we won during 2021 was up 27% over the prior year, allowing us to enter 2022 with confidence that revenues will grow, leading to better capacity utilization, overhead absorption, and improved results. We closed the fourth quarter with year-ending backlog of 
$590.0 million, up 34% from the end of 2020. Within that backlog figure, approximately 75% is due to burn in FY’22. Overall bidding activity remains robust, with the amount of quoted work outstanding at year end up 63% year over year. The recently passed 
Infrastructure Investment and Jobs Act will provide a long-term tailwind, both directly in the form of funds earmarked for work in our markets, and indirectly as market capacity utilization increases as it is deployed on projects funded through the Act.

We’ve worked through a period with significant challenges to the economy and our business. During this period our team has been focused and disciplined on responsibly bidding and executing work. We are well positioned to take advantage of the improving market dynamics and tailwinds in our market drivers.”

Consolidated Results for Fourth Quarter 2021 Compared to Fourth Quarter 2020

  • Contract revenues were 
    $162.3 million, down 4.6% as compared to 
    $170.2 million. The decrease was primarily driven by the timing and mix of several large marine projects that had driven activity in the prior year, which were not replicated or replaced in the current year quarter. This decrease was partially offset by increased production volumes in our concrete segment due to an increase in activity during 2021, including on several larger jobs in the current year period as compared to the prior year period.
  • Gross profit was 
    $6.6 million, as compared to 
    $21.7 million. Gross profit margin was 4.1%, as compared to 12.8%. The decrease in gross profit dollars and percentage was primarily driven by the decreased activity and volumes in the marine segment which negatively impacted revenue and contributed to an under recovery of indirect costs primarily related to decreased labor and equipment utilization. Decreased project performance in the concrete segment was driven by inefficiencies in executing work from pressured bid margins and COVID-19 related impacts.
  • Selling, General, and Administrative expenses were 
    $16.1 million, as compared to 
    $17.4 million. As a percentage of total contract revenues, SG&A expenses decreased from 10.2% to 9.9%. The decrease in SG&A dollars was driven primarily by a decrease in bonus expense as compared to the prior year period.
  • Operating loss was 
    $8.2 million as compared to operating income of 
    $5.1 million in the prior year period.
  • EBITDA was 
    $(1.9) million, representing a (1.1)% EBITDA margin, as compared to EBITDA of 
    $11.7 million, or a 6.9% EBITDA margin. When adjusted for non-recurring items, adjusted EBITDA for the fourth quarter of 2021 was 
    $0.8 million, representing a 0.5% EBITDA margin. (Please see page 10 of this release for an explanation of EBITDA, Adjusted EBITDA and a reconciliation to the nearest GAAP measure).

Backlog

Backlog of work under contract as of 
December 31, 2021, was 
$590.0 million, which compares with backlog under contract as of 
December 31, 2020, of 
$439.5 million. The fourth quarter 2021 ending backlog was comprised of 
$376.9 million for the marine segment, and 
$213.1 million for the concrete segment. At the end of the fourth quarter 2021, the Company had approximately 
$2.6 billion worth of bids outstanding, including approximately 
$138 million on which it is the apparent low bidder or has been awarded contracts subsequent to the end of the fourth quarter of 2021, of which approximately 
$24 million pertains to the marine segment and approximately 
$114 million to the concrete segment.

“During the fourth quarter, we bid on approximately 
$1.6 billion of work and were successful on approximately 
$180 million of these bids,” continued  Mr. Stauffer. “This resulted in a 1.11 times book-to-bill ratio and a win rate of 11.0%. In the marine segment, we bid on approximately 
$807 million during the fourth quarter 2021 and were successful on approximately 
$70 million, representing a win rate of 8.7% and a book-to-bill ratio of 0.96 times. In the concrete segment we bid on approximately 
$825 million of work and were awarded approximately 
$110 million, representing a win rate of 13.3% and a book-to-bill ratio of 1.23 times.”

Backlog consists of projects under contract that have either (a) not been started, or (b) are in progress but are not yet complete. The Company cannot guarantee that the revenue implied by its backlog will be realized, or, if realized, will result in earnings. Backlog can fluctuate from period to period due to the timing and execution of contracts. Given the typical duration of the Company’s projects, which generally range from three to nine months, the Company’s backlog at any point in time usually represents only a portion of the revenue it expects to realize during a twelve-month period.

Credit Facility

Subsequent to the end of the quarter, the Company amended its Credit Agreement effective for the quarter ending 
December 31, 2021. The goal of this amendment was to provide the Company with a waiver and greater flexibility as it provides for suspension of the leverage ratio and fixed charge coverage ratio for the quarter ending 
December 31, 2021, before reverting back to a leverage ratio not to exceed 3.0 times beginning in the third quarter of 2022, and reverting back to a fixed charge coverage ratio of a minimum of 1.25 times beginning the fourth quarter of 2022. Additionally, the amendment reduces the revolver to 
$42.5 million and provides for paydowns on the revolver by the amount of any cash balances exceeding 
$10 million until delivery of the third quarter 2022 compliance certificate. Capacity created by any such paydowns remains available to the Company. The amendment includes minimum EBITDA requirements for the first and second quarters of 2022. The new fees associated with the amendment are approximately 
$0.4 million and will be amortized over the remaining term of the facility. The Company is pleased with the continued support from its lenders and looks forward to maintaining its excellent relationship with its bank group.

Conference Call Details

Orion Group Holdings will host a conference call to discuss results for the fourth quarter 2021 at 
10:00 a.m. Eastern Time/
9:00 a.m. Central Time on 
Thursday, March 3, 2022. To listen to a live webcast of the conference call, or access the replay, visit the Calendar of Events page of the Investor Relations section of the website at www.oriongroupholdingsinc.com. To participate in the call, please dial (201) 493-6739 and ask for the Orion Group Holdings Conference Call.

About Orion Group Holdings

Orion Group Holdings, Inc., a leading specialty construction company serving the infrastructure, industrial and building sectors, provides services both on and off the water in the continental 
United States
Alaska
Canada and the 
Caribbean Basin through its marine segment and its concrete segment. The Company’s marine segment provides construction and dredging services relating to marine transportation facility construction, marine pipeline construction, marine environmental structures, dredging of waterways, channels and ports, environmental dredging, design, and specialty services. Its concrete segment provides turnkey concrete construction services including pour and finish, dirt work, layout, forming, rebar, and mesh across the light commercial, structural and other associated business areas. The Company is headquartered in 
Houston, Texas with regional offices throughout its operating areas.

Non-GAAP Financial Measures

This press release includes the financial measures “adjusted net income,” “adjusted earnings per share,” “EBITDA,” “Adjusted EBITDA” and “Adjusted EBITDA margin.” These measurements are “non-GAAP financial measures” under rules of the 
Securities and Exchange Commission, including Regulation G. The non-GAAP financial information may be determined or calculated differently by other companies. By reporting such non-GAAP financial information, the Company does not intend to give such information greater prominence than comparable GAAP financial information. Investors are urged to consider these non-GAAP measures in addition to and not in substitute for measures prepared in accordance with GAAP.

Adjusted net income and adjusted earnings per share are not an alternative to net income or earnings per share. Adjusted net income and adjusted earnings per share exclude certain items that management believes impairs a meaningful comparison of operating results. The company believes these adjusted financial measures are a useful adjunct to earnings calculated in accordance with GAAP because management uses adjusted net income available to common stockholders to evaluate the company’s operational trends and performance relative to other companies. Generally, items excluded, are one-time items or items whose timing or amount cannot be reasonably estimated. Accordingly, any guidance provided by the company generally excludes information regarding these types of items.

Orion Group Holdings defines EBITDA as net income before net interest expense, income taxes, depreciation and amortization. Adjusted EBITDA is calculated by adjusting EBITDA for certain items that management believes impairs a meaningful comparison of operating results. Adjusted EBITDA margin is calculated by dividing Adjusted EBITDA for the period by contract revenues for the period. The GAAP financial measure that is most directly comparable to EBITDA and Adjusted EBITDA is net income, while the GAAP financial measure that is most directly comparable to Adjusted EBITDA margin is operating margin, which represents operating income divided by contract revenues. EBITDA, Adjusted EBITDA and Adjusted EBITDA margin are used internally to evaluate current operating expense, operating efficiency, and operating profitability on a variable cost basis, by excluding the depreciation and amortization expenses, primarily related to capital expenditures and acquisitions, and net interest and tax expenses. Additionally, EBITDA, Adjusted EBITDA and Adjusted EBITDA margin provide useful information regarding the Company’s ability to meet future debt service and working capital requirements while providing an overall evaluation of the Company’s financial condition. In addition, EBITDA is used internally for incentive compensation purposes. The Company includes EBITDA, Adjusted EBITDA and Adjusted EBITDA margin to provide transparency to investors as they are commonly used by investors and others in assessing performance. EBITDA, Adjusted EBITDA and Adjusted EBITDA margin have certain limitations as analytical tools and should not be used as a substitute for operating margin, net income, cash flows, or other data prepared in accordance with generally accepted accounting principles in 
the United States, or as a measure of the Company’s profitability or liquidity.

The matters discussed in this press release may constitute or include projections or other forward-looking statements within the meaning of the Private Securities Litigation Reform Act of 1995, the provisions of which the Company is availing itself. Certain forward-looking statements can be identified by the use of forward-looking terminology, such as ‘believes’, ‘expects’, ‘may’, ‘will’, ‘could’, ‘should’, ‘seeks’, ‘approximately’, ‘intends’, ‘plans’, ‘estimates’, or ‘anticipates’, or the negative thereof or other comparable terminology, or by discussions of strategy, plans, objectives, intentions, estimates, forecasts, outlook, assumptions, or goals. In particular, statements regarding future operations or results, including those set forth in this press release, and any other statement, express or implied, concerning future operating results or the future generation of or ability to generate revenues, income, net income, gross profit, EBITDA, Adjusted EBITDA, Adjusted EBITDA margin, or cash flow, including to service debt, and including any estimates, forecasts or assumptions regarding future revenues or revenue growth, are forward-looking statements. Forward looking statements also include estimated project start date, anticipated revenues, and contract options which may or may not be awarded in the future. Forward looking statements involve risks, including those associated with the Company’s fixed price contracts that impacts profits, unforeseen productivity delays that may alter the final profitability of the contract, cancellation of the contract by the customer for unforeseen reasons, delays or decreases in funding by the customer, levels and predictability of government funding or other governmental budgetary constraints, the effects of the ongoing COVID-19 pandemic, and any potential contract options which may or may not be awarded in the future, and are at the sole discretion of award by the customer. Past performance is not necessarily an indicator of future results. In light of these and other uncertainties, the inclusion of forward-looking statements in this press release should not be regarded as a representation by the Company that the Company’s plans, estimates, forecasts, goals, intentions, or objectives will be achieved or realized. Readers are cautioned not to place undue reliance on these forward-looking statements, which speak only as of the date hereof. The Company assumes no obligation to update information contained in this press release whether as a result of new developments or otherwise.

Please refer to the Company’s Annual Report on Form 10-K, filed on 
March 2, 2021, which is available on its website at www.oriongroupholdingsinc.com or at the 
SEC’s website at www.sec.gov, for additional and more detailed discussion of risk factors that could cause actual results to differ materially from our current expectations, estimates or forecasts.

Orion Group Holdings, Inc. and Subsidiaries

Condensed Statements of Operations

(In Thousands, Except Share and Per Share Information)

(Unaudited)


Three months ended


Twelve months ended


December 31,


December 31,


2021


2020


2021


2020

Contract revenues


162,269


170,176


601,360


709,942


Costs of contract revenues


155,636


148,476


560,393


625,239


Gross profit


6,633


21,700


40,967


84,703


Selling, general and administrative expenses


16,103


17,440


60,181


65,091


Amortization of intangible assets


380


518


1,521


2,070


Gain on disposal of assets, net


(1,655

)


(1,310

)


(11,418

)


(9,044

)

Operating (loss) income


(8,195

)


5,052


(9,317

)


26,586


Other (expense) income:


Other income


40


96


199


347


Interest income


63


32


136


183


Interest expense


(570

)


(1,198

)


(5,076

)


(4,920

)

Other expense, net


(467

)


(1,070

)


(4,741

)


(4,390

)

(Loss) income before income taxes


(8,662

)


3,982


(14,058

)


22,196


Income tax expense


161


316


502


1,976


Net (loss) income


$

(8,823

)


$

3,666


$

(14,560

)


$

20,220


Basic (loss) earnings per share


$

(0.29

)


$

0.12


$

(0.47

)


$

0.67


Diluted (loss) earnings per share


$

(0.29

)


$

0.12


$

(0.47

)


$

0.67


Shares used to compute (loss) income per share:


Basic


30,930,000


30,426,454


30,763,527


30,122,362


Diluted


30,930,000


30,427,940


30,763,527


30,122,362


Orion Group Holdings, Inc. and Subsidiaries

Selected Results of Operations

(In Thousands, Except Share and Per Share Information)

(Unaudited)


Three months ended December 31,


2021


2020


Amount


Percent


Amount


Percent


(dollar amounts in thousands)


Contract revenues


Marine segment


Public sector


$

42,720


58.5


%

$

58,669


60.1


%

Private sector


30,368


41.5


%


38,955


39.9


%

Marine segment total


$

73,088


100.0


%

$

97,624


100.0


%

Concrete segment


Public sector


$

1,365


1.5


%

$

4,995


6.9


%

Private sector


87,816


98.5


%


67,557


93.1


%

Concrete segment total


$

89,181


100.0


%

$

72,552


100.0


%

Total


$

162,269


$

170,176


Operating (loss) income


Marine segment


$

(729

)


(1.0

)

%

$

8,231


8.4


%

Concrete segment


(7,466

)


(8.4

)

%


(3,179

)


(4.4

)

%

Total


$

(8,195

)


$

5,052


Twelve months ended December 31,


2021


2020


Amount


Percent


Amount


Percent


(dollar amounts in thousands)


Contract revenues


Marine segment


Public sector


$

164,636


62.4


%

$

240,353


61.9


%

Private sector


99,279


37.6


%


147,820


38.1


%

Marine segment total


$

263,915


100.0


%

$

388,173


100.0


%

Concrete segment


Public sector


$

14,945


4.4


%

$

41,853


13.0


%

Private sector


322,500


95.6


%


279,916


87.0


%

Concrete segment total


$

337,445


100.0


%

$

321,769


100.0


%

Total


$

601,360


$

709,942


Operating income (loss)


Marine segment


$

5,760


2.2


%

$

29,815


7.7


%

Concrete segment


(15,077

)


(4.5

)

%


(3,229

)


(1.0

)

%

Total


$

(9,317

)


$

26,586


Orion Group Holdings, Inc. and Subsidiaries

Reconciliation of Adjusted Net Income (Loss)

(In thousands except per share information)

(Unaudited)


Three months ended


Twelve months ended


December 31,


December 31,


2021


2020


2021


2020

Net (loss) income


$

(8,823

)


$

3,666


$

(14,560

)


$

20,220


One-time charges and the tax effects:


ERP implementation


2,103


692


4,925


1,488


ISG initiative


369


Severance


96


55


96


175


Costs related to debt extinguishment


2,062


Insurance recovery on disposal, net


(2,859

)

Recovery on disputed receivable


(898

)

Net loss (gain) on 
Tampa property sale


234


(6,435

)


Tax rate of 23% applied to one-time charges (1)


(560

)


(172

)


(149

)


397


Total one-time charges and the tax effects


1,873


575


499


(1,328

)

Federal and state tax valuation allowances


1,635


(722

)


3,294


(4,584

)

Adjusted net income


$

(5,315

)


$

3,519


$

(10,767

)


$

14,308


Adjusted EPS


$

(0.17

)


$

0.12


$

(0.35

)


$

0.47


(1)


Items are taxed discretely using the Company’s blended tax rate.

Orion Group Holdings, Inc. and Subsidiaries

Adjusted EBITDA and Adjusted EBITDA Margin Reconciliations

(In Thousands, Except Margin Data)

(Unaudited)


Three months ended


Year ended


December 31,


December 31,


2021


2020


2021


2020


Net (loss) income


$

(8,823

)


$

3,666


$

(14,560

)


$

20,220


Income tax expense


161


316


502


1,976


Interest expense, net


507


1,166


4,940


4,737


Depreciation and amortization


6,290


6,555


25,430


27,217


EBITDA (1)


(1,865

)


11,703


16,312


54,150


Stock-based compensation


247


111


2,401


1,998


ERP implementation


2,103


692


4,925


1,488


ISG initiative


369


Severance


96


55


96


175


Insurance recovery on disposal, net


(2,859

)


Recovery on disputed receivable


(898

)


Net loss (gain) on 
Tampa property sale


234


(6,435

)


Adjusted EBITDA (2)


$

815


$

12,561


$

17,299


$

54,423


Operating income margin


(5.1

)

%


3.0

%


(1.4

)

%


3.8


%

Impact of depreciation and amortization


3.9


%


3.9

%


4.2


%


3.8


%

Impact of stock-based compensation


0.2


%


0.1

%


0.4


%


0.3


%

Impact of ERP implementation


1.3


%


0.4

%


0.8


%


0.2


%

Impact of ISG initiative


%


%


%


0.1


%

Impact of severance


0.1


%


%


%


%

Impact of insurance recovery on disposal, net


%


%


%


(0.4

)

%

Impact of recovery on disputed receivable


%


%


%


(0.1

)

%

Impact of net loss (gain) on 
Tampa property sale


0.1


%


%


(1.1

)

%


%

Adjusted EBITDA margin (2)


0.5


%


7.4

%


2.9


%


7.7


%


(1)


EBITDA is a non-GAAP measure that represents earnings before interest, taxes, depreciation and amortization.


(2)


Adjusted EBITDA is a non-GAAP measure that represents EBITDA adjusted for stock-based compensation, ERP implementation, the ISG initiative, severance, insurance recovery on disposal, net, recovery on a disputed receivable and the net loss (gain) on the 
Tampa property sale. Adjusted EBITDA margin is a non-GAAP measure calculated by dividing Adjusted EBITDA by contract revenues.

Orion Group Holdings, Inc. and Subsidiaries

Adjusted EBITDA and Adjusted EBITDA Margin Reconciliations by Segment

(In Thousands, Except Margin Data)

(Unaudited)


Marine


Concrete


Three months ended


Three months ended


December 31,


December 31,


2021


2020


2021


2020


Operating (loss) income (1)


(729

)


8,231


(7,466

)


(3,179

)


Other income (expense), net


40


98


(1

)


Depreciation and amortization


4,375


4,306


1,915


2,248


EBITDA (2)


3,686


12,635


(5,551

)


(932

)


Stock-based compensation


227


74


20


37


ERP implementation


935


378


1,168


314


Severance


80


55


16


Net loss on 
Tampa property sale


234


Adjusted EBITDA (3)


$

5,162


$

13,142


$

(4,347

)


$

(581

)


Operating income margin


(1.0

)

%


8.4


%


(8.3

)

%


(4.4

)

%

Impact of other income (expense), net


0.1


%


0.1


%


%


%

Impact of depreciation and amortization


6.0


%


4.4


%


2.1


%


3.1


%

Impact of stock-based compensation


0.3


%


0.1


%


%


0.1


%

Impact of ERP implementation


1.3


%


0.4


%


1.3


%


0.4


%

Impact of severance


0.1


%


0.1


%


%


%

Impact of net loss on 
Tampa property sale


0.3


%


%


%


%

Adjusted EBITDA margin (3)


7.1


%


13.5


%


(4.9

)

%


(0.8

)

%


Marine


Concrete


Year ended


Year ended


December 31,


December 31,


2021


2020


2021


2020


Operating income (loss) (1)


5,760


29,815


(15,077

)


(3,229

)


Other income (expense), net


199


346


2


Depreciation and amortization


17,287


18,369


8,143


8,847


EBITDA (2)


23,246


48,530


(6,934

)


5,620


Stock-based compensation


2,306


1,841


95


157


ERP implementation


2,161


795


2,764


693


ISG initiative


190


179


Severance


80


81


16


94


Insurance recovery on disposal, net


(2,859

)


Recovery on disputed receivable


(898

)


Net gain on 
Tampa property sale


(6,435

)


Adjusted EBITDA (3)


$

21,358


$

47,680


$

(4,059

)


$

6,743


Operating income margin


2.2


%


7.7


%


(4.5

)

%


(1.0

)

%

Impact of other income (expense), net


%


0.1


%


%


%

Impact of depreciation and amortization


6.6


%


4.7


%


2.4


%


2.7


%

Impact of stock-based compensation


0.9


%


0.5


%


0.1


%


0.1


%

Impact of ERP implementation


0.8


%


0.2


%


0.8


%


0.2


%

Impact of ISG initiative


%


%


%


0.1


%

Impact of severance


%


%


%


%

Impact of insurance recovery on disposal, net


%


(0.7

)

%


%


%

Impact of recovery on disputed receivable


%


(0.2

)

%


%


%

Impact of net gain on 
Tampa property sale


(2.4

)

%


%


%


%

Adjusted EBITDA margin (3)


8.1


%


12.3


%


(1.2

)

%


2.1


%


(1)


In connection with the preparation of the financial statements for the quarter ended 
December 31, 2021, the Company has identified and corrected certain immaterial errors in segment reporting for all periods presented. Specifically, certain corporate overhead costs previously recorded to the marine segment as part of operating income (loss) and allocated from the marine segment to the concrete segment below operating income in the other income (expense) line have been allocated from the marine segment to the concrete segment as part of the determination of operating income for each segment.


(2)


EBITDA is a non-GAAP measure that represents earnings before interest, taxes, depreciation and amortization.


(3)


Adjusted EBITDA is a non-GAAP measure that represents EBITDA adjusted for stock-based compensation, ERP implementation, the ISG initiative, severance, insurance recovery on disposal, net, recovery on a disputed receivable and the net loss (gain) on the 
Tampa property sale. Adjusted EBITDA margin is a non-GAAP measure calculated by dividing Adjusted EBITDA by contract revenues.

Orion Group Holdings, Inc. and Subsidiaries

Condensed Statements of Cash Flows Summarized

(In Thousands)

(Unaudited)


Three months ended


Year ended


December 31,


December 31,


2021


2020


2021


2020

Net (loss) income


$

(8,823

)


$

3,666


$

(14,560

)


$

20,220


Adjustments to remove non-cash and non-operating items


5,988


7,005


22,726


26,338


Cash flow from net income after adjusting for non-cash and non-operating items


(2,835

)


10,671


8,166


46,558


Change in operating assets and liabilities (working capital)


(1,336

)


(3,015

)


(8,097

)


(526

)

Cash flows (used in) provided by operating activities


$

(4,171

)


$

7,656


$

69


$

46,032


Cash flows (used in) provided by investing activities


$

(3,860

)


$

(932

)


$

10,629


$

(3,129

)

Cash flows provided by (used in) financing activities


$

19,431


$

(7,867

)


$

6


$

(42,400

)


Capital expenditures (included in investing activities above)


$

(5,381

)


$

(5,250

)


$

(16,975

)


$

(14,694

)


Orion Group Holdings, Inc. and Subsidiaries

Condensed Statements of Cash Flows

(In Thousands)

(Unaudited)


Year ended December 31,


2021


2020

Cash flows from operating activities


Net (loss) income


$

(14,560

)


$

20,220


Adjustments to reconcile net (loss) income to net cash used in operating activities:


Depreciation and amortization


22,608


23,893


Amortization of ROU operating leases


5,102


5,874


Amortization of ROU finance leases


2,822


3,324


Write-off of debt issuance costs upon debt modification


790


Amortization of deferred debt issuance costs


430


763


Deferred income taxes


(9

)


17


Stock-based compensation


2,401


1,998


Gain on disposal of assets, net


(11,418

)


(6,185

)

Gain on involuntary disposition of assets, net


(2,859

)

Allowance for credit losses


(487

)

Change in operating assets and liabilities, net of effects of acquisitions:


Accounts receivable


4,703


23,587


Income tax receivable


14


543


Inventory


371


148


Prepaid expenses and other


143


(1,070

)

Contract assets


3,742


9,118


Accounts payable


589


(22,015

)

Accrued liabilities


(6,544

)


11,092


Operating lease liabilities


(4,940

)


(5,399

)

Income tax payable


(38

)


(884

)

Contract liabilities


(6,137

)


(15,646

)

Net cash provided by operating activities


69


46,032


Cash flows from investing activities:


Proceeds from sale of property and equipment


27,164


5,944


Purchase of property and equipment


(16,975

)


(14,694

)

Contributions to CSV life insurance


(99

)

Insurance claim proceeds related to property and equipment


440


5,720


Net cash provided by (used in) investing activities


10,629


(3,129

)

Cash flows from financing activities:


Borrowings from Credit Facility


53,000


10,000


Payments made on borrowings from Credit Facility


(49,120

)


(48,204

)

Loan costs from Credit Facility


(389

)

Payments of finance lease liabilities


(3,035

)


(3,619

)

Purchase of vested stock-based awards


(949

)


(188

)

Exercise of stock options


110


Net cash provided by (used in) financing activities


6


(42,400

)

Net change in cash, cash equivalents and restricted cash


10,704


503


Cash, cash equivalents and restricted cash at beginning of period


1,589


1,086


Cash, cash equivalents and restricted cash at end of period


$

12,293


$

1,589


Orion Group Holdings, Inc. and Subsidiaries

Condensed Balance Sheets

(In Thousands, Except Share and Per Share Information)


December 31,


December 31,


2021


2020


(Unaudited)


ASSETS


Current assets:


Cash and cash equivalents


$

12,293


1,589


Accounts receivable:


Trade, net of allowance for credit losses of 
$323 and 
$411, respectively


88,173


96,369


Retainage


41,379


36,485


Income taxes receivable


405


419


Other current


17,585


59,492


Inventory


1,428


1,548


Contract assets


28,529


32,271


Prepaid expenses and other


8,142


7,229


Total current assets


197,934


235,402


Property and equipment, net of depreciation


106,654


125,497


Operating lease right-of-use assets, net of amortization


14,686


18,874


Financing lease right-of-use assets, net of amortization


14,561


12,858


Inventory, non-current


5,418


6,455


Intangible assets, net of amortization


8,556


10,077


Deferred income tax asset


41


70


Other non-current


3,900


4,956


Total assets


$

351,750


$

414,189


LIABILITIES AND STOCKHOLDERS’ EQUITY


Current liabilities:


Current debt, net of issuance costs


$

39,141


$

4,344


Accounts payable:


Trade


48,217


48,252


Retainage


923


716


Accrued liabilities


38,594


84,637


Income taxes payable


601


639


Contract liabilities


26,998


33,135


Current portion of operating lease liabilities


3,857


4,989


Current portion of financing lease liabilities


3,406


3,901


Total current liabilities


161,737


180,613


Long-term debt, net of debt issuance costs


259


29,523


Operating lease liabilities


11,637


14,537


Financing lease liabilities


10,908


8,376


Other long-term liabilities


18,942


19,837


Deferred income tax liability


169


207


Interest rate swap liability


1,602


Total liabilities


203,652


254,695


Stockholders’ equity:


Preferred stock — 
$0.01 par value, 10,000,000 authorized, none issued


Common stock — 
$0.01 par value, 50,000,000 authorized, 31,712,457 and 31,171,804 issued; 31,001,226 and 30,460,573 outstanding at 
December 31, 2021 and 
December 31, 2020, respectively


317


312


Treasury stock, 711,231 shares, at cost, as of 
December 31, 2021 and 
December 31, 2020, respectively


(6,540

)


(6,540

)

Accumulated other comprehensive loss


(1,602

)

Additional paid-in capital


185,881


184,324


Retained loss


(31,560

)


(17,000

)

Total stockholders’ equity


148,098


159,494


Total liabilities and stockholders’ equity


$

351,750


$

414,189


Orion Group Holdings Inc.
Francis Okoniewski, VP Investor Relations
(346) 616-4138
www.oriongroupholdingsinc.com

-OR-

INVESTOR RELATIONS COUNSEL:

The Equity Group Inc.
Jeremy Hellman, CFA (804) 595-2083

Source: 
Orion Group Holdings, Inc.