STAMFORD, Conn., Sept. 28, 2023 (GLOBE NEWSWIRE) — Eagle Bulk Shipping Inc. (NYSE: EGLE) (“Eagle Bulk”, “Eagle”, or the “Company”), one of the world’s largest owner-operators within the midsize drybulk vessel segment, announced today that it will report its financial results for the third quarter ending September 30, 2023, after the close of stock market trading on November 2, 2023. Members of Eagle’s senior management team will host a call at 8:00 a.m. ET on Friday, November 3, 2023 in order to discuss company results and provide an update on market fundamentals.
A live webcast of the call will be available on the Investor Relations page of the Company’s website at ir.eagleships.com. To access the call by phone, please register at https://register.vevent.com/register/BIee839edd63884046b37812fb660d9ebb and you will be provided with dial-in details. A replay of the webcast will be available on the Investor Relations page of Eagle’s website.
About Eagle Bulk Shipping Inc.
Eagle Bulk Shipping Inc. (“Eagle” or the “Company”) is a US-based, fully integrated shipowner-operator providing global transportation solutions to a diverse group of customers including miners, producers, traders, and end users. Headquartered in Stamford, Connecticut, with offices in Singapore and Copenhagen, Eagle focuses exclusively on the versatile midsize drybulk vessel segment and owns one of the largest fleets of Supramax / Ultramax vessels in the world. The Company performs all management services in-house (including strategic, commercial, operational, technical, and administrative) and employs an active-management approach to fleet trading with the objective of optimizing revenue performance and maximizing earnings on a risk-managed basis. For further information, please visit our website: www.eagleships.com.
Brightline, the private passenger rail service in Florida, has began operating its high speed train lines to connect South Florida to Orlando today. This new route will link two major finance hubs in the state and make travel between them faster and easier.
Brightline’s trains have currently been running between Miami, Fort Lauderdale, and West Palm Beach. The expansion to Orlando, which opened on September 22, 2023, stretches the service across the state and connects it to one of Florida’s largest business and tourism centers.
According to Brightline’s president Patrick Goddard, the new route “will transform Central Florida into a connected region” and link its economy even closer with South Florida’s. This enhanced connectivity between the region’s financial sectors will likely lead to increased business deals, partnerships, and investment.
In particular, the new Brightline connection will simplify travel between Palm Beach County and Orlando. Palm Beach is home to a cluster of hedge funds, private equity firms, and other financial companies. Orlando similarly has a thriving financial industry, with investment firms, banks, and financial technology companies based in the metro area.
With a Brightline station at Orlando International Airport, it is now easier than ever for finance professionals to commute between the two cities for meetings and conferences. This will allow greater collaboration within Florida’s finance community.
One major finance event that will benefit is NobleCon19, an investor conference focusing on emerging growth companies. NobleCon19 is scheduled for December 3-5, 2023 in Boca Raton, located in Palm Beach County. The conference attracts finance experts from across the country, including professionals based in the Orlando area.
Once the new Brightline route opened, Orlando-based investors, analysts, and executives interested in attending NobleCon now have a convenient 3.5 hour train trip directly from Orlando International Airport to Boca Raton. This is faster than driving, which takes over 4.5 hours in traffic. It is also quicker than Amtrak’s routes connecting the two cities, which take 5-7 hours.
Brightline’s president Patrick Goddard noted that the train service will “make it easier for all Floridians and visitors to experience the best our state has to offer.” This will certainly include connecting finance pros between hubs like Orlando and Palm Beach County.
Overall, Brightline’s expansion to Orlando has linked key financial centers across Florida. For financial companies and professionals, it will facilitate easier networking, stronger partnerships, and more dealmaking. The launch of the new route in September 2023 is a major plus for Florida’s finance sector.
Oil prices climbed over 1% Friday after Russia banned diesel and gasoil exports. The move aims to increase Russia’s domestic supply but reduces the global oil market.
West Texas Intermediate crude climbed back above $90 per barrel following the news. Brent futures also gained, topping $94. Energy analysts say the Russian ban will likely sustain upward pressure on oil prices near-term.
Russia is a leading diesel producer globally. How much the export halt affects US fuel prices depends on how long it remains in place, says Angie Gildea, KPMG’s head of energy. But any drop in total global oil supply without lower demand will lift prices.
The ban comes as US gas prices retreat from 2022 highs, now averaging $3.86 nationally. Diesel is around $4.58 per gallon. Diesel powers key transport like trucks and ships. The loss of Russian exports could spur further diesel spikes.
However, gas prices may keep easing for most of the US, says Tom Kloza of OPIS. Western states could see increases.
Kloza believes crude may rise $2 to $3 per barrel in the near-term. But gasoline margins are poised to shrink even if oil nears $100 again. The US transition to cheaper winter fuel could also limit price hikes.
Goldman Sachs sees Brent potentially hitting $100 per barrel in the next 12 months. Sharper inventory declines are likely as OPEC supply falls but demand rises, says Goldman’s head of oil research.
The White House has criticized OPEC+ for the production cuts. US gasoline demand recently hit a seasonal record high over 9.5 million barrels per day. Jet fuel use is also rebounding towards pre-pandemic levels.
Strong demand, paired with reduced Russian oil exports, leaves the market more exposed to supply disruptions. Hurricane Ian showed how quickly price spikes can occur.
The Biden Administration plans to keep tapping the Strategic Petroleum Reserve into 2023 to restrain cost increases. But further export bans or output reductions could overwhelm these efforts.
While tighter global fuel supplies might not directly translate to the US, Russia’s latest move signals volatility will persist. Energy prices remain sensitive to supply and demand shifts.
More export cuts could accelerate oil’s return to triple-digits. But for US drivers, the road ahead on gas costs seems mixed. Falling margins and seasonal shifts could limit prices, but risks linger.
Shares of FedEx jumped over 5% on Thursday after the shipping giant reported better-than-expected fiscal first quarter results. The stock rally comes amid a broader market selloff, with investors cheering FedEx’s improved profitability and outlook.
FedEx earned $4.55 per share last quarter, handily beating analyst forecasts of $3.70. Though revenue declined 6.5% year-over-year to $21.7 billion, the company boosted its operating margin to 7.3%, surpassing expectations.
The strong quarter was driven by effective cost-cutting under CEO Raj Subramaniam and higher shipping volumes as key rivals dealt with challenges. FedEx gained U.S. market share in recent months which it expects to retain.
Management raised full-year EPS guidance to a range of $17.00 to $18.50, up from prior outlook of $16.50 to $18.50. The company also announced new demand surcharges for the holiday peak season and a January rate increase.
FedEx continued benefiting from its DRIVE cost savings program which seeks $1.8 billion in total reductions. Steps like reducing flights, realigning staff and shifting to one daily delivery wave boosted efficiency.
The Ground segment was a standout with a 59% jump in operating income as volumes improved. The Express unit grew operating income 18% despite lower revenue. But the Freight division saw income drop 26% on reduced shipments.
The outperformance comes as labor negotiations weighed on service levels at rival UPS. UPS disclosed it lost 1 million packages daily to other carriers, which FedEx said it captured 400,000 of. The bankruptcy of trucking company Yellow also benefited FedEx.
Demand for logistics and shipping services remains resilient despite economic uncertainty. And challenges at competitors created an opening for FedEx to flex its network strength and snatch market share. It expects to maintain most new volumes.
The results suggest FedEx has turned a corner after recent struggles with costs and service issues. The company’s turnaround plan is clearly bearing fruit. And investors have taken notice, bidding the stock price higher after the earnings beat.
FedEx shares have now rebounded nearly 20% from 52-week lows hit in June. The stock remains down 25% year-to-date amid broader market volatility. But it has outpaced the S&P 500 recently.
Thursday’s post-earnings pop provides encouragement that FedEx may sustain its momentum if execution remains solid. But the company still faces macro uncertainty and must continue improving productivity.
The holiday quarter is crucial for delivery firms like FedEx. The company aims to avoid last year’s service shortfalls. Management expressed confidence its initiatives will enable strong peak season performance.
While risks remain, FedEx has proactively adapted its network for holiday demand spikes. And it should reap continued benefits from rival struggles if recent market share gains stick.
Ongoing cost discipline also remains key. As higher rates kick in, boosting revenue, FedEx must maintain focus on trimming unnecessary expenses. Investors want to see margins continue expanding.
The quarterly beat suggests the shipping titan is making strides in its turnaround bid under new leadership. If FedEx sustains stronger operational execution, its stock price could continue recovering lost ground.
But the company must keep innovating and finding efficiency gains in the rapidly evolving logistics arena. Satisfying customers and shareholders means continually improving services and profitability, even in a weakened economic climate.
The United Auto Workers union made history by simultaneously going on strike against Detroit’s Big 3 automakers – Ford, General Motors and Stellantis. For the first time, UAW is picketing factories across Michigan and Ohio in a dramatic show of force to win contract demands.
On the picket lines are 13,000 auto workers who assemble some of America’s most storied vehicles, including the Ford F-150 pickup, the Jeep Wrangler SUV and the Chevy Silverado truck. Their walkout could reverberate through the economy if dealer inventories dwindle and vehicle production stalls. But UAW contends this risky stand is necessary.
The union is insisting on higher wages after years of concessions, the restoration of pensions and cost-of-living raises to combat high inflation. But the automakers reject these proposals as unaffordable, warning they could force vehicle price increases.
This high-stakes standoff will shape the future of the legendary UAW and the Detroit automakers as they undergo a historic transition from internal combustion engines to electric vehicles. It also tests President Biden’s promise to be the most pro-labor president in history.
Rather than initiate a full-scale walkout, the union has targeted key plants to pressure automakers to raise their offers while preserving UAW’s $825 million strike fund. Top negotiators remain far apart, with the automakers offering 20% raises over 4 years versus the union’s demand of 36%.
On picket lines in Michigan and Ohio, workers want their pay and benefits restored after bailing out the automakers during tough times over the past decade. But executives counter their offers are strong given economic uncertainty.
UAW’s escalation coincides with a new, more aggressive approach under President Shawn Fain. The union aims to regain some of the concessions made during the Great Recession that preserved the automakers but cost workers.
With UAW flexing its muscles more forcefully, Motor City has become ground zero for labor’s resurgence. All eyes are on Detroit as its workers unite to reshape their contract. The outcome will echo through the auto industry and economy at large.
UAW insists the automakers can afford their proposals, arguing labor costs are minimal compared to profits and executive pay. But Ford, GM and Stellantis contend ballooning expenses will destroy their competitiveness against foreign automakers operating U.S. plants.
This dicey labor dispute encapsulates the shifting power dynamics between America’s workers and corporations. Coming out of the pandemic, unions are demanding a greater share of profits across industries.
The auto sector highlights this trend with UAW navigating a precarious situation. It must balance restoring worker pay and benefits while avoiding costs that could jeopardize the automakers’ stability.
UAW’s last major strike against GM lasted over a month in 2019, costing the company billions. With UAW now pressuring all three automakers concurrently, the economic risks are amplified.
Beyond pay, the union aims to secure jobs for members as Ford, GM and Stellantis scale EV production. This includes unionizing joint venture battery plants that represent the auto industry’s future.
UAW vows to hold the picket line for as long as it takes to win an equitable contract. With UAW doubling down on more aggressive collective bargaining, Detroit is at the epicenter of labor’s resurgence.
The outcome of the auto showdown will determine UAW’s direction. It will also impact America’s manufacturing landscape and the Biden administration’s pro-union bona fides. All eyes are on Motor City as workers stand united.
The United Auto Workers (UAW) union is barreling towards a confrontation with Detroit automakers as contracts for 145,000 members expire Thursday night. With little progress made in negotiations so far, the UAW is planning targeted strikes to bring production to a halt.
The contracts cover union workers at Ford, General Motors and Stellantis, which operates the Chrysler, Dodge, Jeep and Ram brands. If new four-year agreements are not reached by the 11:59 pm deadline, the UAW will initiate selective walkouts aimed at crippling operations.
According to UAW President Shawn Fain, the union will announce which unspecified facilities will strike at 10 pm Thursday absent any last-minute deals. He confirmed the UAW does not plan to continue bargaining on Friday if it moves forward with work stoppages.
Experts say the UAW could paralyze North American auto output quickly by striking only one or two key plants per automaker. For example, halting production at a couple engine and transmission factories could idle up to three-quarters of assembly lines in less than a week.
This targeted approach allows the UAW to conserve its $825 million strike fund, which would drain rapidly if all 145,000 members walked out simultaneously. Members on strike receive $500 weekly from the fund.
Fain has demanded an immediate 20% raise in the first year of new contracts, plus 5% hikes in each subsequent year of the 4-year deal. But automakers have proposed more modest increases in the range of 17-20% over the life of the contract.
The UAW is also seeking to limit the use of temporary workers, who receive lower pay and fewer benefits compared to permanent employees. This has emerged as a major sticking point, especially with Stellantis.
All automakers stated they aim to reach agreements before midnight to avert walkouts. There remains a small chance of an eleventh-hour deal, though Fain insisted the deadline is firm and the UAW is prepared to strike.
The union could opt to reach separate contracts with one or two automakers while targeting the other(s) for strikes. Stellantis is seen as most prone to a walkout due its greater temporary workforce and past corruption scandals tying executives to union leaders.
Ford has not had a national strike since 1976, giving it leverage in negotiations. A short-term extension past Thursday is possible if talks are progressing, but Fain has repeatedly said 11:59 pm is the “deadline, not a reference point.”
Industry experts predict almost certain strikes at some Stellantis facilities. Potential targets include transmission plants in Indiana and Michigan. Shutting down a couple engine or transmission factories per automaker could rapidly idle assembly lines across North America.
In the event of a walkout, Fain instructed members not on strike to remain working under the expired contract rather than an extension. This could allow non-striking workers to collect state unemployment benefits and ease pressure on the UAW strike fund.
With the auto industry struggling with shortages and high inflation, a prolonged strike could have devastating consequences. But workers want a fair share of record profits, amid union concerns temporary employees erode hard-fought gains.
If negotiators walk away prior to midnight as talks deteriorate, last-ditch deals become unlikely. The two sides remain far apart on critical issues with hours left before contracts lapse. Against this backdrop, targeted strikes at U.S. auto plants seem imminent.
Tesla’s new Dojo supercomputer could unlock tremendous value for investors, according to analysts at Morgan Stanley. The bank predicts Dojo could boost Tesla’s market valuation by over $600 billion.
Morgan Stanley set a sky-high 12-18 month price target of $400 per share for Tesla based on Dojo’s potential. This implies a market cap of $1.39 trillion, which is nearly 76% above Tesla’s current $789 billion valuation.
Tesla only began producing Dojo in July 2022 but plans to invest over $1 billion in the powerful supercomputer over the next year. Dojo will be used to train artificial intelligence models for autonomous driving.
Morgan Stanley analysts estimate Dojo could enable robotaxis and software services that extend far beyond Tesla’s current business of vehicle manufacturing. The bank nearly doubled its 2040 revenue projection for Tesla’s network services division from $157 billion to $335 billion thanks to Dojo.
By licensing self-driving software powered by Dojo to third-party transportation fleets, Tesla could generate tremendous high-margin revenues. Morgan Stanley sees network services delivering over 60% of Tesla’s core earnings by 2040, up from just 30% in 2030.
Thanks to this upside potential, Morgan Stanley upgraded Tesla stock from Equal-Weight to Overweight. The analysts stated “Dojo completely changes the growth trajectory for Tesla’s autonomy business.”
At its current $248.50 share price, Tesla trades at a lofty forward P/E ratio of 57.9x compared to legacy automakers like Ford at 6.3x and GM at 4.6x. But if Morgan Stanley’s bull case proves accurate, Tesla could rapidly grow into its valuation over the next decade.
In summary, Tesla’s AI advantage with Dojo makes the stock’s premium valuation more reasonable. Investors buying at today’s prices could reap huge gains if Dojo unlocks a new $600 billion revenue stream in autonomous mobility services.
The Power and Potential of Dojo
Dojo represents a massive investment by Tesla as it aims to lead the future of autonomous driving. The specialized supercomputer is designed to train deep neural networks using vast amounts of visual data from Tesla’s fleet of vehicles.
This differentiated AI training will allow Tesla to improve perceptions for full self-driving at a faster pace. As self-driving functionality becomes more robust, Tesla can unlock new revenue opportunities.
Morgan Stanley analyst Adam Jones stated: “If Dojo can help make cars ‘see’ and ‘react,’ what other markets could open up? Think of any device at the edge with a camera that makes real-time decisions based on its visual field.”
Dojo’s processing power will permit Tesla to develop advanced simulations that speed up testing. The supercomputer’s capacity is expected to exceed that of the top 200 fastest supercomputers combined.
Tesla claims Dojo will drive down the costs of training networks by orders of magnitude. This efficiency can translate into higher margins as costs drop for autonomous AI development.
Dojo was designed in-house by Tesla AI director Andrej Karpathy and his team. Karpathy called Dojo the “most exciting thing I’ve seen in my career.” With Dojo, Tesla is aiming to reduce reliance on external cloud providers like Google and Amazon.
Morgan Stanley Boosts Tesla Price Target by 60%
The potential of monetizing Tesla’s self-driving lead through Dojo led analysts at Morgan Stanley to dramatically increase their expectations.
Led by analyst Adam Jones, Morgan Stanley boosted its 12-18 month price target on Tesla stock by 60% to $400 per share. This new level implies a market value for Tesla of nearly $1.39 trillion.
Hitting this price target would mean Tesla stock gaining about 76% from its current level around $248.50. Tesla shares jumped 6% on Monday following the report as investors reacted positively.
Jones explained the sharply higher price target by stating: “Dojo completely changes the growth trajectory for Tesla’s autonomy business.”
He expects Dojo will open up addressable markets for Tesla that “extend well beyond selling vehicles at a fixed price.” In other words, Dojo can turn Tesla into more of a high-margin software and services provider.
HOUSTON, July 27, 2023 (GLOBE NEWSWIRE) — Great Lakes Dredge & Dock Corporation (“Great Lakes” or the “Company”) (NASDAQ: GLDD), the largest provider of dredging services in the United States, announced today the signing of the first ever subcontract for procurement of rock for a U.S. offshore wind farm with Carver Sand & Gravel LLC (“Carver”), a U.S. quarry in the state of New York.
Through this subcontract, Great Lakes will use rock produced in the State of New York to provide scour protection for offshore wind turbine foundations, and substations at Equinor (NYSE: EQNR) and bp’s (NYSE: bp) Empire Wind I and Empire Wind II wind farms. The rock will be quarried locally, transported to the quayside on the Hudson River, and loaded onto Great Lakes’ rock installation vessel, the Acadia, which will sail to the wind farms to install the rock starting in 2025.
Great Lakes and Carver will be developing the first U.S. rock supply chain for offshore wind, including the quarry producing the rock, the stockpiling and transportation of the rock to the quayside, the port and loading facilities that will load the rock installation vessel, and other facilities along the Hudson River that will help guide the vessel in the riverway.
Eleni Beyko, Great Lakes’ Senior Vice President, U.S. Offshore Wind, commented, “This is a significant milestone for Great Lakes, our clients, Equinor, and bp, as well as Carver. We have worked closely with Equinor and bp to develop this rock supply chain for the Empire Wind projects to deliver local content from the State of New York. With safety and quality as our top priorities, we will be supporting the local communities by creating local jobs and stimulating economic activity in the state of New York.”
“Building the offshore wind industry from the ground-up in the U.S. centers on strategic private-public partnerships to not only deliver clean, renewable energy but also bring forward significant economic benefits and good-paying jobs,” said NY State Energy Research & Development Authority, President and CEO Doreen M. Harris. “The subcontract between Great Lakes and Carver is a great example of how New York’s offshore wind projects, such as Equinor and bp’s Empire Wind, continue to drive industry firsts with major investments in existing New York businesses and workers that will build the American offshore wind supply chain providing a huge win for all involved.”
The Company Great Lakes Dredge & Dock Corporation is the largest provider of dredging services in the United States. In addition, Great Lakes is fully engaged in expanding its core business into the rapidly developing offshore wind energy industry. The Company has a long history of performing significant international projects. The Company employs experienced civil, ocean and mechanical engineering staff in its estimating, production and project management functions. In its over 133-year history, the Company has never failed to complete a marine project. Great Lakes owns and operates the largest and most diverse fleet in the U.S. dredging industry, comprised of approximately 200 specialized vessels. Great Lakes has a disciplined training program for engineers that ensures experienced-based performance as they advance through Company operations. The Company’s Incident-and Injury-Free® (IIF®) safety management program is integrated into all aspects of the Company’s culture. The Company’s commitment to the IIF® culture promotes a work environment where employee safety is paramount.
About Empire Wind
Empire Wind is being developed through a 50-50 joint venture between Equinor and bp. Empire Wind is located 15-30 miles southeast of Long Island and spans 80,000 acres, with water depths of between approximately 75 and 135 feet. The lease was acquired in 2017. The project’s two phases, Empire Wind 1 and 2, have a total installed capacity of more than 2 GW (816 + 1,260 MW).
About Equinor
Equinor is one of the largest offshore wind developers in the world. Its work in the United States includes operating two lease areas off New York, Empire Wind and Beacon Wind. The projects plan to provide New York State with 3.3 gigawatts (GWs) of energy—enough to power nearly two million homes—including more than 2 GWs from Empire Wind and 1,230 megawatts from Beacon Wind 1. Equinor is also the winner of a lease area on the Outer Continental Shelf off California. The United States is an attractive growth market for Equinor, with an ambition to install 12-16 GW of renewables capacity globally by 2030. www.equinor.com/NY
About bp
bp’s ambition is to become a net zero company by 2050 or sooner, and to help the world get to net zero. bp has a larger economic footprint in the United States than anywhere else in the world, investing more than $140 billion since 2005 and supporting about 245,000 jobs. For more information on bp in the US, visit www.bp.com/us.
Cautionary Note Regarding Forward-Looking Statements Certain statements in this press release may constitute “forward-looking” statements as defined in Section 21E of the Securities Exchange Act of 1934 (the “Exchange Act”), the Private Securities Litigation Reform Act of 1995 (the “PSLRA”) or in releases made by the Securities and Exchange Commission (the “SEC”), all as may be amended from time to time. Such forward-looking statements involve known and unknown risks, uncertainties and other important factors that could cause the actual results, performance or achievements of Great Lakes and its subsidiaries, or industry results, to differ materially from any future results, performance or achievements expressed or implied by such forward-looking statements. Statements that are not historical fact are forward-looking statements. These cautionary statements are being made pursuant to the Exchange Act and the PSLRA with the intention of obtaining the benefits of the “safe harbor” provisions of such laws. Great Lakes cautions investors that any forward-looking statements made by Great Lakes are not guarantees or indicative of future events.
Although Great Lakes believes that its plans, intentions and expectations reflected in this press release are reasonable, actual events could differ materially. The forward-looking statements contained in this press release are made only as of the date hereof and Great Lakes does not have or undertake any obligation to update or revise any forward-looking statements whether as a result of new information, subsequent events or otherwise, unless otherwise required by law.
For further information contact: Tina Baginskis Director, Investor Relations 630-574-3024
HOUSTON, July 25, 2023 (GLOBE NEWSWIRE) — Great Lakes Dredge & Dock Corporation (NASDAQ: GLDD) today announced that it will release the financial results for its three and six months ended June 30, 2023 on Tuesday, August 1, 2023 at 7:00 a.m. C.D.T. A conference call with the Company will be held the same day at 9:00 a.m. C.D.T.
Investors and analysts are encouraged to pre-register for the conference call by using the link below. Participants who pre-register will be given a unique PIN to gain immediate access to the call. Pre-registration may be completed at any time up to the call start time.
The live call and replay can also be heard at https://edge.media-server.com/mmc/p/eaob2spr or on the Company’s website, www.gldd.com, under Events on the Investor Relations page. A copy of the press release will be available on the Company’s website.
The Company Great Lakes Dredge & Dock Corporation (“Great Lakes” or the “Company”) is the largest provider of dredging services in the United States. In addition, Great Lakes is fully engaged in expanding its core business into the rapidly developing offshore wind energy industry. The Company has a long history of performing significant international projects. The Company employs experienced civil, ocean and mechanical engineering staff in its estimating, production and project management functions. In its over 133-year history, the Company has never failed to complete a marine project. Great Lakes owns and operates the largest and most diverse fleet in the U.S. dredging industry, comprised of approximately 200 specialized vessels. Great Lakes has a disciplined training program for engineers that ensures experienced-based performance as they advance through Company operations. The Company’s Incident-and Injury-Free® (IIF®) safety management program is integrated into all aspects of the Company’s culture. The Company’s commitment to the IIF® culture promotes a work environment where employee safety is paramount.
For further information contact: Tina Baginskis Director, Investor Relations 630-574-3024
Eagle Bulk Shipping Inc. (“Eagle”) is a US-based drybulk owner-operator focused on the Supramax/Ultramax mid-size asset class, which ranges from 50,000 and 65,000 deadweight tons in size; these vessels are equipped with onboard cranes allowing for the self-loading and unloading of cargoes, a feature which distinguishes them from the larger classes of drybulk vessels and provides for greatly enhanced flexibility and versatility- both with respect to cargo diversity and port accessibility. The Company transports a broad range of major and minor bulk cargoes around the world, including coal, grain, ore, pet coke, cement, and fertilizer. Eagle operates out of three offices, Stamford (headquarters), Singapore, and Hamburg, and performs all aspects of vessel management in-house including: commercial, operational, technical, and strategic.
Michael Heim, Senior Vice President, Equity Research Analyst, Energy & Transportation, Noble Capital Markets, Inc.
Refer to the full report for the price target, fundamental analysis, and rating.
Estimates adjusted downward to reflect shipping weakness. We are lowering our assumed shipping rates in response to shipping rate declines and company guidance. Although EGLE had locked in 65% of its available shipping days at a rate near $16,000/day, the rate it received for the other shipping days was closer to $10,000/day. As a result, the average TCE day rate for the fleet of 52.8 vessels was closer to $14,000/day.
Lower shipping rates and thus revenues are partially offset by lower vessel operating costs. Operating expense is running between $6,300-$6,600 per shipping day, a decline from the first quarter. The lower costs lessen the impact of lower revenues in our models.
Equity Research is available at no cost to Registered users of Channelchek. Not a Member? Click ‘Join’ to join the Channelchek Community. There is no cost to register, and we never collect credit card information.
This Research is provided by Noble Capital Markets, Inc., a FINRA and S.E.C. registered broker-dealer (B/D).
*Analyst certification and important disclosures included in the full report. NOTE: investment decisions should not be based upon the content of this research summary. Proper due diligence is required before making any investment decision.
Seanergy Maritime Holdings Corp. is the only pure-play Capesize ship-owner publicly listed in the US. Seanergy provides marine dry bulk transportation services through a modern fleet of Capesize vessels. The Company’s operating fleet consists of 17 Capesize vessels with an average age of approximately 12 years and aggregate cargo carrying capacity of approximately 3,011,083 dwt. The Company is incorporated in the Marshall Islands and has executive offices in Glyfada, Greece. The Company’s common shares trade on the Nasdaq Capital Market under the symbol “SHIP” and its Class B warrants under “SHIPZ”.
Michael Heim, Senior Vice President, Equity Research Analyst, Energy & Transportation, Noble Capital Markets, Inc.
Refer to the full report for the price target, fundamental analysis, and rating.
Seanergy repurchased approximately 2% of its shares outstanding at an average price of $4.35 per share. The shares were repurchased at an 11.2% discount to its July 5th stock price. The shares fell approximately 5% on July 6th, a reflection of weakness in the overall market more than the share repurchase announcement. SHIP reported a cash position of $20 million at the end of the first quarter, adequate capital to finance the $1.6 million share repurchase.
Seanergy also announced an agreement to acquire a vessel through a bareboat-in charter. A bareboat-in charter allows the acquirer to take possession of a boat for which no crew or provisions are included as part of the agreement. Seanergy will pay $7 million and $9,000/day for the 12-month charter and has an option to purchase the vessel for $20.2 million. Despite Capesize Drybulk shipping rates declining in recent weeks, they agreement should provide a modest boost to near-term cash flow generation. We would expect the company to execute its option to purchase the vessel and become the 18th ship in Seanergy’s fleet.
Equity Research is available at no cost to Registered users of Channelchek. Not a Member? Click ‘Join’ to join the Channelchek Community. There is no cost to register, and we never collect credit card information.
This Research is provided by Noble Capital Markets, Inc., a FINRA and S.E.C. registered broker-dealer (B/D).
*Analyst certification and important disclosures included in the full report. NOTE: investment decisions should not be based upon the content of this research summary. Proper due diligence is required before making any investment decision.
Executes two real estate sale-leasebacks for total transaction value of $20.3 million
HOUSTON, June 26, 2023 (GLOBE NEWSWIRE) — Orion Group Holdings, Inc. (NYSE: ORN) (the “Company”), a leading specialty construction company, today announced two real estate sale-leaseback transactions for a total value of $20.3 million.
The Company entered into a sale-leaseback agreement for its Baytown Pipe Yard property in Baytown, Texas. The purchase price is $8.3 million, and the transaction is expected to close no later than the fourth quarter of 2023. In addition, the Company announced it closed on the sale-leaseback transaction for its Port Lavaca South Yard property located in Port Lavaca, Texas for a purchase price of $12.0 million. Proceeds from both transactions will be used to reduce debt and for general corporate purposes.
Travis Boone, Chief Executive Officer of Orion Group Holdings, Inc., commented, “A key element of our strategic plan to improve our financial and operational performance has been to monetize our real estate assets. These transactions provide us with over $20 million to invest in growing Orion. We are excited to demonstrate continued progress against our plan to create long-term value for our shareholders.”
About Orion Group Holdings
Orion Group Holdings, Inc., a leading specialty construction company serving the infrastructure, industrial and building sectors, provides services both on and off the water in the continental United States, Alaska, Hawaii, Canada and the Caribbean Basin through its marine segment and its concrete segment. The Company’s marine segment provides construction and dredging services relating to marine transportation facility construction, marine pipeline construction, marine environmental structures, dredging of waterways, channels and ports, environmental dredging, design, and specialty services. Its concrete segment provides turnkey concrete construction services including place and finish, site prep, layout, forming, and rebar placement for large commercial, structural and other associated business areas. The Company is headquartered in Houston, Texas with regional offices throughout its operating areas. https://www.oriongroupholdingsinc.com.
Forward-Looking Statements
The matters discussed in this press release may constitute or include projections or other forward-looking statements within the meaning of the “safe harbor” provisions of Section 27A of the Securities Exchange Act of 1933, as amended, and Section 21E of the Securities Exchange Act of 1934, as amended, of which provisions the Company is availing itself. Certain forward-looking statements can be identified by the use of forward-looking terminology, such as ‘believes’, ‘expects’, ‘may’, ‘will’, ‘could’, ‘should’, ‘seeks’, ‘approximately’, ‘intends’, ‘plans’, ‘estimates’, or ‘anticipates’, or the negative thereof or other comparable terminology, or by discussions of strategy, plans, objectives, intentions, estimates, forecasts, outlook, assumptions, or goals. In particular, statements regarding future operations or results, including those set forth in this press release, and any other statement, express or implied, concerning future operating results or the future generation of or ability to generate revenues, income, net income, gross profit, EBITDA, Adjusted EBITDA, Adjusted EBITDA margin, or cash flow, including to service debt, and including any estimates, forecasts or assumptions regarding future revenues or revenue growth, and our ability to negotiate and obtain the refinancing of our credit facility, the terms, restrictions, and covenants of our refinancing, and the timing of such refinancing, are forward-looking statements. Forward-looking statements also include project award announcements, estimated project start dates, anticipated revenues, and contract options which may or may not be awarded in the future. Forward-looking statements involve risks, including those associated with the Company’s fixed price contracts that impacts profits, unforeseen productivity delays that may alter the final profitability of the contract, cancellation of the contract by the customer for unforeseen reasons, delays or decreases in funding by the customer, levels and predictability of government funding or other governmental budgetary constraints, the effects of the ongoing COVID-19 pandemic, and any potential contract options which may or may not be awarded in the future, and are at the sole discretion of award by the customer. Past performance is not necessarily an indicator of future results. In light of these and other uncertainties, the inclusion of forward-looking statements in this press release should not be regarded as a representation by the Company that the Company’s plans, estimates, forecasts, goals, intentions, or objectives will be achieved or realized. Readers are cautioned not to place undue reliance on these forward-looking statements, which speak only as of the date hereof. The Company assumes no obligation to update information contained in this press release whether as a result of new developments or otherwise, except as required by law.
Please refer to the Company’s 2022 Annual Report on Form 10-K, filed on March 16, 2023, which is available on its website at www.oriongroupholdingsinc.com or at the SEC’s website at www.sec.gov, for additional and more detailed discussion of risk factors that could cause actual results to differ materially from our current expectations, estimates or forecasts.
Contacts: Financial Profiles, Inc. Margaret Boyce 310-622-8247 [email protected]
Adopts Limited Duration Shareholder Rights Plan to Protect the Best Interest of Shareholders
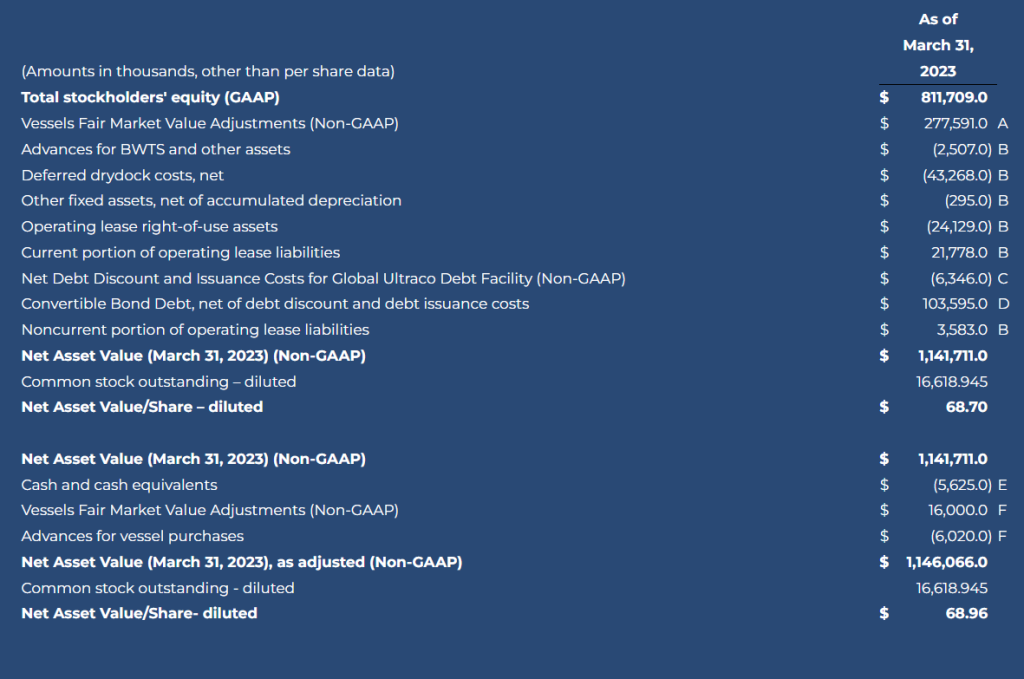
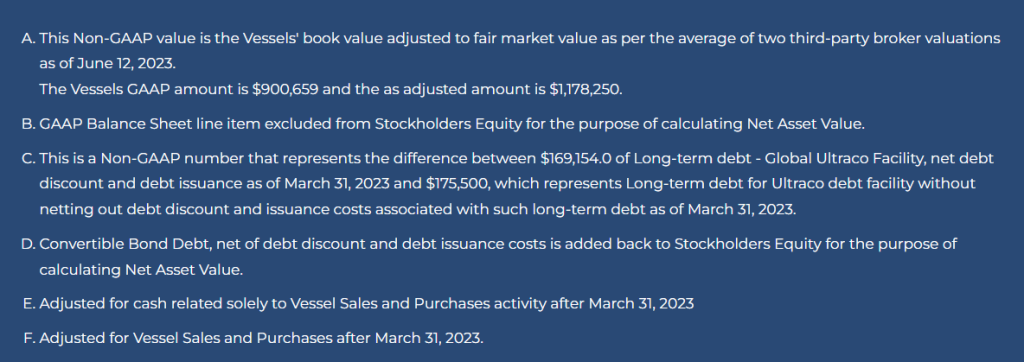
STAMFORD, Conn., June 22, 2023 (GLOBE NEWSWIRE) — Eagle Bulk Shipping Inc. (NYSE: EGLE) (“Eagle Bulk”, “Eagle”, or the “Company”), one of the world’s largest owner-operators within the midsize drybulk vessel segment, today announced that its Board of Directors has approved an agreement with Oaktree Capital Management (“Oaktree”) and certain of its affiliates pursuant to which Eagle has repurchased approximately 3.8 million shares of Eagle common stock, representing Oaktree’s entire stock ownership of approximately 28% in the Company, for an aggregate purchase price of approximately $219.3 million. The purchase price of $58.00 per share represents a discount of approximately $11.00 per share or approximately 16% to Net Asset Value, as adjusted (“NAV”) per share-diluted based on March 31, 2023 financials and current fleet valuations.1
The Board unanimously arrived at its determination after careful consideration, including consultation with outside legal and financial advisors.
Eagle’s Chairman Paul Leand, Jr. commented, “Today’s transaction is in the best interest of our shareholders, both financially and strategically. It ensures that shareholders maintain the opportunity to realize the value of their investment in Eagle Bulk and eliminates any potential disruption resulting from the sale of a very significant interest in the Company.”
Eagle’s CEO Gary Vogel added, “We believe the transaction will be significantly accretive to NAV per share and EPS in future periods based on historically strong supply-side fundamentals. Looking ahead, we will continue to execute on our growth and renewal strategy, including building upon our 33 previous ship acquisitions, and remain committed to acting opportunistically to create value for all of our shareholders.”
Eagle’s balance sheet remains strong, with total liquidity of approximately $188 million based on March 31, 2023 financials, as adjusted for this transaction, previously communicated financing, and vessel sale and purchase activity. The Company noted that it remains committed to its balanced capital allocation strategy, including maintaining its current dividend policy of 30% of net income, which we believe will be positively impacted by this transaction, and continued repayment of term debt.
As a result of this transaction, the Company’s outstanding common stock will be reduced to approximately 9.3 million shares. The transaction will be financed by cash-on-hand and drawings under the Company’s credit facility.
Eagle Bulk provided supplemental slides in connection with this announcement under the “Investors” section of the Company’s website https://ir.eagleships.com/.
Oaktree became a shareholder in Eagle Bulk in October 2014.
Shareholder Rights Plan
Additionally, the Company announced that its Board of Directors has unanimously adopted a limited duration shareholder rights plan (the “Rights Plan”). The Rights Plan is effective immediately and has a one year duration expiring on June 22, 2024 unless extended by shareholders. The Rights Plan will reduce the likelihood that any person or group gains control of the Company through open market accumulation, or other abusive tactics potentially disadvantaging the interests of all shareholders, without paying all shareholders an appropriate control premium or providing the Company’s Board of Directors sufficient time to make informed decisions in the best interest of all shareholders. The Rights Plan is not intended to interfere with any transaction that the Board of Directors determines to be in the best interests of shareholders, nor does the Rights Plan prevent the Board of Directors from considering any proposal.
Pursuant to the Rights Plan, the Company will distribute one right for each share of common stock outstanding as of the close of business on July 3, 2023. While the Rights Plan is effective immediately, the rights generally would become exercisable only if a person or group (including a group of persons that are acting in concert with each other) acquires beneficial ownership, as defined in the Rights Plan, of 15% or more of the Company’s common stock in a transaction not approved by the Company’s Board of Directors. In that situation, each holder of a right (other than the acquiring person or group) will have the right to purchase, upon payment of the then-current exercise price, a number of shares of Company common stock having a market value of twice the exercise price of the right. In addition, at any time after a person or group acquires 15% or more of the Company’s common stock, the Company’s Board of Directors may exchange one share of the Company’s common stock for each outstanding right (other than rights owned by such person or group, which would have become void).
The Rights Plan will expire on the close of business on the first anniversary of the date of entry into the Rights Plan unless extended for two more years by shareholders. It could also expire earlier if prior to such date, the rights are redeemed or exchanged. The Company’s Board of Directors may consider an earlier termination of the Rights Plan if market and other conditions warrant.
Further details regarding the Oaktree transaction and Rights Plan will be contained in a Current Report on Form 8-K that the Company will be filing with the U.S. Securities and Exchange Commission (“SEC”). These filings will be available on the SEC’s web site at www.sec.gov.
Akin Gump Strauss Hauer & Feld LLP is serving as legal advisor to the Company. Hogan Lovells US LLP is serving as legal advisor and Houlihan Lokey is serving as financial advisor to the Company’s Board of Directors.
About Eagle Bulk Shipping Inc.
Eagle Bulk Shipping Inc. (“Eagle” or the “Company”) is a US-based, fully integrated shipowner-operator providing global transportation solutions to a diverse group of customers including miners, producers, traders, and end users. Headquartered in Stamford, Connecticut, with offices in Singapore and Copenhagen, Eagle focuses exclusively on the versatile midsize drybulk vessel segment and owns one of the largest fleets of Supramax / Ultramax vessels in the world. The Company performs all management services in-house (including strategic, commercial, operational, technical, and administrative) and employs an active-management approach to fleet trading with the objective of optimizing revenue performance and maximizing earnings on a risk-managed basis. For further information, please visit our website: www.eagleships.com.
Supplemental Information – Non-GAAP Financial Measures
This release includes Net Asset Value per share-diluted, a non-GAAP financial measure as defined under the rules of the SEC. We believe non-GAAP measures provide important supplemental information to investors regarding the information discussed in this release. However, you should not rely on any non-GAAP financial measure alone as a measure of our performance. We believe that non-GAAP financial measures reflect an additional way of viewing our business that, when taken together with GAAP results and the reconciliations to corresponding GAAP financial measures that we also provide, give a more complete understanding of factors and trends affecting our business. We strongly encourage you to review all of our financial statements and publicly-filed reports in their entirety and to not solely rely on any single non-GAAP financial measure. Because non-GAAP financial measures are not standardized, it may not be possible to compare these financial measures with other companies’ non-GAAP financial measures, even if they have similar names.
Forward-Looking Statements Matters discussed in this release may constitute forward-looking statements that may be deemed to be “forward-looking statements” within the meaning of Section 27A of the Securities Act of 1933, as amended, Section 21E of the Securities Exchange Act of 1934, as amended, and the Private Securities Litigation Reform Act of 1995, and are intended to be covered by the safe harbor provided for under these sections. These statements may include words such as “believe,” “estimate,” “project,” “intend,” “expect,” “plan,” “anticipate,” and similar expressions in connection with any discussion of the timing or nature of future operating or financial performance or other events. Forward-looking statements in this release reflect management’s current expectations and observations with respect to future events and financial performance. Where we express an expectation or belief as to future events or results, including future plans with respect to financial performance, the payment of dividends and/or repurchase of shares, such expectation or belief is expressed in good faith and believed to have a reasonable basis. However, our forward-looking statements are subject to risks, uncertainties, and other factors, which could cause actual results to differ materially from future results expressed, projected, or implied by those forward-looking statements.
Where we express an expectation or belief as to future events or results, such expectation or belief is expressed in good faith and believed to have a reasonable basis. However, our forward-looking statements are subject to risks, uncertainties, and other factors, which could cause actual results to differ materially from future results expressed, projected or implied by those forward-looking statements. The principal factors that affect our financial position, results of operations and cash flows include market freight rates, which fluctuate based on various economic and market conditions, periods of charter hire, vessel operating expenses and voyage costs, which are incurred primarily in U.S. dollars, depreciation expenses, which are a function of the purchase price of our vessels and our vessels’ estimated useful lives and scrap value, general and administrative expenses, and financing costs related to our indebtedness. The accuracy of the Company’s assumptions, expectations, beliefs and projections depends on events or conditions that change over time and are thus susceptible to change based on actual experience, new developments and known and unknown risks. The Company gives no assurance that the forward-looking statements will prove to be correct and does not undertake any duty to update them. Our actual results may differ materially from those anticipated in these forward-looking statements as a result of certain factors which could include the following: (i) volatility of freight rates driven by changes in demand for seaborne transportation of drybulk commodities and in supply of drybulk shipping capacity; (ii) changes in drybulk carrier capacity driven by levels of newbuilding orders, scrapping rates or fleet utilization; (iii) changes in rules and regulations applicable to the drybulk industry, including, without limitation, regulations of the International Maritime Organization and the European Union (the “EU”), requirements of the Environmental Protection Agency and other governmental and quasi-governmental agencies; (iv) changes in U.S. and EU economic sanctions and trade embargo laws and regulations as well as equivalent economic sanctions laws of other relevant jurisdictions; (v) actions taken by regulatory authorities including, without limitation, the U.S. Treasury Department’s Office of Foreign Assets Control (“OFAC”); (vi) changes in the typical seasonal variations in drybulk freight rates; (vii) changes in national and international economic and political conditions including, without limitation, the current conflict between Russia and Ukraine, the current economic and political environment in China and the environment in historically high-risk geographic areas such as the South China Sea, the Indian Ocean, the Gulf of Guinea and the Gulf of Aden; (viii) changes in the condition of the Company’s vessels or applicable maintenance or regulatory standards (which may affect, among other things, our anticipated drydocking costs); (ix) the duration and impact of the novel coronavirus (“COVID-19”) pandemic and measures implemented by governments of various countries in response to the COVID-19 pandemic; (xi) volatility of the cost of fuel; (xii) volatility of costs of labor and materials needed to operate our business due to inflation; (xiii) any legal proceedings which we may be involved from time to time; and (xiv) other factors listed from time to time in our filings with the SEC.
We have based these statements on assumptions and analyses formed by applying our experience and perception of historical trends, current conditions, expected future developments and other factors we believe are appropriate in the circumstances. The Company’s future results may be impacted by adverse economic conditions, such as inflation, deflation, or lack of liquidity in the capital markets, that may negatively affect it or parties with whom it does business. Should one or more of the foregoing risks or uncertainties materialize in a way that negatively impacts the Company, or should the Company’s underlying assumptions prove incorrect, the Company’s actual results may vary materially from those anticipated in its forward-looking statements, and its business, financial condition and results of operations could be materially and adversely affected.
Risks and uncertainties are further described in reports filed by Eagle Bulk Shipping Inc. with the SEC.
1 This is a non-GAAP financial measure. A reconciliation of GAAP to this non-GAAP financial measure has been provided in the financial table included in this press release.