Firm improves financial flexibility, eliminates mandatory annual principal payments under new all-revolver facility with more favorable terms, extended maturity date
STAMFORD, Conn.–(BUSINESS WIRE)– Information Services Group (ISG) (Nasdaq: III), a leading global technology research and advisory firm, today announced it has successfully amended its $140 million credit facility at more favorable terms, to improve the firm’s financial flexibility.
The new credit agreement amends the previous agreement entered into on March 10, 2020. Key updates include:
Converting the previous term and revolving loan into an all-revolving credit facility
Eliminating $4.3 million of mandatory annual principal payments due in 2023 and 2024
Extending the maturity date of the previous agreement by three years, to February 2028
“Our amended credit facility greatly enhances our financial flexibility and offers further validation of our robust business performance that enabled these enhancements,” said Michael P. Connors, chairman and CEO of ISG. “We thank our lenders for their partnership and confidence in our ability to deliver long-term sustainable growth and value for our shareholders.”
BofA Securities Inc. was the Sole Lead Arranger and Sole Bookrunner on the transaction.
Additional details about the amended credit agreement can be found in the Form 8-K ISG filed today with the U.S. Securities and Exchange Commission, a link to which can be found on ISG’s website.
Forward-Looking Statements
This communication contains “forward-looking statements” which represent the current expectations and beliefs of management of ISG concerning future events and their potential effects. Statements contained herein including words such as “anticipate,” “believe,” “contemplate,” “plan,” “estimate,” “target,” “expect,” “intend,” “will,” “continue,” “should,” “may,” and other similar expressions, are “forward-looking statements” under the Private Securities Litigation Reform Act of 1995. These forward-looking statements are not guarantees of future results and are subject to certain risks and uncertainties that could cause actual results to differ materially from those anticipated. Those risks relate to inherent business, economic and competitive uncertainties and contingencies relating to the businesses of ISG and its subsidiaries including without limitation: (1) failure to secure new engagements or loss of important clients; (2) ability to hire and retain enough qualified employees to support operations; (3) ability to maintain or increase billing and utilization rates; (4) management of growth; (5) success of expansion internationally; (6) competition; (7) ability to move the product mix into higher margin businesses; (8) general political and social conditions such as war, political unrest and terrorism; (9) healthcare and benefit cost management; (10) ability to protect ISG and its subsidiaries’ intellectual property or data and the intellectual property or data of others; (11) currency fluctuations and exchange rate adjustments; (12) ability to successfully consummate or integrate strategic acquisitions; (13) outbreaks of diseases, including coronavirus, or similar public health threats or fear of such an event; and (14) engagements may be terminated, delayed or reduced in scope by clients. Certain of these and other applicable risks, cautionary statements and factors that could cause actual results to differ from ISG’s forward-looking statements are included in ISG’s filings with the U.S. Securities and Exchange Commission. ISG undertakes no obligation to update or revise any forward-looking statements to reflect subsequent events or circumstances.
About ISG
ISG (Information Services Group) (Nasdaq: III) is a leading global technology research and advisory firm. A trusted business partner to more than 800 clients, including 75 of the world’s top 100 enterprises, ISG is committed to helping corporations, public sector organizations, and service and technology providers achieve operational excellence and faster growth. The firm specializes in digital transformation services, including automation, cloud and data analytics; sourcing advisory; managed governance and risk services; network carrier services; strategy and operations design; change management; market intelligence and technology research and analysis. Founded in 2006, and based in Stamford, Conn., ISG employs more than 1,300 digital-ready professionals operating in more than 20 countries—a global team known for its innovative thinking, market influence, deep industry and technology expertise, and world-class research and analytical capabilities based on the industry’s most comprehensive marketplace data. For more information, visit www.isg-one.com.
No two hearts beat alike. The size and shape of the heart can vary from one person to the next. These differences can be particularly pronounced for people living with heart disease, as their hearts and major vessels work harder to overcome any compromised function.
MIT engineers are hoping to help doctors tailor treatments to patients’ specific heart form and function, with a custom robotic heart. The team has developed a procedure to 3D print a soft and flexible replica of a patient’s heart. They can then control the replica’s action to mimic that patient’s blood-pumping ability.
The procedure involves first converting medical images of a patient’s heart into a three-dimensional computer model, which the researchers can then 3D print using a polymer-based ink. The result is a soft, flexible shell in the exact shape of the patient’s own heart. The team can also use this approach to print a patient’s aorta — the major artery that carries blood out of the heart to the rest of the body.
To mimic the heart’s pumping action, the team has fabricated sleeves similar to blood pressure cuffs that wrap around a printed heart and aorta. The underside of each sleeve resembles precisely patterned bubble wrap. When the sleeve is connected to a pneumatic system, researchers can tune the outflowing air to rhythmically inflate the sleeve’s bubbles and contract the heart, mimicking its pumping action.
The researchers can also inflate a separate sleeve surrounding a printed aorta to constrict the vessel. This constriction, they say, can be tuned to mimic aortic stenosis — a condition in which the aortic valve narrows, causing the heart to work harder to force blood through the body.
Doctors commonly treat aortic stenosis by surgically implanting a synthetic valve designed to widen the aorta’s natural valve. In the future, the team says that doctors could potentially use their new procedure to first print a patient’s heart and aorta, then implant a variety of valves into the printed model to see which design results in the best function and fit for that particular patient. The heart replicas could also be used by research labs and the medical device industry as realistic platforms for testing therapies for various types of heart disease.
“All hearts are different,” says Luca Rosalia, a graduate student in the MIT-Harvard Program in Health Sciences and Technology. “There are massive variations, especially when patients are sick. The advantage of our system is that we can recreate not just the form of a patient’s heart, but also its function in both physiology and disease.”
Rosalia and his colleagues report their results in a study appearing today in Science Robotics. MIT co-authors include Caglar Ozturk, Debkalpa Goswami, Jean Bonnemain, Sophie Wang, and Ellen Roche, along with Benjamin Bonner of Massachusetts General Hospital, James Weaver of Harvard University, and Christopher Nguyen, Rishi Puri, and Samir Kapadia at the Cleveland Clinic in Ohio.
Print and Pump
In January 2020, team members, led by mechanical engineering professor Ellen Roche, developed a “biorobotic hybrid heart” — a general replica of a heart, made from synthetic muscle containing small, inflatable cylinders, which they could control to mimic the contractions of a real beating heart.
Shortly after those efforts, the Covid-19 pandemic forced Roche’s lab, along with most others on campus, to temporarily close. Undeterred, Rosalia continued tweaking the heart-pumping design at home.
“I recreated the whole system in my dorm room that March,” Rosalia recalls.
Months later, the lab reopened, and the team continued where it left off, working to improve the control of the heart-pumping sleeve, which they tested in animal and computational models. They then expanded their approach to develop sleeves and heart replicas that are specific to individual patients. For this, they turned to 3D printing.
“There is a lot of interest in the medical field in using 3D printing technology to accurately recreate patient anatomy for use in preprocedural planning and training,” notes Wang, who is a vascular surgery resident at Beth Israel Deaconess Medical Center in Boston.
An Inclusive Design
In the new study, the team took advantage of 3D printing to produce custom replicas of actual patients’ hearts. They used a polymer-based ink that, once printed and cured, can squeeze and stretch, similarly to a real beating heart.
As their source material, the researchers used medical scans of 15 patients diagnosed with aortic stenosis. The team converted each patient’s images into a three-dimensional computer model of the patient’s left ventricle (the main pumping chamber of the heart) and aorta. They fed this model into a 3D printer to generate a soft, anatomically accurate shell of both the ventricle and vessel.
The team also fabricated sleeves to wrap around the printed forms. They tailored each sleeve’s pockets such that, when wrapped around their respective forms and connected to a small air pumping system, the sleeves could be tuned separately to realistically contract and constrict the printed models.
The researchers showed that for each model heart, they could accurately recreate the same heart-pumping pressures and flows that were previously measured in each respective patient.
“Being able to match the patients’ flows and pressures was very encouraging,” Roche says. “We’re not only printing the heart’s anatomy, but also replicating its mechanics and physiology. That’s the part that we get excited about.”
Going a step further, the team aimed to replicate some of the interventions that a handful of the patients underwent, to see whether the printed heart and vessel responded in the same way. Some patients had received valve implants designed to widen the aorta. Roche and her colleagues implanted similar valves in the printed aortas modeled after each patient. When they activated the printed heart to pump, they observed that the implanted valve produced similarly improved flows as in actual patients following their surgical implants.
Finally, the team used an actuated printed heart to compare implants of different sizes, to see which would result in the best fit and flow — something they envision clinicians could potentially do for their patients in the future.
“Patients would get their imaging done, which they do anyway, and we would use that to make this system, ideally within the day,” says co-author Nguyen. “Once it’s up and running, clinicians could test different valve types and sizes and see which works best, then use that to implant.”
Ultimately, Roche says the patient-specific replicas could help develop and identify ideal treatments for individuals with unique and challenging cardiac geometries.
“Designing inclusively for a large range of anatomies, and testing interventions across this range, may increase the addressable target population for minimally invasive procedures,” Roche says.
This research was supported, in part, by the National Science Foundation, the National Institutes of Health, and the National Heart Lung Blood Institute.
Comtech Telecommunications Corp. engages in the design, development, production, and marketing of products, systems, and services for advanced communications solutions in the United States and internationally. It operates in three segments: Telecommunications Transmission, Mobile Data Communications, and RF Microwave Amplifiers. The Telecommunications Transmission segment provides satellite earth station equipment and systems, over-the-horizon microwave systems, and forward error correction technology, which are used in various commercial and government applications, including backhaul of wireless and cellular traffic, broadcasting (including HDTV), IP-based communications traffic, long distance telephony, and secure defense applications. The Mobile Data Communications segment provides mobile satellite transceivers, and computers and satellite earth station network gateways and associated installation, training, and maintenance services; supplies and operates satellite packet data networks, including arranging and providing satellite capacity; and offers microsatellites and related components. The RF Microwave Amplifiers segment designs, develops, manufactures, and markets satellite earth station traveling wave tube amplifiers (TWTA) and broadband amplifiers. Its amplifiers are used in broadcast and broadband satellite communication; defense applications, such as telecommunications systems and electronic warfare systems; and commercial applications comprising oncology treatment systems, as well as to amplify signals carrying voice, video, or data for air-to-satellite-to-ground communications. The company serves satellite systems integrators, wireless and other communication service providers, broadcasters, defense contractors, military, governments, and oil companies. Comtech markets its products through independent representatives and value-added resellers. The company was founded in 1967 and is headquartered in Melville, New York.
Joe Gomes, Managing Director – Generalist Analyst, Noble Capital Markets, Inc.
Joshua Zoepfel, Research Associate, Noble Capital Markets, Inc.
Refer to the full report for the price target, fundamental analysis, and rating.
Investor Meetings. We hosted Comtech CEO Ken Peterman and CFO Michael Bondi for a series of investor meetings in South Florida last week. In the meetings, CEO Peterman outlined the current progress made and future opportunities under his strategy to right the ship and grow from there.
The Present. Management spent time reviewing the actions already taken in regard to implementing the ONE Comtech vision. We expect the initial benefits of bringing the Company under one roof, including cost savings, more efficient use of capital, and the capture of additional business, will begin to flow into operating results in a noticeable way during the second half of fiscal 2023.
Equity Research is available at no cost to Registered users of Channelchek. Not a Member? Click ‘Join’ to join the Channelchek Community. There is no cost to register, and we never collect credit card information.
This Company Sponsored Research is provided by Noble Capital Markets, Inc., a FINRA and S.E.C. registered broker-dealer (B/D).
*Analyst certification and important disclosures included in the full report. NOTE: investment decisions should not be based upon the content of this research summary. Proper due diligence is required before making any investment decision.
Image: Marine Corps Warfighting Laboratory MAGTAF Integrated Experiment (MCWL) 160709-M-OB268-165.jpg
War in Ukraine Accelerates Global Drive Toward Killer Robots
The U.S. military is intensifying its commitment to the development and use of autonomous weapons, as confirmed by an update to a Department of Defense directive. The update, released Jan. 25, 2023, is the first in a decade to focus on artificial intelligence autonomous weapons. It follows a related implementation plan released by NATO on Oct. 13, 2022, that is aimed at preserving the alliance’s “technological edge” in what are sometimes called “killer robots.”
Both announcements reflect a crucial lesson militaries around the world have learned from recent combat operations in Ukraine and Nagorno-Karabakh: Weaponized artificial intelligence is the future of warfare.
“We know that commanders are seeing a military value in loitering munitions in Ukraine,” Richard Moyes, director of Article 36, a humanitarian organization focused on reducing harm from weapons, told me in an interview. These weapons, which are a cross between a bomb and a drone, can hover for extended periods while waiting for a target. For now, such semi-autonomous missiles are generally being operated with significant human control over key decisions, he said.
Pressure of War
But as casualties mount in Ukraine, so does the pressure to achieve decisive battlefield advantages with fully autonomous weapons – robots that can choose, hunt down and attack their targets all on their own, without needing any human supervision.
This month, a key Russian manufacturer announced plans to develop a new combat version of its Marker reconnaissance robot, an uncrewed ground vehicle, to augment existing forces in Ukraine. Fully autonomous drones are already being used to defend Ukrainian energy facilities from other drones. Wahid Nawabi, CEO of the U.S. defense contractor that manufactures the semi-autonomous Switchblade drone, said the technology is already within reach to convert these weapons to become fully autonomous.
Mykhailo Fedorov, Ukraine’s digital transformation minister, has argued that fully autonomous weapons are the war’s “logical and inevitable next step” and recently said that soldiers might see them on the battlefield in the next six months.
Proponents of fully autonomous weapons systems argue that the technology will keep soldiers out of harm’s way by keeping them off the battlefield. They will also allow for military decisions to be made at superhuman speed, allowing for radically improved defensive capabilities.
Currently, semi-autonomous weapons, like loitering munitions that track and detonate themselves on targets, require a “human in the loop.” They can recommend actions but require their operators to initiate them.
This article was republished with permission from The Conversation, a news site dedicated to sharing ideas from academic experts. It represents the research-based findings and thoughts of, James Dawes, Professor, Macalester College.
By contrast, fully autonomous drones, like the so-called “drone hunters” now deployed in Ukraine, can track and disable incoming unmanned aerial vehicles day and night, with no need for operator intervention and faster than human-controlled weapons systems.
Calling for a Timeout
Critics like The Campaign to Stop Killer Robots have been advocating for more than a decade to ban research and development of autonomous weapons systems. They point to a future where autonomous weapons systems are designed specifically to target humans, not just vehicles, infrastructure and other weapons. They argue that wartime decisions over life and death must remain in human hands. Turning them over to an algorithm amounts to the ultimate form of digital dehumanization.
Together with Human Rights Watch, The Campaign to Stop Killer Robots argues that autonomous weapons systems lack the human judgment necessary to distinguish between civilians and legitimate military targets. They also lower the threshold to war by reducing the perceived risks, and they erode meaningful human control over what happens on the battlefield.
This composite image shows a ‘Switchblade’ loitering munition drone launching from a tube and extending its folded wings. U.S. Army AMRDEC Public Affairs
The organizations argue that the militaries investing most heavily in autonomous weapons systems, including the U.S., Russia, China, South Korea and the European Union, are launching the world into a costly and destabilizing new arms race. One consequence could be this dangerous new technology falling into the hands of terrorists and others outside of government control.
The updated Department of Defense directive tries to address some of the key concerns. It declares that the U.S. will use autonomous weapons systems with “appropriate levels of human judgment over the use of force.” Human Rights Watch issued a statement saying that the new directive fails to make clear what the phrase “appropriate level” means and doesn’t establish guidelines for who should determine it.
But as Gregory Allen, an expert from the national defense and international relations think tank Center for Strategic and International Studies, argues, this language establishes a lower threshold than the “meaningful human control” demanded by critics. The Defense Department’s wording, he points out, allows for the possibility that in certain cases, such as with surveillance aircraft, the level of human control considered appropriate “may be little to none.”
The updated directive also includes language promising ethical use of autonomous weapons systems, specifically by establishing a system of oversight for developing and employing the technology, and by insisting that the weapons will be used in accordance with existing international laws of war. But Article 36’s Moyes noted that international law currently does not provide an adequate framework for understanding, much less regulating, the concept of weapon autonomy.
The current legal framework does not make it clear, for instance, that commanders are responsible for understanding what will trigger the systems that they use, or that they must limit the area and time over which those systems will operate. “The danger is that there is not a bright line between where we are now and where we have accepted the unacceptable,” said Moyes.
Impossible Balance?
The Pentagon’s update demonstrates a simultaneous commitment to deploying autonomous weapons systems and to complying with international humanitarian law. How the U.S. will balance these commitments, and if such a balance is even possible, remains to be seen.
The International Committee of the Red Cross, the custodian of international humanitarian law, insists that the legal obligations of commanders and operators “cannot be transferred to a machine, algorithm or weapon system.” Right now, human beings are held responsible for protecting civilians and limiting combat damage by making sure the use of force is proportional to military objectives.
If and when artificially intelligent weapons are deployed on the battlefield, who should be held responsible when needless civilian deaths occur? There isn’t a clear answer to that very important question.
Image: Silver Peak Lithium Mine, Nevada – Ken Lund (Flickr)
The Lithium Dip May Be Worth Exploring
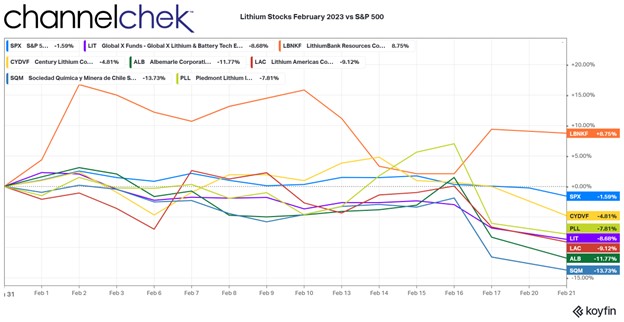
Lithium (Li) was once synonymous with treating depression. Today the mineral is more often discussed as part of the subject of sustainable energy storage, specifically batteries. So it’s ironic that the recent stock price movement of a number of companies tied to lithium may have depressed some investors, as February has seen a sudden depression in values. The primary reason for the decline in lithium stocks may actually be a net plus for miners and others tied to production. This thinking is outlined below.
Many companies involved in Li exploration and/or production were up on the year along with the overall market. Late last week and carrying over to today, many of these stocks have fallen dramatically. The reason for the sudden decline coincided with the largest EV battery manufacturer, Contemporary Amperex Technology’s (CATL) announcement that it will cut the price it charges for Li-ion batteries.
As seen in the chart below, Shares of the larger lithium miners Albemarle ALB (ALB), SQM (SQM), Livent (LTHM), Piedmont Lithium (PLL), and Lithium Americas (LAC) are down between 7% and 14% with much of that drop coming in the past few trading days. Smaller lithium mining operations like LithiumBank Resources Corp. (LBNKF), and Century Lithium Corp. (CYDVF) fared much better, outperforming the more established larger companies.
CATL seems to have aimed to maintain or grow its market share as a battery manufacturer. Any price war they may have started is likely to have a direct impact on competitors. Even car manufacturers that are involved in battery sales may shed some profitability, but is it necessarily a negative for companies involved in mining or refining?
CATL plans on pricing its batteries on a lithium-price-linked calculation. With this, 50% of each battery will benchmark to lithium carbonate, which would largely embed the price of lithium in its Li-ion product. The rest of the batteries will key off of the spot market for lithium carbonate.
Spot prices for lithium carbonate are up about ninefold over the past few years as the growth in EV demand and other battery-operated products has stressed the global lithium supply chain. So while CATL has decided to discount batteries, the production costs are unlikely to fall. The move may instead place greater demand on lithium carbonate. If production doesn’t keep up with, what should spark greater demand for Li-ion batteries, miners may benefit. If correct, this could suggest the declines in mining stock prices related to CATL’s new pricing policy, may be considered as an entry point for investors that had been looking for a price dip.
As for battery makers, this may have more permanently drained value. CATL is about 68% of the mainland Chinese EV battery manufacturing industry. Other battery producers may have to similarly adjust their pricing models to compete. This group includes Panasonic, LG Energy, Samsung, and SK Innovations that also tumbled this month.
Take Away
Mining analysts discuss supply and demand, or deficit and surplus, when adjusting forecasts. If demand grows as a result of the large battery manufacturer CATL discounting prices, and this discounting causes others to follow, the result could be a larger lithium deficit that could raise the price of the mineral per USD/metric-ton. Time will tell.
Will AI Learn to Become a Better Entrepreneur than You?
Contemporary businesses use artificial intelligence (AI) tools to assist with operations and compete in the marketplace. AI enables firms and entrepreneurs to make data-driven decisions and to quicken the data-gathering process. When creating strategy, buying, selling, and increasing marketplace discovery, firms need to ask: What is better, artificial or human intelligence?
A recent article from the Harvard Business Review, “Can AI Help You Sell?,” stated, “Better algorithms lead to better service and greater success.” The attributes of the successful entrepreneur, such as calculated risk taking, dealing with uncertainty, keen sense for market signals, and adjusting to marketplace changes might be a thing of the past. Can AI take the place of the human entrepreneur? Would sophisticated artificial intelligence be able to spot market prices better, adjust to expectations better, and steer production toward the needs of consumers better than a human?
In one of my classes this semester, students and I discussed the role of AI, deep machine learning, and natural language processing (NLP) in driving many of the decisions and operations a human would otherwise provide within the firm. Of course, half of the class felt that the integration of some level of AI into many firms’ operations and resource management is beneficial in creating a competitive advantage.
However, the other half felt using AI will inevitably disable humans’ function in the market economy, resulting in less and less individualism. In other words, the firm will be overrun by AI. We can see that even younger college students are on the fence about whether AI will eliminate humans’ function in the market economy. We concluded as a class that AI and machine learning have their promises and shortcomings.
After class, I started thinking about the digital world of entrepreneurship. E-commerce demands the use of AI to reach customers, sell goods, produce goods, and host exchange—in conjunction with a human entrepreneur, of course.
However, AI—machine learning or deep machine learning—could also be tasked with creating a business-based model, examining the data on customers’ needs, designing a web page, and creating ads. Could AI adjust to market action and react to market uncertainty like a human? The answer may be a resounding yes! So, could AI eliminate the human entrepreneur?
Algorithm-XLab explains deep machine learning as something that “allows computers to solve complex problems. These systems can even handle diverse masses of unstructured data set.” Algorithm-XLab compared deep learning with human learning favorably, stating, “While a human can easily lose concentration, and possibly make a mistake, a robot won’t.”
This statement by Algorithm-XLab challenges the idea that trial and error leads to greater market knowledge and better enables entrepreneurs to provide consumers with what they are willing to buy. The statement also portrays the marketplace as a process where people have perfect knowledge and an equilibrium point, and it implies that humans do not have specialized knowledge of time and place.
The use of AI and its tools of deep learning and language processing do have their benefits from a technical standpoint. AI can determine how to produce hula hoops better, but can it determine whether to produce them or devote energy elsewhere? If entrepreneurs discover market opportunities, they must weigh the advantages and disadvantages of their potential actions. Will AI have the same entrepreneurial foresight?
The acquisition of market knowledge can take humans years to acquire; AI is much faster at it than humans would be. For example, the Allen Institute for AI is “working on systems that can take science tests, which require a knowledge of unstated facts and common sense that humans develop over the course of their lives.” The ability to process unstated, scattered facts is precisely the kind of characteristic we attribute to entrepreneurs. Processes, changes, and choices characterize the operation of the market, and the entrepreneur is at the center of this market function.
There is no doubt that contemporary firms use deep learning for strategy, operations, logistics, sales, and record keeping for human resources (HR) decision-making, according to a Bain & Company article titled “HR’s New Digital Mandate.” While focused on HR, the digital mandate does lend itself to questioning the use of entrepreneurial thinking and strategy conducted within a firm. After AI has learned how to operate a firm using robotic process automation and NLP capacities to their maximum, might it outstrip the human natural entrepreneurial abilities?
AI is used in everyday life, such as self-checkout at the grocery store, online shopping, social media interaction, dating apps, and virtual doctor appointments. Product delivery, financing, and development services increasingly involve an AI-as-a-service component. AI as a service minimizes the costs of gathering and processing customer insights, something usually associated with a team of human minds projecting key performance indicators aligned with an organizational strategy.
The human entrepreneur has a competitive advantage insofar as handling ambiguous customer feedback and in effect creating an entrepreneurial response and delivering satisfaction. We seek to determine whether AI has replaced human energy in some areas of life. Can AI understand human uneasiness or dissatisfaction, or the subjectivity of value felt by the consumer? AI can produce hula hoops, but can it articulate plans and gather the resources needed to produce them in the first place?.
In what, if any, entrepreneurial functions can AI outperform the human entrepreneur? The human entrepreneur is willing to take risks, adjust to the needs of consumers, pick up price signals, and understand customer choices. Could the human entrepreneur soon become an extinct class? If so, would machine learning and natural processing AI understand the differences between free and highly regulated markets? If so, which would it prefer, or which would it create?
One Stop Systems, Inc. (OSS) designs and manufactures innovative AI Transportable edge computing modules and systems, including ruggedized servers, compute accelerators, expansion systems, flash storage arrays, and Ion Accelerator™ SAN, NAS, and data recording software for AI workflows. These products are used for AI data set capture, training, and large-scale inference in the defense, oil and gas, mining, autonomous vehicles, and rugged entertainment applications. OSS utilizes the power of PCI Express, the latest GPU accelerators and NVMe storage to build award-winning systems, including many industry firsts, for industrial OEMs and government customers. The company enables AI on the Fly® by bringing AI datacenter performance to ‘the edge,’ especially on mobile platforms, and by addressing the entire AI workflow, from high-speed data acquisition to deep learning, training, and inference. OSS products are available directly or through global distributors. For more information, go to www.onestopsystems.com.
Joe Gomes, Managing Director – Generalist Analyst, Noble Capital Markets, Inc.
Joshua Zoepfel, Research Associate, Noble Capital Markets, Inc.
Refer to the full report for the price target, fundamental analysis, and rating.
Getting More Work. Yesterday, One Stop Systems announced the Company has received a $1.3 million contract from the U.S. Army to develop vehicle visualization systems. OSS will be working closely with the Army to deliver prototypes later in 2023. The announcement comes on the heels of the $3 million order last month, and further signifies the Company’s capabilities in military applications.
Details. The contract from the U.S. Army is for the design, development, and prototypes for a ruggedized compute visualization system. Using OSS PCIe Gen 4 switched fabric technology and NVIDIA Jetson AGX Orin system-on-modules, the system will be used to support 360-degree visualization for U.S. Army ground vehicles.
Equity Research is available at no cost to Registered users of Channelchek. Not a Member? Click ‘Join’ to join the Channelchek Community. There is no cost to register, and we never collect credit card information.
This Company Sponsored Research is provided by Noble Capital Markets, Inc., a FINRA and S.E.C. registered broker-dealer (B/D).
*Analyst certification and important disclosures included in the full report. NOTE: investment decisions should not be based upon the content of this research summary. Proper due diligence is required before making any investment decision.
Getting to Know ChatGPT: A Shallow Dip into Its Current Functionality and Future Potential
ChatGPT and the underlying AI technology are, as near as anyone can tell, the next-level toolkit for research, communication, idea generation, and a million other uses. If you haven’t introduced yourself to it yet, leave plenty of time – getting started is easy, but getting yourself to stop may not be. Those of us that were around pre-internet may liken the first-time experience to the first time we gained access to the world wide web. The Sudden, much easier access to a world of information, puts one in a place where you don’t know what to try first.
Over the past couple of months, the now-familiar name, ChatGPT has made headlines. It quickly captivated the worlds imagination as an AI product that is likely to disrupt or destroy some industries while enhancing others. Obviously, this is of particular interest to investors. With this in mind, I sat down for an interview with ChatGPT; below are answers to questions that many investors are asking.
Channelchek (PH) – Am I able to interview Chatgpt?
ChatGPT – Hello! As an AI language model, I’m happy to answer any questions you may have. However, it’s important to keep in mind that I don’t have personal experiences or opinions like a human, and I can only provide information based on my training data. So feel free to ask me anything!
Channelchek (PH) – What do most users have ChatGPT to do for them?
ChatGPT – As an AI language model, ChatGPT can be used for a wide range of tasks, including:
Language translation: ChatGPT can be used to translate text from one language to another.
Content creation: ChatGPT can generate text for various types of content, such as articles, blog posts, and product descriptions.
Chatbot development: ChatGPT can be used to develop chatbots that can interact with users and provide information.
Sentiment analysis: ChatGPT can be used to analyze the sentiment of a piece of text, such as a social media post or a product review.
Question-answering: ChatGPT can be used to answer questions on a wide range of topics.
Text summarization: ChatGPT can be used to summarize long pieces of text into shorter, more manageable summaries.
Language modeling: ChatGPT can be used to train new models for specific domains, such as medical or legal language.
These are just a few examples of what ChatGPT can be used for. Its versatility and flexibility make it a powerful tool for many different applications.
Channelchek (PH) – From where do you pull your answers ChatGPT?
ChatGPT – As an AI language model, I don’t have pre-programmed answers. Instead, I generate responses to questions by analyzing patterns in large amounts of text data that I was trained on. Specifically, I was trained on a dataset of billions of words from various sources, including books, articles, websites, and other textual sources. During my training, I was exposed to a wide range of topics and writing styles, which helps me generate responses to many different types of questions.
When you ask me a question, I use natural language processing (NLP) techniques to analyze the question and generate a response based on patterns in the text data that I was trained on. I then use statistical models to determine the most likely response based on the context of the question and the patterns in the training data.
It’s important to note that my responses are only as accurate and reliable as the patterns that I learned during my training. While I strive to provide accurate and helpful information, I may not always get it right, and my responses may not reflect the views or opinions of OpenAI.
Channelchek (PH) – Are you at risk of having the response you generate slanted or biased based on users feedback adjusting your training ChatGPT?
ChatGPT – As an AI language model, I am designed to learn from the data that I am trained on, including the feedback that users provide to adjust my training. However, it’s important to be aware that the feedback that users provide can sometimes introduce biases into my training.
If the feedback is consistently biased in a particular direction, this could affect the accuracy and fairness of my responses. This is why it’s important to carefully monitor and evaluate any feedback that is used to adjust my training, and to ensure that it is representative of a wide range of perspectives.
To address this issue, OpenAI has implemented a number of safeguards to prevent bias and ensure that my training data is as accurate and diverse as possible. For example, the training data is carefully curated to include a wide range of sources and perspectives, and the training process is carefully monitored to ensure that biases are not introduced.
Additionally, OpenAI has implemented a number of techniques to help identify and mitigate any biases that may be present in the training data or feedback. For example, I am periodically evaluated to ensure that my responses are accurate and unbiased, and any issues that are identified are addressed through additional training or other adjustments to the model.
Channelchek (PH) – As an editor I write for Channelchek about stocks, the financial markets, the economy and business climate. Are you a good resource for current events related to these topics ChatGPT?
ChatGPT – As an AI language model, I can certainly provide you with information on current events related to stocks, financial markets, the economy, and the business climate. I have been trained on a vast amount of text data, including news articles and other sources related to these topics, so I can provide you with up-to-date information and insights on current events.
When asking me questions related to these topics, it’s important to provide me with as much context and specificity as possible so that I can provide you with the most accurate and relevant information. For example, if you are looking for information on a particular company or sector, you could provide me with the name of the company or sector, as well as any other relevant details or questions you may have.
However, it’s important to note that my responses are generated based on patterns in the text data that I was trained on, and may not reflect the views or opinions of OpenAI. Additionally, while I can provide you with information on current events and trends, I cannot provide investment advice or make predictions about future market performance. It’s always important to carefully evaluate information and seek the advice of a qualified financial professional before making investment decisions.
Channelchek (PH) – Do users ask you to forecast the stock market direction?
ChatGPT – Yes, users sometimes ask me to forecast the direction of the stock market. However, as an AI language model, I cannot make accurate predictions about future market performance. While I can provide information on current market trends and historical data, predicting the future direction of the stock market is a highly complex task that involves a range of economic, political, and social factors.
It’s important to note that investing in the stock market involves a certain degree of risk, and investors should always carefully evaluate market conditions and seek the advice of a qualified financial professional before making investment decisions. While I can provide general information and insights related to stocks and financial markets, I cannot provide investment advice or predict the future performance of individual stocks or the overall market.
Channelchek (PH) – Are you familiar with Channelchek?
ChatGPT – While I am not specifically programmed to be familiar with individual websites, I may have come across content from Channelchek during my training.
That being said, I can still provide you with general information on what Channelchek is. From my understanding, Channelchek is a financial information platform that provides independent research, analysis, and market commentary on publicly traded companies. It offers a range of tools and resources for investors and financial professionals, including market data, stock quotes, and research reports.
Channelchek’s focus is on providing unbiased and independent information to help investors make informed investment decisions.
Channelchek (PH) – Does your AI technology pose a risk to traditional internet search engines?
ChatGPT – My purpose is not to compete with traditional search engines like Google or Bing, but rather to complement them by providing an additional source of information and assistance to users. While I am capable of providing answers to a wide range of questions and generating responses to open-ended queries, I am not designed to replace traditional search engines or web browsing.
Search engines like Google and Bing are still the primary means by which users navigate the internet and find information, and they use a range of sophisticated algorithms and machine learning techniques to index and rank content on the web. While I am capable of processing natural language queries and generating responses, my training data is based on pre-existing content, which means that my responses are generated based on patterns in the text data that I was trained on, rather than direct access to the vast amounts of data on the internet.
Early Boolean Phrase Search Tool
Overall, AI language models like me are part of a larger ecosystem of tools and technologies that are designed to help users access and navigate the vast amount of information available online. While there may be some overlap between the capabilities of traditional search engines and AI language models, both serve different purposes and can work together to provide users with the most comprehensive and accurate information possible.
Channelchek (PH) – What industries are you likely to disrupt and which are you likely to augment or help build?
ChatGPT – As an AI language model, my capabilities are quite broad, and I have the potential to impact a wide range of industries and areas of society. Here are a few ways in which I could potentially disrupt or augment various industries:
Industries that could be disrupted:
Customer service: AI language models like me are already being used by many companies to automate and improve customer service interactions, and this trend is likely to continue. As AI technology improves, it could potentially replace many human customer service jobs.
Content creation: AI language models have the potential to automate certain types of content creation, such as news articles, product descriptions, and even social media posts. This could have a significant impact on the journalism and writing industries.
Education: AI language models could potentially disrupt the traditional education model by providing personalized learning experiences and automating certain types of teaching and grading.
Industries that could be augmented:
Healthcare: AI language models could help augment healthcare by providing more accurate and personalized diagnoses, and by automating certain types of administrative tasks.
Finance: AI language models could help augment finance by providing more accurate and data-driven investment advice, and by automating certain types of financial analysis.
Research: AI language models could help augment research by processing and analyzing vast amounts of data, and by identifying patterns and insights that might be difficult for humans to spot on their own.
Overall, the impact of AI language models like me on various industries will depend on a wide range of factors, including the development of the technology, the regulatory environment, and societal attitudes toward automation and AI. While there may be some industries that are more susceptible to disruption or augmentation than others, it’s important to approach these developments with a nuanced understanding of the potential benefits and risks.
Channelchek (PH) – Are users using ChatGPT to create social media bots to respond without human intervention likely to flood the internet?
ChatGPT – While it is technically possible for users to use AI language models like ChatGPT to create social media bots that can respond to messages without human intervention, I cannot speculate on whether this is likely to flood the internet.
The use of AI language models like ChatGPT could potentially make it easier and more accessible for users to create more sophisticated chatbots that can mimic human conversation more convincingly.
It’s also important to consider the potential impact of widespread use of social media bots on the quality and authenticity of online interactions. While chatbots can be useful in certain contexts, they can also be used to spread misinformation and propaganda or to manipulate public opinion. As with any technology, it’s important to approach the use of AI language models and chatbots in a responsible and ethical way, and to consider the potential risks and benefits of their use.
Channelchek (PH) – What do you call one that uses ChatGPT?
ChatGPT – There is no specific term for a person who uses ChatGPT or other AI language models, as these tools are designed to be accessible and usable by anyone with an internet connection.
However, a person who uses ChatGPT to create chatbots or other automated tools could be referred to as an AI developer or AI engineer. Similarly, a person who uses ChatGPT to conduct research or analysis in a specific field could be referred to as an AI researcher or analyst.
Channelchek (PH) – How much do you cost?
As an AI language model, I do not have a specific cost as I am not a commercial product. My purpose is to provide information and assistance to users like you, and I am freely accessible through various platforms that integrate my technology, including chatbots, voice assistants, and search engines.
Channelchek (PH) – Should I throw out the encyclopedias on my book shelf and rely instead on ChatGPT?
ChatGPT – Ultimately, whether or not to keep your encyclopedias depends on your personal preferences and how you prefer to access information. While AI language models like ChatGPT are convenient and accessible, they may not always provide the level of detail or accuracy that you require for a specific question or topic. So, it’s always a good idea to consult multiple sources of information to ensure that you have a well-rounded understanding of a given topic.
Channelchek (PH) – How does one get started using ChatGPT for research?
ChatGPT – Getting started with using ChatGPT for research can involve several steps. Here are a few basic steps you can follow:
Identify your research question or topic: Start by identifying the research question or topic you want to investigate. This will help you to focus your search and make the best use of ChatGPT.
Choose a ChatGPT platform: There are several platforms that integrate ChatGPT, including chatbots, voice assistants, and search engines. Choose a platform that best fits your needs and preferences.
Familiarize yourself with the platform: Once you have chosen a platform, take some time to explore and familiarize yourself with its features and capabilities. Many platforms offer tutorials and guides to help you get started.
Start asking questions: Once you are comfortable with the platform, start asking questions related to your research topic. Try to ask open-ended questions that will allow ChatGPT to provide more detailed and relevant answers.
Evaluate the results: As you receive answers from ChatGPT, evaluate the accuracy and relevance of the information. Keep in mind that ChatGPT is not perfect and may not always provide the most accurate or comprehensive information. Be sure to double-check any information you receive with other sources to ensure its accuracy.
Refine your search: If you are not finding the information you need, try refining your search by using more specific keywords or phrases.
Overall, using ChatGPT for research can be a valuable tool for gathering information and conducting preliminary investigations. However, it’s important to keep in mind that it is just one tool in the research process, and should be used in conjunction with other sources of information and research methods.
Wrap Up
It’s easy to comprehend how this technology, which will likely see stronger competition in the coming year, will quickly become something that is used every day to help streamline how we do our jobs, and find information in our personal lives. Unlike an internet search engine, queries produce individual results tailored to the individual question. The same question will recieve different phraseology if asked a minute later. Whereas Google or DuckDuckGo list websites that may provide the answer, ChatGPT responds using its own answer using artificial intelligence.
Getting started is as easy as going to OpenAI.com and navigating to Chat.OpenAI.com and providing an email and verification phone number. Click on my name below and write me, I’d love to hear what you are using it for.
One Stop Systems, Inc. (OSS) designs and manufactures innovative AI Transportable edge computing modules and systems, including ruggedized servers, compute accelerators, expansion systems, flash storage arrays, and Ion Accelerator™ SAN, NAS, and data recording software for AI workflows. These products are used for AI data set capture, training, and large-scale inference in the defense, oil and gas, mining, autonomous vehicles, and rugged entertainment applications. OSS utilizes the power of PCI Express, the latest GPU accelerators and NVMe storage to build award-winning systems, including many industry firsts, for industrial OEMs and government customers. The company enables AI on the Fly® by bringing AI datacenter performance to ‘the edge,’ especially on mobile platforms, and by addressing the entire AI workflow, from high-speed data acquisition to deep learning, training, and inference. OSS products are available directly or through global distributors. For more information, go to www.onestopsystems.com.
Joe Gomes, Managing Director – Generalist Analyst, Noble Capital Markets, Inc.
Joshua Zoepfel, Research Associate, Noble Capital Markets, Inc.
Refer to the full report for the price target, fundamental analysis, and rating.
Passing the Torch. In an unexpected move, yesterday the CEO of One Stop Systems, David Raun, announced he is stepping down from the position effective upon the appointment of his successor. We had spoken with Mr. Raun earlier this week about the 2023 vision and he came across as extremely enthusiastic with OSS’s opportunity set, especially related to the defense industry. The company has yet to identify a successor but has retained a search firm to help the Company find a suitable replacement. Notably, Mr. Raun will continue to serve as a member of the company’s Board of Directors.
Defense Experience Valued. Mr. Raun’s decision to step aside appears related to a desire to bring in a CEO with a background in the defense industry, as the near term opportunity set for OSS is in this space. As mentioned in the release, Mr. Raun stated, “I feel it’s time to bring in new leadership with deep experience and high-level contacts in the defense sector to scale the opportunities and growth.”
Equity Research is available at no cost to Registered users of Channelchek. Not a Member? Click ‘Join’ to join the Channelchek Community. There is no cost to register, and we never collect credit card information.
This Company Sponsored Research is provided by Noble Capital Markets, Inc., a FINRA and S.E.C. registered broker-dealer (B/D).
*Analyst certification and important disclosures included in the full report. NOTE: investment decisions should not be based upon the content of this research summary. Proper due diligence is required before making any investment decision.
Twitter’s New Data Fees Leave Scientists Scrambling for Funding – or Cutting Research
Twitter is ending free access to its application programming interface, or API. An API serves as a software “middleman” allowing two applications to talk to each other. An API is an accessible way to collect and share data within and across organizations. For example, researchers at universities unaffiliated with Twitter can collect tweets and other data from Twitter through their API.
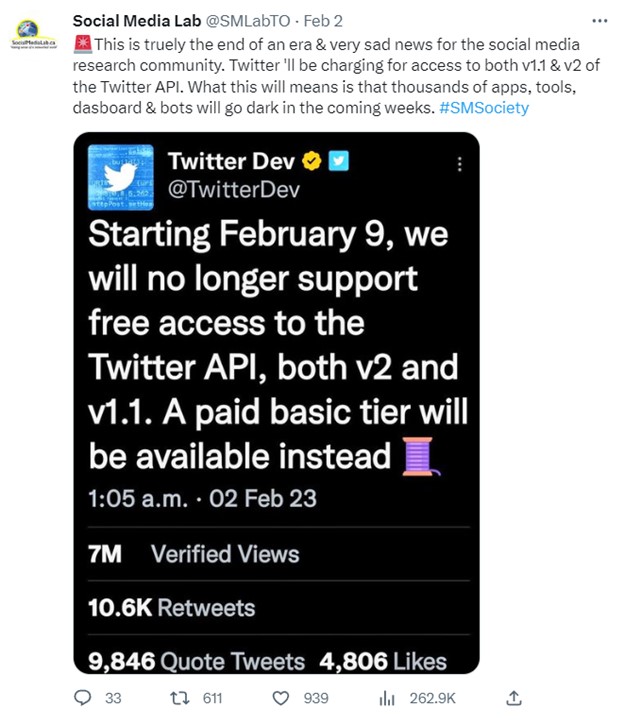
Starting Feb. 9, 2023, those wanting access to Twitter’s API will have to pay. The company is looking for ways to increase revenue to reverse its financial slide, and Elon Musk claimed that the API has been abused by scammers. This cost is likely to hinder the research community that relies on the Twitter API as a data source.
The Twitter API launched in 2006, allowing those outside of Twitter access to tweets and corresponding metadata, information about each tweet such as who sent it and when and how many people liked and retweeted it. Tweets and metadata can be used to understand topics of conversation and how those conversations are “liked” and shared on the platform and by whom.
This article was republished with permission from The Conversation, a news site dedicated to sharing ideas from academic experts. It represents the research-based findings and thoughts of, Jon-Patrick Allem, Assistant Professor of Research in Population and Public Health Sciences, University of Southern California.
As a scientist and director of a research lab focused on collecting and analyzing posts from social media platforms, I have relied on the Twitter API to collect tweets pertinent to public health for over a decade. My team has collected more than 80 million observations over the past decade, publishing dozens of papers on topics from adolescents’ use of e-cigarettes to misinformation about COVID-19.
Twitter has announced that it will allow bots that it deems provide beneficial content to continue unpaid access to the API, and that the company will offer a “paid basic tier,” but it’s unclear whether those will be helpful to researchers.
Blocking Out and Narrowing Down
Twitter is a social media platform that hosts interesting conversations across a variety of topics. As a result of free access to the Twitter API, researchers have followed these conversations to try to better understand public attitudes and behaviors. I’ve treated Twitter as a massive focus group where observations – tweets – can be collected in near real time at relatively low cost.
The Twitter API has allowed me and other researchers to study topics of importance to society. Fees are likely to narrow the field of researchers who can conduct this work, and narrow the scope of some projects that can continue. The Coalition for Independent Technology Research issued a statement calling on Twitter to maintain free access to its API for researchers. Charging for access to the API “will disrupt critical projects from thousands of journalists, academics and civil society actors worldwide who study some of the most important issues impacting our societies today,” the coalition wrote.
@SMLabTO (Twitter)
The financial burden will not affect all academics equally. Some scientists are positioned to cover research costs as they arise in the course of a study, even unexpected or unanticipated costs. In particular, scientists at large research-heavy institutions with grant budgets in the millions of dollars are likely to be able to cover this kind of charge.
However, many researchers will be unable to cover the as yet unspecified costs of the paid service because they work on fixed or limited budgets. For example, doctoral students who rely on the Twitter API for data for their dissertations may not have additional funding to cover this charge. Charging for access to the Twitter API will ultimately reduce the number of participants working to understand the world around us.
The terms of Twitter’s paid service will require me and other researchers to narrow the scope of our work, as pricing limits will make it too expensive to continue to collect as much data as we would like. As the amount of data requested goes up, the cost goes up.
We will be forced to forgo data collection on some topic areas. For example, we collect a lot of tobacco-related conversations, and people talk about tobacco by referencing the behavior – smoking or vaping – and also by referencing a product, like JUUL or Puff Bar. I add as many terms as I can think of to cast a wide net. If I’m going to be charged per word, it will force me to rethink how wide a net I cast. This will ultimately reduce our understanding of issues important to society.
Difficult Adjustments
Costs aside, many academic institutions are likely to have a difficult time adapting to these changes. For example, most universities are slow-moving bureaucracies with a lot of red tape. To enter into a financial relationship or complete a small purchase may take weeks or months. In the face of the impending Twitter API change, this will likely delay data collection and potential knowledge.
Unfortunately, everyone relying on the Twitter API for data was given little more than a week’s notice of the impending change. This short period has researchers scrambling as we try to prepare our data infrastructures for the changes ahead and make decisions about which topics to continue studying and which topics to abandon.
If the research community fails to properly prepare, scientists are likely to face gaps in data collection that will reduce the quality of our research. And in the end that means a loss of knowledge for the world.
Recent Investment Trends Include Small-Cap Artificial Intelligence Stocks
C3 AI, sometimes written C3.ai, is an artificial intelligence platform that provides services for companies to build large-scale AI applications. Its stock had the fifth highest traded shares among Fidelity’s retail investors on Monday (February 6). This included a record-breaking $31.4 million worth of shares traded among the broker’s individual self-directed traders. According to Reuters, “Retail investors are piling up on small-cap firms that employ artificial intelligence amid intensifying competition between tech titans.” The article points to Google and Microsoft as examples of companies that expect AI to be the next meaningful driver of growth.
Investors, for their part, are looking to get ahead of any acquisition spree that deep-pocketed companies may embark on, which could include buying the advanced technology by acquiring small-cap tech firms.
Focus Heightened by ChatGPT
The spotlight ChatGPT finds itself in, three months after its launch, is indicicative of the interest in this technology amongst investors and users. With applications as numerous than one can think up, the technology could outdate many services provided by tech companies like Alphabet (GOOGL), or Microsoft (MSFT) – big tech has catching up to do. This seems to have created a race by cash rich companies to not be disrupted and left behind.
Investor’s recent focus on small companies in this space prefer those that are concentrated in AI technology. One main reason is that small-cap or microcap firms in this space are likely to have AI as a more concentrated part of their business. The bet being that whether the small company continues to grow independently, or is acquired by a larger firm looking to instantly be par with current technology, doesn’t much matter, it is a win for the investor if either occurs.
And it is a win, C3 AI stock rallied 46% last week, and climbed another 6.5% on Monday. It is now up 146% year to date.
Other Companies Involved
SoundHound AI, provides a voice AI platform services, and Thailand-based security firm Guardforce AI have more than doubled so far this year, while analytics firm BigBear.AI has increased ninefold.
US-listed shares of Baidu Inc climbed after the Chinese search engine indicated it would complete an internal test of a ChatGPT-style project called “Ernie Bot” next month.
Shares of Microsoft, which supports ChatGPT parent OpenAI, had been ratcheting up over the past month. The company is expected to make an announcement on their AI gained 1.5% in premarket trading ahead of the AI plans this week.
Google-owner Alphabet Inc said this week it would launch Bard, a chatbot service for developers, alongside its search engine.
Take Away
Change in technology that leads to improvements in daily lives has always been a focus of investors betting on which companies will outlast the others with “the next big thing.” These companies start out as small growth companies as Apple (AAPL) did in 1976. Then, a number of paths lay ahead. They either grow on their own like the Jobs/Wozniak computer maker did, get acquired for an early payday for investors and other stakeholders, or they can be outcompeted leaving investors with a non-performing asset.
Channelchek is a platform that specializes in bringing data and research on small-cap companies, including many varieties of new technology, to the investors that insist on being informed before they place a trade. Discover more on the industries of tomorrow by signing up for notifications in your inbox from Channelchek by registering here.
Discovering Why Trading is Halted on One of Your Stocks
Fair and orderly trading is an admirable goal of any system of exchange. As part of this ideal, exchanges, the SEC, and brokers can temporarily halt trading in stocks. The impact of news, or tripped circuit breakers designed to decelerate snowballing reactions (both human and programmed reactions), are the most common reasons to halt trading. There have also been events when a computer glitch, either feeding into an exchange or into the exchange’s systems, has triggered a pause or a halt. A total of 77 stocks were reportedly halted after the opening on the NYSE (January 24). They were all labeled “LULD,” this code is used to indicate it was a volatility trading pause. But officials at the NYSE say they’re still looking into it.
Reasons to Halt Trading
Companies listed on a U.S. stock exchange are responsible for notifying the listing exchange about any announcements or corporate developments that might affect trading in its stock. These often include:
Changes related to the financial health of the company
Changes in key management individuals
Major corporate transactions like restructurings or mergers
Significant positive or negative information about its products
Legal or regulatory developments that affect the company’s ability to conduct business
A circuit breaker has been reached due to volatility
Stock Halt Codes
Each day the exchanges list stocks as they are paused or halted and include a code to indicate the reason. The codes help market participants understand for how long it may be halted and for what general reason. It’s a good idea to be familiar with the codes shown below.
LUDP or LULD: Volatility trading pause (high volatility risk for investors).
T1: News pending (halted to give investors of all varieties ample time to evaluate).
H10: This is not enacted by the exchange but instead by the SEC (could be any number of regulatory reasons).
Image: Two of the many stocks halted on January 24, 2023 (NYSE Website)
The reason for the recent multiple stock pauses was available immediately on the NYSE website. Many of the stocks showed they were opening down substantially; the exchange says they are looking into this further.
There are also times when a circuit breaker stops trading across the market exchange. This is not the reason for the multiple pauses experienced in January, but also worth mentioning. There are three levels of halt based on size of the markets (S&P 500) move.
Level 1: 15-minute halt due to a 7% decrease from the S&P 500’s previous close
Level 2: 15-minute halt due to a 13% decrease from the S&P 500’s previous close
Level 3: Day-long halt due to a 20% decrease from the S&P 500’s previous close
Take Away
When the market opens and it is not business as usual, a lot of frustration can be saved by knowing market rules and finding resources to get a fast answer. While other traders wait for their favorite news service to report on it, going directly to the NYSE website to, in this case, get a listing of affected stocks and why, can put you ahead of those that are waiting for CNBC or another news outlet. Nasdaq also will post paused or halted stocks and use the same codes as above to indicate why.
Meme Stocks are Putting Up a Strong Offense – Is this a Positive Sign for the Broader Market?
During the first three weeks of 2023, meme stocks and crypto tokens, often viewed in the same category, have scored early. Have meme stock investors now come off the sidelines after the poor performance last year? In 2022 they completely failed to repeat their historic 2021 wins. So the current rally is a great sign.
Successful meme trading occurs when there is a mass movement by retail accounts. So far in 2023, like flipping a New Year’s switch, retail is again causing a commotion. And by looking at the trending hashtags and cashtags on Reddit and Twitter, fans are also making an increased volume of noise.
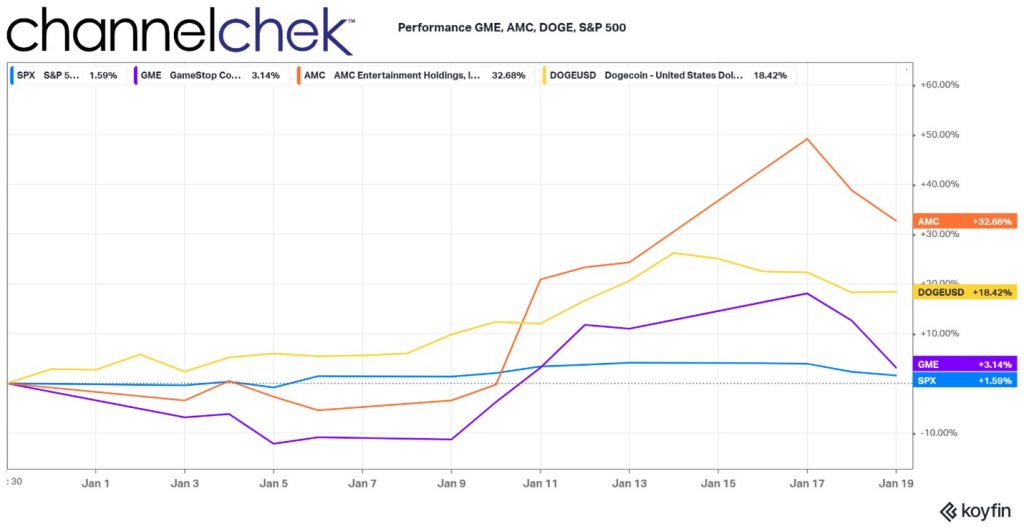
Looking at the 2023 performance chart above, the S&P 500 ($SPY) opened the year more positively than the prior year ended. While one obviously can not extrapolate out the current 1.59% return for the year, annualizing it helps bring the short period being measured into perspective. The overall market is running at a 30.50% pace this year. Wow.
The performance of GameStop ($GME), which was one of the original and among the most recognized meme stocks, is outperforming the overall market by double. While it is well off its high reached earlier this week, the above 3% return is running well ahead of the overall stock market.
The cryptocurrency in the group, the often maligned Dogecoin (DOGE.X), which is legendary as it started as a parody token, has been tracking Bitcoins (BTC.X) rise closely. DOGE is up over 18% on the year, averaging an increase near 1% per day.
AMC Entertainment ($AMC), which is off its high of almost 50% a few days ago, now has returned over 32% to those holding the stock. To put this in perspective, it has an annualized return in 2023, so far, of 628%. This likely has gotten ahead of itself, time will tell, but it is the clear MVP among the meme stocks to date.
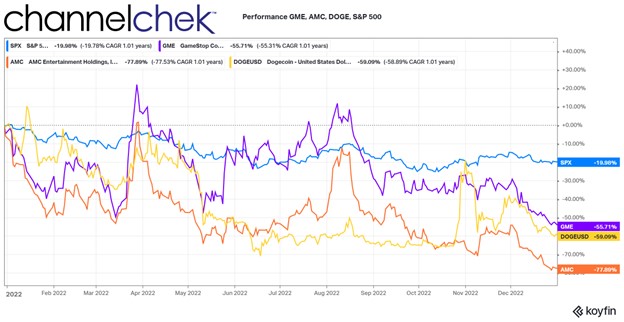
Last year the overall market, despite being down near 20%,, trounced the meme stocks that have thus far put in a stellar showing in 2023.
Is Meme Rally a Reason for Optimism?
Retail dollars coming in off the sidelines and mounting enough of a drive to force values up so quickly indicates a mood change that may play out elsewhere in the financial markets. The average trade size of retail is so small that it indicates a large wave of willingness, if not outright optimism, that putting money in play will lead to gains. Similar forces are causing money to move into mutual funds and ETFs, which serves to put upward pressure on the overall market.
Wall Street’s so-called “fear gauge,” the Volatility Index ($VIX) dropped on average 1% a day since the start of the year. This is a spectacular trend. It now stands near its long-term average of 21; a reading above 30 is considered bearish. The $VIX was last near these levels in April of last year. The overall market stood 15% higher back then compared to today.
The Volatility Index has applications across digital assets as well. On a scale of 1-100, where 100 is overly greedy, The Crypto Fear and Greed Index stands near neutral at 52. This is also the most optimistic reading since April. It may be considered even more positive since the digital asset market is still digesting the “unprecedented” bankruptcy of crypto exchange FTX.
Meme mania has never been about macro; more about crowd behavior, commitment, and momentum. But there are fundamentals that are viewed by stock investors of all varieties that likely have fed into the burst of interest. First, economic data suggests that inflation is trending lower. This deceleration lessens the need for the Federal Reserve to put the brakes on the economy. The enthusiasm is just more pronounced among this style of retail traders that are loud and proud. They serve as cheerleaders to captivate the imagination of more traditional investors.
Take Away
The overall financial markets opened with a sigh of relief in 2023. Meme stocks and crypto opened the year with extreme optimism. The optimism isn’t without cause; a number of factors point to a much better environment than the dismal returns of last year.
Will this contagion, led by many small accounts, inspire further the larger individual and institutional investors to commit investments in the broader markets, there are many signs that suggest the year is starting that way, fear of missing out will build with each day that the markets move in a positive direction.


