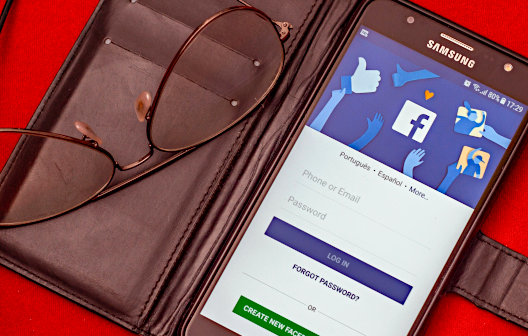
Release – Voyager Digital Announces Conditional Approval to List on the Toronto Stock Exchange


Voyager Digital Announces Conditional Approval to List on the Toronto Stock Exchange


– Stock will trade on the TSX under the new ticker symbol VOYG and de-list from the CSE –
– The Company is also announcing it has filed and obtained a receipt for its final short form Base Shelf Prospectus –

NEW YORKAug. 23, 2021 /PRNewswire/ – Voyager Digital  Ltd. (“Voyager” or the “Company”) (CSE: VYGR) (OTCQX: VYGVF) (FRA: UCD2), a fast-growing, publicly-traded cryptocurrency platform in the United States, is pleased to announce that it has received conditional approval from the Toronto Stock Exchange to list its common shares on the Toronto Stock Exchange (the “TSX”) and will voluntarily delist its common shares from  the Canadian Securities Exchange (the “CSE”). VOYG will be the new ticker symbol for trading on the TSX.

“Its a great accomplishment for Voyager that the TSX has conditionally approved our listing on the TSX,” said Steve Ehrlich, CEO and Co-founder of Voyager. Our goal from day one was to be publicly traded and fully transparent to our community, which we accomplished by listing on the CSE. The Company is now at a stage where investors could benefit from an up-listing to a more senior exchange. With Voyagers crypto trading platform generating revenue and cash flow at an accelerating pace, we feel it’s time to uplist so that we can increase our exposure to a larger investor universe.”

Final approval of the listing is subject to the Company meeting certain customary conditions required by the TSX. Voyager will officially announce when the trading of Voyager common shares is expected to commence on the TSX. Upon completion of the final listing requirements, the Company’s common shares will be delisted from the CSE. Shareholders are not required to exchange their share certificates or take any other action in connection with the TSX listing. A TSX listing is one of the requirements for inclusion in certain indices including the S&P/TSX Composite Index and related exchange-traded products (ETFs). There can be no certainty that the company would qualify or be eligible to be included in such indices and ETFs.

Voyager is also pleased to announce that it has filed and obtained a receipt for its final short form Base Shelf Prospectus with the securities regulatory authorities in each of the provinces and territories of Canada. The Base Shelf Prospectus will allow the Company to make offerings of common shares, warrants, units, debt securities, and subscription receipts, or any combination thereof, for up to an aggregate total of US$300 million during the 25-month period that the Base Shelf Prospectus is effective. If any securities are offered under the Base Shelf Prospectus, the terms of any such securities and the intended use of the net proceeds resulting from such offering would be established at the time of any offering and would be described in a prospectus supplement filed with the applicable Canadian securities regulators at the time of such an offering. There is no certainty that any securities will be offered or sold under the Base Shelf Prospectus within its 25-month period of effectiveness. 

About Voyager Digital Ltd.
Voyager Digital Ltd. (CSE: VYGR;OTCQX: VYGVF; FRA: UCD2) is the fast-growing, publicly-traded cryptocurrency platform founded in 2018 to bring choice, transparency, and cost efficiency to the marketplace. Voyager offers a secure way to invest and trade in over 60 different crypto assets, with zero commissions, using its easy-to-use mobile application, and earn rewards up to 12 percent APY on more than 30 cryptocurrencies. Through its subsidiary Coinify ApS, Voyager provides crypto payment solutions for both consumers and merchants around the globe. To learn more about the company, please visit https://www.investvoyager.com.

Neither the TSX, the CSE nor its Market Regulator (as that term is defined in the policies of the Canadian Securities Exchange) accepts responsibility for the adequacy or accuracy of this release. No securities regulatory authority has either approved or disapproved of the contents of this press release.

Cautionary Statement Regarding Forward-Looking Information
This news release contains “forward-looking statements” that are based on expectations, estimates, projections and interpretations as at the date of this news release. Forward-looking statements are frequently characterized by words such as “plan”, “expect”, “project”, “seek”, “intend”, “believe”, “anticipate”, “estimate”, “suggest”, “indicate” and other similar words or statements that certain events or conditions “may” or “will” occur. Such forward looking statements involve known and unknown risks, uncertainties and other factors which may cause the actual results, performance or achievements of the Company to be materially different from any future results, performance or achievements expressed or implied by such forward-looking statements. Such risks and other factors may include, but are not limited to, those risk factors outlined in the Company’s Management Discussion and Analysis as filed on SEDAR. The Company does not undertake to update any forward-looking information except in accordance with applicable securities laws.

Voyager Digital Ltd. Contacts
Michael Legg
Chief Communications Officer
(212) 547-8807
mlegg@investvoyager.com

Voyager Public Relations Team
pr@investvoyager.com

SOURCE Voyager Digital (Canada) Ltd.

Voyager Digital Announces Conditional Approval to List on the Toronto Stock Exchange


Voyager Digital Announces Conditional Approval to List on the Toronto Stock Exchange


– Stock will trade on the TSX under the new ticker symbol VOYG and de-list from the CSE –
– The Company is also announcing it has filed and obtained a receipt for its final short form Base Shelf Prospectus –

NEW YORKAug. 23, 2021 /PRNewswire/ – Voyager Digital  Ltd. (“Voyager” or the “Company”) (CSE: VYGR) (OTCQX: VYGVF) (FRA: UCD2), a fast-growing, publicly-traded cryptocurrency platform in the United States, is pleased to announce that it has received conditional approval from the Toronto Stock Exchange to list its common shares on the Toronto Stock Exchange (the “TSX”) and will voluntarily delist its common shares from  the Canadian Securities Exchange (the “CSE”). VOYG will be the new ticker symbol for trading on the TSX.

“Its a great accomplishment for Voyager that the TSX has conditionally approved our listing on the TSX,” said Steve Ehrlich, CEO and Co-founder of Voyager. Our goal from day one was to be publicly traded and fully transparent to our community, which we accomplished by listing on the CSE. The Company is now at a stage where investors could benefit from an up-listing to a more senior exchange. With Voyagers crypto trading platform generating revenue and cash flow at an accelerating pace, we feel it’s time to uplist so that we can increase our exposure to a larger investor universe.”

Final approval of the listing is subject to the Company meeting certain customary conditions required by the TSX. Voyager will officially announce when the trading of Voyager common shares is expected to commence on the TSX. Upon completion of the final listing requirements, the Company’s common shares will be delisted from the CSE. Shareholders are not required to exchange their share certificates or take any other action in connection with the TSX listing. A TSX listing is one of the requirements for inclusion in certain indices including the S&P/TSX Composite Index and related exchange-traded products (ETFs). There can be no certainty that the company would qualify or be eligible to be included in such indices and ETFs.

Voyager is also pleased to announce that it has filed and obtained a receipt for its final short form Base Shelf Prospectus with the securities regulatory authorities in each of the provinces and territories of Canada. The Base Shelf Prospectus will allow the Company to make offerings of common shares, warrants, units, debt securities, and subscription receipts, or any combination thereof, for up to an aggregate total of US$300 million during the 25-month period that the Base Shelf Prospectus is effective. If any securities are offered under the Base Shelf Prospectus, the terms of any such securities and the intended use of the net proceeds resulting from such offering would be established at the time of any offering and would be described in a prospectus supplement filed with the applicable Canadian securities regulators at the time of such an offering. There is no certainty that any securities will be offered or sold under the Base Shelf Prospectus within its 25-month period of effectiveness. 

About Voyager Digital Ltd.
Voyager Digital Ltd. (CSE: VYGR;OTCQX: VYGVF; FRA: UCD2) is the fast-growing, publicly-traded cryptocurrency platform founded in 2018 to bring choice, transparency, and cost efficiency to the marketplace. Voyager offers a secure way to invest and trade in over 60 different crypto assets, with zero commissions, using its easy-to-use mobile application, and earn rewards up to 12 percent APY on more than 30 cryptocurrencies. Through its subsidiary Coinify ApS, Voyager provides crypto payment solutions for both consumers and merchants around the globe. To learn more about the company, please visit https://www.investvoyager.com.

Neither the TSX, the CSE nor its Market Regulator (as that term is defined in the policies of the Canadian Securities Exchange) accepts responsibility for the adequacy or accuracy of this release. No securities regulatory authority has either approved or disapproved of the contents of this press release.

Cautionary Statement Regarding Forward-Looking Information
This news release contains “forward-looking statements” that are based on expectations, estimates, projections and interpretations as at the date of this news release. Forward-looking statements are frequently characterized by words such as “plan”, “expect”, “project”, “seek”, “intend”, “believe”, “anticipate”, “estimate”, “suggest”, “indicate” and other similar words or statements that certain events or conditions “may” or “will” occur. Such forward looking statements involve known and unknown risks, uncertainties and other factors which may cause the actual results, performance or achievements of the Company to be materially different from any future results, performance or achievements expressed or implied by such forward-looking statements. Such risks and other factors may include, but are not limited to, those risk factors outlined in the Company’s Management Discussion and Analysis as filed on SEDAR. The Company does not undertake to update any forward-looking information except in accordance with applicable securities laws.

Voyager Digital Ltd. Contacts
Michael Legg
Chief Communications Officer
(212) 547-8807
mlegg@investvoyager.com

Voyager Public Relations Team
pr@investvoyager.com

SOURCE Voyager Digital (Canada) Ltd.

Release – OSS Reports Q2 2021 Revenue up 28 to $14.9 Million Delivering Income of $1.7 Million or $0.09 per Share


OSS Reports Q2 2021 Revenue up 28% to $14.9 Million, Delivering Income of $1.7 Million or $0.09 per Share


ESCONDIDO, Calif., Aug. 12, 2021 (GLOBE NEWSWIRE) — One Stop Systems, Inc. (Nasdaq: OSS), a leader in AI Transportable solutions on the edge, reported results for the second quarter ended June 30, 2021. All quarterly comparisons are to the same year-ago period unless otherwise noted. The company will hold a conference call at 5:00 p.m. Eastern time today to discuss the results (see dial-in information below).  

Q2 2021 Financial Highlights

  • Revenue totaled $14.9 million, up 12% sequentially and up 28% versus the same year-ago quarter.
  • Gross margin was 31.2%, up 2.6 percentage points.
  • GAAP net income totaled $1.7 million or $0.09 per diluted share versus a net loss of $12,000 or $(0.00) per diluted share in the year-ago quarter. GAAP net income includes forgiveness of PPP loan of approximately $1.5 million.
  • Non-GAAP net income was $812,000 or $0.04 per basic and diluted share, versus $248,000 or $0.01 per diluted share in the same year-ago quarter. Non-GAAP net income excludes $1.5 million of PPP loan forgiveness (see definition of this and other non-GAAP measures and reconciliation to GAAP, below).
  • Adjusted EBITDA was $1.4 million, up $1.3 million and reaching more than 9% of total revenue. Adjusted EBITDA excludes $1.5 million of PPP loan forgiveness.
  • Cash, cash equivalents and short-term investments totaled $18.5 million on June 30, 2021.

First Half 2021 Financial Highlights

  • Revenue totaled a record $28.2 million, up 13%.
  • Gross margin was 32.2%, up 5.3 percentage points.
  • GAAP net income totaled $1.7 million or $0.09 per share, up by $2.8 million. GAAP net income includes forgiveness of PPP loan of approximately $1.5 million.
  • Non-GAAP net income was $1.5 million or $0.08 per basic and diluted share, up by $1.9 million. Non-GAAP net income excludes $1.5 million of PPP loan forgiveness.
  • Adjusted EBITDA was $2.5 million, up by $3.3 million. Adjusted EBITDA excludes $1.5 million of PPP loan forgiveness.

Q2 2021 Operational Highlights

  • Secured three major design wins, which included two AI on the Fly® applications, a transportable edge flash storage solution, an autonomous vehicle training system, and a high-performance computing medical controller system. Total major wins for the first half of the year totaled six wins. In addition to the confirmed wins, the company has 17 major pending opportunities.
  • Operating expenses as a percentage of revenue decreased to 27.7% from 32.1% in the same year-ago quarter, which was primarily due to the company’s expense reduction program initiated in early 2020.

Management Commentary

“In Q2, we achieved strong top-line growth with revenue up 28% to $14.9 million, and this helped drive first half revenue up 13% to a record $28.2 million,” commented OSS president and CEO, David Raun. “The strong top-line performance reflects our broadening customer base and new wins with major accounts.

“We also drove down our operating expenses as a percentage of revenue. Together, these results generated solid bottom-line improvements with net income in the second quarter increasing $1.7 million versus the year-ago quarter and adjusted EBITDA up by $1.3 million, reaching more than 9% of total revenue.

“During the second quarter, we won three new major opportunities that included a medical control system, an edge flash storage program, and a GPU-accelerated training and inference system with a major vehicle supplier in Germany. The vehicle supplier win expanded our footprint in the autonomous vehicle market. Altogether, these successes brought our first half of the year major wins to six. We also shipped our latest SDS rugged server which was designed into a military mobile datacenter application.

“While we expect the effects of the pandemic to continue through the rest of the year, we are seeing improving customer demand. Even our commercial aerospace customers, which were severely affected by COVID, are re-engaging with us on new programs, as well as bringing back programs previously put on hold. We have now 17 major pending opportunities in our pipeline that we are focused on closing.

“Executing on our long-term strategic vision and product road map continues to be our top priority. This plan includes strengthening our value proposition in the fast-growing, edge-computing industry with the goal of becoming the market leader in the AI Transportables space. This target market requires the highest performance computing in a challenging mobile environment, which we believe to be one of our greatest strengths.

“We continue to proactively manage the challenges imposed by the pandemic, and in doing so, our team has become adept at optimizing engineering and manufacturing processes, shipping product on time, and not only protecting but increasing margins.

“While we are experiencing increased product demand, supply chain challenges such as price increases and long lead-times continue to be significant. However, our team is managing the fluid landscape on multiple fronts by qualifying additional vendors, implementing extended purchase planning, and focusing on other strategic and tactical activities.

“We believe our execution of our strategic plan, corporate reorganization, and improved board composition has contributed to a tripling of shareholder value over the past two years. So far this year, we have made better-than-expected top- and bottom-line progress.

“Given our adjusted EBITDA at 9% of total revenue in the first half of the year, we are well on our way to achieving our objective of it being no less than 10% of revenues. For the current third quarter, we believe we are on track to generate revenue of about $15.9 million, which would represent an increase of 23% over the same year-ago quarter and would exceed all historical third quarters.”

Q2 2021 Financial Summary
Revenue in the second quarter of 2021 increased 28% to $14.9 million, compared to $11.6 million in the same year-ago quarter. This growth was primarily driven by improvements in the sale of ruggedized servers in the media and entertainment markets, differentiated military AI Transportables data processing and storage products, as well as continued expansion of the company’s customer base and new applications within key accounts.

Gross profit was $4.7 million or 31.2% of revenue in the second quarter of 2021, up from $3.3 million or 28.6% of revenue in Q2 2020. The improvement in quarterly margin was attributed to changes in product mix and type of customer.

Operating expenses increased 11% to $4.1 million in the second quarter of 2021 compared to $3.7 million in the same year-ago quarter. Operating expenses as a percentage of revenue decreased to 27.7% in the second quarter of 2021 versus 32.1% in the year-ago quarter.

Net income on a GAAP basis totaled $1.7 million in the second quarter of 2021 or $0.09 per diluted share compared to a net loss of $12,000 or $(0.00) per diluted share in the year-ago period. This improvement was due to more favorable gross margins as well as debt and interest forgiveness on the company’s PPP loan of approximately $1.5 million.

Non-GAAP net income totaled $812,000 or $0.04 per basic and diluted share in the second quarter of 2021, as compared to a non-GAAP net income of $248,000 or $0.01 per diluted share in the same year-ago period. Non-GAAP net income excludes the $1.5 million PPP loan forgiveness.

Adjusted EBITDA, a non-GAAP term, totaled $1.4 million in the second quarter of 2021 as compared to $73,000 in the same year-ago period. Adjusted EBITDA excludes the $1.5 million PPP loan forgiveness.

Cash, cash equivalents and short-term investments totaled $18.5 million as of June 30, 2021, as compared to $19.6 million on March 31, 2021. The company believes its cash position and other available funds provide sufficient liquidity to meet its cash requirements for working capital and paying down debt, while supporting its strategic growth initiatives.

First Half 2021 Financial Summary

Total revenues increased 13% to a record $28.2 million compared to $25.0 million in the prior year. This growth was primarily driven by improvements in the sale of ruggedized servers in the media and entertainment markets, our differentiated military AI Transportables data processing and storage products, as well as continued expansion of our customer base and new applications within key accounts.

Gross profit for the first half of 2021 was $9.1 million or 32.2% of revenue, compared to $6.7 million or 26.9% of revenue in the same year-ago period. The improvements in quarterly margins were attributable to product mix, additional sales of high-value products, and increased efficiencies.

Total operating expenses decreased 4% to $8.3 million versus the first half of 2020. Operating expenses as a percentage of revenue improved to 29.4% during the first half of 2021 versus 34.6% in the same year-ago period.

Net income on a GAAP basis totaled $1.7 million or $0.09 per diluted share, as compared to a loss of $1.1 million or $(0.07) per share in the first half of 2020. Net Income includes the $1.5 million PPP loan forgiveness.

Non-GAAP net income totaled $1.5 million or $0.08 per diluted share, as compared to non-GAAP net loss of $466,000 or $(0.03) per share in the first half of 2020. Non-GAAP net income excludes the $1.5 million PPP loan forgiveness.

Adjusted EBITDA, a non-GAAP term, totaled $2.5 million as compared to negative $885,000 in the first half of 2020. Adjusted EBITDA excludes the $1.5 million PPP loan forgiveness.

Outlook
For the third quarter of 2021, OSS expects revenue of approximately $15.9 million which would be an increase of 7% sequentially and 23% versus the same year-ago quarter.

Conference Call
OSS management will hold a conference call to discuss its second quarter 2021 results later today, followed by a question-and-answer period.

Date: Thursday, August 12, 2021
Time: 5:00 p.m. Eastern time (2:00 p.m. Pacific time)
Toll-free dial-in number: 1-866-269-4260
International dial-in number: 1-786-204-3966
Conference ID: 1453156

The conference call will be webcast live and available for replay here as well as via a link in the Investors section of the company’s website at onestopsystems.com/pages/investors. OSS regularly uses its website to disclose material and non-material information to investors, customers, employees and others interested in the company.

Please call the conference telephone number five minutes prior to the start time. An operator will register your name and organization. If you have any difficulty connecting with the conference call, please contact CMA at 1-949-432-7566.

A replay of the call will be available after 8:00 p.m. Eastern time on the same day through August 26, 2021.

Toll-free replay number: 1-844-512-2921
International replay number: 1-412-317-6671
Replay ID: 1453156

About One Stop Systems
One Stop Systems, Inc. (OSS) designs and manufactures innovative AI Transportable edge computing modules and systems, including ruggedized servers, compute accelerators, expansion systems, flash storage arrays and Ion Accelerator™ SAN, NAS and data recording software for AI workflows. These products are used for AI data set capture, training, and large-scale inference in the defense, oil and gas, mining, autonomous vehicles and rugged entertainment applications.
  
OSS utilizes the power of PCI Express, the latest GPU accelerators and NVMe storage to build award-winning systems, including many industry firsts, for industrial OEMs and government customers. The company enables AI on the Fly® by bringing AI datacenter performance to ‘the edge’, especially on mobile platforms, and by addressing the entire AI workflow, from high-speed data acquisition to deep learning, training and inference. OSS products are available directly or through global distributors. For more information, go to www.onestopsystems.com.

Non-GAAP Financial Measures
Management believes that the use of adjusted earnings before interest, taxes, depreciation and amortization, or adjusted EBITDA, is helpful for an investor to assess the performance of the Company. The Company defines adjusted EBITDA as income (loss) before interest, taxes, depreciation, amortization, acquisition expenses, impairment of long-lived assets, financing costs, fair value adjustments from purchase accounting, stock-based compensation expense and expenses related to discontinued operations. For this reporting period, it excludes PPP loan forgiveness, which the company does not anticipate will reoccur in the foreseeable future.
  
Adjusted EBITDA is not a measurement of financial performance under generally accepted accounting principles in the United States, or GAAP. Because of varying available valuation methodologies, subjective assumptions and the variety of equity instruments that can impact a company’s non-cash operating expenses, management believes that providing a non-GAAP financial measure that excludes non-cash and non-recurring expenses allows for meaningful comparisons between the company’s core business operating results and those of other companies, as well as providing management with an important tool for financial and operational decision making and for evaluating the company’s own core business operating results over different periods of time.
  
The company’s adjusted EBITDA measure may not provide information that is directly comparable to that provided by other companies in its industry, as other companies in the company’s industry may calculate non-GAAP financial results differently, particularly related to non-recurring, unusual items. The Company’s adjusted EBITDA is not a measurement of financial performance under GAAP, and should not be considered as an alternative to operating income or as an indication of operating performance or any other measure of performance derived in accordance with GAAP. Management does not consider adjusted EBITDA to be a substitute for, or superior to, the information provided by GAAP financial results.

  For the Three Months Ended
  For the Six Months Ended
  June 30,   June 30,
  2021   2020   2021   2020
Net income (loss) $ 1,697,122     $ (12,162 )   $ 1,738,320     $ (1,108,194 )
Depreciation and amortization   394,794       402,385       775,572       798,210  
Amortization of deferred gain         (12,359 )           (53,838 )
Stock-based compensation expense   465,336       85,378       903,730       293,139  
Interest expense   169,031       150,186       319,013       218,970  
Interest income   (61,798 )     (99,343 )     (67,098 )     (123,980 )
PPP loan and interest forgiveness   (1,514,354 )           (1,514,354 )      
Provision (benefit) for income taxes   235,293       (441,511 )     295,815       (908,809 )
Adjusted EBITDA $ 1,385,424     $ 72,574     $ 2,450,998     $ (884,502 )


Adjusted EPS excludes the impact of certain items and therefore has not been calculated in accordance with GAAP. Management believes that exclusion of certain selected items assists in providing a more complete understanding of the company’s underlying results and trends and allows for comparability with its peer company index and industry. Management uses this measure along with the corresponding GAAP financial measures to manage the company’s business and to evaluate its performance compared to prior periods and the marketplace. The company defines Non-GAAP (loss) income as (loss) or income before amortization, stock-based compensation, expenses related to discontinued operations, impairment of long-lived assets and non-recurring acquisition costs. For this reporting period, it excludes PPP loan forgiveness, which the company does not anticipate will reoccur in the foreseeable future. Adjusted EPS expresses adjusted (loss) income on a per share basis using weighted average diluted shares outstanding.
  
Adjusted EPS is a non-GAAP financial measure and should not be considered in isolation or as a substitute for financial information provided in accordance with GAAP. These non-GAAP financial measures may not be computed in the same manner as similarly titled measures used by other companies. Management expects to continue to incur expenses similar to the adjusted income from continuing operations and adjusted EPS financial adjustments described above, and investors should not infer from the company’s presentation of these non-GAAP financial measures that these costs are unusual, infrequent or non-recurring.  

The following table reconciles net loss attributable to common stockholders and diluted earnings per share:

  For the Three Months Ended
  For the Six Months Ended
  June 30,   June 30,
  2021   2020   2021   2020
Net income (loss) $ 1,697,122     $ (12,162 )   $ 1,738,320     $ (1,108,194 )
Amortization of intangibles   163,901       174,525       327,801       349,051  
Stock-based compensation expense   465,336       85,378       903,730       293,139  
PPP loan and interest forgiveness   (1,514,354 )           (1,514,354 )      
Non-GAAP net income (loss) $ 812,005     $ 247,741     $ 1,455,497     $ (466,004 )
Non-GAAP net income (loss) per share:                              
Basic $ 0.04     $ 0.02     $ 0.08     $ (0.03 )
Diluted $ 0.04     $ 0.01     $ 0.08     $ (0.03 )
Weighted average common shares outstanding:                              
Basic   18,513,620       16,488,325       17,934,022       16,410,660  
Diluted   19,735,383       16,867,921       19,305,842       16,410,660  


Forward-Looking Statements

One Stop Systems cautions you that statements in this press release that are not a description of historical facts are forward-looking statements. These statements are based on the company’s current beliefs and expectations. The inclusion of forward-looking statements should not be regarded as a representation by One Stop Systems or its partners that any of our plans or expectations will be achieved, including but not limited to, to our management’s expectations for revenue growth generated by new products and design wins. Actual results may differ from those set forth in this press release due to the risk and uncertainties inherent in our business, including risks described in our prior press releases and in our filings with the Securities and Exchange Commission (SEC), including under the heading “Risk Factors” in our Annual Report on Form 10-K and any subsequent filings with the SEC. You are cautioned not to place undue reliance on these forward-looking statements, which speak only as of the date hereof, and we undertake no obligation to revise or update this press release to reflect events or circumstances after the date hereof. All forward-looking statements are qualified in their entirety by this cautionary statement, which is made under the safe harbor provisions of the Private Securities Litigation Reform Act of 1995.

Media Contact:
Katie Rivera
One Stop Systems, Inc.
Tel (760) 745-9883
Email contact

Investor Relations:
Ronald Both or Justin Lumley
CMA
Tel (949) 432-7557
Email contact


ONE STOP SYSTEMS, INC. (OSS)

UNAUDITED CONSOLIDATED BALANCE SHEETS

  Unaudited      
  June 30,   December 31,
  2021   2020
ASSETS              
Current assets              
Cash and cash equivalents $ 3,975,069     $ 6,316,921  
Short-term investments   14,524,249        
Accounts receivable, net   6,527,109       7,458,383  
Inventories, net   12,411,490       9,647,504  
Prepaid expenses and other current assets   996,801       655,708  
Total current assets   38,434,718       24,078,516  
Property and equipment, net   3,218,341       3,487,178  
Deposits and other   48,155       81,709  
Deferred tax assets, net   3,485,709       3,698,593  
Goodwill   7,120,510       7,120,510  
Intangible assets, net   334,456       662,257  
  $ 52,641,889     $ 39,128,763  
               
LIABILITIES AND STOCKHOLDERS’ EQUITY              
Current liabilities              
Accounts payable $ 4,149,482     $ 976,420  
Accrued expenses and other liabilities   3,036,793       3,481,444  
Current portion of notes payable, net of debt discount of $0 and              
$2,047, respectively   1,777,715       1,365,204  
Current portion of related party notes payable, net of debt discount              
of $0 and $6,726, respectively         199,943  
Current portion of senior secured convertible note, net of debt discounts of $74,458 and $256,242, respectively   2,516,451       1,789,212  
Total current liabilities   11,480,441       7,812,223  
Senior secured convertible note, net of current portion and debt discounts of $0 and $14,107, respectively         531,347  
Paycheck protection program note payable         1,499,360  
Total liabilities   11,480,441       9,842,930  
Commitments and contingencies              
Stockholders’ equity              
Common stock, $.0001 par value; 50,000,000 shares authorized;              
18,538,689 and 16,684,424 shares issued and outstanding, respectively   1,854       1,668  
Additional paid-in capital   41,037,948       30,758,354  
Accumulated other comprehensive income   145,062       287,547  
Accumulated deficit   (23,416 )     (1,761,736 )
Total stockholders’ equity   41,161,448       29,285,833  
  $ 52,641,889     $ 39,128,763  


ONE STOP SYSTEMS, INC. (OSS)

UNAUDITED CONSOLIDATED STATEMENTS OF OPERATIONS

  For the Three Months Ended June 30,   For the Six Months Ended June 30,
  2021   2020   2021   2020
Revenue $ 14,905,009     $ 11,625,327     $ 28,220,761     $ 24,984,964  
Cost of revenue   10,252,265       8,300,132       19,135,233       18,264,082  
Gross profit   4,652,744       3,325,195       9,085,528       6,720,882  
Operating expenses:                              
General and administrative   1,648,785       1,877,358       3,806,404       4,391,423  
Marketing and selling   1,479,292       845,098       2,647,193       2,034,449  
Research and development   1,008,017       1,008,625       1,840,250       2,212,050  
Total operating expenses   4,136,094       3,731,081       8,293,847       8,637,922  
Income (loss) from operations   516,650       (405,886 )     791,681       (1,917,040 )
Other income (expense), net:                              
Interest income   61,798       99,343       67,098       123,980  
Interest expense   (169,031 )     (150,186 )     (319,013 )     (218,970 )
Other income (expense), net   1,522,998       3,056       1,494,369       (4,973 )
Total other income (expense), net   1,415,765       (47,787 )     1,242,454       (99,963 )
Income (loss) before income taxes   1,932,415       (453,673 )     2,034,135       (2,017,003 )
Provision (benefit) for income taxes   235,293       (441,511 )     295,815       (908,809 )
Net income (loss) $ 1,697,122     $ (12,162 )   $ 1,738,320     $ (1,108,194 )
                               
Net income (loss) per share:                              
Basic $ 0.09     $ (0.00 )   $ 0.10     $ (0.07 )
Diluted $ 0.09     $ (0.00 )   $ 0.09     $ (0.07 )
Weighted average common shares                              
outstanding:                              
Basic   18,513,620       16,488,325       17,934,022       16,410,660  
Diluted   19,735,383       16,488,325       19,305,842       16,410,660  


Source: One Stop Systems, Inc.

OSS Reports Q2 2021 Revenue up 28% to $14.9 Million, Delivering Income of $1.7 Million or $0.09 per Share


OSS Reports Q2 2021 Revenue up 28% to $14.9 Million, Delivering Income of $1.7 Million or $0.09 per Share


ESCONDIDO, Calif., Aug. 12, 2021 (GLOBE NEWSWIRE) — One Stop Systems, Inc. (Nasdaq: OSS), a leader in AI Transportable solutions on the edge, reported results for the second quarter ended June 30, 2021. All quarterly comparisons are to the same year-ago period unless otherwise noted. The company will hold a conference call at 5:00 p.m. Eastern time today to discuss the results (see dial-in information below).  

Q2 2021 Financial Highlights

  • Revenue totaled $14.9 million, up 12% sequentially and up 28% versus the same year-ago quarter.
  • Gross margin was 31.2%, up 2.6 percentage points.
  • GAAP net income totaled $1.7 million or $0.09 per diluted share versus a net loss of $12,000 or $(0.00) per diluted share in the year-ago quarter. GAAP net income includes forgiveness of PPP loan of approximately $1.5 million.
  • Non-GAAP net income was $812,000 or $0.04 per basic and diluted share, versus $248,000 or $0.01 per diluted share in the same year-ago quarter. Non-GAAP net income excludes $1.5 million of PPP loan forgiveness (see definition of this and other non-GAAP measures and reconciliation to GAAP, below).
  • Adjusted EBITDA was $1.4 million, up $1.3 million and reaching more than 9% of total revenue. Adjusted EBITDA excludes $1.5 million of PPP loan forgiveness.
  • Cash, cash equivalents and short-term investments totaled $18.5 million on June 30, 2021.

First Half 2021 Financial Highlights

  • Revenue totaled a record $28.2 million, up 13%.
  • Gross margin was 32.2%, up 5.3 percentage points.
  • GAAP net income totaled $1.7 million or $0.09 per share, up by $2.8 million. GAAP net income includes forgiveness of PPP loan of approximately $1.5 million.
  • Non-GAAP net income was $1.5 million or $0.08 per basic and diluted share, up by $1.9 million. Non-GAAP net income excludes $1.5 million of PPP loan forgiveness.
  • Adjusted EBITDA was $2.5 million, up by $3.3 million. Adjusted EBITDA excludes $1.5 million of PPP loan forgiveness.

Q2 2021 Operational Highlights

  • Secured three major design wins, which included two AI on the Fly® applications, a transportable edge flash storage solution, an autonomous vehicle training system, and a high-performance computing medical controller system. Total major wins for the first half of the year totaled six wins. In addition to the confirmed wins, the company has 17 major pending opportunities.
  • Operating expenses as a percentage of revenue decreased to 27.7% from 32.1% in the same year-ago quarter, which was primarily due to the company’s expense reduction program initiated in early 2020.

Management Commentary

“In Q2, we achieved strong top-line growth with revenue up 28% to $14.9 million, and this helped drive first half revenue up 13% to a record $28.2 million,” commented OSS president and CEO, David Raun. “The strong top-line performance reflects our broadening customer base and new wins with major accounts.

“We also drove down our operating expenses as a percentage of revenue. Together, these results generated solid bottom-line improvements with net income in the second quarter increasing $1.7 million versus the year-ago quarter and adjusted EBITDA up by $1.3 million, reaching more than 9% of total revenue.

“During the second quarter, we won three new major opportunities that included a medical control system, an edge flash storage program, and a GPU-accelerated training and inference system with a major vehicle supplier in Germany. The vehicle supplier win expanded our footprint in the autonomous vehicle market. Altogether, these successes brought our first half of the year major wins to six. We also shipped our latest SDS rugged server which was designed into a military mobile datacenter application.

“While we expect the effects of the pandemic to continue through the rest of the year, we are seeing improving customer demand. Even our commercial aerospace customers, which were severely affected by COVID, are re-engaging with us on new programs, as well as bringing back programs previously put on hold. We have now 17 major pending opportunities in our pipeline that we are focused on closing.

“Executing on our long-term strategic vision and product road map continues to be our top priority. This plan includes strengthening our value proposition in the fast-growing, edge-computing industry with the goal of becoming the market leader in the AI Transportables space. This target market requires the highest performance computing in a challenging mobile environment, which we believe to be one of our greatest strengths.

“We continue to proactively manage the challenges imposed by the pandemic, and in doing so, our team has become adept at optimizing engineering and manufacturing processes, shipping product on time, and not only protecting but increasing margins.

“While we are experiencing increased product demand, supply chain challenges such as price increases and long lead-times continue to be significant. However, our team is managing the fluid landscape on multiple fronts by qualifying additional vendors, implementing extended purchase planning, and focusing on other strategic and tactical activities.

“We believe our execution of our strategic plan, corporate reorganization, and improved board composition has contributed to a tripling of shareholder value over the past two years. So far this year, we have made better-than-expected top- and bottom-line progress.

“Given our adjusted EBITDA at 9% of total revenue in the first half of the year, we are well on our way to achieving our objective of it being no less than 10% of revenues. For the current third quarter, we believe we are on track to generate revenue of about $15.9 million, which would represent an increase of 23% over the same year-ago quarter and would exceed all historical third quarters.”

Q2 2021 Financial Summary
Revenue in the second quarter of 2021 increased 28% to $14.9 million, compared to $11.6 million in the same year-ago quarter. This growth was primarily driven by improvements in the sale of ruggedized servers in the media and entertainment markets, differentiated military AI Transportables data processing and storage products, as well as continued expansion of the company’s customer base and new applications within key accounts.

Gross profit was $4.7 million or 31.2% of revenue in the second quarter of 2021, up from $3.3 million or 28.6% of revenue in Q2 2020. The improvement in quarterly margin was attributed to changes in product mix and type of customer.

Operating expenses increased 11% to $4.1 million in the second quarter of 2021 compared to $3.7 million in the same year-ago quarter. Operating expenses as a percentage of revenue decreased to 27.7% in the second quarter of 2021 versus 32.1% in the year-ago quarter.

Net income on a GAAP basis totaled $1.7 million in the second quarter of 2021 or $0.09 per diluted share compared to a net loss of $12,000 or $(0.00) per diluted share in the year-ago period. This improvement was due to more favorable gross margins as well as debt and interest forgiveness on the company’s PPP loan of approximately $1.5 million.

Non-GAAP net income totaled $812,000 or $0.04 per basic and diluted share in the second quarter of 2021, as compared to a non-GAAP net income of $248,000 or $0.01 per diluted share in the same year-ago period. Non-GAAP net income excludes the $1.5 million PPP loan forgiveness.

Adjusted EBITDA, a non-GAAP term, totaled $1.4 million in the second quarter of 2021 as compared to $73,000 in the same year-ago period. Adjusted EBITDA excludes the $1.5 million PPP loan forgiveness.

Cash, cash equivalents and short-term investments totaled $18.5 million as of June 30, 2021, as compared to $19.6 million on March 31, 2021. The company believes its cash position and other available funds provide sufficient liquidity to meet its cash requirements for working capital and paying down debt, while supporting its strategic growth initiatives.

First Half 2021 Financial Summary

Total revenues increased 13% to a record $28.2 million compared to $25.0 million in the prior year. This growth was primarily driven by improvements in the sale of ruggedized servers in the media and entertainment markets, our differentiated military AI Transportables data processing and storage products, as well as continued expansion of our customer base and new applications within key accounts.

Gross profit for the first half of 2021 was $9.1 million or 32.2% of revenue, compared to $6.7 million or 26.9% of revenue in the same year-ago period. The improvements in quarterly margins were attributable to product mix, additional sales of high-value products, and increased efficiencies.

Total operating expenses decreased 4% to $8.3 million versus the first half of 2020. Operating expenses as a percentage of revenue improved to 29.4% during the first half of 2021 versus 34.6% in the same year-ago period.

Net income on a GAAP basis totaled $1.7 million or $0.09 per diluted share, as compared to a loss of $1.1 million or $(0.07) per share in the first half of 2020. Net Income includes the $1.5 million PPP loan forgiveness.

Non-GAAP net income totaled $1.5 million or $0.08 per diluted share, as compared to non-GAAP net loss of $466,000 or $(0.03) per share in the first half of 2020. Non-GAAP net income excludes the $1.5 million PPP loan forgiveness.

Adjusted EBITDA, a non-GAAP term, totaled $2.5 million as compared to negative $885,000 in the first half of 2020. Adjusted EBITDA excludes the $1.5 million PPP loan forgiveness.

Outlook
For the third quarter of 2021, OSS expects revenue of approximately $15.9 million which would be an increase of 7% sequentially and 23% versus the same year-ago quarter.

Conference Call
OSS management will hold a conference call to discuss its second quarter 2021 results later today, followed by a question-and-answer period.

Date: Thursday, August 12, 2021
Time: 5:00 p.m. Eastern time (2:00 p.m. Pacific time)
Toll-free dial-in number: 1-866-269-4260
International dial-in number: 1-786-204-3966
Conference ID: 1453156

The conference call will be webcast live and available for replay here as well as via a link in the Investors section of the company’s website at onestopsystems.com/pages/investors. OSS regularly uses its website to disclose material and non-material information to investors, customers, employees and others interested in the company.

Please call the conference telephone number five minutes prior to the start time. An operator will register your name and organization. If you have any difficulty connecting with the conference call, please contact CMA at 1-949-432-7566.

A replay of the call will be available after 8:00 p.m. Eastern time on the same day through August 26, 2021.

Toll-free replay number: 1-844-512-2921
International replay number: 1-412-317-6671
Replay ID: 1453156

About One Stop Systems
One Stop Systems, Inc. (OSS) designs and manufactures innovative AI Transportable edge computing modules and systems, including ruggedized servers, compute accelerators, expansion systems, flash storage arrays and Ion Accelerator™ SAN, NAS and data recording software for AI workflows. These products are used for AI data set capture, training, and large-scale inference in the defense, oil and gas, mining, autonomous vehicles and rugged entertainment applications.
  
OSS utilizes the power of PCI Express, the latest GPU accelerators and NVMe storage to build award-winning systems, including many industry firsts, for industrial OEMs and government customers. The company enables AI on the Fly® by bringing AI datacenter performance to ‘the edge’, especially on mobile platforms, and by addressing the entire AI workflow, from high-speed data acquisition to deep learning, training and inference. OSS products are available directly or through global distributors. For more information, go to www.onestopsystems.com.

Non-GAAP Financial Measures
Management believes that the use of adjusted earnings before interest, taxes, depreciation and amortization, or adjusted EBITDA, is helpful for an investor to assess the performance of the Company. The Company defines adjusted EBITDA as income (loss) before interest, taxes, depreciation, amortization, acquisition expenses, impairment of long-lived assets, financing costs, fair value adjustments from purchase accounting, stock-based compensation expense and expenses related to discontinued operations. For this reporting period, it excludes PPP loan forgiveness, which the company does not anticipate will reoccur in the foreseeable future.
  
Adjusted EBITDA is not a measurement of financial performance under generally accepted accounting principles in the United States, or GAAP. Because of varying available valuation methodologies, subjective assumptions and the variety of equity instruments that can impact a company’s non-cash operating expenses, management believes that providing a non-GAAP financial measure that excludes non-cash and non-recurring expenses allows for meaningful comparisons between the company’s core business operating results and those of other companies, as well as providing management with an important tool for financial and operational decision making and for evaluating the company’s own core business operating results over different periods of time.
  
The company’s adjusted EBITDA measure may not provide information that is directly comparable to that provided by other companies in its industry, as other companies in the company’s industry may calculate non-GAAP financial results differently, particularly related to non-recurring, unusual items. The Company’s adjusted EBITDA is not a measurement of financial performance under GAAP, and should not be considered as an alternative to operating income or as an indication of operating performance or any other measure of performance derived in accordance with GAAP. Management does not consider adjusted EBITDA to be a substitute for, or superior to, the information provided by GAAP financial results.

  For the Three Months Ended
  For the Six Months Ended
  June 30,   June 30,
  2021   2020   2021   2020
Net income (loss) $ 1,697,122     $ (12,162 )   $ 1,738,320     $ (1,108,194 )
Depreciation and amortization   394,794       402,385       775,572       798,210  
Amortization of deferred gain         (12,359 )           (53,838 )
Stock-based compensation expense   465,336       85,378       903,730       293,139  
Interest expense   169,031       150,186       319,013       218,970  
Interest income   (61,798 )     (99,343 )     (67,098 )     (123,980 )
PPP loan and interest forgiveness   (1,514,354 )           (1,514,354 )      
Provision (benefit) for income taxes   235,293       (441,511 )     295,815       (908,809 )
Adjusted EBITDA $ 1,385,424     $ 72,574     $ 2,450,998     $ (884,502 )


Adjusted EPS excludes the impact of certain items and therefore has not been calculated in accordance with GAAP. Management believes that exclusion of certain selected items assists in providing a more complete understanding of the company’s underlying results and trends and allows for comparability with its peer company index and industry. Management uses this measure along with the corresponding GAAP financial measures to manage the company’s business and to evaluate its performance compared to prior periods and the marketplace. The company defines Non-GAAP (loss) income as (loss) or income before amortization, stock-based compensation, expenses related to discontinued operations, impairment of long-lived assets and non-recurring acquisition costs. For this reporting period, it excludes PPP loan forgiveness, which the company does not anticipate will reoccur in the foreseeable future. Adjusted EPS expresses adjusted (loss) income on a per share basis using weighted average diluted shares outstanding.
  
Adjusted EPS is a non-GAAP financial measure and should not be considered in isolation or as a substitute for financial information provided in accordance with GAAP. These non-GAAP financial measures may not be computed in the same manner as similarly titled measures used by other companies. Management expects to continue to incur expenses similar to the adjusted income from continuing operations and adjusted EPS financial adjustments described above, and investors should not infer from the company’s presentation of these non-GAAP financial measures that these costs are unusual, infrequent or non-recurring.  

The following table reconciles net loss attributable to common stockholders and diluted earnings per share:

  For the Three Months Ended
  For the Six Months Ended
  June 30,   June 30,
  2021   2020   2021   2020
Net income (loss) $ 1,697,122     $ (12,162 )   $ 1,738,320     $ (1,108,194 )
Amortization of intangibles   163,901       174,525       327,801       349,051  
Stock-based compensation expense   465,336       85,378       903,730       293,139  
PPP loan and interest forgiveness   (1,514,354 )           (1,514,354 )      
Non-GAAP net income (loss) $ 812,005     $ 247,741     $ 1,455,497     $ (466,004 )
Non-GAAP net income (loss) per share:                              
Basic $ 0.04     $ 0.02     $ 0.08     $ (0.03 )
Diluted $ 0.04     $ 0.01     $ 0.08     $ (0.03 )
Weighted average common shares outstanding:                              
Basic   18,513,620       16,488,325       17,934,022       16,410,660  
Diluted   19,735,383       16,867,921       19,305,842       16,410,660  


Forward-Looking Statements

One Stop Systems cautions you that statements in this press release that are not a description of historical facts are forward-looking statements. These statements are based on the company’s current beliefs and expectations. The inclusion of forward-looking statements should not be regarded as a representation by One Stop Systems or its partners that any of our plans or expectations will be achieved, including but not limited to, to our management’s expectations for revenue growth generated by new products and design wins. Actual results may differ from those set forth in this press release due to the risk and uncertainties inherent in our business, including risks described in our prior press releases and in our filings with the Securities and Exchange Commission (SEC), including under the heading “Risk Factors” in our Annual Report on Form 10-K and any subsequent filings with the SEC. You are cautioned not to place undue reliance on these forward-looking statements, which speak only as of the date hereof, and we undertake no obligation to revise or update this press release to reflect events or circumstances after the date hereof. All forward-looking statements are qualified in their entirety by this cautionary statement, which is made under the safe harbor provisions of the Private Securities Litigation Reform Act of 1995.

Media Contact:
Katie Rivera
One Stop Systems, Inc.
Tel (760) 745-9883
Email contact

Investor Relations:
Ronald Both or Justin Lumley
CMA
Tel (949) 432-7557
Email contact


ONE STOP SYSTEMS, INC. (OSS)

UNAUDITED CONSOLIDATED BALANCE SHEETS

  Unaudited      
  June 30,   December 31,
  2021   2020
ASSETS              
Current assets              
Cash and cash equivalents $ 3,975,069     $ 6,316,921  
Short-term investments   14,524,249        
Accounts receivable, net   6,527,109       7,458,383  
Inventories, net   12,411,490       9,647,504  
Prepaid expenses and other current assets   996,801       655,708  
Total current assets   38,434,718       24,078,516  
Property and equipment, net   3,218,341       3,487,178  
Deposits and other   48,155       81,709  
Deferred tax assets, net   3,485,709       3,698,593  
Goodwill   7,120,510       7,120,510  
Intangible assets, net   334,456       662,257  
  $ 52,641,889     $ 39,128,763  
               
LIABILITIES AND STOCKHOLDERS’ EQUITY              
Current liabilities              
Accounts payable $ 4,149,482     $ 976,420  
Accrued expenses and other liabilities   3,036,793       3,481,444  
Current portion of notes payable, net of debt discount of $0 and              
$2,047, respectively   1,777,715       1,365,204  
Current portion of related party notes payable, net of debt discount              
of $0 and $6,726, respectively         199,943  
Current portion of senior secured convertible note, net of debt discounts of $74,458 and $256,242, respectively   2,516,451       1,789,212  
Total current liabilities   11,480,441       7,812,223  
Senior secured convertible note, net of current portion and debt discounts of $0 and $14,107, respectively         531,347  
Paycheck protection program note payable         1,499,360  
Total liabilities   11,480,441       9,842,930  
Commitments and contingencies              
Stockholders’ equity              
Common stock, $.0001 par value; 50,000,000 shares authorized;              
18,538,689 and 16,684,424 shares issued and outstanding, respectively   1,854       1,668  
Additional paid-in capital   41,037,948       30,758,354  
Accumulated other comprehensive income   145,062       287,547  
Accumulated deficit   (23,416 )     (1,761,736 )
Total stockholders’ equity   41,161,448       29,285,833  
  $ 52,641,889     $ 39,128,763  


ONE STOP SYSTEMS, INC. (OSS)

UNAUDITED CONSOLIDATED STATEMENTS OF OPERATIONS

  For the Three Months Ended June 30,   For the Six Months Ended June 30,
  2021   2020   2021   2020
Revenue $ 14,905,009     $ 11,625,327     $ 28,220,761     $ 24,984,964  
Cost of revenue   10,252,265       8,300,132       19,135,233       18,264,082  
Gross profit   4,652,744       3,325,195       9,085,528       6,720,882  
Operating expenses:                              
General and administrative   1,648,785       1,877,358       3,806,404       4,391,423  
Marketing and selling   1,479,292       845,098       2,647,193       2,034,449  
Research and development   1,008,017       1,008,625       1,840,250       2,212,050  
Total operating expenses   4,136,094       3,731,081       8,293,847       8,637,922  
Income (loss) from operations   516,650       (405,886 )     791,681       (1,917,040 )
Other income (expense), net:                              
Interest income   61,798       99,343       67,098       123,980  
Interest expense   (169,031 )     (150,186 )     (319,013 )     (218,970 )
Other income (expense), net   1,522,998       3,056       1,494,369       (4,973 )
Total other income (expense), net   1,415,765       (47,787 )     1,242,454       (99,963 )
Income (loss) before income taxes   1,932,415       (453,673 )     2,034,135       (2,017,003 )
Provision (benefit) for income taxes   235,293       (441,511 )     295,815       (908,809 )
Net income (loss) $ 1,697,122     $ (12,162 )   $ 1,738,320     $ (1,108,194 )
                               
Net income (loss) per share:                              
Basic $ 0.09     $ (0.00 )   $ 0.10     $ (0.07 )
Diluted $ 0.09     $ (0.00 )   $ 0.09     $ (0.07 )
Weighted average common shares                              
outstanding:                              
Basic   18,513,620       16,488,325       17,934,022       16,410,660  
Diluted   19,735,383       16,488,325       19,305,842       16,410,660  


Source: One Stop Systems, Inc.

One Stop Systems Inc. (OSS) – Second Quarter Tops Estimates; Raising PT

Friday, August 13, 2021

One Stop Systems Inc. (OSS)
Second Quarter Tops Estimates; Raising PT

One Stop Systems Inc is US-based company which is principally engaged in designing, manufacturing, marketing high-end systems for high performance computing (HPC) applications. The company offers custom servers, compute accelerators, solid-state storage arrays and system expansion systems. The product line of the company includes GPU Appliances, GPU Expansion, GPUs and co-processors, Flash storage arrays, Flash storage expansion, Servers, Disk Arrays, Desktop computing appliances, accessories and parts. The company delivers high-end technology to customers through the sale of equipment and software for use on their premises or through remote cloud access to secure data centres housing technology.

Joe Gomes, Senior Research Analyst, Noble Capital Markets, Inc.

Refer to the full report for the price target, fundamental analysis, and rating.

    2Q21 Results. Revenue totaled $14.9 million, up 12% sequentially and 28% year-over-year. OSS reported GAAP EPS of $0.09 compared to $0.00 last year. Adjusted EPS for the second quarter of 2021 was $0.04, compared to $0.01 last year. Adjusted EBITDA rose to $1.4 million, up $1.3 million year-over-year. We had projected revenue of $14.4 million and adjusted EPS $0.03.

    Business Pipeline.  During the quarter, One Stop Systems won three more $1+ million programs, bringing the YTD total to six. One of the wins was with a major vehicle supplier in Germany, expanding the Company’s footprint in the autonomous vehicle market. The pipeline remains robust with some 17 $1+ million opportunities being worked on …


This Company Sponsored Research is provided by Noble Capital Markets, Inc., a FINRA and S.E.C. registered broker-dealer (B/D).

*Analyst certification and important disclosures included in the full report. NOTE: investment decisions should not be based upon the content of this research summary.  Proper due diligence is required before making any investment decision. 

Release – Comtech Telecommunications Corp. Awarded $1.0 Million Contract for 5G Support with a Tier-One U.S. Carrier


Comtech Telecommunications Corp. Awarded $1.0 Million Contract for 5G Support with a Tier-One U.S. Carrier


MELVILLE, N.Y.–(BUSINESS WIRE)–Aug. 11, 2021– 
August 11, 2021 — 
Comtech Telecommunications Corp. (NASDAQ: CMTL), a global leading provider of next-generation 911 emergency systems and secure wireless communications technologies, announced today, that during its fourth quarter of fiscal 2021, it was awarded a contract for approximately 
$1.0 million for operations support features and enhancements supporting 5G applications with a major tier-one mobile network operator in 
the United States.

“Comtech is dedicated to supporting 5G technologies for our customers worldwide,” said  Fred Kornberg, Chairman of the Board and Chief Executive Officer of 
Comtech Telecommunications Corp. “Our long-term relationship with this customer demonstrates their trust in us to support them through the next steps in this technology.”

The contract was awarded to Comtech’s Trusted Location group, a leading provider of precise device location, mapping and messaging solutions for public safety, mobile network operators, and enterprise solutions. Sold around the world to mobile network operators, government agencies and Fortune 100 enterprises, our platforms locate, map, track and message. For more information, visit www.comtechlocation.com.

Comtech Telecommunications Corp. is a leading provider of next-generation 911 emergency systems and critical wireless communication technologies to commercial and government customers around the world. Headquartered in 
Melville, New York and with a passion for customer success, 
Comtech designs, produces and markets advanced and secure wireless solutions to customers in more than 100 countries. For more information, please visit www.comtechtel.com.

Certain information in this press release contains statements that are forward-looking in nature and involve certain significant risks and uncertainties. Actual results could differ materially from such forward-looking information. The Company’s 
Securities and Exchange Commission filings identify many such risks and uncertainties. Any forward-looking information in this press release is qualified in its entirety by the risks and uncertainties described in such 
Securities and Exchange Commission filings.

Comtech Investor Relations:
631-962-7005
investors@comtech.com

Source: 
Comtech Telecommunications Corp.

Comtech Telecommunications Corp. Awarded $1.0 Million Contract for 5G Support with a Tier-One U.S. Carrier


Comtech Telecommunications Corp. Awarded $1.0 Million Contract for 5G Support with a Tier-One U.S. Carrier


MELVILLE, N.Y.–(BUSINESS WIRE)–Aug. 11, 2021– 
August 11, 2021 — 
Comtech Telecommunications Corp. (NASDAQ: CMTL), a global leading provider of next-generation 911 emergency systems and secure wireless communications technologies, announced today, that during its fourth quarter of fiscal 2021, it was awarded a contract for approximately 
$1.0 million for operations support features and enhancements supporting 5G applications with a major tier-one mobile network operator in 
the United States.

“Comtech is dedicated to supporting 5G technologies for our customers worldwide,” said  Fred Kornberg, Chairman of the Board and Chief Executive Officer of 
Comtech Telecommunications Corp. “Our long-term relationship with this customer demonstrates their trust in us to support them through the next steps in this technology.”

The contract was awarded to Comtech’s Trusted Location group, a leading provider of precise device location, mapping and messaging solutions for public safety, mobile network operators, and enterprise solutions. Sold around the world to mobile network operators, government agencies and Fortune 100 enterprises, our platforms locate, map, track and message. For more information, visit www.comtechlocation.com.

Comtech Telecommunications Corp. is a leading provider of next-generation 911 emergency systems and critical wireless communication technologies to commercial and government customers around the world. Headquartered in 
Melville, New York and with a passion for customer success, 
Comtech designs, produces and markets advanced and secure wireless solutions to customers in more than 100 countries. For more information, please visit www.comtechtel.com.

Certain information in this press release contains statements that are forward-looking in nature and involve certain significant risks and uncertainties. Actual results could differ materially from such forward-looking information. The Company’s 
Securities and Exchange Commission filings identify many such risks and uncertainties. Any forward-looking information in this press release is qualified in its entirety by the risks and uncertainties described in such 
Securities and Exchange Commission filings.

Comtech Investor Relations:
631-962-7005
investors@comtech.com

Source: 
Comtech Telecommunications Corp.

Information Services (III) – Excellent 2Q21. Will the Momentum Continue?

Tuesday, August 10, 2021

Information Services (III)
Excellent 2Q21. Will the Momentum Continue?

ISG (Information Services Group) (Nasdaq: III) is a leading global technology research and advisory firm. A trusted business partner to more than 700 clients, including more than 70 of the top 100 enterprises in the world, ISG is committed to helping corporations, public sector organizations, and service and technology providers achieve operational excellence and faster growth. The firm specializes in digital transformation services, including automation, cloud and data analytics; sourcing advisory; managed governance and risk services; network carrier services; strategy and operations design; change management; market intelligence and technology research and analysis. Founded in 2006, and based in Stamford, Conn., ISG employs more than 1,300 digital-ready professionals operating in more than 20 countries—a global team known for its innovative thinking, market influence, deep industry and technology expertise, and world-class research and analytical capabilities based on the industry’s most comprehensive marketplace data. For more information, visit www.isg-one.com

Joe Gomes, Senior Research Analyst, Noble Capital Markets, Inc.

Refer to the full report for the price target, fundamental analysis, and rating.

    Strong 2Q21 Results. Revenue of $70.6 million rose 23.0% y-o-y and exceeded consensus of $65.5 million and our estimate of $65 million. ISG reported net income of $4.1 million, or $0.08 per share, up from $612,000, and $0.01, respectively, last year. Adjusted EPS was $0.12 and adjusted EBITDA totaled $9.7 million. We had forecast EPS of $0.04, adjusted EPS of $0.09, and adjusted EBITDA of $8.0 million.

    All Segments Contributing.  ISG saw solid contribution from each of its geographic segments as clients doubled down on their digital investments. Reported revenue in the Americas rose 28%, Europe was up 13% and 4% on a constant currency basis, while Asia Pacific revenues rose 36% on a reported basis and 18% on a constant currency basis …


This Company Sponsored Research is provided by Noble Capital Markets, Inc., a FINRA and S.E.C. registered broker-dealer (B/D).

*Analyst certification and important disclosures included in the full report. NOTE: investment decisions should not be based upon the content of this research summary.  Proper due diligence is required before making any investment decision. 

Release – Comtech Telecommunications Corp. Awarded $1.0 Million Contract for High-Power Amplifiers


Comtech Telecommunications Corp. Awarded $1.0 Million Contract for High-Power Amplifiers


MELVILLE, N.Y.–(BUSINESS WIRE)–Aug. 10, 2021– 
August 10, 2021— 
Comtech Telecommunications Corp. (NASDAQ: CMTL), a global leading provider of next-generation 911 emergency systems and secure wireless communications technologies, announced today, that during its fourth quarter of fiscal 2021, it was awarded a 
$1.0 million contract for high-power amplifiers from a major domestic prime contractor.

These amplifiers, which utilize the latest in solid-state GaN transistor technology, are key transmit elements in a data communication system. They add to an installed base of 
Comtech solid-state high-power RF amplifiers previously delivered to this major domestic prime contractor.

“This contract demonstrates our continued leadership position in providing high-power communications technology and the ongoing demand for our solid-state high-power amplifiers utilized by major OEMs in both domestic and international markets,” said  Fred Kornberg, Chairman of the Board and Chief Executive Officer of 
Comtech Telecommunications Corp.

The contract was awarded to 
Comtech PST Corp. (www.comtechpst.com) which is a leading independent supplier of high-power, high performance RF microwave amplifiers and control components for use in a broad spectrum of applications including defense, medical, satellite communications systems and instrumentation.

Comtech Telecommunications Corp. is a leading provider of next-generation 911 emergency systems and critical wireless communication technologies to commercial and government customers around the world. Headquartered in 
Melville, New York and with a passion for customer success, 
Comtech designs, produces and markets advanced and secure wireless solutions to customers in more than 100 countries. For more information, please visit www.comtechtel.com.

Certain information in this press release contains statements that are forward-looking in nature and involve certain significant risks and uncertainties. Actual results could differ materially from such forward-looking information. The Company’s 
Securities and Exchange Commission filings identify many such risks and uncertainties. Any forward-looking information in this press release is qualified in its entirety by the risks and uncertainties described in such 
Securities and Exchange Commission filings.

Comtech Investor Relations:
631-962-7005
investors@comtech.com

Source: 
Comtech Telecommunications Corp.

QuickChek – August 10, 2021


Endeavour Silver Reports Financial Results for the Second Quarter 2021; Earnings Conference Call at 10am PDT (1pm EDT) Today

Endeavour Silver reported its financial results today for the three and six months ended June 30, 2021

Research, News & Market Data on Endeavour Silver

Watch recent presentation from Endeavour Silver


Sierra Metals Reports Consolidated Financial Results for the Second Quarter of 2021 and Provides Revised Guidance for 2021

Sierra Metals reported revenue of $79.4 million and an adjusted EBITDA of $37.7 million on the throughput of 787,534 tonnes and metal production of 24.8 million copper equivalent pounds for the three-month period ended June 30, 2021

Research, News & Market Data on Sierra Metals

Watch recent presentation from Sierra Metals


CoreCivic Reports Second Quarter 2021 Financial Results

CoreCivic announced its financial results for the second quarter of 2021

See today’s research report from Joe Gomes, Senior Research Analyst at Noble Capital Markets

Research, News & Market Data on CoreCivic

Watch recent presentation from CoreCivic


Flotek Announces Second Quarter 2021 Results

Flotek Industries announced second quarter results for the three months ended June 30, 2021

See today’s research report from Michael Heim, Senior Research Analyst at Noble Capital Markets

Research, News & Market Data on Flotek

Watch recent presentation from Flotek


Comstock Announces Second Quarter 2021 Results and Business Update

Comstock Mining announced its unaudited financial results for the periods ended June 30, 2021

Research, News & Market Data on Comstock Mining

Watch recent presentation from Comstock Mining


Lineage to Present at the H.C. Wainwright Ophthalmology Conference on August 17, 2021

Lineage Cell Therapeutics announced that Lineage CEO Brian M. Culley will be participating in and presenting at the H.C. Wainwright & Co. Inc. Virtual Ophthalmology Conference

Research, News & Market Data on Lineage

Watch recent presentation from Lineage


Comtech Telecommunications Corp. Awarded $1.0 Million Contract for High-Power Amplifiers

Comtech Telecommunications announced it was awarded a $1.0 million contract for high-power amplifiers from a major domestic prime contractor

Research, News & Market Data on Comtech

Watch recent presentation from Comtech


Study of Non-Invasive Vagus Nerve Stimulation (nVNS) Shows Improvement in PTSD Symptoms and Decreased Inflammatory Response to Stress

electroCore announced the publication of a peer reviewed manuscript

Research, News & Market Data on electroCore


Stay up to date. Follow us:


Comtech Telecommunications Corp. Awarded $1.0 Million Contract for High-Power Amplifiers


Comtech Telecommunications Corp. Awarded $1.0 Million Contract for High-Power Amplifiers


MELVILLE, N.Y.–(BUSINESS WIRE)–Aug. 10, 2021– 
August 10, 2021— 
Comtech Telecommunications Corp. (NASDAQ: CMTL), a global leading provider of next-generation 911 emergency systems and secure wireless communications technologies, announced today, that during its fourth quarter of fiscal 2021, it was awarded a 
$1.0 million contract for high-power amplifiers from a major domestic prime contractor.

These amplifiers, which utilize the latest in solid-state GaN transistor technology, are key transmit elements in a data communication system. They add to an installed base of 
Comtech solid-state high-power RF amplifiers previously delivered to this major domestic prime contractor.

“This contract demonstrates our continued leadership position in providing high-power communications technology and the ongoing demand for our solid-state high-power amplifiers utilized by major OEMs in both domestic and international markets,” said  Fred Kornberg, Chairman of the Board and Chief Executive Officer of 
Comtech Telecommunications Corp.

The contract was awarded to 
Comtech PST Corp. (www.comtechpst.com) which is a leading independent supplier of high-power, high performance RF microwave amplifiers and control components for use in a broad spectrum of applications including defense, medical, satellite communications systems and instrumentation.

Comtech Telecommunications Corp. is a leading provider of next-generation 911 emergency systems and critical wireless communication technologies to commercial and government customers around the world. Headquartered in 
Melville, New York and with a passion for customer success, 
Comtech designs, produces and markets advanced and secure wireless solutions to customers in more than 100 countries. For more information, please visit www.comtechtel.com.

Certain information in this press release contains statements that are forward-looking in nature and involve certain significant risks and uncertainties. Actual results could differ materially from such forward-looking information. The Company’s 
Securities and Exchange Commission filings identify many such risks and uncertainties. Any forward-looking information in this press release is qualified in its entirety by the risks and uncertainties described in such 
Securities and Exchange Commission filings.

Comtech Investor Relations:
631-962-7005
investors@comtech.com

Source: 
Comtech Telecommunications Corp.

Release – Information Services Group Announces Second-Quarter 2021 Results


Information Services Group Announces Second-Quarter 2021 Results


  • Reports strong second-quarter GAAP revenues of $71 million, up 23% from prior year, exceeding guidance
  • Reports second-quarter net income of $4 million, GAAP EPS of $0.08 and adjusted EPS of $0.12
  • Reports second-quarter adjusted EBITDA of $10 million, up 32 percent versus prior year, exceeding guidance
  • Achieves quarter-end cash balance of $44 million, up 39 percent from prior year
  • Announces $25 million expansion of share repurchase program
  • Declares third-quarter dividend of $0.03 per share, payable September 24
  • Sets third-quarter 2021 guidance: revenues between $66 million and $68 million and adjusted EBITDA of between $8 million and $9 million

STAMFORD, Conn.–(BUSINESS WIRE)– Information Services Group (ISG) (Nasdaq: III), a leading global technology research and advisory firm, today announced financial results for the second quarter ended June 30, 2021.

“ISG delivered an excellent second quarter, increasing our business momentum,” said Michael P. Connors, chairman and CEO. “Our double-digit revenue and adjusted EBITDA growth in Q2 reflects a more robust demand environment, highlighted by our 28 percent growth in the Americas, as the pandemic recedes and clients double-down on their digital investments. Our results also reflect the impact of our solution-centric and agile ISG NEXT operating model, which continues to deliver greater account expansion opportunities, higher consulting utilization and improved profitability.”

Connors said ISG sees market momentum continuing in the second half, reflecting both pent-up demand and a structural shift to more cloud adoption and digital transformation. “Our in-depth research and analysis, world-class advisory capabilities and SaaS-based platforms offer our clients the insights, expertise and tools they need to digitally transform their businesses for operational excellence and faster growth. Operating at the center of an increasingly technology-driven economy, ISG is well-positioned for continued success,” said Connors.

Connors noted that the firm’s recurring revenues grew by 18 percent in the second quarter, fueled, in particular, by the ISG Research business.

Second-Quarter 2021 Results

Reported revenues for the second quarter were $70.6 million, up 23 percent versus last year (up 17 percent in constant currency). Currency translation positively impacted reported revenues by $3.0 million versus the prior year. Reported revenues were $40.3 million in the Americas, up 28 percent versus the prior year; $23.7 million in Europe, up 13 percent versus the prior year on a reported basis and up 4 percent in constant currency, and $6.5 million in Asia Pacific, up 36 percent versus the prior year on a reported basis and up 18 percent in constant currency.

ISG reported second-quarter operating income of $5.8 million, compared with operating income of $3.5 million in the second quarter of 2020. The firm also reported second-quarter net income and earnings per share of $4.1 million and $0.08, respectively, compared with a net income of $0.6 million and earnings per share of $0.01 in the prior year’s second quarter.

Adjusted net income (a non-GAAP measure defined below under “Non-GAAP Financial Measures”) for the second quarter was $6.3 million, or $0.12 per share on a fully diluted basis, compared with adjusted net income of $2.9 million, or $0.06 per share on a fully diluted basis, in the prior year’s second quarter.

Second-quarter adjusted EBITDA (a non-GAAP measure defined below under “Non-GAAP Financial Measures”) was $9.7 million, up 32 percent from the second quarter last year. Adjusted EBITDA margin was 14 percent, up 100 basis points from the prior year.

Other Financial and Operating Highlights

ISG generated $8.9 million of cash from operations in the second quarter, compared with $22.4 million in the prior year. The firm’s cash balance totaled $43.8 million at June 30, 2021, up 39 percent from $31.6 million in the prior year. ISG paid down $1.1 million of debt during the quarter, paid dividends of $1.5 million and repurchased $8.3 million of shares. As of June 30, 2021, ISG had $76.6 million in debt outstanding, compared with $80.9 million at the end of the second quarter last year. The firm’s gross debt-to-adjusted-EBITDA ratio of 2.1 is at a multiyear low.

2021 Third-Quarter Revenue and Adjusted EBITDA Guidance

“Balancing the seasonal summer holidays and lingering Covid effects, particularly in Europe, with increasing demand momentum, we are targeting double-digit growth for the third quarter of 2021, with revenues between $66 million and $68 million and adjusted EBITDA between $8 million and $9 million,” said Connors. “We will continue to monitor the macro-economic environment, including the impact of the coronavirus, and adjust our business outlook as markets dictate.”

Share Repurchase Authorization

The Board of Directors approved a new share repurchase authorization of $25.0 million, increasing to $28.2 million the aggregate available under the firm’s share repurchase program. The new share repurchase program will take effect upon completion of the current program, which had approximately $3.2 million remaining as of June 30, 2021.

“ISG remains committed to a disciplined capital allocation strategy that consists of reinvesting in our business, reducing debt, returning capital to shareholders via dividends and share repurchases, and supplementing our organic growth with strategic acquisitions to drive long-term shareholder value. During Q2, we returned $9.8 million to shareholders via share buyback and dividends, and reduced our debt by $1.1 million,” said Connors.

Third-Quarter Dividend

The ISG Board of Directors declared a third-quarter dividend of $0.03 per share, payable on September 24, 2021, to shareholders of record on September 7, 2021.

Conference Call

ISG has scheduled a call for 9 a.m., U.S. Eastern Time, Monday, August 9, 2021, to discuss the company’s second-quarter results. The call can be accessed by dialing 1-800-437-2398; or, for international callers, by dialing 001-323-289-6576. The access code is 1506173. A recording of the conference call will be accessible on ISG’s website (www.isg-one.com) for approximately four weeks following the call.

Forward-Looking Statements

This communication contains “forward-looking statements” which represent the current expectations and beliefs of management of ISG concerning future events and their potential effects. Statements contained herein including words such as “anticipate,” “believe,” “contemplate,” “plan,” “estimate,” “target,” “expect,” “intend,” “will,” “continue,” “should,” “may,” and other similar expressions, are “forward-looking statements” under the Private Securities Litigation Reform Act of 1995. These forward-looking statements are not guarantees of future results and are subject to certain risks and uncertainties that could cause actual results to differ materially from those anticipated. Those risks relate to inherent business, economic and competitive uncertainties and contingencies relating to the businesses of ISG and its subsidiaries including without limitation: (1) failure to secure new engagements or loss of important clients; (2) ability to hire and retain enough qualified employees to support operations; (3) ability to maintain or increase billing and utilization rates; (4) management of growth; (5) success of expansion internationally; (6) competition; (7) ability to move the product mix into higher margin businesses; (8) general political and social conditions such as war, political unrest and terrorism; (9) healthcare and benefit cost management; (10) ability to protect ISG and its subsidiaries’ intellectual property or data and the intellectual property or data of others; (11) currency fluctuations and exchange rate adjustments; (12) ability to successfully consummate or integrate strategic acquisitions; (13) outbreaks of diseases, including coronavirus, or similar public health threats or fear of such an event; and (14) engagements may be terminated, delayed or reduced in scope by clients. Certain of these and other applicable risks, cautionary statements and factors that could cause actual results to differ from ISG’s forward-looking statements are included in ISG’s filings with the U.S. Securities and Exchange Commission. ISG undertakes no obligation to update or revise any forward-looking statements to reflect subsequent events or circumstances.

Non-GAAP Financial Measures

ISG reports all financial information required in accordance with U.S. generally accepted accounting principles (GAAP). In this release, ISG has presented both GAAP financial results as well as non-GAAP information for the three months and six months ended June 30, 2021 and June 30, 2020. ISG believes that evaluating its ongoing operating results will be enhanced if it discloses certain non-GAAP information. These non-GAAP financial measures exclude non-cash and certain other special charges that many investors believe may obscure the user’s overall understanding of ISG’s current financial performance and the Company’s prospects for the future. ISG believes that these non-GAAP measures provide useful information to investors because they improve the comparability of the financial results between periods and provide for greater transparency of key measures used to evaluate the Company’s performance.

ISG provides adjusted EBITDA (defined as net income plus interest, taxes, depreciation and amortization, foreign currency transaction gains/losses, non-cash stock compensation, change in contingent consideration, acquisition-related costs, severance, integration and other expense and financing-related costs), adjusted net income (defined as net income plus amortization of intangible assets, non-cash stock compensation, foreign currency transaction gains/losses, change in contingent consideration, acquisition-related costs, severance, integration and other expense, financing-related costs, and write-off of deferred financing costs, on a tax-adjusted basis), adjusted net income per diluted share and selected financial data on a constant currency basis which are non-GAAP measures that the Company believes provide useful information to both management and investors by excluding certain expenses and financial implications of foreign currency translations, which management believes are not indicative of ISG’s core operations. These non-GAAP measures are used by ISG to evaluate the Company’s business strategies and management’s performance.

We evaluate our results of operations on both an as reported and a constant currency basis. The constant currency presentation, which is a non-GAAP financial measure, excludes the impact of year-over-year fluctuations in foreign currency exchange rates. We believe providing constant currency information provides valuable supplemental information regarding our results of operations, thereby facilitating period-to-period comparisons of our business performance and is consistent with how management evaluates the Company’s performance. We calculate constant currency percentages by converting our current and prior-periods local currency financial results using the same point in time exchange rates and then compare the adjusted current and prior period results. This calculation may differ from similarly titled measures used by others and, accordingly, the constant currency presentation is not meant to be a substitution for recorded amounts presented in conformity with GAAP, nor should such amounts be considered in isolation.

Management believes this information facilitates comparison of underlying results over time. Non-GAAP financial measures, when presented, are reconciled to the most closely applicable GAAP measure. Non-GAAP measures are provided as additional information and should not be considered in isolation or as a substitute for results prepared in accordance with GAAP. A reconciliation of the forward-looking non-GAAP estimates contained herein to the corresponding GAAP measures is not being provided, due to the unreasonable efforts required to prepare it.

About ISG

ISG (Information Services Group) (Nasdaq: III) is a leading global technology research and advisory firm. A trusted business partner to more than 700 clients, including more than 75 of the world’s top 100 enterprises, ISG is committed to helping corporations, public sector organizations, and service and technology providers achieve operational excellence and faster growth. The firm specializes in digital transformation services, including automation, cloud and data analytics; sourcing advisory; managed governance and risk services; network carrier services; strategy and operations design; change management; market intelligence and technology research and analysis. Founded in 2006, and based in Stamford, Conn., ISG employs more than 1,300 digital-ready professionals operating in more than 20 countries—a global team known for its innovative thinking, market influence, deep industry and technology expertise, and world-class research and analytical capabilities based on the industry’s most comprehensive marketplace data. For more information, visit www.isg-one.com.

Information Services Group, Inc.
Condensed Consolidated Statement of Income and Comprehensive Income (Loss)
(unaudited)
(in thousands, except per share amounts)


Three Months Ended June 30,  Six Months Ended June 30, 

2021


2020


2021


2020

 
Revenues

$                 70,597

$                 57,394

$               137,168

$               121,104

Operating expenses
Direct costs and expenses for advisors

43,007

33,759

84,163

74,776

Selling, general and administrative

20,492

18,593

39,532

40,474

Depreciation and amortization

1,255

1,529

2,615

3,060

Operating income

5,843

3,513

10,858

2,794

Interest income

60

54

131

127

Interest expense

(613)

(819)

(1,256)

(2,203)

Foreign currency transaction gain (loss)

8

(82)

(3)

80

 
Income before taxes

5,298

2,666

9,730

798

Income tax provision

1,192

2,054

2,200

1,545

Net income (loss)

 $                   4,106

 $                      612

 $                   7,530

 $                    (747)

 
Weighted average shares outstanding:
Basic

48,307

47,601

48,406

47,458

Diluted

51,315

48,962

51,814

47,458

 
Earnings (loss) per share:
Basic

 $                     0.08

 $                     0.01

 $                     0.16

 $                   (0.02)

Diluted

 $                     0.08

 $                     0.01

 $                     0.15

 $                   (0.02)

 
Information Services Group, Inc.
Reconciliation from GAAP to Non-GAAP
(unaudited)
(in thousands, except per share amounts)


Three Months Ended June 30,  Six Months Ended June 30, 

2021


2020


2021


2020

 
Net income (loss)

 $                4,106

 $                    612

 $                7,530

 $                  (747)

Plus:
Interest expense (net of interest income)

                       553

                       765

                    1,125

                    2,076

Income taxes

                    1,192

                    2,054

                    2,200

                    1,545

Depreciation and amortization

                    1,255

                    1,529

                    2,615

                    3,060

Change in contingent consideration

                         34

                            –

                         66

                            –

Acquisition-related costs

                         13

                       201

                       (32)

                       250

Severance, integration and other expense

                    1,165

                       196

                    1,300

                       367

Financing-related costs

                            –

                            –

                            –

                         92

Foreign currency transaction (gain) loss 

                         (8)

                         82

                           3

                       (80)

Non-cash stock compensation

                    1,428

                    1,966

                    3,576

                    4,385

Adjusted EBITDA 

 $                9,738

 $                7,405

 $              18,383

 $              10,948

 
Net income (loss)

 $                4,106

 $                    612

 $                7,530

 $                  (747)

Plus:
Non-cash stock compensation

                    1,428

                    1,966

                    3,576

                    4,385

Intangible amortization

                       644

                       860

                    1,358

                    1,705

Change in contingent consideration

                         34

                            –

                         66

                            –

Acquisition-related costs

                         13

                       201

                       (32)

                       250

Severance, integration and other expense

                    1,165

                       196

                    1,300

                       367

Financing-related costs

                            –

                            –

                            –

                         92

Write-off of deferred financing costs

                            –

                            –

                            –

                       167

Foreign currency transaction (gain) loss 

                         (8)

                         82

                           3

                       (80)

Tax effect (1)

                  (1,048)

                  (1,058)

                  (2,007)

                  (2,204)

Adjusted net income 

 $                6,334

 $                2,859

 $              11,794

 $                3,935

 
Weighted average shares outstanding:
Basic

48,307

47,601

48,406

47,458

Diluted

51,315

48,962

51,814

47,458

 
Adjusted earnings per share:
Basic

 $                   0.13

 $                   0.06

 $                   0.24

 $                   0.08

Diluted

 $                   0.12

 $                   0.06

 $                   0.23

 $                   0.08


(1)

Marginal tax rate of 32.0% applied. 
Information Services Group, Inc.
Selected Financial Data
Constant Currency Comparison
           
       Three Months        Three Months  
   Three Months    Constant    Ended   Three Months     Constant     Ended 
   Ended    currency    June 30, 2021   Ended    currency    June 30, 2020 
   June 30, 2021    impact     Adjusted   June 30, 2020    impact    Adjusted 
Revenue  

 $                        70,597


 $          (1,666)


 $                        68,931

 $                        57,394


 $        1,305


 $                         58,699

Operating income (loss)  

 $                          5,843


 $             (466)


 $                          5,377

 $                          3,513


 $           318


 $                           3,831

Adjusted EBITDA   

 $                          9,738


 $             (495)


 $                          9,243

 $                          7,405


 $           331


 $                           7,736

           
       Six Months       Six Months 
   Six Months    Constant    Ended   Six Months    Constant     Ended 
   Ended    currency    June 30, 2021   Ended    currency    June 30, 2020 
   June 30, 2021    impact     Adjusted   June 30, 2020    impact    Adjusted 
Revenue  

 $                      137,168


 $          (3,062)


 $                      134,106

 $                      121,104


 $        2,661


 $                       123,765

Operating income  

 $                        10,858


 $             (696)


 $                        10,162

 $                          2,794


 $           866


 $                           3,660

Adjusted EBITDA   

 $                        18,383


 $             (740)


 $                        17,643

 $                        10,948


 $           889


 $                         11,837


Source: Information Services Group, Inc.

Information Services Group Announces Second-Quarter 2021 Results


Information Services Group Announces Second-Quarter 2021 Results


  • Reports strong second-quarter GAAP revenues of $71 million, up 23% from prior year, exceeding guidance
  • Reports second-quarter net income of $4 million, GAAP EPS of $0.08 and adjusted EPS of $0.12
  • Reports second-quarter adjusted EBITDA of $10 million, up 32 percent versus prior year, exceeding guidance
  • Achieves quarter-end cash balance of $44 million, up 39 percent from prior year
  • Announces $25 million expansion of share repurchase program
  • Declares third-quarter dividend of $0.03 per share, payable September 24
  • Sets third-quarter 2021 guidance: revenues between $66 million and $68 million and adjusted EBITDA of between $8 million and $9 million

STAMFORD, Conn.–(BUSINESS WIRE)– Information Services Group (ISG) (Nasdaq: III), a leading global technology research and advisory firm, today announced financial results for the second quarter ended June 30, 2021.

“ISG delivered an excellent second quarter, increasing our business momentum,” said Michael P. Connors, chairman and CEO. “Our double-digit revenue and adjusted EBITDA growth in Q2 reflects a more robust demand environment, highlighted by our 28 percent growth in the Americas, as the pandemic recedes and clients double-down on their digital investments. Our results also reflect the impact of our solution-centric and agile ISG NEXT operating model, which continues to deliver greater account expansion opportunities, higher consulting utilization and improved profitability.”

Connors said ISG sees market momentum continuing in the second half, reflecting both pent-up demand and a structural shift to more cloud adoption and digital transformation. “Our in-depth research and analysis, world-class advisory capabilities and SaaS-based platforms offer our clients the insights, expertise and tools they need to digitally transform their businesses for operational excellence and faster growth. Operating at the center of an increasingly technology-driven economy, ISG is well-positioned for continued success,” said Connors.

Connors noted that the firm’s recurring revenues grew by 18 percent in the second quarter, fueled, in particular, by the ISG Research business.

Second-Quarter 2021 Results

Reported revenues for the second quarter were $70.6 million, up 23 percent versus last year (up 17 percent in constant currency). Currency translation positively impacted reported revenues by $3.0 million versus the prior year. Reported revenues were $40.3 million in the Americas, up 28 percent versus the prior year; $23.7 million in Europe, up 13 percent versus the prior year on a reported basis and up 4 percent in constant currency, and $6.5 million in Asia Pacific, up 36 percent versus the prior year on a reported basis and up 18 percent in constant currency.

ISG reported second-quarter operating income of $5.8 million, compared with operating income of $3.5 million in the second quarter of 2020. The firm also reported second-quarter net income and earnings per share of $4.1 million and $0.08, respectively, compared with a net income of $0.6 million and earnings per share of $0.01 in the prior year’s second quarter.

Adjusted net income (a non-GAAP measure defined below under “Non-GAAP Financial Measures”) for the second quarter was $6.3 million, or $0.12 per share on a fully diluted basis, compared with adjusted net income of $2.9 million, or $0.06 per share on a fully diluted basis, in the prior year’s second quarter.

Second-quarter adjusted EBITDA (a non-GAAP measure defined below under “Non-GAAP Financial Measures”) was $9.7 million, up 32 percent from the second quarter last year. Adjusted EBITDA margin was 14 percent, up 100 basis points from the prior year.

Other Financial and Operating Highlights

ISG generated $8.9 million of cash from operations in the second quarter, compared with $22.4 million in the prior year. The firm’s cash balance totaled $43.8 million at June 30, 2021, up 39 percent from $31.6 million in the prior year. ISG paid down $1.1 million of debt during the quarter, paid dividends of $1.5 million and repurchased $8.3 million of shares. As of June 30, 2021, ISG had $76.6 million in debt outstanding, compared with $80.9 million at the end of the second quarter last year. The firm’s gross debt-to-adjusted-EBITDA ratio of 2.1 is at a multiyear low.

2021 Third-Quarter Revenue and Adjusted EBITDA Guidance

“Balancing the seasonal summer holidays and lingering Covid effects, particularly in Europe, with increasing demand momentum, we are targeting double-digit growth for the third quarter of 2021, with revenues between $66 million and $68 million and adjusted EBITDA between $8 million and $9 million,” said Connors. “We will continue to monitor the macro-economic environment, including the impact of the coronavirus, and adjust our business outlook as markets dictate.”

Share Repurchase Authorization

The Board of Directors approved a new share repurchase authorization of $25.0 million, increasing to $28.2 million the aggregate available under the firm’s share repurchase program. The new share repurchase program will take effect upon completion of the current program, which had approximately $3.2 million remaining as of June 30, 2021.

“ISG remains committed to a disciplined capital allocation strategy that consists of reinvesting in our business, reducing debt, returning capital to shareholders via dividends and share repurchases, and supplementing our organic growth with strategic acquisitions to drive long-term shareholder value. During Q2, we returned $9.8 million to shareholders via share buyback and dividends, and reduced our debt by $1.1 million,” said Connors.

Third-Quarter Dividend

The ISG Board of Directors declared a third-quarter dividend of $0.03 per share, payable on September 24, 2021, to shareholders of record on September 7, 2021.

Conference Call

ISG has scheduled a call for 9 a.m., U.S. Eastern Time, Monday, August 9, 2021, to discuss the company’s second-quarter results. The call can be accessed by dialing 1-800-437-2398; or, for international callers, by dialing 001-323-289-6576. The access code is 1506173. A recording of the conference call will be accessible on ISG’s website (www.isg-one.com) for approximately four weeks following the call.

Forward-Looking Statements

This communication contains “forward-looking statements” which represent the current expectations and beliefs of management of ISG concerning future events and their potential effects. Statements contained herein including words such as “anticipate,” “believe,” “contemplate,” “plan,” “estimate,” “target,” “expect,” “intend,” “will,” “continue,” “should,” “may,” and other similar expressions, are “forward-looking statements” under the Private Securities Litigation Reform Act of 1995. These forward-looking statements are not guarantees of future results and are subject to certain risks and uncertainties that could cause actual results to differ materially from those anticipated. Those risks relate to inherent business, economic and competitive uncertainties and contingencies relating to the businesses of ISG and its subsidiaries including without limitation: (1) failure to secure new engagements or loss of important clients; (2) ability to hire and retain enough qualified employees to support operations; (3) ability to maintain or increase billing and utilization rates; (4) management of growth; (5) success of expansion internationally; (6) competition; (7) ability to move the product mix into higher margin businesses; (8) general political and social conditions such as war, political unrest and terrorism; (9) healthcare and benefit cost management; (10) ability to protect ISG and its subsidiaries’ intellectual property or data and the intellectual property or data of others; (11) currency fluctuations and exchange rate adjustments; (12) ability to successfully consummate or integrate strategic acquisitions; (13) outbreaks of diseases, including coronavirus, or similar public health threats or fear of such an event; and (14) engagements may be terminated, delayed or reduced in scope by clients. Certain of these and other applicable risks, cautionary statements and factors that could cause actual results to differ from ISG’s forward-looking statements are included in ISG’s filings with the U.S. Securities and Exchange Commission. ISG undertakes no obligation to update or revise any forward-looking statements to reflect subsequent events or circumstances.

Non-GAAP Financial Measures

ISG reports all financial information required in accordance with U.S. generally accepted accounting principles (GAAP). In this release, ISG has presented both GAAP financial results as well as non-GAAP information for the three months and six months ended June 30, 2021 and June 30, 2020. ISG believes that evaluating its ongoing operating results will be enhanced if it discloses certain non-GAAP information. These non-GAAP financial measures exclude non-cash and certain other special charges that many investors believe may obscure the user’s overall understanding of ISG’s current financial performance and the Company’s prospects for the future. ISG believes that these non-GAAP measures provide useful information to investors because they improve the comparability of the financial results between periods and provide for greater transparency of key measures used to evaluate the Company’s performance.

ISG provides adjusted EBITDA (defined as net income plus interest, taxes, depreciation and amortization, foreign currency transaction gains/losses, non-cash stock compensation, change in contingent consideration, acquisition-related costs, severance, integration and other expense and financing-related costs), adjusted net income (defined as net income plus amortization of intangible assets, non-cash stock compensation, foreign currency transaction gains/losses, change in contingent consideration, acquisition-related costs, severance, integration and other expense, financing-related costs, and write-off of deferred financing costs, on a tax-adjusted basis), adjusted net income per diluted share and selected financial data on a constant currency basis which are non-GAAP measures that the Company believes provide useful information to both management and investors by excluding certain expenses and financial implications of foreign currency translations, which management believes are not indicative of ISG’s core operations. These non-GAAP measures are used by ISG to evaluate the Company’s business strategies and management’s performance.

We evaluate our results of operations on both an as reported and a constant currency basis. The constant currency presentation, which is a non-GAAP financial measure, excludes the impact of year-over-year fluctuations in foreign currency exchange rates. We believe providing constant currency information provides valuable supplemental information regarding our results of operations, thereby facilitating period-to-period comparisons of our business performance and is consistent with how management evaluates the Company’s performance. We calculate constant currency percentages by converting our current and prior-periods local currency financial results using the same point in time exchange rates and then compare the adjusted current and prior period results. This calculation may differ from similarly titled measures used by others and, accordingly, the constant currency presentation is not meant to be a substitution for recorded amounts presented in conformity with GAAP, nor should such amounts be considered in isolation.

Management believes this information facilitates comparison of underlying results over time. Non-GAAP financial measures, when presented, are reconciled to the most closely applicable GAAP measure. Non-GAAP measures are provided as additional information and should not be considered in isolation or as a substitute for results prepared in accordance with GAAP. A reconciliation of the forward-looking non-GAAP estimates contained herein to the corresponding GAAP measures is not being provided, due to the unreasonable efforts required to prepare it.

About ISG

ISG (Information Services Group) (Nasdaq: III) is a leading global technology research and advisory firm. A trusted business partner to more than 700 clients, including more than 75 of the world’s top 100 enterprises, ISG is committed to helping corporations, public sector organizations, and service and technology providers achieve operational excellence and faster growth. The firm specializes in digital transformation services, including automation, cloud and data analytics; sourcing advisory; managed governance and risk services; network carrier services; strategy and operations design; change management; market intelligence and technology research and analysis. Founded in 2006, and based in Stamford, Conn., ISG employs more than 1,300 digital-ready professionals operating in more than 20 countries—a global team known for its innovative thinking, market influence, deep industry and technology expertise, and world-class research and analytical capabilities based on the industry’s most comprehensive marketplace data. For more information, visit www.isg-one.com.

Information Services Group, Inc.
Condensed Consolidated Statement of Income and Comprehensive Income (Loss)
(unaudited)
(in thousands, except per share amounts)


Three Months Ended June 30,  Six Months Ended June 30, 

2021


2020


2021


2020

 
Revenues

$                 70,597

$                 57,394

$               137,168

$               121,104

Operating expenses
Direct costs and expenses for advisors

43,007

33,759

84,163

74,776

Selling, general and administrative

20,492

18,593

39,532

40,474

Depreciation and amortization

1,255

1,529

2,615

3,060

Operating income

5,843

3,513

10,858

2,794

Interest income

60

54

131

127

Interest expense

(613)

(819)

(1,256)

(2,203)

Foreign currency transaction gain (loss)

8

(82)

(3)

80

 
Income before taxes

5,298

2,666

9,730

798

Income tax provision

1,192

2,054

2,200

1,545

Net income (loss)

 $                   4,106

 $                      612

 $                   7,530

 $                    (747)

 
Weighted average shares outstanding:
Basic

48,307

47,601

48,406

47,458

Diluted

51,315

48,962

51,814

47,458

 
Earnings (loss) per share:
Basic

 $                     0.08

 $                     0.01

 $                     0.16

 $                   (0.02)

Diluted

 $                     0.08

 $                     0.01

 $                     0.15

 $                   (0.02)

 
Information Services Group, Inc.
Reconciliation from GAAP to Non-GAAP
(unaudited)
(in thousands, except per share amounts)


Three Months Ended June 30,  Six Months Ended June 30, 

2021


2020


2021


2020

 
Net income (loss)

 $                4,106

 $                    612

 $                7,530

 $                  (747)

Plus:
Interest expense (net of interest income)

                       553

                       765

                    1,125

                    2,076

Income taxes

                    1,192

                    2,054

                    2,200

                    1,545

Depreciation and amortization

                    1,255

                    1,529

                    2,615

                    3,060

Change in contingent consideration

                         34

                            –

                         66

                            –

Acquisition-related costs

                         13

                       201

                       (32)

                       250

Severance, integration and other expense

                    1,165

                       196

                    1,300

                       367

Financing-related costs

                            –

                            –

                            –

                         92

Foreign currency transaction (gain) loss 

                         (8)

                         82

                           3

                       (80)

Non-cash stock compensation

                    1,428

                    1,966

                    3,576

                    4,385

Adjusted EBITDA 

 $                9,738

 $                7,405

 $              18,383

 $              10,948

 
Net income (loss)

 $                4,106

 $                    612

 $                7,530

 $                  (747)

Plus:
Non-cash stock compensation

                    1,428

                    1,966

                    3,576

                    4,385

Intangible amortization

                       644

                       860

                    1,358

                    1,705

Change in contingent consideration

                         34

                            –

                         66

                            –

Acquisition-related costs

                         13

                       201

                       (32)

                       250

Severance, integration and other expense

                    1,165

                       196

                    1,300

                       367

Financing-related costs

                            –

                            –

                            –

                         92

Write-off of deferred financing costs

                            –

                            –

                            –

                       167

Foreign currency transaction (gain) loss 

                         (8)

                         82

                           3

                       (80)

Tax effect (1)

                  (1,048)

                  (1,058)

                  (2,007)

                  (2,204)

Adjusted net income 

 $                6,334

 $                2,859

 $              11,794

 $                3,935

 
Weighted average shares outstanding:
Basic

48,307

47,601

48,406

47,458

Diluted

51,315

48,962

51,814

47,458

 
Adjusted earnings per share:
Basic

 $                   0.13

 $                   0.06

 $                   0.24

 $                   0.08

Diluted

 $                   0.12

 $                   0.06

 $                   0.23

 $                   0.08


(1)

Marginal tax rate of 32.0% applied. 
Information Services Group, Inc.
Selected Financial Data
Constant Currency Comparison
           
       Three Months        Three Months  
   Three Months    Constant    Ended   Three Months     Constant     Ended 
   Ended    currency    June 30, 2021   Ended    currency    June 30, 2020 
   June 30, 2021    impact     Adjusted   June 30, 2020    impact    Adjusted 
Revenue  

 $                        70,597


 $          (1,666)


 $                        68,931

 $                        57,394


 $        1,305


 $                         58,699

Operating income (loss)  

 $                          5,843


 $             (466)


 $                          5,377

 $                          3,513


 $           318


 $                           3,831

Adjusted EBITDA   

 $                          9,738


 $             (495)


 $                          9,243

 $                          7,405


 $           331


 $                           7,736

           
       Six Months       Six Months 
   Six Months    Constant    Ended   Six Months    Constant     Ended 
   Ended    currency    June 30, 2021   Ended    currency    June 30, 2020 
   June 30, 2021    impact     Adjusted   June 30, 2020    impact    Adjusted 
Revenue  

 $                      137,168


 $          (3,062)


 $                      134,106

 $                      121,104


 $        2,661


 $                       123,765

Operating income  

 $                        10,858


 $             (696)


 $                        10,162

 $                          2,794


 $           866


 $                           3,660

Adjusted EBITDA   

 $                        18,383


 $             (740)


 $                        17,643

 $                        10,948


 $           889


 $                         11,837


Source: Information Services Group, Inc.