FORT WAYNE, Ind., Feb. 08, 2024 (GLOBE NEWSWIRE) — Vera Bradley, Inc. (Nasdaq: VRA) (the “Company”) today announced that it plans to report results for the fourth quarter and fiscal year ended February 3, 2024 at 8:00 a.m. Eastern Time on Wednesday, March 13, 2024.
The Company will host a conference call to discuss its financial results at 9:30 a.m. Eastern Time that same day. A live webcast of the conference call will be available on the Investor Relations section of the Company’s website, www.verabradley.com. Alternatively, interested parties may dial into the call at (877) 407-0779, and enter the access code 13742953. A replay will be available shortly after the conclusion of the call and remain available through March 27, 2024. To access the recording, listeners should dial (844) 512-2921, and enter the access code 13742953.
ABOUT VERA BRADLEY, INC.
Vera Bradley, Inc. operates two unique lifestyle brands – Vera Bradley and Pura Vida. Vera Bradley and Pura Vida are complementary businesses, both with devoted, emotionally connected, and multi-generational female customer bases; alignment as causal, comfortable, affordable, and fun brands; positioning as “gifting” and socially-connected brands; strong, entrepreneurial cultures; a keen focus on community, charity, and social consciousness; multi-channel distribution strategies; and talented leadership teams aligned and committed to the long-term success of their brands.
Vera Bradley, based in Fort Wayne, Indiana, is a leading designer of women’s handbags, luggage and other travel items, fashion and home accessories, and unique gifts. Founded in 1982 by friends Barbara Bradley Baekgaard and Patricia R. Miller, the brand is known for its innovative designs, iconic patterns, and brilliant colors that inspire and connect women unlike any other brand in the global marketplace.
In July 2019, Vera Bradley, Inc. acquired a 75% interest in Creative Genius, Inc., which also operates under the name Pura Vida Bracelets (“Pura Vida”). Pura Vida, based in La Jolla, California, is a digitally native, highly engaging lifestyle brand founded in 2010 by friends Paul Goodman and Griffin Thall. Pura Vida has a differentiated and expanding offering of bracelets, jewelry, and other lifestyle accessories. The Company acquired the remaining 25% of Pura Vida in January 2023.
Reports Revenues of $822.1 million and Net Income of $62.9 million, or $0.97 per share, which Includes a Non-Cash Impairment Charge of $19.8 million
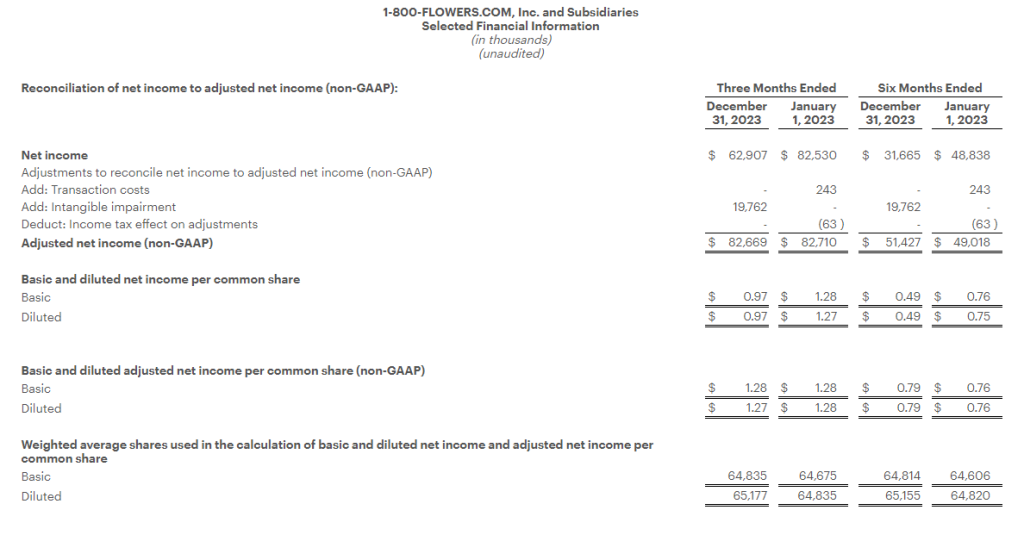
Adjusted Net Income (1) was $82.7 million, or $1.27 per share
Gross Profit Margin Improves 230 basis points to 43.3%, Marking the Fifth Consecutive Quarter of Year-Over-Year Gross Profit Margin Expansion
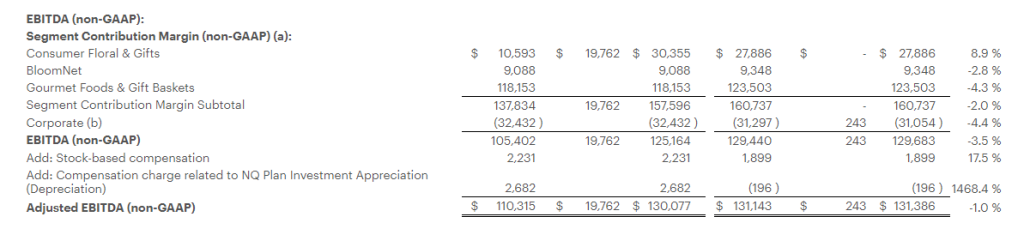
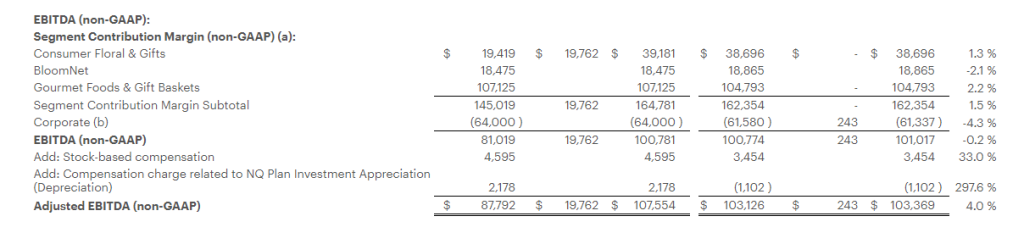
Generates Adjusted EBITDA (1) of $130.1 million
Updates Fiscal 2024 Revenue Guidance
(1) Refer to “Definitions of Non-GAAP Financial Measures” and the tables attached at the end of this press release for reconciliation of non-GAAP results to applicable GAAP results.)
JERICHO, N.Y.–(BUSINESS WIRE)– 1-800-FLOWERS.COM, Inc. (NASDAQ: FLWS), a leading provider of gifts designed to help inspire customers to give more, connect more, and build more and better relationships, today reported results for its fiscal 2024 second quarter ended December 31, 2023.
Fiscal 2024 Second Quarter Highlights
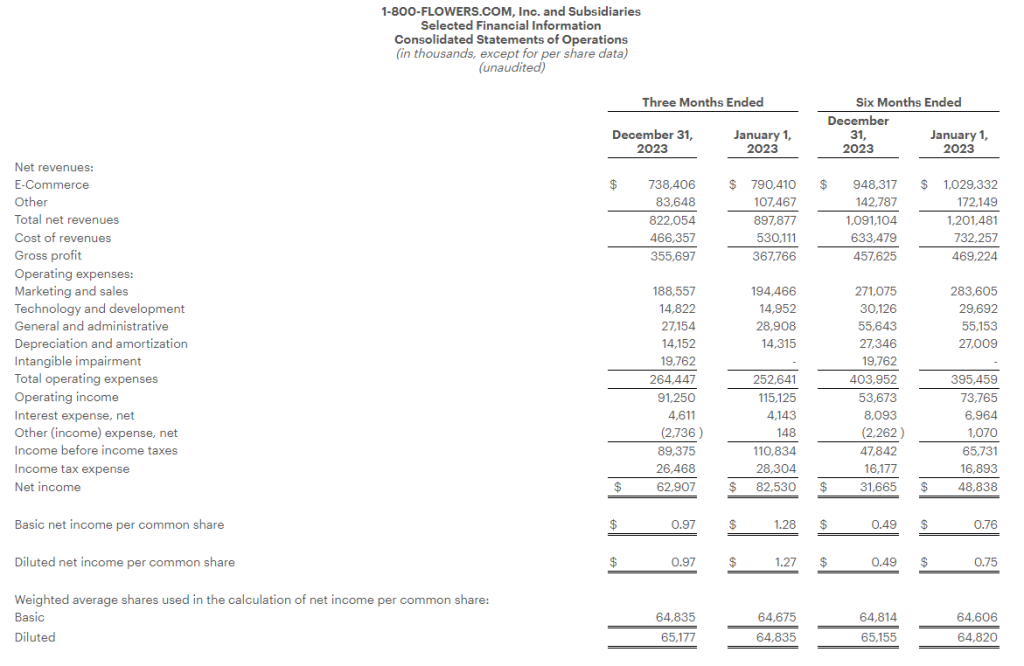
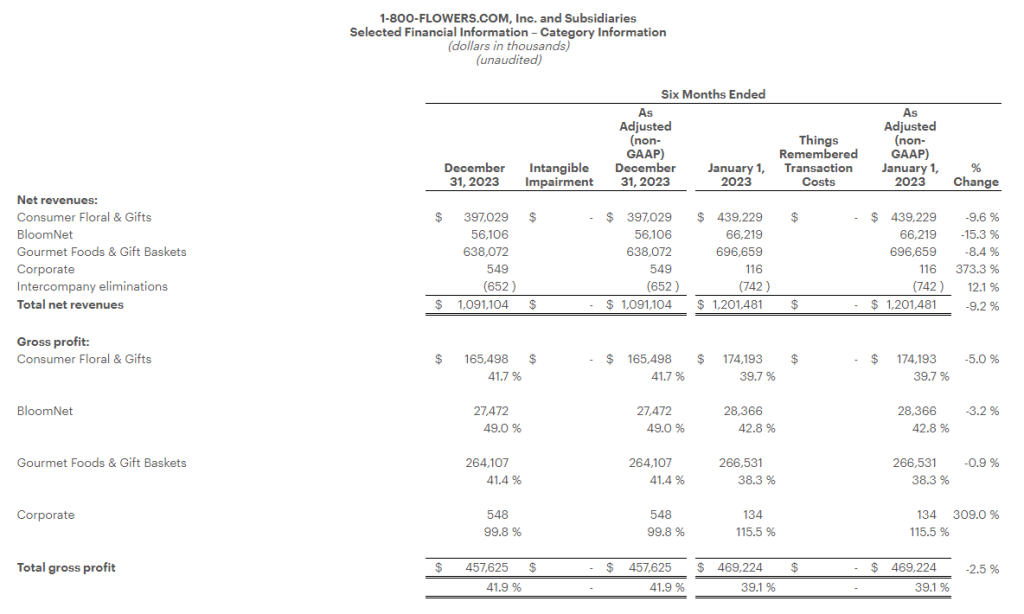
Total consolidated revenues decreased 8.4% to $822.1 million, compared with total consolidated revenues of $897.9 million in the prior year period. E-commerce revenue declined 6.6% to $738.4 million.
Gross profit margin increased 230 basis points to 43.3%, compared with 41.0% in the prior year period. The gross profit margin expansion was led by improvements across the Company’s three business segments, which benefited from lower freight costs, lower labor costs, a decline in certain commodity costs, as well as the Company’s inventory optimization efforts.
Operating expenses increased $11.8 million from the prior year period, including a $19.8 million non-cash impairment charge in the Consumer Floral and Gifts segment related to the Personalization Mall trademark. Excluding the impact of this charge and the appreciation or depreciation of investments in the Company’s non-qualified compensation plan, operating expenses declined $10.8 million as compared with the prior year period to $242.0 million.
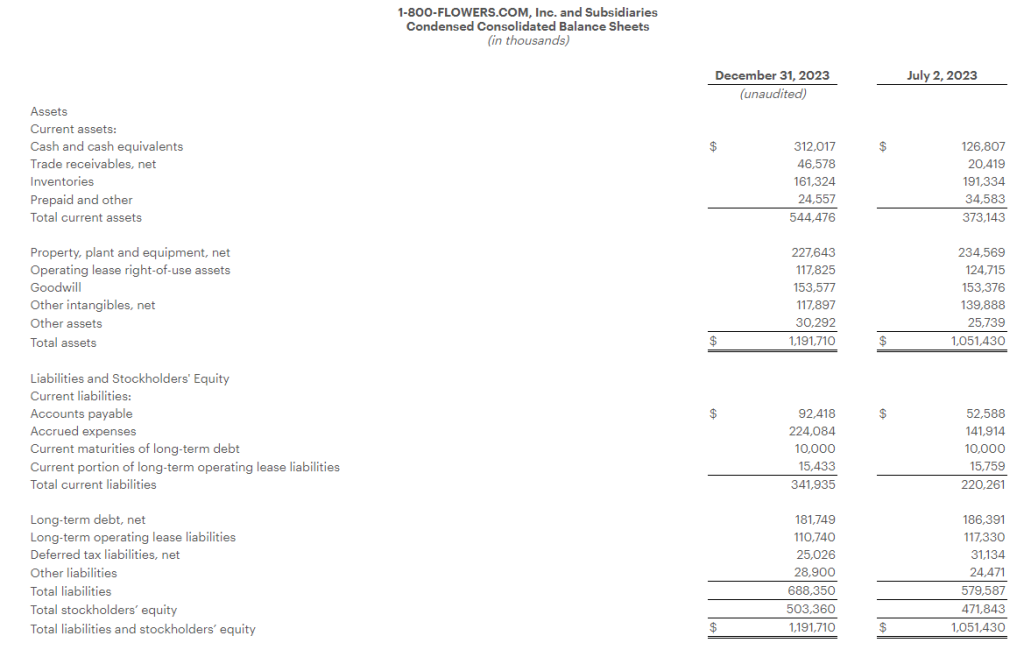
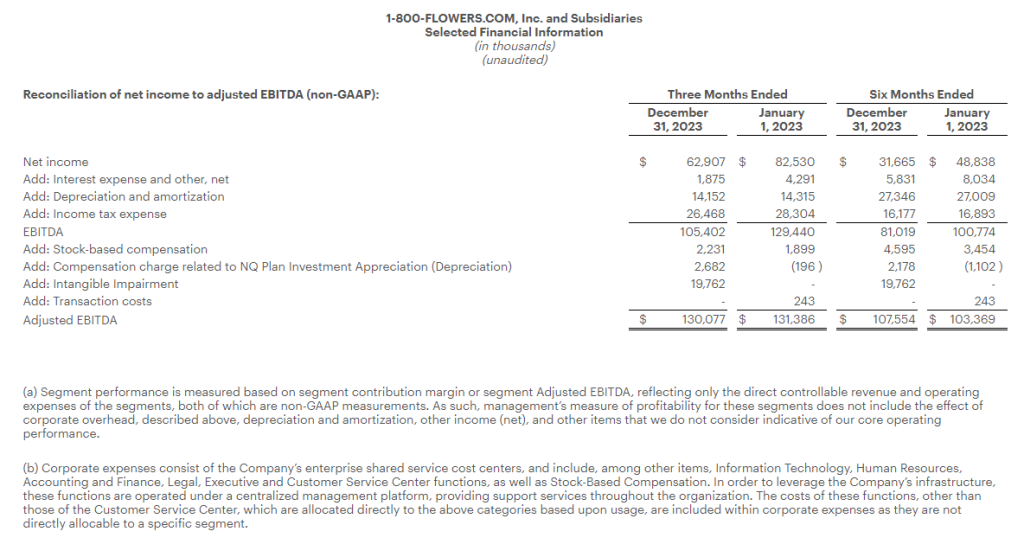
Net income for the quarter was $62.9 million, or $0.97 per diluted share, which includes a non-cash impairment charge of $19.8 million or $0.30 per diluted share. Adjusted Net Income1 was $82.7 million, or $1.27 per diluted share. In the prior year period, Net income was $82.5 million, or $1.27 per diluted share.
Adjusted EBITDA1 for the quarter was $130.1 million, as compared with Adjusted EBITDA1 of $131.4 million in the prior year period.
“Our second quarter earnings came in line with our expectations, as our gross profit margin recovery and expense optimization efforts helped offset a softer than anticipated consumer environment,” said Jim McCann, Chairman and Chief Executive Officer of 1-800-FLOWERS.COM, Inc. “This was our fifth consecutive quarter of gross margin expansion, and we are well on our path to returning to our historical mean annual gross margin rate in the low 40s percent range. Our gross profit margin is benefiting from a reversion to the mean of certain commodity costs combined with our Work Smarter initiatives that are centered on operating more efficiently and provide a benefit to both our gross profit margin and operating expenses.”
“We are maintaining our full year Adjusted EBITDA estimate, as our Work Smarter initiatives that are contributing to our gross profit margin and operating margin are expected to continue to mitigate a softer topline environment,” continued Mr. McCann. “Our quarter-over-quarter sales trends continue to move in the right direction and our Relationship Innovation and Work Smarter initiatives are having a clear and direct impact on our business, which we expect to only be further buoyed as the broader consumer discretionary environment improves.”
Segment Results
The Company provides Fiscal 2024 second quarter selected financial results for its Gourmet Foods and Gift Baskets, Consumer Floral and Gifts, and BloomNet segments in the tables attached to this release and as follows:
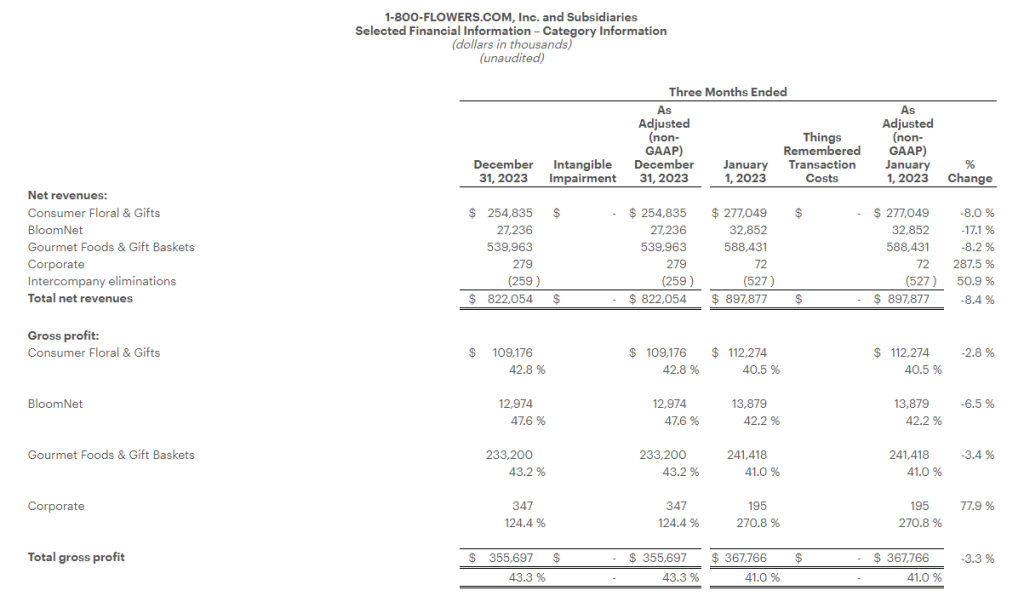
Gourmet Foods and Gift Baskets: Revenues for the quarter were $540.0 million, declining 8.2% compared with $588.4 million in the prior year period. Gross profit margin expanded 220 basis points to 43.2%, compared with 41.0% percent in the prior year period, benefiting from lower freight costs, lower labor costs, a decline in certain commodity costs, as well as the Company’s inventory optimization efforts. Segment contribution margin1 declined by $5.4 million to $118.2 million, compared with segment contribution margin1 of $123.5 million in the prior year period, primarily due to the revenue decline.
Consumer Floral & Gifts: Revenues for the quarter were $254.8 million, declining 8.0% compared with $277.0 million in the prior year period. Gross profit margin expanded 230 basis points to 42.8%, compared with 40.5% percent in the prior year period, improving on lower freight and labor costs. Segment contribution margin1 excluding the impairment charge was $30.4 million, compared with segment contribution margin1 of $27.9 million in the prior year period.
BloomNet: Revenues for the quarter were $27.2 million, declining 17.1% compared with $32.9 million in the prior year period. Revenue was impacted by the lower order volume processed by BloomNet. Gross profit margin was 47.6%, compared with 42.2% in the prior year period, primarily reflecting product mix and lower freight costs. Segment contribution margin1 was $9.1 million, compared with $9.3 million in the prior year period.
Company Guidance
The Company is updating its Fiscal 2024 guidance to reduce its revenue outlook for the full year, while maintaining its Adjusted EBITDA and Free Cash Flow expectations, as the improvement in gross profit margin and the company’s expense optimization efforts are expected to mitigate the softer than anticipated revenue improvement.
As a result, the Company now expects Fiscal 2024:
total revenues on a percentage basis to decline in a range of 7% to 9%, as compared with the prior year;
Adjusted EBITDA1 to be in a range of $95 million to $100 million; and
Free Cash Flow1 to be in a range of $60 million to $65 million.
Conference Call
The Company will conduct a conference call to discuss the above details and attached financial results today, February 1, 2024, at 8:00 a.m. (ET). The conference call will be webcast from the Investors section of the Company’s website at www.1800flowersinc.com. A recording of the call will be posted on the Investors section of the Company’s website within two hours of the call’s completion. A telephonic replay of the call can be accessed beginning at 2:00 p.m. (ET) today through February 8, 2024, at: (US) 1-877-344-7529; (Canada) 855-669-9658; (International) 1-412-317-0088; enter conference ID #: 4402294.
Definitions of non-GAAP Financial Measures:
We sometimes use financial measures derived from consolidated financial information, but not presented in our financial statements prepared in accordance with U.S. generally accepted accounting principles (“GAAP”). Certain of these are considered “non-GAAP financial measures” under the U.S. Securities and Exchange Commission rules. Non-GAAP financial measures referred to in this document are either labeled as “non-GAAP” or designated as such with a “1”. See below for definitions and the reasons why we use these non-GAAP financial measures. Where applicable, see the Selected Financial Information below for reconciliations of these non-GAAP measures to their most directly comparable GAAP financial measures. Reconciliations for forward-looking figures would require unreasonable efforts at this time because of the uncertainty and variability of the nature and amount of certain components of various necessary GAAP components, including, for example, those related to compensation, tax items, amortization or others that may arise during the year, and the Company’s management believes such reconciliations would imply a degree of precision that would be confusing or misleading to investors. For the same reasons, the Company is unable to address the probable significance of the unavailable information. The lack of such reconciling information should be considered when assessing the impact of such disclosures.
EBITDA and Adjusted EBITDA:
We define EBITDA as net income (loss) before interest, taxes, depreciation, and amortization. Adjusted EBITDA is defined as EBITDA adjusted for the impact of stock-based compensation, Non-Qualified Plan Investment appreciation/depreciation, and for certain items affecting period-to-period comparability. See Selected Financial Information for details on how EBITDA and Adjusted EBITDA were calculated for each period presented. The Company presents EBITDA and Adjusted EBITDA because it considers such information meaningful supplemental measures of its performance and believes such information is frequently used by the investment community in the evaluation of similarly situated companies. The Company uses EBITDA and Adjusted EBITDA as factors to determine the total amount of incentive compensation available to be awarded to executive officers and other employees. The Company’s credit agreement uses EBITDA and Adjusted EBITDA to determine its interest rate and to measure compliance with certain covenants. EBITDA and Adjusted EBITDA are also used by the Company to evaluate and price potential acquisition candidates. EBITDA and Adjusted EBITDA have limitations as analytical tools and should not be considered in isolation or as a substitute for analysis of the Company’s results as reported under GAAP. Some of the limitations are: (a) EBITDA and Adjusted EBITDA do not reflect changes in, or cash requirements for, the Company’s working capital needs; (b) EBITDA and Adjusted EBITDA do not reflect the significant interest expense, or the cash requirements necessary to service interest or principal payments, on the Company’s debts; and (c) although depreciation and amortization are non-cash charges, the assets being depreciated and amortized may have to be replaced in the future and EBITDA does not reflect any cash requirements for such capital expenditures. EBITDA and Adjusted EBITDA should only be used on a supplemental basis combined with GAAP results when evaluating the Company’s performance.
Segment Contribution Margin and Adjusted Segment Contribution Margin
We define Segment Contribution Margin as earnings before interest, taxes, depreciation, and amortization, before the allocation of corporate overhead expenses. Adjusted Segment Contribution Margin is defined as Segment Contribution Margin adjusted for certain items affecting period-to-period comparability. See Selected Financial Information for details on how Segment Contribution Margin and Adjusted Segment Contribution Margin were calculated for each period presented. When viewed together with our GAAP results, we believe Segment Contribution Margin and Adjusted Segment Contribution Margin provide management and users of the financial statements meaningful information about the performance of our business segments. Segment Contribution Margin and Adjusted Segment Contribution Margin are used in addition to and in conjunction with results presented in accordance with GAAP and should not be relied upon to the exclusion of GAAP financial measures. The material limitation associated with the use of Segment Contribution Margin and Adjusted Segment Contribution Margin is that they are an incomplete measure of profitability as they do not include all operating expenses or non-operating income and expenses. Management compensates for this limitation when using these measures by looking at other GAAP measures, such as Operating Income and Net Income.
Adjusted Net Income (Loss) and Adjusted or Comparable Net Income (Loss) Per Common Share:
We define Adjusted Net Income (Loss) and Adjusted or Comparable Net Income (Loss) Per Common Share as Net Income (Loss) and Net Income (Loss) Per Common Share adjusted for certain items affecting period-to-period comparability. See Selected Financial Information below for details on how Adjusted Net Income (Loss) Per Common Share and Adjusted or Comparable Net Income (Loss) Per Common Share were calculated for each period presented. We believe that Adjusted Net Income (Loss) and Adjusted or Comparable Net Income (Loss) Per Common Share are meaningful measures because they increase the comparability of period-to-period results. Since these are not measures of performance calculated in accordance with GAAP, they should not be considered in isolation of, or as a substitute for, GAAP Net Income (Loss) and Net Income (Loss) Per Common share, as indicators of operating performance and they may not be comparable to similarly titled measures employed by other companies.
Free Cash Flow:
We define Free Cash Flow as net cash provided by operating activities less capital expenditures. The Company considers Free Cash Flow to be a liquidity measure that provides useful information to management and investors about the amount of cash generated by the business after the purchases of fixed assets, which can then be used to, among other things, invest in the Company’s business, make strategic acquisitions, strengthen the balance sheet, and repurchase stock or retire debt. Free Cash Flow is a liquidity measure that is frequently used by the investment community in the evaluation of similarly situated companies. Since Free Cash Flow is not a measure of performance calculated in accordance with GAAP, it should not be considered in isolation or as a substitute for analysis of the Company’s results as reported under GAAP. A limitation of the utility of Free Cash Flow as a measure of financial performance is that it does not represent the total increase or decrease in the Company’s cash balance for the period.
About 1-800-FLOWERS.COM, Inc.
1-800-FLOWERS.COM, Inc. is a leading provider of gifts designed to help inspire customers to give more, connect more, and build more and better relationships. The Company’s e-commerce business platform features an all-star family of brands, including: 1-800-Flowers.com®, 1-800-Baskets.com®, Cheryl’s Cookies®, Harry & David®, PersonalizationMall.com®, Shari’s Berries®, FruitBouquets.com®, Things Remembered®, Moose Munch®, The Popcorn Factory®, Wolferman’s Bakery®, Vital Choice®, and Simply Chocolate®. Through the Celebrations Passport® loyalty program, which provides members with free standard shipping and no service charge across our portfolio of brands, 1-800-FLOWERS.COM, Inc. strives to deepen relationships with customers. The Company also operates BloomNet®, an international floral and gift industry service provider offering a broad-range of products and services designed to help members grow their businesses profitably; Napco℠, a resource for floral gifts and seasonal décor; DesignPac Gifts, LLC, a manufacturer of gift baskets and towers; and Alice’s Table®, a lifestyle business offering fully digital floral, culinary and other experiences to guests across the country. 1-800-FLOWERS.COM, Inc. was recognized among the top 5 on the National Retail Federation’s 2021 Hot 25 Retailers list, which ranks the nation’s fastest-growing retail companies, and was named to the Fortune 1000 list in 2022. Shares in 1-800-FLOWERS.COM, Inc. are traded on the NASDAQ Global Select Market, ticker symbol: FLWS. For more information, visit 1800flowersinc.com or follow @1800FLOWERSInc on Twitter.
FLWS–COMP FLWS-FN
Special Note Regarding Forward Looking Statements:
This press release contains forward-looking statements within the meaning of the Private Securities Litigation Reform Act of 1995. These forward-looking statements represent the Company’s current expectations or beliefs concerning future events and can generally be identified using statements that include words such as “estimate,” “expects,” “project,” “believe,” “anticipate,” “intend,” “plan,” “foresee,” “forecast,” “likely,” “should,” “will,” “target” or similar words or phrases. These forward-looking statements are subject to risks, uncertainties, and other factors, many of which are outside of the Company’s control, which could cause actual results to differ materially from the results expressed or implied in the forward-looking statements, including, but not limited to, statements regarding the Company’s ability to achieve its guidance for the full Fiscal year; the Company’s ability to leverage its operating platform and reduce its operating expense ratio; its ability to successfully integrate acquired businesses and assets; its ability to successfully execute its strategic initiatives; its ability to cost effectively acquire and retain customers; the outcome of contingencies, including legal proceedings in the normal course of business; its ability to compete against existing and new competitors; its ability to manage expenses associated with sales and marketing and necessary general and administrative and technology investments; its ability to reduce promotional activities and achieve more efficient marketing programs; and general consumer sentiment and industry and economic conditions that may affect levels of discretionary customer purchases of the Company’s products. The Company undertakes no obligation to publicly update any of the forward-looking statements, whether because of new information, future events or otherwise, made in this release or in any of its SEC filings. Consequently, you should not consider any such list to be a complete set of all potential risks and uncertainties. For a more detailed description of these and other risk factors, refer to the Company’s SEC filings, including the Company’s Annual Reports on Form 10-K and its Quarterly Reports on Form 10-Q.
Note: The following tables are an integral part of this press release without which the information presented in this press release should be considered incomplete.
(a) Segment performance is measured based on segment contribution margin or segment Adjusted EBITDA, reflecting only the direct controllable revenue and operating expenses of the segments, both of which are non-GAAP measurements. As such, management’s measure of profitability for these segments does not include the effect of corporate overhead, described above, depreciation and amortization, other income (net), and other items that we do not consider indicative of our core operating performance.
(b) Corporate expenses consist of the Company’s enterprise shared service cost centers, and include, among other items, Information Technology, Human Resources, Accounting and Finance, Legal, Executive and Customer Service Center functions, as well as Stock-Based Compensation. In order to leverage the Company’s infrastructure, these functions are operated under a centralized management platform, providing support services throughout the organization. The costs of these functions, other than those of the Customer Service Center, which are allocated directly to the above categories based upon usage, are included within corporate expenses as they are not directly allocable to a specific segment.
Addition Of Rodriguez Will Shift Representation Of Women On Board To 78%
FORT WAYNE, Ind., Jan. 26, 2024 (GLOBE NEWSWIRE) — Vera Bradley, Inc. (Nasdaq: VRA) (the “Company”) today announced that Jessica Rodriguez, media business executive and former President of Entertainment and Chief Brand Officer for Univision Communications, Inc., has been elected to join its Board of Directors. With this appointment, representation of women on the Vera Bradley, Inc. Board of Directors will be 78%.
“Jessica Rodriguez brings a wealth of experience, supported by an exceptional record of driving innovation and executing future-focused, transformational strategies that deliver value and profitability in a rapidly changing business environment,” commented Jackie Ardrey, Chief Executive Officer of Vera Bradley, Inc. “Jessica’s unique perspective will be an excellent addition to the Vera Bradley, Inc. Board of Directors as we continue to focus on driving long-term, profitable growth for the Company and delivering value to our shareholders.”
Rodriguez is a visionary, results-driven leader and award-winning media business executive with a keen focus on creating, leading, and motivating high-performing, diverse, purpose-driven organizations. Rodriguez began her 20+ year career in media as Vice President and Station Manager for Univision Puerto Rico. From there, she successfully progressed through the organization in roles of increasing responsibility, including Vice President and Special Assistant to the President for Univision Networks, Inc.; Senior Vice President, Univision Cable Networks; Executive Vice President and Chief Marketing Officer, Univision; and Chief Operating Officer, Univision Networks. In 2018, Rodriguez was named President of Entertainment and Chief Brand Officer for Univision Communications, Inc., a post she held until 2022.
Rodriguez holds a bachelor’s degree in finance and economics from Fordham University and an MBA from the Stanford University Graduate School of Business. She currently serves as a member of the Burlington Stores, Inc. Board of Directors.
Rodriguez will join Vera Bradley Inc.’s eight other board members: Jackie Ardrey, CEO; Barbara Bradley Baekgaard, Co-Founder of Vera Bradley; Kristina Cashman, former Chief Financial Officer of P.F. Chang’s; Robert J. Hall, Chairman of the Vera Bradley Board of Directors and President of Green Gables Partners; Mary Lou Kelley, former President, E-Commerce for Best Buy; Frances P. Philip, Lead Independent Director of the Vera Bradley Board of Directors and former Chief Merchandising Officer of L.L. Bean, Inc.; Carrie Tharp, Vice President of Strategic Industries for Google Cloud; and recently appointed member Bradley Weston, former Chief Executive Officer of Party City Holdings, Inc.
About Vera Bradley, Inc. Vera Bradley, Inc. operates two unique lifestyle brands – Vera Bradley and Pura Vida. Vera Bradley and Pura Vida are complementary businesses, both with devoted, emotionally-connected, and multi-generational female customer bases; alignment as casual, comfortable, affordable, and fun brands; positioning as “gifting” and socially-connected brands; strong, entrepreneurial cultures; a keen focus on community, charity, and social consciousness; multi-channel distribution strategies; and talented leadership teams aligned and committed to the long-term success of their brands.
Vera Bradley, based in Fort Wayne, Indiana, is a leading designer of women’s handbags, luggage and other travel items, fashion and home accessories, and unique gifts. Founded in 1982 by friends Barbara Bradley Baekgaard and Patricia R. Miller, the brand is known for its innovative designs, iconic patterns, and brilliant colors that inspire and connect women unlike any other brand in the global marketplace.
In July 2019, Vera Bradley, Inc. acquired a 75% interest in Creative Genius, Inc., which also operates under the name Pura Vida Bracelets (“Pura Vida”). Pura Vida, based in La Jolla, California, is a digitally native, highly-engaging lifestyle brand founded in 2010 by friends Paul Goodman and Griffin Thall. Pura Vida has a differentiated and expanding offering of bracelets, jewelry, and other lifestyle accessories. The Company acquired the remaining 25% of Pura Vida in January 2023.
The Company has three reportable segments: Vera Bradley Direct (“VB Direct”), Vera Bradley Indirect (“VB Indirect”), and Pura Vida. The VB Direct business consists of sales of Vera Bradley products through Vera Bradley Full-Line and Factory Outlet stores in the United States, www.verabradley.com, Vera Bradley’s online outlet site, and the Vera Bradley annual outlet sale in Fort Wayne, Indiana. The VB Indirect business consists of sales of Vera Bradley products to approximately 1,600 specialty retail locations throughout the United States, as well as select department stores, national accounts, third party e-commerce sites, and third-party inventory liquidators, and royalties recognized through licensing agreements related to the Vera Bradley brand. The Pura Vida segment consists of sales of Pura Vida products through the Pura Vida websites, www.puravidabracelets.com, www.puravidabracelets.ca, and www.puravidabracelets.eu; through the distribution of its products to wholesale retailers and department stores; and through its Pura Vida retail stores.
Vera Bradley Safe Harbor Statement Certain statements in this release are “forward-looking statements” made pursuant to the safe-harbor provisions of the Private Securities Litigation Reform Act of 1995. Such forward-looking statements reflect the Company’s current expectations or beliefs concerning future events and are subject to various risks and uncertainties that may cause actual results to differ materially from those that we expected, including: possible adverse changes in general economic conditions and their impact on consumer confidence and spending; possible inability to predict and respond in a timely manner to changes in consumer demand; possible loss of key management or design associates or inability to attract and retain the talent required for our business; possible inability to maintain and enhance our brands; possible inability to successfully implement the Company’s long-term strategic plans; possible inability to successfully open new stores, close targeted stores, and/or operate current stores as planned; incremental tariffs or adverse changes in the cost of raw materials and labor used to manufacture our products; possible adverse effects resulting from a significant disruption in our distribution facilities; or business disruption caused by pandemics. More information on potential factors that could affect the Company’s financial results is included from time to time in the “Risk Factors” and “Management’s Discussion and Analysis of Financial Condition and Results of Operations” sections of the Company’s public reports filed with the SEC, including the Company’s Form 10-K for the fiscal year ended January 28, 2023. We undertake no obligation to publicly update or revise any forward-looking statement.
Arkhouse Management and Brigade Capital Management Extend a $5.8 Billion Lifeline to Struggling Macy’s Inc.
In a bold move to rescue the iconic retailer, Arkhouse Management and Brigade Capital Management have proposed a buyout offer of $5.8 billion for Macy’s Inc. This strategic move comes at a time when Macy’s has faced a challenging year, with slumping sales and increasing competition from online retailers.
The buyout offer values Macy’s at $21 per share, a significant premium compared to its recent close at just over $17 per share. Macy’s shares closed at a little over $17 on Friday, representing a 17% decline since the beginning of the year. However, the market responded positively to the news, with a 15% increase in premarket trading on Monday.
Despite the retailer’s efforts to revitalize its brick-and-mortar stores, Macy’s sales have seen a 7% year-over-year decline in the third quarter. The struggle against online competitors and changing consumer preferences has made Macy’s an attractive acquisition target for Arkhouse and Brigade.
Arkhouse, primarily focused on real estate investment, and Brigade Capital, an asset management firm, have expressed their willingness to consider a higher bid after conducting due diligence on Macy’s. This signals their confidence in the potential for a successful turnaround.
Macy’s, with 722 store locations across 43 states, Washington, DC, Puerto Rico, and Guam, has faced challenges for decades. The rise of online giants like Amazon and the dominance of big-box retailers such as Walmart and Target have eroded Macy’s market share. The company’s annual profit and sales forecast was revised in June after a slowdown in customer demand, prompting a candid acknowledgment from Macy’s CEO Jeff Gennette.
“The US consumer, particularly at Macy’s, pulled back more than we anticipated,” Gennette stated on an earnings call. Customers “reallocated” spending to food, essentials, and services, he added.
This acquisition bid follows a similar trend in the retail sector, as evidenced by Kohl’s facing takeover offers in 2022. The challenging economic landscape, marked by volatile interest rates and high inflation, has affected retailers across the board. While online spending proved robust during Black Friday and Cyber Monday, uncertainties remain about the strength of the holiday season, especially after several retailers issued cautious fourth-quarter outlooks.
As Macy’s evaluates the proposal, the retail landscape awaits the potential transformation that Arkhouse Management and Brigade Capital Management could bring to this iconic brand.
BOCA RATON, Fla.–(BUSINESS WIRE)–Nov. 29, 2023– The ODP Corporation (“ODP,” or the “Company”) (NASDAQ:ODP), a leading provider of business services, products and digital workplace technology solutions to businesses and consumers, announced today that D. Anthony Scaglione, executive vice president and chief financial officer, and Tim Perrott, vice president of investor relations and treasurer, will present at the Noble Capital Markets’ Nineteenth Annual Emerging Growth Equity Conference on December 4th, 2023 at approximately 3:00 pm (ET).
A replay of the presentation will be available the following day on the Company’s investor relations website, investor.theodpcorp.com.
About The ODP Corporation The ODP Corporation (NASDAQ:ODP) is a leading provider of products, services, and technology solutions through an integrated business-to-business (B2B) distribution platform and omni-channel presence, which includes world-class supply chain and distribution operations, dedicated sales professionals, a B2B digital procurement solution, online presence, and a network of Office Depot and OfficeMax retail stores. Through its operating companies Office Depot, LLC; ODP Business Solutions, LLC; Veyer, LLC; and Varis, Inc., The ODP Corporation empowers every business, professional, and consumer to achieve more every day. For more information, visit theodpcorp.com.
Chinese fast fashion juggernaut Shein has filed confidentially for an initial public offering in the U.S., positioning itself to become one of the most highly-anticipated public debuts. As Shein aims to expand its global empire and enormous valuation, the company will need to convince investors it can overcome mounting controversies.
Currently privately held with an estimated $66 billion valuation, Shein is seeking to capitalize on surging investor appetite for ecommerce platforms. By targeting Gen Z and millennial shoppers with on-trend fast fashion at rock-bottom prices, Shein has experienced explosive growth. The company could start trading publicly in the U.S. as early as 2024 if it gains regulatory approval.
Shein Hopes to Captivate Ecommerce Investors
As a digital-only retailer with minimal storefronts, Shein epitomizes many of today’s leading ecommerce firms. With targeted influencer marketing and constantly updated inventory, Shein has won over young consumers across the globe. Revenues reached nearly $16 billion in 2021, making Shein one of the largest fashion retailers based on sales.
This rapid ascent has drawn comparisons to platforms like Pinduoduo and Meituan in China. Shein hopes investors will value it similarly and overlook the controversies it has battled along the way. Skeptics, however, point to lingering risks that could limit Shein’s appeal.
Mounting Concerns Create Obstacles for Shein’s IPO
While Shein has taken steps to revamp public perception, the company faces no shortage of detractors. Lawmakers across the political spectrum have raised alarms over Shein’s supply chain and environmental harms.
Accused of using labor from China’s Xinjiang region linked to human rights abuses, Shein must convince regulators it complies with ethical sourcing standards. The shadowy leadership of founder and CEO Sky Xu also clashes with typical corporate governance. As other Chinese firms face heightened scrutiny and even delisting threats in the U.S., Shein’s close China ties could hamper its reception.
Alongside these issues, fast fashion business models face growing backlash for fueling waste and pollution. Though unlikely to vanish overnight, changing consumer preferences add uncertainty to the sector’s outlook.
Betting on Shein’s Growth Trajectory While risks abound, Shein’s blockbuster financials may simply be too impressive for investors to ignore. Early in its life as a public firm, revenue expansion and user growth will remain the key metrics to watch.
As a veteran of the ultra-fast fashion space, Shein has proven adept at riding waves of consumer demand. The recent downturn for stocks like Farfetch and Revolve point to lingering appetite for digital fashion platforms. Though controversies cast a shadow, for risk-tolerant investors, getting in early with Shein could bring substantial rewards.
Black Friday 2023 is officially here, kicking off the year’s biggest shopping weekend both online and in stores. Early indicators suggest consumers are hungry for deals, with e-commerce sales on Thanksgiving Day jumping 5.5% year-over-year to $5.6 billion according to Adobe Analytics.
The robust online sales activity on Turkey Day comes ahead of an expected $9.6 billion in Cyber Monday revenue, a 5.7% increase from last year. While these growth figures represent a slowdown from the blistering pace set during the pandemic, they highlight that holiday shoppers are still responding to discounts even amidst broader economic uncertainty.
This sets the stage for a pivotal Black Friday that may determine whether projections for up to 4% gains in total holiday sales materialize. Shoppers are expected to turn out in force to scoop up deals on popular items like toys, apparel, jewelry, and consumer tech that were top sellers online on Thanksgiving.
Mobile Shopping Surge Drives Online Revenue
Fueling the growth in Thanksgiving e-commerce sales is the continued surge in smartphone shopping. A record 59% of online revenue came from mobile devices as people browsed and bought gifts on the go. With mobile penetration rising every year, retailers have adapted their sites and apps to make it easier for iPhone and Android users to capitalize on promotions.
Savvy shoppers are discovering they can beat crowds and inventory shortages by taking advantage of online-only deals as well as ordering online and picking up in store. Retailers are encouraging this omnichannel behavior by making curbside pickup fast and frictionless. The convenience of mobile ordering combined with flexible fulfillment options underlies the shift towards more Thanksgiving and Black Friday spending happening digitally.
Top Deals Entice Consumers
Despite economic pressures from inflation and higher interest rates, consumers have shown a willingness to spend when the price is right. Adobe tracked toys discounted up to 28%, electronics up to 27% off, and computers 22% off on Thanksgiving, leading to triple-digit surge in those categories versus October.
Amazon and Target rolled out additional Black Friday toy deals with major markdowns on Barbie dream campers, Marvel action figures, and Nintendo Switch gaming bundles expected to rank among the most popular purchases.
Similarly, doors opening early at retailers like Best Buy, Walmart, and Apple will likely attract shoppers chasing deals on big-screen TVs, Bluetooth speakers, tablets, and the hot new Airpods Pro 2 earbuds. Though buying conditions are tougher this year, bargain hunters still prioritize snagging discounted must-have gifts for loved ones.
What’s at Stake for Retailers
While Thanksgiving and Black Friday don’t determine overall holiday fortunes, they set the tone for retailers during the critical year-end sales period. Those who miss targets this weekend play catch-up and may have to result to profit-busting promotions to move stagnant inventory later in December.
However, retailers who excite shoppers out the gates with alluring deals and experiences create positive momentum they can ride into the New Year. The outperformance of those players better able to adapt to the mobile and omnichannel-centric future of holiday shopping will be on full display this weekend.
For consumers, the state of Black Friday offers clues into buying conditions for the next month as they weigh completing wish lists amidst budget realities. With early reads tilting positive, cautious optimism seems warranted – though restraint may still pay off waiting to see if deals sweeten further in December.
One thing is certain: all eyes turn to how activity plays out on the unofficial start to the holiday sales season. Black Friday retains symbolic importance for retailers and consumers alike – so expect the 2023 version to again provide intrigue and insights into the health of the US consumer.
NEW YORK, Nov. 13, 2023 (GLOBE NEWSWIRE) — Xcel Brands, Inc. (NASDAQ: XELB) (“Xcel” or the “Company”), a media and consumer products company with billions of dollars in retail sales generated by its brands through social commerce and live-stream shopping, today announced a new licensing agreement with ALPHA OES, a provider of eCommerce services and strategies for brands. Under the terms of the licensing agreement, ALPHA OES will take over the day-to-day operations for Xcel’s Longaberger eCommerce business.
“We’re excited to partner with ALPHA OES on the Longaberger brand,” said Robert W. D’Loren, Chairman and CEO of Xcel Brands. “Since we acquired Longaberger in 2019, we’ve been able to evolve the business from a direct sales company into a social commerce marketplace for home products featuring Longaberger’s American made baskets. We believe that partnering with ALPHA OES, who is an expert in investing in and driving profitable growth eCommerce businesses that show strong brand affinity will help us continue to grow the Longaberger brand and business.”
“Longaberger is an American heritage brand with a strong consumer following and unique positioning in the market,” said Charles Mertz, CEO of ALPHA OES. “We’re thrilled to partner with Xcel to continue to build Longaberger’s eCommerce business and build upon the reputation and brand positioning that Longaberger enjoys and Xcel has invested in over the past several years. We’re also excited to work with Xcel on bringing Longaberger onto their social commerce marketplace, which we believe has the potential to reinvent customer acquisition of eCommerce brands that have a highly engaged audience through social commerce.”
Under the new agreement, ALPHA OES will take over day-to-day management of Longaberger’s eCommerce business under a license with Longaberger Licensing, a subsidiary of Xcel. Xcel will continue to build out its social commerce and short form video technology and plans to transition the Longaberger stylists onto its new platform by year-end. Xcel continues to strategically invest in social commerce technology platforms and partnerships that enable it to connect brands directly with consumers through short-form and live-stream video content.
About Xcel Brands
Xcel Brands, Inc. (NASDAQ: XELB) is a media and consumer products company engaged in the design, production, marketing, livestreaming, wholesale distribution and direct-to-consumer sales of branded apparel, footwear, accessories, fine jewelry, home goods and other consumer products, and the acquisition of dynamic consumer lifestyle brands. Xcel was founded in 2011 with a vision to reimagine shopping, entertainment and social media as one thing. Xcel owns the Judith Ripka, Halston, LOGO by Lori Goldstein, and C. Wonder brands and a minority stake in the Isaac Mizrahi brand. It also owns and manages the Longaberger brand through its controlling interest in Longaberger Licensing LLC. Xcel is pioneering a true omni-channel sales strategy that includes the promotion and sale of products under its brands through interactive television, digital livestream shopping, social commerce, brick-and-mortar retail and e-commerce channels. The company’s brands have generated in excess of $4 billion in retail sales via livestreaming in interactive television and digital channels alone.
Headquartered in New York City, Xcel Brands is led by an executive team with significant livestreaming, production, merchandising, design, marketing, retailing and licensing experience and has a proven track record of success in elevating branded consumer products companies. With an experienced team of professionals focused on design, production and digital marketing, Xcel maintains control of product quality and promotion across all of its product categories and distribution channels. Xcel differentiates by design. www.xcelbrands.com
About ALPHA OES
ALPHA OES, a premier Outsourced eCommerce Solutions company, forms strategic partnerships with leading brands to maximize digital commerce and revolutionize direct-to-consumer (DTC) engagement. Leveraging proprietary FoxLogic performance marketing strategies, ALPHA OES drives sustainable revenue and contribution margin growth while supercharging a brand’s digital presence. The comprehensive suite of eCommerce services developed by ALPHA OES is customized to serve unique brand needs while scaling for continuous growth.
Low-Cost Business Model and Disciplined Capital Allocation Drive Solid Operating Performance and Strong EPS Growth
Third Quarter Revenue of $2 Billion with GAAP EPS of $1.79; Adjusted EPS of $1.88
GAAP Operating Income of $91 Million; GAAP Net Income of $70 Million; Adjusted EBITDA of $125 Million
Repurchased $32 Million of Shares in the Third Quarter of 2023
Updates Full-Year 2023 Guidance
BOCA RATON, Fla.–(BUSINESS WIRE)–Nov. 8, 2023– The ODP Corporation (“ODP,” or the “Company”) (NASDAQ:ODP), a leading provider of products, services, and technology solutions to businesses and consumers, today announced results for the third quarter ended September 30, 2023.
Consolidated (in millions, except per share amounts)
3Q23
3Q22
YTD23
YTD22
Selected GAAP and Non-GAAP measures:
Sales
$2,009
$2,172
$6,025
$6,385
Sales change from prior year period
(8)%
(6)%
Operating income
$91
$84
$232
$188
Adjusted operating income (1)
$95
$95
$247
$238
Net income from continuing operations
$70
$67
$176
$142
Diluted earnings per share from continuing operations
$1.79
$1.36
$4.38
$2.84
Adjusted net income from continuing operations (1)
$73
$73
$187
$177
Adjusted earnings per share from continuing operations (fully diluted) (1)
$1.88
$1.48
$4.66
$3.54
Adjusted EBITDA (1)
$125
$131
$342
$347
Operating Cash Flow from continuing operations
$112
$163
$261
$79
Free Cash Flow (2)
$86
$138
$183
$11
Adjusted Free Cash Flow (3)
$89
$160
$192
$54
Third Quarter 2023 Summary(1)(2)(3)
Total reported sales of $2.0 billion, down 8% versus the prior year, primarily due to lower sales in its Office Depot consumer division, largely driven by 71 fewer retail locations in service compared to the prior year, as well as lower retail and online consumer traffic and transactions
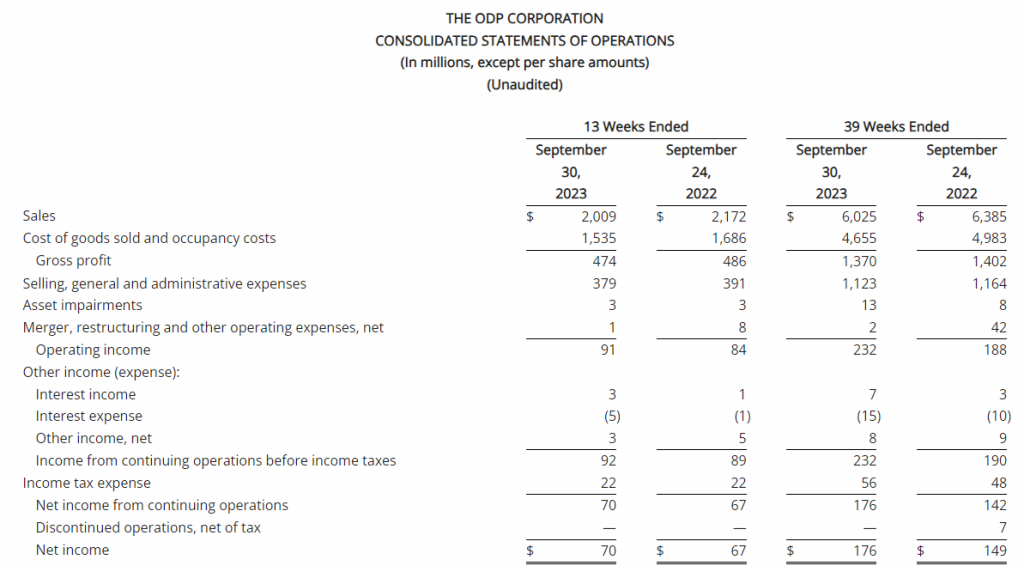
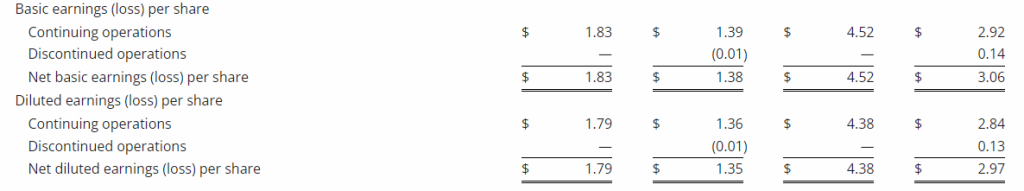
GAAP operating income of $91 million and net income from continuing operations of $70 million, or $1.79 per diluted share, versus $84 million and $67 million, respectively, or $1.36 per diluted share, in the prior year
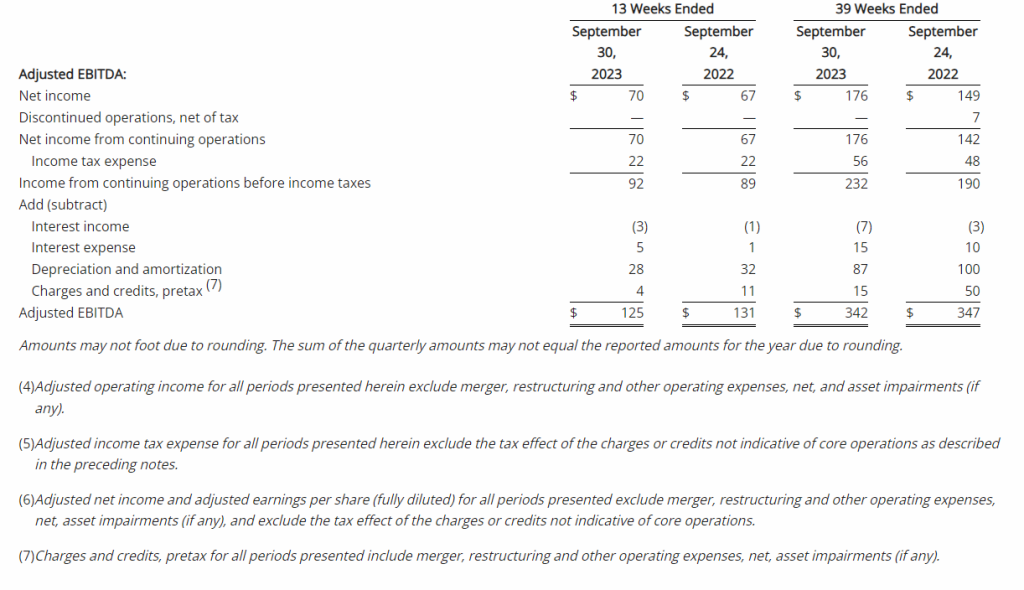
Adjusted operating income of $95 million, flat compared to the third quarter of 2022; adjusted EBITDA of $125 million, compared to $131 million in the third quarter of 2022
Adjusted net income from continuing operations of $73 million, or adjusted diluted earnings per share from continuing operations of $1.88, versus $73 million or $1.48, respectively, in the prior year
Operating cash flow from continuing operations of $112 million and adjusted free cash flow of $89 million, versus $163 million and $160 million, respectively, in the prior year
Repurchased 659 thousand shares at a cost of $32 million in the third quarter of 2023
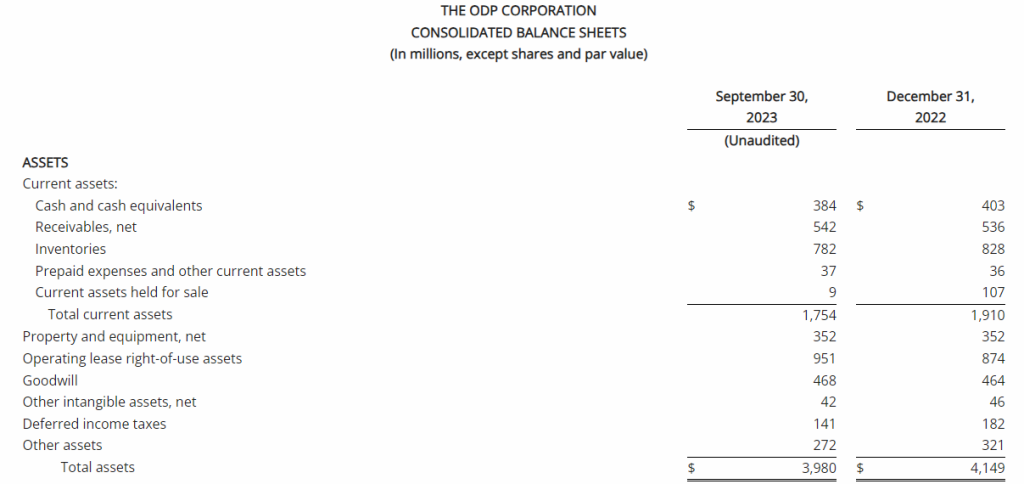
$1.2 billion of total available liquidity including $384 million in cash and cash equivalents at quarter end
“I am extremely impressed seeing the day-to-day commitment and exceptional execution from our team as I fulfill Chief Executive Officer Gerry Smith’s responsibilities while he is on medical leave,” said Joseph Vassalluzzo, ODP’s chairman of the board. “In the quarter, our team delivered strong operating income and earnings per share results against a challenging economic backdrop, reflecting our unwavering commitment to operational excellence and to our low-cost business model approach.
“We continue to make progress across our four business units as we execute our three horizons strategy. This included expanding margins at ODP Business Solutions, new product testing and category expansion at Office Depot, securing new third-party customers at Veyer while remaining on track to more than double third-party EBITDA this year, and enhancing our platform and customer engagement at Varis.
“Our shareholder value creation formula, which integrates operational excellence with a shareholder-focused capital allocation plan, including the repurchase of approximately $32 million of shares during the quarter, contributed to a meaningful year-over-year increase in adjusted earnings per share for the third quarter and revised upward EPS guidance for the full year,” Vassalluzzo added.
“As we look ahead, we anticipate the macroeconomic environment to remain challenging throughout the remainder of the year. However, we are confident in our position of strength and will continue to focus on driving value for shareholders through our low-cost business model, leveraging our multiple routes to market, and continuing with our disciplined capital allocation,” Vassalluzzo concluded.
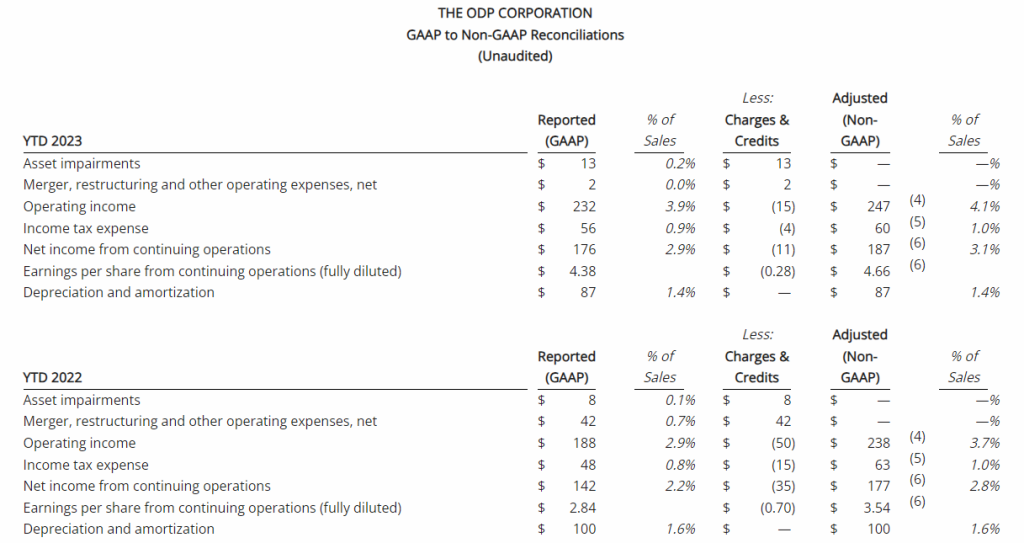
Consolidated Results
Reported (GAAP) Results
Total reported sales for the third quarter of 2023 were $2 billion, a decrease of 8% compared with the same period last year. This was driven primarily by lower sales in its consumer division, Office Depot, primarily due to 71 fewer stores in service compared to last year related to planned store closures, as well as lower retail and online consumer traffic. Sales at ODP Business Solutions Division were down slightly compared to last year, largely driven by slower return to office trends and lower sales of technology products. Meanwhile, Veyer provided strong logistics support for the ODP Business Solutions and Office Depot Divisions, and continued to capture additional demand for its supply chain and procurement solutions among other third-party customers.
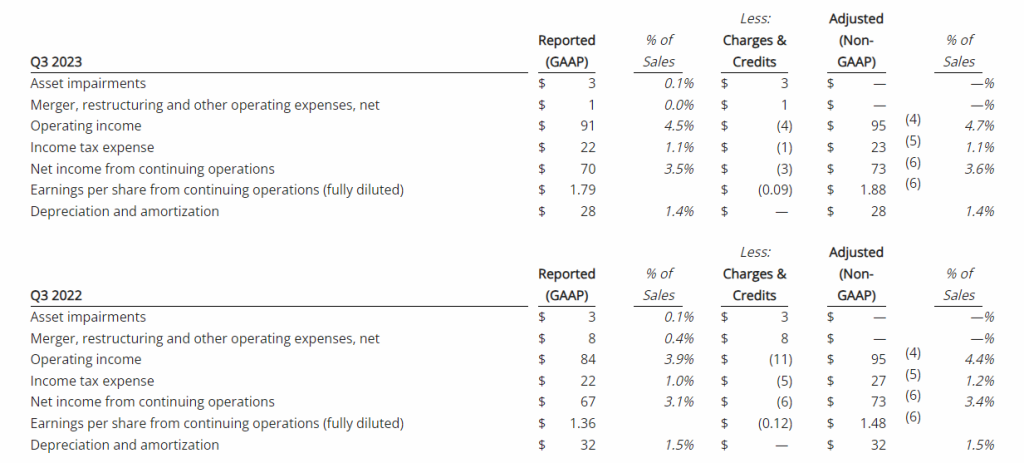
The Company reported operating income of $91 million in the third quarter of 2023, up 8% compared to operating income of $84 million in the prior year period. Operating results in the third quarter of 2023 included $4 million of charges. These charges consisted primarily of $3 million associated with non-cash asset impairments largely related to the operating lease right-of-use (ROU) assets associated with the Company’s retail store locations. Net income from continuing operations was $70 million, or $1.79 per diluted share in the third quarter of 2023, up from $67 million, or $1.36 per diluted share in the third quarter of 2022.
Adjusted (non-GAAP) Results(1)
Adjusted results for the third quarter of 2023 exclude charges and credits totaling $4 million as described above and the associated tax impacts.
Third quarter of 2023 adjusted EBITDA was $125 million compared to $131 million in the prior year period. This included depreciation and amortization of $28 million and $32 million in the third quarters of 2023 and 2022, respectively
Third quarter of 2023 adjusted operating income was $95 million, flat compared to the third quarter of 2022
Third quarter of 2023 adjusted net income from continuing operations was $73 million, or $1.88 per diluted share, compared to $73 million, or $1.48 per diluted share, in the third quarter of 2022, an increase of 27% on a per share basis
Division Results
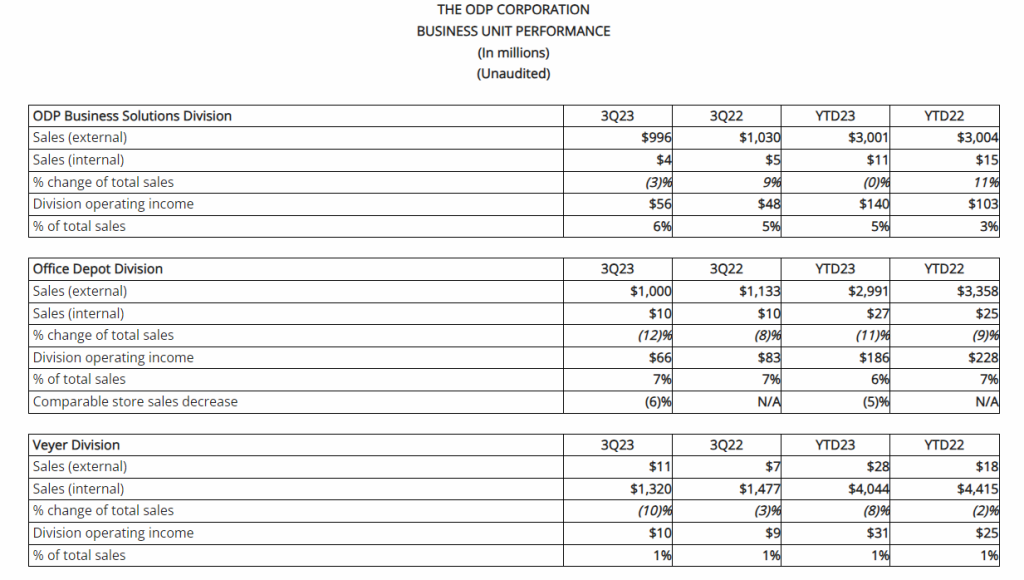
ODP Business Solutions Division
Leading B2B distribution solutions provider serving small, medium and enterprise level companies with an annual trailing-twelve-month revenue in excess of $4 billion
Reported sales were $1.0 billion in the third quarter of 2023, down approximately 3% compared to the same period last year primarily related to lower sales of technology products and weaker macroeconomic conditions
Stronger sales in cleaning and breakroom supplies were more than offset by lower sales of technology and core supplies
Total adjacency category sales, including cleaning and breakroom, furniture, technology, and copy and print, were 44% of total ODP Business Solutions’ sales
Continued strong pipeline and net new business customer additions
Operating income was $56 million in the third quarter of 2023, up 17% over the same period last year, related primarily to higher gross margins. As a percentage of sales, operating income margin was 6%, up 90 basis points compared to the same period last year
Office Depot Division
Leading provider of retail consumer and small business products and services distributed via Office Depot and OfficeMax retail locations and an award-winning eCommerce presence
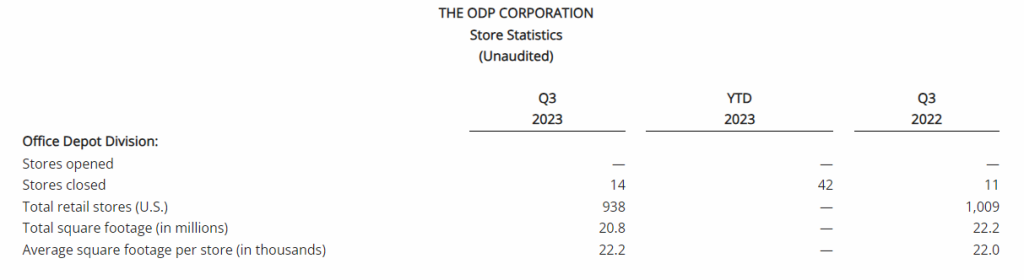
Reported sales were $1.0 billion in the third quarter of 2023, down 12% compared to the prior year period partially due to 71 fewer retail outlets in service associated with planned store closures, as well as lower demand relative to last year in certain product categories, softer back-to-school seasonal demand, and lower online sales. The Company closed 14 retail stores in the quarter and had 938 stores at quarter end. Sales were down approximately 6% on a comparable store basis
Stronger sales of copy and print services were more than offset by lower sales in supplies, technology, and other categories
Store and online traffic were lower year over year due to a greater percentage of customers having returned to the office post pandemic, as well as weaker macroeconomic activity
Operating income was $66 million in the third quarter of 2023, compared to operating income of $83 million during the same period last year, driven primarily by the flow through impact from lower sales. As a percentage of sales, operating income was 7%, flat compared to the same period last year.
Veyer Division
Veyer is a supply chain, distribution, procurement and global sourcing operation with over 35 years of experience and proven leadership, supporting Office Depot and ODP Business Solutions, as well as third-party customers. Veyer’s assets and capabilities include 8 million square feet of infrastructure through a nationwide network of distribution centers, cross-docks, and other facilities throughout the United States; a global sourcing presence in Asia; a large private fleet of vehicles; and next-day delivery to 98.5% of US population
In the third quarter of 2023, Veyer provided strong support for its internal customers, ODP Business Solutions and Office Depot, as well as for its third-party customers, generating sales of $1.3 billion
Operating income was $10 million in the third quarter of 2023, up from $9 million in the prior year period related to the favorable impacts of higher sales to external third parties and lower product costing
In the quarter relative to last year, sales and EBITDA generated from third party customers was up 57% and 119% respectively, resulting in sales of approximately $11 million and EBITDA of $3 million in the quarter
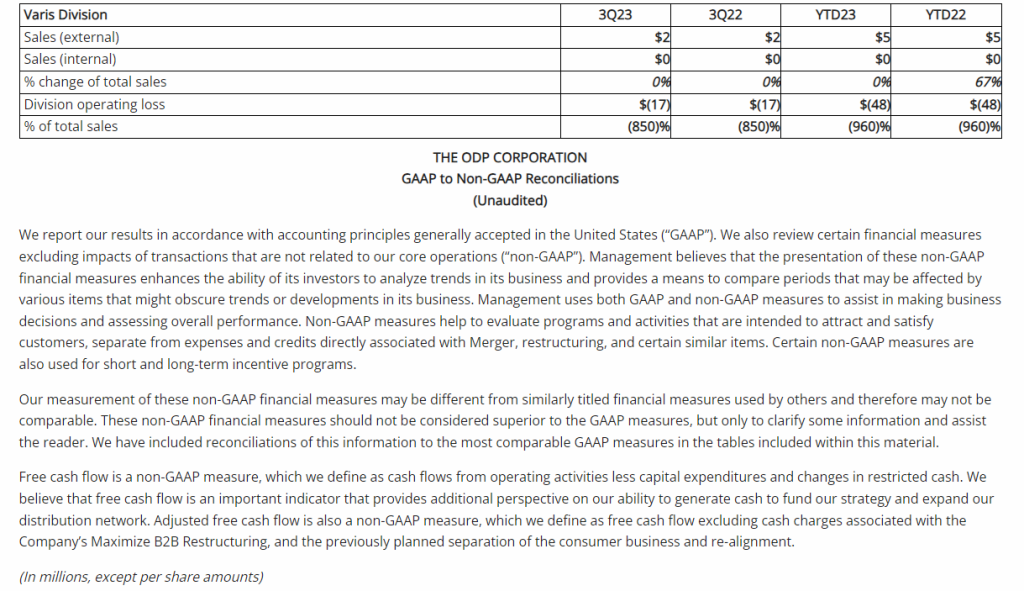
Varis Division
Varis is a tech-enabled B2B indirect procurement marketplace launched in the fourth quarter of 2022, which provides buyers and suppliers a seamless way to transact through the platform’s consumer-like buying experience and advanced spend management tools
Successfully launched the platform in the fourth quarter of 2022; adding and on-boarding new customers, incorporating feedback, and adding new features and capabilities to the platform
Varis generated revenues in the third quarter of 2023 of $2 million, flat compared to the third quarter of 2022
Operating loss was $17 million, flat compared to the third quarter of 2022, as the division continued to enhance its platform and onboard new customers
Share Repurchases
The Company continued to execute under its previously announced $1 billion share repurchase authorization, available through year-end 2025. During the third quarter of 2023, the Company repurchased 659 thousand shares at a cost of $32 million. Since the inception of the authorization beginning in November 2022, the Company has repurchased 9 million shares for approximately $420 million.
The number of shares to be repurchased in the future and the timing of such transactions will depend on a variety of factors, including market conditions, regulatory requirements, and other corporate considerations. The current authorization could be suspended or discontinued at any time as determined by the Board of Directors.
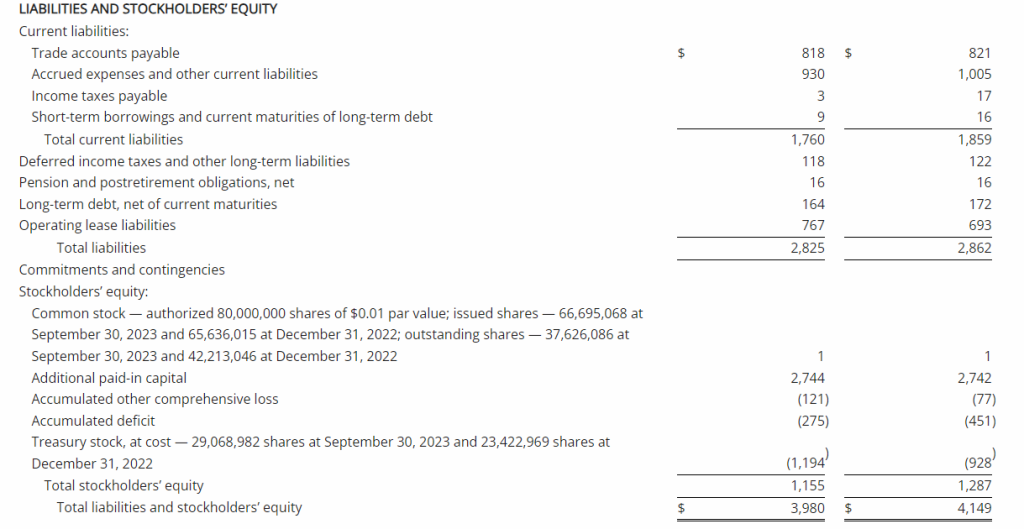
Balance Sheet and Cash Flow
As of September 30, 2023, ODP had total available liquidity of approximately $1.2 billion, consisting of $384 million in cash and cash equivalents and $771 million of available credit under the Third Amended Credit Agreement. Total debt was $173 million.
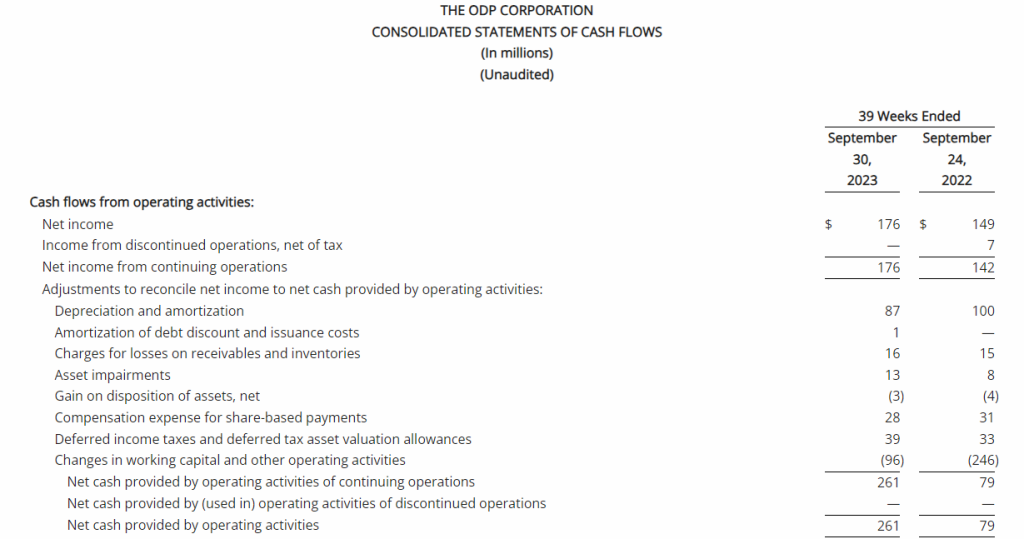
For the third quarter of 2023, cash generated by operating activities of continuing operations was $112 million, which included $3 million in restructuring and other spend, compared to cash provided by operating activities of continuing operations of $163 million in the third quarter of the prior year, which included $22 million in restructuring and other spend. The year-over-year change in operating cash flow is largely related to the timing of certain working capital items.
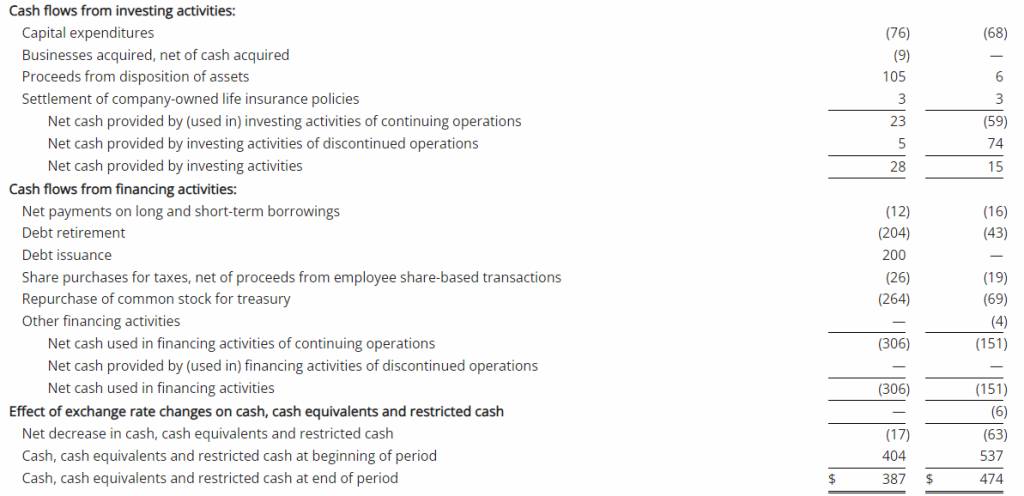
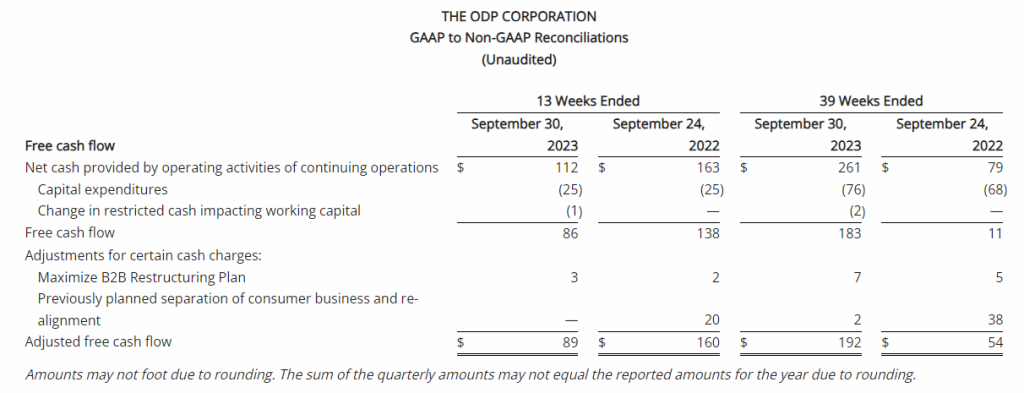
Capital expenditures in the third quarter of 2023 and 2022 were $25 million, reflecting continued growth investments in the Company’s digital transformation, distribution network, and eCommerce capabilities. Adjusted Free Cash Flow(3) was $89 million in the third quarter of 2023, compared to $160 million in the prior year period.
“I would like to recognize our entire team for their commitment and dedication in managing inventory and working capital, which has resulted in another quarter of strong cash flow generation,” said Anthony Scaglione, executive vice president and chief financial officer of The ODP Corporation. “As we work to close out the year, we maintain our disciplined approach, focusing on managing costs, maximizing cash flow, and executing our capital allocation plan,” Scaglione added.
Updated 2023 Expectations
“Our team’s unwavering commitment to delivering value is evident in our compelling customer proposition, strong free cash flow generation, and strategic capital allocation for the benefit of our shareholders,” highlighted Vassalluzzo. “While we acknowledge the influence of the challenging macroeconomic environment on consumer and business activity, we remain steadfast in our dedication to driving long-term value within our business through effective execution of our three horizons strategy.”
The Company’s full year guidance for 2023 included in this release includes non-GAAP measures, such as Adjusted EBITDA, Adjusted Operating Income, Adjusted Earnings per Share and Adjusted Free Cash Flow. These measures exclude charges or credits not indicative of core operations, which may include but not be limited to merger integration expenses, restructuring charges, acquisition-related costs, executive transition costs, asset impairments and other significant items that currently cannot be predicted without unreasonable efforts. The exact amount of these charges or credits are not currently determinable but may be significant. Accordingly, the Company is unable to provide equivalent GAAP measures or reconciliations from GAAP to non-GAAP for these financial measures without unreasonable effort.
The Company is updating its full year guidance for 2023 as follows:
Previous 2023 Guidance
Updated 2023 Guidance
Sales
Approximately $8 billion
Revised to $7.8 – $7.9 billion
Adjusted EBITDA
$400 – $430 million
Affirmed
Adjusted Operating Income
$270 – $300 million
Revised to $280 – $310 million
Adjusted Earnings per Share(*)
$5.00 – $5.30 per share
Revised to $5.30 – $5.60 per share
Adjusted Free Cash Flow(**)
$200 – $230 million
Affirmed
Capital Expenditures
$100 – $120 million
Affirmed
*Adjusted Earnings per Share (EPS) guidance for 2023 includes tax benefits related to R&D and employee-related tax credits and includes expected impact from share repurchases
**Adjusted Free Cash Flow is defined as cash flows from operating activities less capital expenditures excluding cash charges associated with the Company’s Maximize B2B Restructuring and expenses incurred in connection with our previously planned separation of the consumer business and re-alignment
“Our year-to-date performance speaks to the resilience of our team and the strength of our low-cost business model and capital allocation approach,” said Scaglione. “While the weaker macroeconomic conditions have impacted the level of consumer and business activity creating top-line headwinds, our continued focus on operational excellence has us well positioned to continue driving strong operating results as we close out the year. Our updated guidance assumes a consistent overall macroeconomic environment and reflects our year-to-date revenue trends, while increasing our outlook for adjusted operating income and adjusted EPS.
Our increased adjusted EPS outlook also assumes a lower full-year effective tax rate driven by the execution of certain tax credits, lower than anticipated interest expense associated with projected intra-quarter ABL borrowings, and the impact from our continued share buyback activity,” Scaglione added.
The ODP Corporation will webcast a call with financial analysts and investors on November 8, 2023, at 9:00 am Eastern Time, which will be accessible to the media and the general public. To listen to the conference call via webcast, please visit The ODP Corporation’s Investor Relations website at investor.theodpcorp.com. A replay of the webcast will be available approximately two hours following the event.
(1)
As presented throughout this release, adjusted results represent non-GAAP financial measures and exclude charges or credits not indicative of core operations and the tax effect of these items, which may include but not be limited to merger integration, restructuring, acquisition costs, and asset impairments. Reconciliations from GAAP to non-GAAP financial measures can be found in this release as well as on the Company’s Investor Relations website at investor.theodpcorp.com.
(2)
As used in this release, Free Cash Flow is defined as cash flows from operating activities less capital expenditures. Free Cash Flow is a non-GAAP financial measure and reconciliations from GAAP financial measures can be found in this release as well as on the Company’s Investor Relations website at investor.theodpcorp.com.
(3)
As used in this release, Adjusted Free Cash Flow is defined as Free Cash Flow excluding cash charges associated with the Company’s Maximize B2B Restructuring, and expenses incurred in connection with our previously planned separation of the consumer business and re-alignment. Adjusted Free Cash Flow is a non-GAAP financial measure and reconciliations from GAAP financial measures can be found in this release as well as on the Company’s Investor Relations website at investor.theodpcorp.com.
About The ODP Corporation
The ODP Corporation (NASDAQ:ODP) is a leading provider of products, services, and technology solutions through an integrated business-to-business (B2B) distribution platform and omni-channel presence, which includes supply chain and distribution operations, dedicated sales professionals, a B2B digital procurement solution, online presence, and a network of Office Depot and OfficeMax retail stores. Through its operating companies ODP Business Solutions, LLC; Office Depot, LLC; Veyer, LLC; and Varis, Inc, The ODP Corporation empowers every business, professional, and consumer to achieve more every day. For more information, visit theodpcorp.com.
This communication may contain forward-looking statements within the meaning of the Private Securities Litigation Reform Act of 1995. These statements or disclosures may discuss goals, intentions and expectations as to future trends, plans, events, results of operations, cash flow or financial condition, the potential impacts on our business due to the unknown severity and duration of the COVID-19 pandemic, or state other information relating to, among other things, the Company, based on current beliefs and assumptions made by, and information currently available to, management. Forward-looking statements generally will be accompanied by words such as “anticipate,” “believe,” “plan,” “could,” “estimate,” “expect,” “forecast,” “guidance,” “expectations”, “outlook,” “intend,” “may,” “possible,” “potential,” “predict,” “project,” “propose” or other similar words, phrases or expressions, or other variations of such words. These forward-looking statements are subject to various risks and uncertainties, many of which are outside of the Company’s control. There can be no assurances that the Company will realize these expectations or that these beliefs will prove correct, and therefore investors and stakeholders should not place undue reliance on such statements.
Factors that could cause actual results to differ materially from those in the forward-looking statements include, among other things, highly competitive office products market and failure to differentiate the Company from other office supply resellers or respond to decline in general office supplies sales or to shifting consumer demands; competitive pressures on the Company’s sales and pricing; the risk that the Company is unable to transform the business into a service-driven, B2B platform that such a strategy will not result in the benefits anticipated; the risk that the Company will not be able to achieve the expected benefits of its strategic plans, including its strategic shift to maintain all of its businesses under common ownership; the risk that the Company may not be able to realize the anticipated benefits of acquisitions due to unforeseen liabilities, future capital expenditures, expenses, indebtedness and the unanticipated loss of key customers or the inability to achieve expected revenues, synergies, cost savings or financial performance; the risk that the Company is unable to successfully maintain a relevant omni-channel experience for its customers; the risk that the Company is unable to execute the Maximize B2B Restructuring Plan successfully or that such plan will not result in the benefits anticipated; failure to effectively manage the Company’s real estate portfolio; loss of business with government entities, purchasing consortiums, and sole- or limited-source distribution arrangements; failure to attract and retain qualified personnel, including employees in stores, service centers, distribution centers, field and corporate offices and executive management, and the inability to keep supply of skills and resources in balance with customer demand; failure to execute effective advertising efforts and maintain the Company’s reputation and brand at a high level; disruptions in computer systems, including delivery of technology services; breach of information technology systems affecting reputation, business partner and customer relationships and operations and resulting in high costs and lost revenue; unanticipated downturns in business relationships with customers or terms with the suppliers, third-party vendors and business partners; disruption of global sourcing activities, evolving foreign trade policy (including tariffs imposed on certain foreign made goods); exclusive Office Depot branded products are subject to additional product, supply chain and legal risks; product safety and quality concerns of manufacturers’ branded products and services and Office Depot private branded products; covenants in the credit facility; general disruption in the credit markets; incurrence of significant impairment charges; retained responsibility for liabilities of acquired companies; fluctuation in quarterly operating results due to seasonality of the Company’s business; changes in tax laws in jurisdictions where the Company operates; increases in wage and benefit costs and changes in labor regulations; changes in the regulatory environment, legal compliance risks and violations of the U.S. Foreign Corrupt Practices Act and other worldwide anti-bribery laws; volatility in the Company’s common stock price; changes in or the elimination of the payment of cash dividends on Company common stock; macroeconomic conditions such as higher interest rates and future declines in business or consumer spending; increases in fuel and other commodity prices and the cost of material, energy and other production costs, or unexpected costs that cannot be recouped in product pricing; unexpected claims, charges, litigation, dispute resolutions or settlement expenses; catastrophic events, including the impact of weather events on the Company’s business; the discouragement of lawsuits by shareholders against the Company and its directors and officers as a result of the exclusive forum selection of the Court of Chancery, the federal district court for the District of Delaware or other Delaware state courts by the Company as the sole and exclusive forum for such lawsuits; and the impact of the COVID-19 pandemic on the Company’s business. The foregoing list of factors is not exhaustive. Investors and shareholders should carefully consider the foregoing factors and the other risks and uncertainties described in the Company’s Annual Reports on Form 10-K, Quarterly Reports on Form 10-Q, and Current Reports on Form 8-K filed with the U.S. Securities and Exchange Commission. The Company does not assume any obligation to update or revise any forward-looking statements.
FORT WAYNE, Ind., Nov. 01, 2023 (GLOBE NEWSWIRE) — Vera Bradley, Inc. (Nasdaq: VRA) (the “Company”) today announced that it plans to report results for the third quarter ended October 28, 2023 at 8:00 a.m. Eastern Time on Wednesday, December 6, 2023.
The Company will host a conference call to discuss its financial results at 9:30 a.m. Eastern Time that same day. A live webcast of the conference call will be available on the Investor Relations section of the Company’s website, www.verabradley.com. Alternatively, interested parties may dial into the call at (888) 204-4368, and enter the access code 7089328. A replay will be available shortly after the conclusion of the call and remain available through December 20, 2023. To access the recording, listeners should dial (844) 512-2921, and enter the access code 7089328.
ABOUT VERA BRADLEY, INC.
Vera Bradley, Inc. operates two unique lifestyle brands – Vera Bradley and Pura Vida. Vera Bradley and Pura Vida are complementary businesses, both with devoted, emotionally connected, and multi-generational female customer bases; alignment as causal, comfortable, affordable, and fun brands; positioning as “gifting” and socially-connected brands; strong, entrepreneurial cultures; a keen focus on community, charity, and social consciousness; multi-channel distribution strategies; and talented leadership teams aligned and committed to the long-term success of their brands.
Vera Bradley, based in Fort Wayne, Indiana, is a leading designer of women’s handbags, luggage and other travel items, fashion and home accessories, and unique gifts. Founded in 1982 by friends Barbara Bradley Baekgaard and Patricia R. Miller, the brand is known for its innovative designs, iconic patterns, and brilliant colors that inspire and connect women unlike any other brand in the global marketplace.
In July 2019, Vera Bradley, Inc. acquired a 75% interest in Creative Genius, Inc., which also operates under the name Pura Vida Bracelets (“Pura Vida”). Pura Vida, based in La Jolla, California, is a digitally native, highly engaging lifestyle brand founded in 2010 by friends Paul Goodman and Griffin Thall. Pura Vida has a differentiated and expanding offering of bracelets, jewelry, and other lifestyle accessories. The Company acquired the remaining 25% of Pura Vida in January 2023.
LAKE ZURICH, Ill.–(BUSINESS WIRE)– ACCO Brands Corporation (NYSE: ACCO) today announced that its board of directors has declared a quarterly cash dividend of $0.075 per share. The dividend will be paid on December 6, 2023, to stockholders of record as of the close of business on November 15, 2023.
“This is the Company’s 24th quarterly cash dividend since it began paying dividends in 2018. The Company’s dividend has become an important part of our capital allocation strategy and we remain committed to supporting our quarterly dividend with our robust free cash flow. At the current stock price, on an annualized basis, our shareholders are receiving an almost 6% yield on their investment,” said Tom Tedford, President and Chief Executive Officer of ACCO Brands.
About ACCO Brands Corporation
ACCO Brands, the Home of Great Brands Built by Great People, designs, manufactures and markets consumer and end-user products that help people work, learn, play and thrive. Our widely recognized brands include AT-A-GLANCE®, Five Star®, Kensington®, Leitz®, Mead®, PowerA®, Swingline®, Tilibra® and many others. More information about ACCO Brands Corporation (NYSE: ACCO) can be found at www.accobrands.com.
LAKE ZURICH, Ill.–(BUSINESS WIRE)– ACCO Brands Corporation (NYSE: ACCO) today announced that it will release its third quarter 2023 earnings after the market close on November 2, 2023. The Company will host a conference call and webcast to discuss the results on November 3 at 8:30 a.m. ET. The webcast can be accessed through the Investor Relations section of www.accobrands.com and will be available for replay.
About ACCO Brands Corporation
ACCO Brands, the Home of Great Brands Built by Great People, designs, manufactures and markets consumer and end-user products that help people work, learn, play and thrive. Our widely recognized brands include AT-A-GLANCE®, Five Star®, Kensington®, Leitz®, Mead®, PowerA®, Swingline®, Tilibra® and many others. More information about ACCO Brands Corporation (NYSE: ACCO) can be found at www.accobrands.com.
Christopher McGinnis Investor Relations (847) 796-4320
The US housing market continues to show signs of a significant downturn, with existing home sales in September dropping to the slowest pace since October 2010. This marks a 15.4% decline compared to September 2022, according to new data from the National Association of Realtors (NAR).
The sharp drop in home sales highlights how rising mortgage rates and declining affordability are severely impacting the housing market. The average 30-year fixed mortgage rate now sits around 8%, more than double what it was just a year ago. This rapid surge in borrowing costs has priced many buyers out of the market, especially first-time homebuyers.
Only 27% of September home sales went to first-time buyers, well below the historical norm of 40%. Many simply cannot afford today’s high home prices and mortgage payments. As a result, sales activity has fallen dramatically. The current sales pace of 3.96 million units annualized is down markedly from over 6 million just two years ago, when rates were around 3%.
At the same time, inventory remains extremely tight. There were just 1.13 million existing homes available for sale at the end of September, an over 8% decline from last year. This persistent shortage of homes for sale continues to put upward pressure on prices. The median sales price in September hit $394,300, up 2.8% from a year ago.
While higher prices are squeezing buyers, they are not denting demand enough to significantly expand inventory. Many current homeowners are reluctant to sell and give up their ultra-low mortgage rates. This dynamic is keeping the market undersupplied, even as sales cool.
Not all buyers are impacted equally by higher rates. Sales have held up better on the upper end of the market, while declining sharply for mid-priced and affordable homes. This divergence reflects that high-end buyers often have more financial flexibility, including the ability to purchase in cash.
All-cash sales represented 29% of transactions in September, up notably from 22% a year earlier. Wealthier buyers with financial assets can better absorb higher borrowing costs. In contrast, first-time buyers and middle-income Americans are being squeezed the most by rate hikes.
Looking ahead, the housing slowdown is likely to persist and potentially worsen. Mortgage applications are now at their lowest level since 1995, signaling very weak demand ahead. And while inflation has eased slightly, the Federal Reserve is still expected to continue raising interest rates further to combat it.
Higher rates mean reduced affordability and housing activity, especially if home prices remain elevated due to limited inventory. This perfect storm in the housing market points to significant headwinds for the broader economy going forward.
The housing sector has historically been a key driver of economic growth in the US. But with sales and construction activity slowing substantially, it may act as a drag on GDP growth in coming quarters. Combined with declining affordability, fewer homes being purchased also means less spending on furniture, renovations, and other housing-related items.
Some analysts believe the Fed’s aggressive rate hikes will ultimately tip the economy into a recession. The depth of the housing market downturn so far this year does not bode well from a macroeconomic perspective. It signals households are pulling back materially on major purchases, which could contribute to a broader economic contraction.
While no significant recovery is expected in the near-term, lower demand could eventually help rebalance the market. As sales moderate, competitive bidding may ease, taking some pressure off prices. And if economic conditions worsen substantially, the Fed may again reverse course on interest rates. But for now, the housing sector appears poised for more weakness ahead. Homebuyers and investors should brace for ongoing volatility and uncertainty.