![]()
Stem Holdings d/b/a Driven By Stem and Tinley Beverage Create Home Delivery Solution for Cannabis Beverages in California
LOS ANGELES, CA, BOCA RATON, FL, and TORONTO, May 25, 2021 (GLOBE NEWSWIRE) — Stem Holdings (OTCQX:STMH, CSE:STEM) (“Stem”) and The Tinley Beverage Company Inc. (“Tinley’s” and, together with Stem, the “Companies”) are pleased to announce the integration of Stem’s technology into Tinley’s website, enabling a fast home delivery solution for cannabis-infused beverages throughout the State of California.
Led by Adam Berk, who was the founder and CEO of the first patented online food ordering company in the U.S., Osmio, which became GrubHub, Stem’s licensed, proprietary home delivery network BudeeTM reaches 92% of California’s population for delivery within two (2) hours or by a scheduled time. Stem achieves this through their extensive network of employed home delivery drivers and licensed regional non-storefront retail storage facilities. The platform also offers robust white label e-commerce technology that enables customer ordering via third-party brands’ web sites. This technology, now integrated into Tinley’s own web site, enables consumers to select Tinley’s beverages on www.drinktinley.com and execute an order for delivery by BudeeTM on their website in an apparent seamless customer experience.
Stem’s statewide home delivery platform will be populated with Tinley’s flagship products, and Tinley’s will offer the option of participation in the Stem platform to the growing number of approved third-party brands that have their beverages manufactured at Tinley’s bottling facility in Long Beach, California. Stem’s white label e-commerce platform and home delivery network will constitute an additional value-added service available to approved third-party beverages manufactured at Tinley’s facility, allowing them to expand their home delivery footprint as an additional way of accessing consumers statewide.
Retail and home delivery options for cannabis-infused beverages are often constrained in California by space and other logistical limitations for beverage products at the retail and last-mile delivery levels. Stem’s platform enables seamless delivery from wholesale distribution to consumers’ homes for Tinley’s and other approved third-party manufacturing brands.
The Companies plan to collaborate further to create a variety of beverage-specific online portals that enable outreach and engagement with canna-curious consumers, who can be averse to smoking, and may not frequent dispensaries. With less than 15% of California’s adult population having consumed cannabis in the past year(1), the drink category offers the most natural avenue for this largely untapped consumer base, including beverage alcohol consumers, to transition into cannabis. These portals can employ targeted channel marketing and messaging, comparable to wine and spirit club sites, which the Companies believe are necessary for recruiting these new consumers.
“Home delivery is booming and is an increasingly important part of our growth strategy as well as those of our third-party manufacturing clients,” said Sven Stalley, General Manager of Tinley’s California. “Cannabis beverage consumers are often new or casual cannabis users that may not frequently visit dispensaries. They purchase for home delivery across more consumer categories than ever before, so this collaboration can help bridge the gap for new and mainstream alcohol consumers to build cannabis-beverage consumption into their personal and social use occasions.”
“Tinley’s growing lineup of Tinley’s and third-party beverages expands Stem’s access to a growing portfolio of high-quality drinks, as well as opportunities for working with these brands on collaborative, drink-specific marketing,” said Adam Berk, CEO of Stem Holdings. “Access to unique products and category-specific marketing was a key component of Osmio’s growth, and the opportunity to innovate and collaborate with Tinley’s enables us to employ similar tactics within the cannabis industry.”
About Stem Holdings
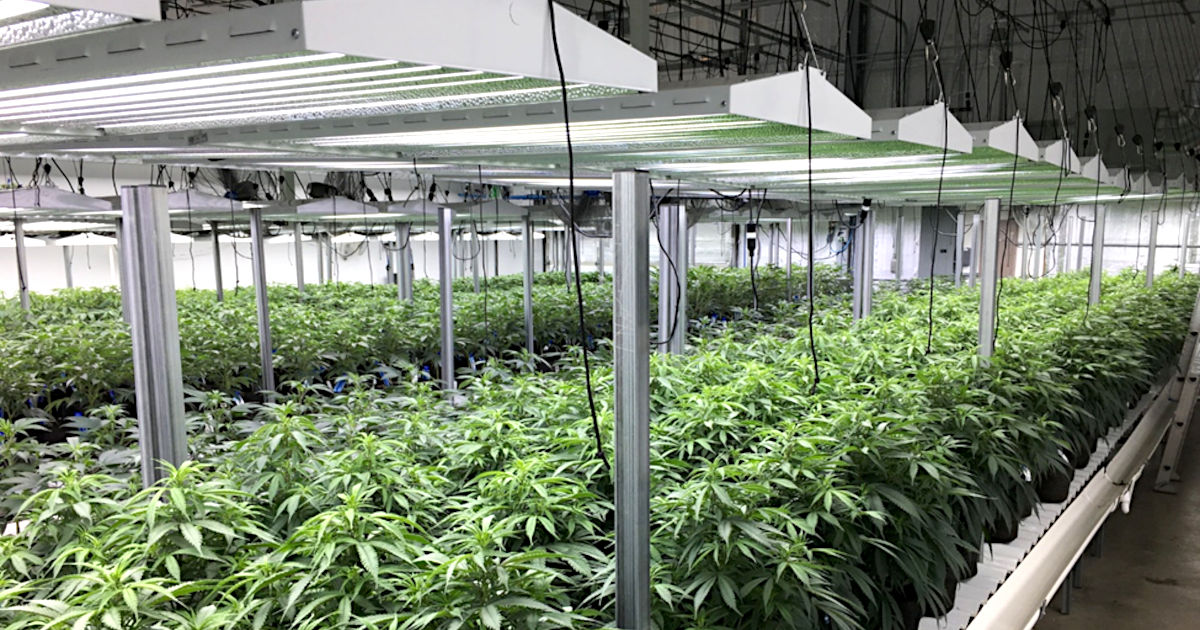
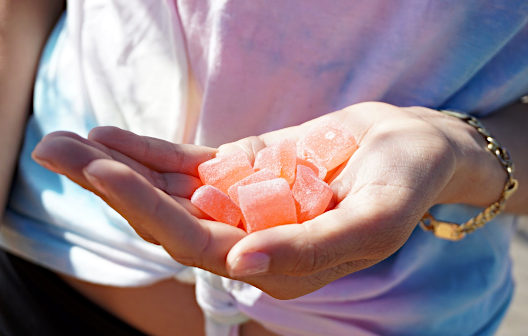
Stem Holdings is a leading omnichannel, vertically-integrated cannabis branded products and technology company with state-of-the-art cultivation, processing, extraction, retail, distribution, and delivery-as-a-service (DaaS) operations throughout the United States. Stem’s family of award-winning brands includes TJ’s GardensTM, TravisxJamesTM, and Yerba BuenaTM flower and extracts; CannavoreTM edible confections; DoseologyTM, a CBD mass-market brand launching in 2021; as well as DaaS brands BudeeTM and GanjarunnerTM through the acquisition of Driven Deliveries. BudeeTM and GanjarunnerTM e-commerce platforms provide direct-to consumer proprietary logistics and an omnichannel UX (user experience)/CX (customer experience).
About The Tinley Beverage Company and Beckett’s Tonics
The Tinley Beverage Company manufactures the Becketts ClassicsTM and Beckett’s 27TM line of non-alcoholic, terpene-infused spirits and cocktails. Beckett’s products are available in mainstream food, beverage and specialty retailers, as well as online across the United States. Cannabis-infused versions of these products are also offered in licensed dispensaries throughout California. Expansion to Canada is underway for both product lines. Tinley’s facility in Long Beach California contains the state’s most versatile and technologically-advanced cannabis-licensed beverage manufacturing equipment. Please visit www.drinkbecketts.com, www.drinktinley.com, Instagram @drinktinleys and @drinkbecketts for recipes, product information and home delivery options.
Forward-Looking Statements
This news release contains forward-looking statements and information (collectively, “forward-looking statements”) within the meaning of applicable Canadian securities laws. Forward-looking statements are statements and information that are not historical facts but instead include financial projections and estimates, statements regarding plans, goals, objectives, intentions and expectations with respect to the future business, operations, expected expansion of distribution footprints and consumer access, the expected transition of consumers from alcohol to cannabis, the ability to achieve unique channel marketing and messaging, and phrases containing words such as “ongoing”, “estimates”, “expects”, or the negative thereof or any other variations thereon or comparable terminology referring to future events or results, or that events or conditions “will”, “may”, “could”, or “should” occur or be achieved, or comparable terminology referring to future events or results. Factors that could cause actual results to differ materially from any forward-looking statement include, but are not limited to, delays in obtaining or failures to obtain required governmental, environmental or other project approvals, political risks, uncertainties relating to the availability and costs of financing needed in the future, changes in equity markets, inflation, changes in exchange rates, fluctuations in commodity prices, delays in the development of projects and the other risks involved in the mineral exploration and development industry. Forward-looking statements are subject to significant risks and uncertainties, and other factors that could cause actual results to differ materially from expected results. Readers should not place undue reliance on forward-looking statements. These forward-looking statements are made as of the date hereof and the Company assumes no responsibility to update them or revise them to reflect new events or circumstances other than as required by law.
Products, formulations and timelines outlined herein are subject to change at any time.
Sources:
(1) Civilized. “10 States That Smoke the Most Weed” https://www.civilized.life/articles/10-states-that-smoke-the-most-weed/
For further information on The Tinley Beverage Company and Stem Holdings, please contact:
Stem Holdings
Investor Relations Contact:
KCSA Strategic Communications
Valter Pinto or Elizabeth Barker
+1 212.896.1254 or +1 212.896.1203
valter@kcsa.com or ebarker@kcsa.com
Media Contact:
Mauria Betts
Director of Branding and Public Relations
971.266.1908
mauria@stemholdings.com
The Tinley Beverage Company
Sven Stalley
(310) 507-9146
info@drinktinley.com
Twitter: @drinktinleys and @drinkbecketts
Instagram: @drinktinleys and @drinkbecketts
www.drinktinley.com