|
|
|
Noble Capital Markets Senior Research Analyst Joe Gomes interviews ACCO Brands Chairman & CEO Boris Elisman. Research, News, and Advanced Market Data on ACCOView all C-Suite Interviews
About ACCO Brands Corporation ACCO Brands Corporation (NYSE: ACCO) is one of the world’s largest designers, marketers and manufacturers of branded academic, consumer and business products. Our widely recognized brands include Artline®, AT-A-GLANCE®, Barrilito®, Derwent®, Esselte®, Five Star®, Foroni®, GBC®, Hilroy®, Kensington®, Leitz®, Mead®, PowerA®, Quartet®, Rapid®, Rexel®, Swingline®, Tilibra®, Wilson Jones® and many others. Our products are sold in more than 100 countries around the world. More information about ACCO Brands, the Home of Great Brands Built by Great People, can be found at www.accobrands.com. |
Category: Retail and Consumer
FAT Brands Inc. (FAT) – Another Order of Chicken Wings

Monday, November 29, 2021
FAT Brands Inc. (FAT)
Another Order of Chicken Wings
FAT Brands Inc is a multi-brand restaurant franchising company. It develops, markets, and acquires predominantly fast casual restaurant concepts. The company provides turkey burgers, chicken Sandwiches, chicken tenders, burgers, ribs, wrap sandwiches, and others. Its brand portfolio comprises Fatburger, Buffalo’s Cafe and Express, and Ponderosa and Bonanza. The company’s overall footprint covers nearly 32 countries. Fatburger generates maximum revenue for the company.
Joe Gomes, Senior Research Analyst, Noble Capital Markets, Inc.
Joshua Zoepfel, Research Associate, Noble Capital Markets, Inc.
Refer to the full report for the price target, fundamental analysis, and rating.
Another Acquisition. FAT Brands announced an agreement to acquire Native Grill & Wings, an Arizona-based restaurant chain known for its cult-like following and 20 wing flavors that guests can order by the individual wing, for $20 million. The acquisition will be funded with cash from the issuance of new notes from the Company’s securitization facilities and is expected to close in mid-December 2021. The business is expected to increase the Company’s post-COVID normalized EBITDA by approximately $3 million in 2022.
Native Grill & Wings. Based in Chandler, Arizona, Native Grill & Wings is a family-friendly, polished sports grill with 23 franchised locations throughout Arizona, Illinois, and Texas. Native Grill will complement Fat Brands’ existing wing concepts, Buffalo’s and Hurricanes, in our view …
This Company Sponsored Research is provided by Noble Capital Markets, Inc., a FINRA and S.E.C. registered broker-dealer (B/D).
*Analyst certification and important disclosures included in the full report. NOTE: investment decisions should not be based upon the content of this research summary. Proper due diligence is required before making any investment decision.
Engine Media (GAME)(GAME:CA) – The Engine That Could

Wednesday, November 24, 2021
Engine Media (GAME)(GAME:CA)
The Engine That Could
Engine Media Holdings Inc is engaged in esports data provision, esports tournament hosting, and esports racing. Its brand profile includes Eden Games, Allin sports, and UMG, and others. The company’s operating segments include E-Sports; Media and Advertising and Corporate and Other. It generates maximum revenue from the Media and Advertising segment. The Media and Advertising segment includes platform and advertising services provided to other broadcasters, primarily local tv and radio broadcasters.
Michael Kupinski, Director of Research, Noble Capital Markets, Inc.
Refer to the full report for the price target, fundamental analysis, and rating.
A solid Q4. Total company revenues of $11.7 million, (up 67% yoy) was better than our $10.8 million estimate, reflecting better than expected Advertising revenue, which beat our estimate by roughly 16%. The EBITDA loss was better than expected as well, $4.3 million loss versus our loss estimate of $5.2 million.
Significant sequential revenue growth. The company appears to have favorable revenue trajectory, with 22% sequential revenue growth from Q3. Advertising, which was the largest upside variance in the quarter, reflected a 37% sequential improvement from Q3, with CPMs up a strong 36% …
This Company Sponsored Research is provided by Noble Capital Markets, Inc., a FINRA and S.E.C. registered broker-dealer (B/D).
*Analyst certification and important disclosures included in the full report. NOTE: investment decisions should not be based upon the content of this research summary. Proper due diligence is required before making any investment decision.
Release – Motorsport Games – Nascar Heat Ultimate Edition Officially Launches On Nintendo Switch

Nascar Heat Ultimate Edition+ Officially Launches On Nintendo Switch
MOTORSPORT GAMES DEVELOPED NASCAR GAME IS THE FIRST TO COME TO THE CONSOLE, AVAILABLE TO PLAY STARTING TODAY, NOVEMBER 19, 2021
MIAMI, Nov. 19, 2021 (GLOBE NEWSWIRE) — Motorsport Games Inc. (NASDAQ: MSGM) (“Motorsport Games”), a leading racing game developer, publisher and esports ecosystem provider of official motorsport racing series throughout the world, announces today the official launch of NASCAR Heat Ultimate Edition+ on Nintendo Switch, available to play today. The game is the first ever NASCAR title to come to Nintendo Switch consoles. A look at the accompanying launch trailer can be found here.
NASCAR Heat Ultimate Edition+ brings to life the 2020 NASCAR season of the world’s most popular stock car racing series for the very first time on Nintendo Switch. NASCAR Heat Ultimate Edition+ on Nintendo Switch includes everything found in the NASCAR Heat 5 Ultimate Edition, plus the 2021 NASCAR Cup Series cars, roster and primary paint schemes. The previous 2020 official teams, drivers, cars and schedule from the three NASCAR national series and Xtreme Dirt Tour races, featuring 39 authentic tracks, remain in the game as well. Further featured content includes 2020 Throwback and Playoff paint schemes, Tony Stewart as a playable character and more.
“Bringing one of our titles to Nintendo Switch has been something Motorsport Games has wished to do for many years and we couldn’t be happier that we are now able to bring the joy of racing to even more players,” said Dmitry Kozko, CEO of Motorsport Games. “NASCAR fans can now race either on the go or in the comfort of their own homes with the flexibility the Nintendo Switch offers. NASCAR Heat Ultimate Edition+ brings Motorsport Games’ signature authenticity of racing to a brand new console and we can’t wait for everyone to get some laps in on their Nintendo Switch consoles.”
“Bringing NASCAR Heat Ultimate Edition+ to Nintendo Switch was the natural next step for this game,” said Nick Rend, Managing Director of Gaming and Esports, NASCAR. “As the first NASCAR title for Nintendo Switch, we’re able to introduce the sport to a new community of players while giving current fans another way to embrace NASCAR racing they love.”
NASCAR Heat Ultimate Edition+ for Nintendo Switch comes with a complete bevy of features and modes, including Career Mode, gameplay enhancements to AI, added camera options, ability for DNFs, Testing Mode and Online Challenge Mode. Nintendo Switch users can look forward to racing on 39 official, authentic race tracks across the various series, including Daytona International Speedway, Indianapolis Motor Speedway, Indianapolis Motor Speedway Road Course and Talladega Superspeedway, plus nine dirt tracks. Online Racing accommodates up to 16 players and users can also enjoy local split-screen multiplayer. Lastly, the Paint Booth is included, with number fonts and schemes to choose from when customizing your car.
To find out more information and to purchase NASCAR Heat Ultimate Edition+ for Nintendo Switch, please visit www.NASCARHeat.com.
To keep up with the latest Motorsport Game news visit www.motorsportgames.com and follow on Twitter, Instagram, Facebook and LinkedIn.
About Motorsport Games:
Motorsport Games, a Motorsport Network company, combines innovative and engaging video games with exciting esports competitions and content for racing fans and gamers around the globe. The Company is the officially licensed video game developer and publisher for iconic motorsport racing series, including NASCAR, INDYCAR, 24 Hours of Le Mans and the British Touring Car Championship (“BTCC”), across PC, PlayStation, Xbox, Nintendo Switch and mobile. Motorsport Games is an award-winning esports partner of choice for 24 Hours of Le Mans, Formula E, BTCC, the FIA World Rallycross Championship and the eNASCAR Heat Pro League, among others. For more information about Motorsport Games, visit www.motorsportgames.com.
Forward-Looking Statements:
Certain statements in this press release which are not historical facts are forward-looking statements within the meaning of Section 27A of the Securities Act of 1933, as amended, and Section 21E of the Securities Exchange Act of 1934, as amended, and are provided pursuant to the safe harbor provisions of the Private Securities Litigation Reform Act of 1995. Any statements in this press release that are not statements of historical fact may be deemed forward-looking statements. Words such as “continue,” “will,” “may,” “could,” “should,” “expect,” “expected,” “plans,” “intend,” “anticipate,” “believe,” “estimate,” “predict,” “potential,” and similar expressions are intended to identify such forward-looking statements. These forward-looking statements include, but are not limited to, statements concerning the expected future impact of new or planned products, features, offerings or events, and the timing of launching such products, features, offerings or events. All forward-looking statements involve significant risks and uncertainties that could cause actual results to differ materially from those expressed or implied in the forward-looking statements, many of which are generally outside the control of Motorsport Games and are difficult to predict. Examples of such risks and uncertainties include, but are not limited to difficulties, delays in or unanticipated events that may impact the timing and scope of new product launches, such as due to delays and higher than anticipated expenses related to the ongoing and prolonged COVID-19 pandemic. Factors other than those referred to above could also cause Motorsport Games’ results to differ materially from expected results. Additional factors that could cause actual results to differ materially from those expressed or implied in the forward-looking statements can be found in Motorsport Games’ filings with the SEC, which may be found at www.sec.gov and at ir.motorsportgames.com, including its Annual Report on Form 10-K for the fiscal year ended December 31, 2020, its Quarterly Reports on Form 10-Q filed with the SEC during 2021, as well as in its subsequent filings with the SEC. Motorsport Games anticipates that subsequent events and developments may cause its plans, intentions and expectations to change. Motorsport Games assumes no obligation, and it specifically disclaims any intention or obligation, to update any forward-looking statements, whether as a result of new information, future events or otherwise, except as expressly required by law. Forward-looking statements speak only as of the date they are made and should not be relied upon as representing Motorsport Games’ plans and expectations as of any subsequent date. Additionally, the business and financial materials and any other statement or disclosure on, or made available through, Motorsport Games’ website or other websites referenced or linked to this press release shall not be incorporated by reference into this press release.
Website and Social Media Disclosure:
Investors and others should note that we announce material financial information to our investors using our investor relations website (ir.motorsportgames.com), SEC filings, press releases, public conference calls and webcasts. We use these channels, as well as social media and blogs, to communicate with our investors and the public about our company and our products. It is possible that the information we post on our websites, social media and blogs could be deemed to be material information. Therefore, we encourage investors, the media and others interested in our company to review the information we post on these websites, social media channels and blogs, including the following (which list we will update from time to time on our investor relations website):
| Websites | Social Media |
| motorsportgames.com | Twitter: @msportgames & @traxiongg |
| traxion.gg | Instagram: msportgames & traxiongg |
| motorsport.com | Facebook: Motorsport Games & traxiongg |
| LinkedIn: Motorsport Games | |
| Twitch: traxiongg | |
| Reddit: traxiongg |
The contents of these websites and social media channels are not part of, nor will they be incorporated by reference into, this press release.
Investors:
Ashley DeSimone
Ashley.Desimone@icrinc.com
Press:
ASTRSK PR
motorsportgames@astrskpr.com
Motorsport Games – Nascar Heat Ultimate Edition+ Officially Launches On Nintendo Switch

Nascar Heat Ultimate Edition+ Officially Launches On Nintendo Switch
MOTORSPORT GAMES DEVELOPED NASCAR GAME IS THE FIRST TO COME TO THE CONSOLE, AVAILABLE TO PLAY STARTING TODAY, NOVEMBER 19, 2021
MIAMI, Nov. 19, 2021 (GLOBE NEWSWIRE) — Motorsport Games Inc. (NASDAQ: MSGM) (“Motorsport Games”), a leading racing game developer, publisher and esports ecosystem provider of official motorsport racing series throughout the world, announces today the official launch of NASCAR Heat Ultimate Edition+ on Nintendo Switch, available to play today. The game is the first ever NASCAR title to come to Nintendo Switch consoles. A look at the accompanying launch trailer can be found here.
NASCAR Heat Ultimate Edition+ brings to life the 2020 NASCAR season of the world’s most popular stock car racing series for the very first time on Nintendo Switch. NASCAR Heat Ultimate Edition+ on Nintendo Switch includes everything found in the NASCAR Heat 5 Ultimate Edition, plus the 2021 NASCAR Cup Series cars, roster and primary paint schemes. The previous 2020 official teams, drivers, cars and schedule from the three NASCAR national series and Xtreme Dirt Tour races, featuring 39 authentic tracks, remain in the game as well. Further featured content includes 2020 Throwback and Playoff paint schemes, Tony Stewart as a playable character and more.
“Bringing one of our titles to Nintendo Switch has been something Motorsport Games has wished to do for many years and we couldn’t be happier that we are now able to bring the joy of racing to even more players,” said Dmitry Kozko, CEO of Motorsport Games. “NASCAR fans can now race either on the go or in the comfort of their own homes with the flexibility the Nintendo Switch offers. NASCAR Heat Ultimate Edition+ brings Motorsport Games’ signature authenticity of racing to a brand new console and we can’t wait for everyone to get some laps in on their Nintendo Switch consoles.”
“Bringing NASCAR Heat Ultimate Edition+ to Nintendo Switch was the natural next step for this game,” said Nick Rend, Managing Director of Gaming and Esports, NASCAR. “As the first NASCAR title for Nintendo Switch, we’re able to introduce the sport to a new community of players while giving current fans another way to embrace NASCAR racing they love.”
NASCAR Heat Ultimate Edition+ for Nintendo Switch comes with a complete bevy of features and modes, including Career Mode, gameplay enhancements to AI, added camera options, ability for DNFs, Testing Mode and Online Challenge Mode. Nintendo Switch users can look forward to racing on 39 official, authentic race tracks across the various series, including Daytona International Speedway, Indianapolis Motor Speedway, Indianapolis Motor Speedway Road Course and Talladega Superspeedway, plus nine dirt tracks. Online Racing accommodates up to 16 players and users can also enjoy local split-screen multiplayer. Lastly, the Paint Booth is included, with number fonts and schemes to choose from when customizing your car.
To find out more information and to purchase NASCAR Heat Ultimate Edition+ for Nintendo Switch, please visit www.NASCARHeat.com.
To keep up with the latest Motorsport Game news visit www.motorsportgames.com and follow on Twitter, Instagram, Facebook and LinkedIn.
About Motorsport Games:
Motorsport Games, a Motorsport Network company, combines innovative and engaging video games with exciting esports competitions and content for racing fans and gamers around the globe. The Company is the officially licensed video game developer and publisher for iconic motorsport racing series, including NASCAR, INDYCAR, 24 Hours of Le Mans and the British Touring Car Championship (“BTCC”), across PC, PlayStation, Xbox, Nintendo Switch and mobile. Motorsport Games is an award-winning esports partner of choice for 24 Hours of Le Mans, Formula E, BTCC, the FIA World Rallycross Championship and the eNASCAR Heat Pro League, among others. For more information about Motorsport Games, visit www.motorsportgames.com.
Forward-Looking Statements:
Certain statements in this press release which are not historical facts are forward-looking statements within the meaning of Section 27A of the Securities Act of 1933, as amended, and Section 21E of the Securities Exchange Act of 1934, as amended, and are provided pursuant to the safe harbor provisions of the Private Securities Litigation Reform Act of 1995. Any statements in this press release that are not statements of historical fact may be deemed forward-looking statements. Words such as “continue,” “will,” “may,” “could,” “should,” “expect,” “expected,” “plans,” “intend,” “anticipate,” “believe,” “estimate,” “predict,” “potential,” and similar expressions are intended to identify such forward-looking statements. These forward-looking statements include, but are not limited to, statements concerning the expected future impact of new or planned products, features, offerings or events, and the timing of launching such products, features, offerings or events. All forward-looking statements involve significant risks and uncertainties that could cause actual results to differ materially from those expressed or implied in the forward-looking statements, many of which are generally outside the control of Motorsport Games and are difficult to predict. Examples of such risks and uncertainties include, but are not limited to difficulties, delays in or unanticipated events that may impact the timing and scope of new product launches, such as due to delays and higher than anticipated expenses related to the ongoing and prolonged COVID-19 pandemic. Factors other than those referred to above could also cause Motorsport Games’ results to differ materially from expected results. Additional factors that could cause actual results to differ materially from those expressed or implied in the forward-looking statements can be found in Motorsport Games’ filings with the SEC, which may be found at www.sec.gov and at ir.motorsportgames.com, including its Annual Report on Form 10-K for the fiscal year ended December 31, 2020, its Quarterly Reports on Form 10-Q filed with the SEC during 2021, as well as in its subsequent filings with the SEC. Motorsport Games anticipates that subsequent events and developments may cause its plans, intentions and expectations to change. Motorsport Games assumes no obligation, and it specifically disclaims any intention or obligation, to update any forward-looking statements, whether as a result of new information, future events or otherwise, except as expressly required by law. Forward-looking statements speak only as of the date they are made and should not be relied upon as representing Motorsport Games’ plans and expectations as of any subsequent date. Additionally, the business and financial materials and any other statement or disclosure on, or made available through, Motorsport Games’ website or other websites referenced or linked to this press release shall not be incorporated by reference into this press release.
Website and Social Media Disclosure:
Investors and others should note that we announce material financial information to our investors using our investor relations website (ir.motorsportgames.com), SEC filings, press releases, public conference calls and webcasts. We use these channels, as well as social media and blogs, to communicate with our investors and the public about our company and our products. It is possible that the information we post on our websites, social media and blogs could be deemed to be material information. Therefore, we encourage investors, the media and others interested in our company to review the information we post on these websites, social media channels and blogs, including the following (which list we will update from time to time on our investor relations website):
| Websites | Social Media |
| motorsportgames.com | Twitter: @msportgames & @traxiongg |
| traxion.gg | Instagram: msportgames & traxiongg |
| motorsport.com | Facebook: Motorsport Games & traxiongg |
| LinkedIn: Motorsport Games | |
| Twitch: traxiongg | |
| Reddit: traxiongg |
The contents of these websites and social media channels are not part of, nor will they be incorporated by reference into, this press release.
Investors:
Ashley DeSimone
Ashley.Desimone@icrinc.com
Press:
ASTRSK PR
motorsportgames@astrskpr.com
What Percentage of U.S. Retail Sales is Ecommerce?

Ecommerce’s Dramatic Growth in 2020 Leaves Great Potential for Online Retailers
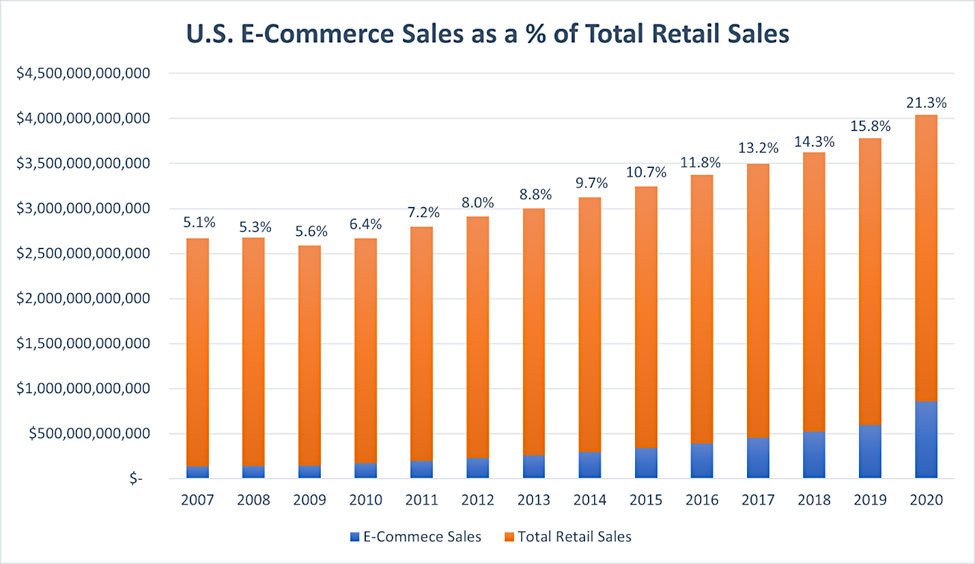
Online sales growth has increased each year as retailers enhance their online presence and shoppers become more comfortable making purchases over the internet. A little over a decade ago, ecommerce was a scant 5.1% of total sales. Online shopping in 2020 accounted for 21%. This was a full 5% increase from 2019 when online retailers took a 16% slice of the pie. The 2021 holiday shopping season started early and retail sales on and offline are strong.
Non-Seasonably adjusted ecommerce data from the Commerce Department analyzed by Digital Commerce 360
Growth of Retail Sales and the Percentage Attributed to Ecommerce
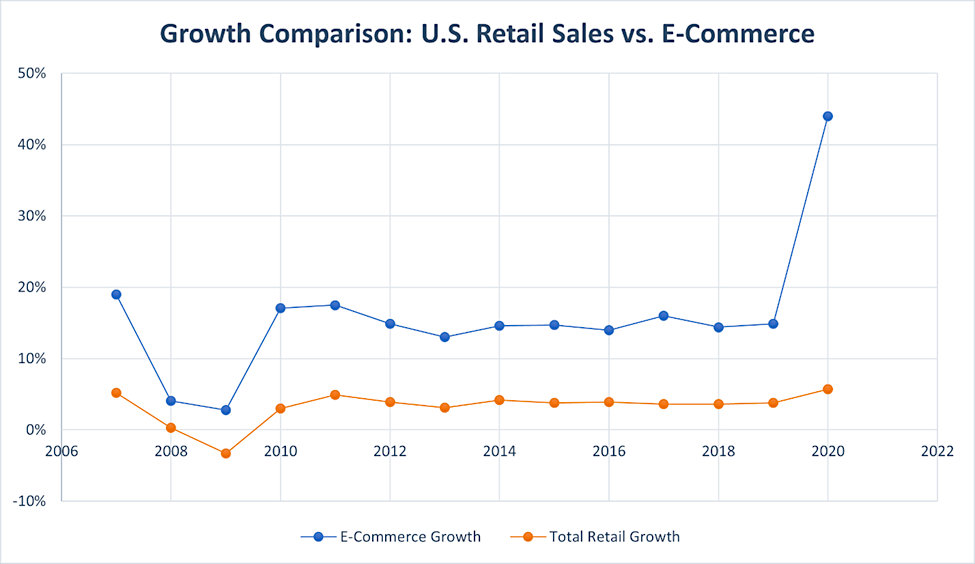
The dramatic shift to consumers shopping from home last year certainly caused a spike in online sales and revenues. During 2020 U.S. households spent $861.02 billion online; this is a 44% spike when compared to 2019 and the highest percentage increase this millennium. Total retail sales, including merchandise purchased in stores and phone orders, increased 6.9% over the year to $4.04 trillion. These numbers come from an early analysis of the retail picture by Digital Commerce 360. Retail sales overall experienced the highest growth since 2005. This means online retail purchases now account for 21.3% of a higher dollar retail sales figure.
Of the increase in sales, more than two-thirds, 64.2%, were online. They accounted for 61.4% of the slower growth in 2019. Interestingly, though, the fact that ecommerce didn’t account for all of the gains means that offline sales grew a noteworthy 3.9% during Q4.
Retailers who were firmly established online, depending on their product, were already winners with the ongoing trend toward online sales. They were even bigger winners as a result of the forced shift of many shoppers to online purchasing. And the move toward online purchases is expected to continue. In an interview earlier this year, Chris McCann, CEO from online retailer 1-800-Flowers (FLWS), said, “Coming off a record end-of-year holiday season, we see a continuation of the accelerated momentum that began for us back in 2018, but picked up even more during the pandemic.” The momentum that built last year may come off a bit, but the trend is firmly in place. This has caused traditional bricks-and-mortar retailers such as Macy’s and Target to bolster their online presence, but also other brands to capitalize on their name through online marketing. Macy’s just announced they are exploring a separate online business, separate and distinct from their bricks-and-mortar operation. Saks Fifth Ave. has already taken steps to split its operations in this way.
Online Retailing Highlights Year-End 2020
- Ecommerce sales hit $791.70 billion in 2020, up 32.4% from $598.02 billion in the prior year.
- Based on Digital Commerce 360 estimates, online penetration hit 19.6% in 2020. This is compared to 15.8% in 2019 and 14.3% in 2018. Using that trend, without the pandemic’s change of shopping habits, the ecommerce portion of retail sales wouldn’t have reached that level until 2022.
- COVID-19 resulted in an additional $105.47 billion in ecommerce revenue in 2020, Digital Commerce 360 estimates.
- Total retail sales reached $4.04 trillion last year, up from $3.78 trillion in 2019. The 6.9% lift was the highest annual growth since 1999. Sales through brick and mortar and online increased just 4.0% in 2019.
- Ecommerce accounted for almost three-quarters (74.6%) of the growth in total retail in 2020. It was also about 11% higher than the second place year, which was 2008.
- Offline sales grew 2.1%, which was the same rate as the pandemic-free prior year.
Take-Away
Overall retail sales grew in 2020. Within that growth, the percentage of online sales grew faster than it had since 1999. The retail sector includes Amazon, which accounted for half of last year’s growth. Away from Amazon, the trend for companies that derive revenue from online sales has plenty of upsides.
Suggested Content:
Playboy Enterprises NobleCon Presentation Replay
1-800-FLOWERS, At Some Point This Will Happen
Workcations Add a New Class of Traveler
Sources:
The Business of Valentine’s Day
Quarterly Online Sales, Digital Commerce 360

|
Virtual Road Show Series – Thursday, November 18 at 1pm EST Join Entravision Communications CFO Christopher Young for this exclusive fireside chat moderated by Michael Kupinski, Noble’s senior research analyst, featuring questions taken from the live audience. Registration is free and open to all investors, at any level. |
Stay up to date. Follow us:
 |
 |
 |
 |
 |
 |
Release – Schwazze Signs Definitive Agreement to Acquire MCG LLC
Schwazze Signs Definitive Agreement to Acquire MCG, LLC
Schwazze Continues its Colorado Expansion Strategy with Emerald Fields Cannaboutique Dispensaries in Manitou Springs & Glendale, CO
DENVER, Nov. 16, 2021 /CNW/ – Schwazze, (OTCQX: SHWZ) (“Schwazze” or the “Company”), announced that it has signed definitive documents to acquire MCG, LLC (“Emerald Fields”). Emerald Fields owns and operates two retail cannabis dispensaries, located in Manitou Springs and Glendale, Colorado. This acquisition is part of the Company’s continuing retail expansion plan in Colorado bringing the total number of dispensaries including announced acquisitions to 22.
Total consideration for the acquisition will be $29 million and will be paid as 60% cash and 40% Schwazze common stock upon closing. The acquisition is targeted to close in the next 75 days, subject to closing conditions and covenants customary for this type of transaction, including, without limitation, obtaining Colorado Marijuana Enforcement Division and local licensing approval.
“Our team is delighted to add the Emerald Fields Cannaboutiques to our growing portfolio of dispensaries and are eager to welcome the team to Schwazze. Manitou Springs and Glendale are attractive locations and are valuable assets to our overall acquisitions plans as we continue to build out Colorado. Our team is excited to add another store brand to our house of brands.” said Justin Dye, Schwazze’s CEO.
About Schwazze
Schwazze (OTCQX: SHWZ) is building the premier vertically integrated cannabis company in Colorado and plans to take its operating system to other states where it can develop a differentiated leadership position. Schwazze is the parent company of a portfolio of leading cannabis businesses and brands spanning seed to sale. The Company is committed to unlocking the full potential of the cannabis plant to improve the human condition. Schwazze is anchored by a high-performance culture that combines customer-centric thinking and data science to test, measure, and drive decisions and outcomes. The Company’s leadership team has deep expertise in retailing, wholesaling, and building consumer brands at Fortune 500 companies as well as in the cannabis sector. Schwazze is passionate about making a difference in our communities, promoting diversity and inclusion, and doing our part to incorporate climate-conscious best practices. Medicine Man Technologies, Inc. was Schwazze’s former operating trade name. The corporate entity continues to be named Medicine Man Technologies, Inc.
Schwazze derives its name from the pruning technique of a cannabis plant to enhance plant structure and promote healthy growth.
Forward-Looking Statements
This press release contains “forward-looking statements.” Such statements may be preceded by the words “plan,” “will,” “may,”, “predicts,” or similar words. Forward-looking statements are not guarantees of future events or performance, are based on certain assumptions, and are subject to various known and unknown risks and uncertainties, many of which are beyond the Company’s control and cannot be predicted or quantified. Consequently, actual events and results may differ materially from those expressed or implied by such forward-looking statements. Such risks and uncertainties include, without limitation, risks and uncertainties associated with (i) our inability to manufacture our products and product candidates on a commercial scale on our own or in collaboration with third parties; (ii) difficulties in obtaining financing on commercially reasonable terms; (iii) changes in the size and nature of our competition; (iv) loss of one or more key executives or scientists; (v) difficulties in securing regulatory approval to market our products and product candidates; (vi) our ability to successfully execute our growth strategy in Colorado and outside the state, (vii) our ability to consummate the acquisition described in this press release or to identify and consummate future acquisitions that meet our criteria, (viii) our ability to successfully integrate acquired businesses and realize synergies therefrom, (ix) the ongoing COVID-19 pandemic, * the timing and extent of governmental stimulus programs, and (xi) the uncertainty in the application of federal, state and local laws to our business, and any changes in such laws. More detailed information about the Company and the risk factors that may affect the realization of forward-looking statements is set forth in the Company’s filings with the Securities and Exchange Commission (SEC), including the Company’s Annual Report on Form 10-K and its Quarterly Reports on Form 10-Q. Investors and security holders are urged to read these documents free of charge on the SEC’s website at http://www.sec.gov. The Company assumes no obligation to publicly update or revise its forward-looking statements as a result of new information, future events or otherwise except as required by law.
SOURCE Schwazze
Schwazze Signs Definitive Agreement to Acquire MCG, LLC

Schwazze Signs Definitive Agreement to Acquire MCG, LLC
Schwazze Continues its Colorado Expansion Strategy with Emerald Fields Cannaboutique Dispensaries in Manitou Springs & Glendale, CO
DENVER, Nov. 16, 2021 /CNW/ – Schwazze, (OTCQX: SHWZ) (“Schwazze” or the “Company”), announced that it has signed definitive documents to acquire MCG, LLC (“Emerald Fields”). Emerald Fields owns and operates two retail cannabis dispensaries, located in Manitou Springs and Glendale, Colorado. This acquisition is part of the Company’s continuing retail expansion plan in Colorado bringing the total number of dispensaries including announced acquisitions to 22.
Total consideration for the acquisition will be $29 million and will be paid as 60% cash and 40% Schwazze common stock upon closing. The acquisition is targeted to close in the next 75 days, subject to closing conditions and covenants customary for this type of transaction, including, without limitation, obtaining Colorado Marijuana Enforcement Division and local licensing approval.
“Our team is delighted to add the Emerald Fields Cannaboutiques to our growing portfolio of dispensaries and are eager to welcome the team to Schwazze. Manitou Springs and Glendale are attractive locations and are valuable assets to our overall acquisitions plans as we continue to build out Colorado. Our team is excited to add another store brand to our house of brands.” said Justin Dye, Schwazze’s CEO.
About Schwazze
Schwazze (OTCQX: SHWZ) is building the premier vertically integrated cannabis company in Colorado and plans to take its operating system to other states where it can develop a differentiated leadership position. Schwazze is the parent company of a portfolio of leading cannabis businesses and brands spanning seed to sale. The Company is committed to unlocking the full potential of the cannabis plant to improve the human condition. Schwazze is anchored by a high-performance culture that combines customer-centric thinking and data science to test, measure, and drive decisions and outcomes. The Company’s leadership team has deep expertise in retailing, wholesaling, and building consumer brands at Fortune 500 companies as well as in the cannabis sector. Schwazze is passionate about making a difference in our communities, promoting diversity and inclusion, and doing our part to incorporate climate-conscious best practices. Medicine Man Technologies, Inc. was Schwazze’s former operating trade name. The corporate entity continues to be named Medicine Man Technologies, Inc.
Schwazze derives its name from the pruning technique of a cannabis plant to enhance plant structure and promote healthy growth.
Forward-Looking Statements
This press release contains “forward-looking statements.” Such statements may be preceded by the words “plan,” “will,” “may,”, “predicts,” or similar words. Forward-looking statements are not guarantees of future events or performance, are based on certain assumptions, and are subject to various known and unknown risks and uncertainties, many of which are beyond the Company’s control and cannot be predicted or quantified. Consequently, actual events and results may differ materially from those expressed or implied by such forward-looking statements. Such risks and uncertainties include, without limitation, risks and uncertainties associated with (i) our inability to manufacture our products and product candidates on a commercial scale on our own or in collaboration with third parties; (ii) difficulties in obtaining financing on commercially reasonable terms; (iii) changes in the size and nature of our competition; (iv) loss of one or more key executives or scientists; (v) difficulties in securing regulatory approval to market our products and product candidates; (vi) our ability to successfully execute our growth strategy in Colorado and outside the state, (vii) our ability to consummate the acquisition described in this press release or to identify and consummate future acquisitions that meet our criteria, (viii) our ability to successfully integrate acquired businesses and realize synergies therefrom, (ix) the ongoing COVID-19 pandemic, * the timing and extent of governmental stimulus programs, and (xi) the uncertainty in the application of federal, state and local laws to our business, and any changes in such laws. More detailed information about the Company and the risk factors that may affect the realization of forward-looking statements is set forth in the Company’s filings with the Securities and Exchange Commission (SEC), including the Company’s Annual Report on Form 10-K and its Quarterly Reports on Form 10-Q. Investors and security holders are urged to read these documents free of charge on the SEC’s website at http://www.sec.gov. The Company assumes no obligation to publicly update or revise its forward-looking statements as a result of new information, future events or otherwise except as required by law.
SOURCE Schwazze
eSports Entertainment Group Inc. (GMBL) – Score One For The House

Tuesday, November 16, 2021
eSports Entertainment Group, Inc. (GMBL)
Score One For The House
Esports Entertainment Group Inc is a development-stage online gambling company focused purely on esports. The company’s principal business operations include design, develop and test wagering systems.
Michael Kupinski, Director of Research, Noble Capital Markets, Inc.
Refer to the full report for the price target, fundamental analysis, and rating.
Off to a good start. Fiscal first quarter revenues were on point at $16.4 million, with lower than expected Adj. EBITDA loss of $2.6 million, versus our $4.3 million loss estimate. The results were influenced by a large number of acquisitions, including the recent acquisition of BetHard. In addition, Gross Margins significantly improved from 59% in fiscal Q4 to 61% in the latest quarter.
Reiterates fiscal 2022 revenue guidance. The first quarter indicates that the company is on a trajectory to achieving its fiscal 2022 revenue goal of $100 million. At this time, we are maintaining our more conservative estimate of $95.0 million. Given a more favorable Gross Margin assumption, we are lowering our adj. EBITDA loss for the year from $11.5 million to a loss of $9.0 million, which also …
This Company Sponsored Research is provided by Noble Capital Markets, Inc., a FINRA and S.E.C. registered broker-dealer (B/D).
*Analyst certification and important disclosures included in the full report. NOTE: investment decisions should not be based upon the content of this research summary. Proper due diligence is required before making any investment decision.
eSports Entertainment Group, Inc. (GMBL) – Score One For The House

Tuesday, November 16, 2021
eSports Entertainment Group, Inc. (GMBL)
Score One For The House
Esports Entertainment Group Inc is a development-stage online gambling company focused purely on esports. The company’s principal business operations include design, develop and test wagering systems.
Michael Kupinski, Director of Research, Noble Capital Markets, Inc.
Refer to the full report for the price target, fundamental analysis, and rating.
Off to a good start. Fiscal first quarter revenues were on point at $16.4 million, with lower than expected Adj. EBITDA loss of $2.6 million, versus our $4.3 million loss estimate. The results were influenced by a large number of acquisitions, including the recent acquisition of BetHard. In addition, Gross Margins significantly improved from 59% in fiscal Q4 to 61% in the latest quarter.
Reiterates fiscal 2022 revenue guidance. The first quarter indicates that the company is on a trajectory to achieving its fiscal 2022 revenue goal of $100 million. At this time, we are maintaining our more conservative estimate of $95.0 million. Given a more favorable Gross Margin assumption, we are lowering our adj. EBITDA loss for the year from $11.5 million to a loss of $9.0 million, which also …
This Company Sponsored Research is provided by Noble Capital Markets, Inc., a FINRA and S.E.C. registered broker-dealer (B/D).
*Analyst certification and important disclosures included in the full report. NOTE: investment decisions should not be based upon the content of this research summary. Proper due diligence is required before making any investment decision.
Release – Schwazze Signs Definitive Agreement to Acquire Smoking Gun LLC Smoking Gun Land Company LLC

Schwazze Signs Definitive Agreement to Acquire Smoking Gun, LLC & Smoking Gun Land Company, LLC
Schwazze Continues to widen its Colorado Expansion Strategy
DENVER, Nov. 15, 2021 /CNW/ – Schwazze, (OTCQX: SHWZ) (“Schwazze” or the “Company”), announced that it has signed definitive documents to acquire the assets of Smoking Gun, LLC and Smoking Gun Land Company, LLC (“Smoking Gun”).
The Smoking Gun dispensary and assets are located on a prime retail corner on Colorado Blvd. in Glendale, Colorado in the center of the greater Denver metro area. This acquisition is part of the Company’s continuing retail expansion plan in Colorado bringing the total number of dispensaries including announced acquisitions to 20.
Total consideration for the acquisition will be $4 million in cash and 100,000 shares in Schwazze common stock upon closing. The acquisition is expected to close during the fourth quarter of 2021, subject to closing conditions and covenants customary for this type of transaction, including, without limitation, obtaining Colorado Marijuana Enforcement Division and local licensing approval.
About Schwazze
Schwazze (OTCQX: SHWZ) is building the premier vertically integrated cannabis company in Colorado and plans to take its operating system to other states where it can develop a differentiated leadership position. Schwazze is the parent company of a portfolio of leading cannabis businesses and brands spanning seed to sale. The Company is committed to unlocking the full potential of the cannabis plant to improve the human condition. Schwazze is anchored by a high-performance culture that combines customer-centric thinking and data science to test, measure, and drive decisions and outcomes. The Company’s leadership team has deep expertise in retailing, wholesaling, and building consumer brands at Fortune 500 companies as well as in the cannabis sector. Schwazze is passionate about making a difference in our communities, promoting diversity and inclusion, and doing our part to incorporate climate-conscious best practices. Medicine Man Technologies, Inc. was Schwazze’s former operating trade name. The corporate entity continues to be named Medicine Man Technologies, Inc.
Schwazze derives its name from the pruning technique of a cannabis plant to enhance plant structure and promote healthy growth.
Forward-Looking Statements
This press release contains “forward-looking statements.” Such statements may be preceded by the words “plan,” “will,” “may,”, “predicts,” or similar words. Forward-looking statements are not guarantees of future events or performance, are based on certain assumptions, and are subject to various known and unknown risks and uncertainties, many of which are beyond the Company’s control and cannot be predicted or quantified. Consequently, actual events and results may differ materially from those expressed or implied by such forward-looking statements. Such risks and uncertainties include, without limitation, risks and uncertainties associated with (i) our inability to manufacture our products and product candidates on a commercial scale on our own or in collaboration with third parties; (ii) difficulties in obtaining financing on commercially reasonable terms; (iii) changes in the size and nature of our competition; (iv) loss of one or more key executives or scientists; (v) difficulties in securing regulatory approval to market our products and product candidates; (vi) our ability to successfully execute our growth strategy in Colorado and outside the state, (vii) our ability to consummate the acquisition described in this press release or to identify and consummate future acquisitions that meet our criteria, (viii) our ability to successfully integrate acquired businesses and realize synergies therefrom, (ix) the ongoing COVID-19 pandemic, * the timing and extent of governmental stimulus programs, and (xi) the uncertainty in the application of federal, state and local laws to our business, and any changes in such laws. More detailed information about the Company and the risk factors that may affect the realization of forward-looking statements is set forth in the Company’s filings with the Securities and Exchange Commission (SEC), including the Company’s Annual Report on Form 10-K and its Quarterly Reports on Form 10-Q. Investors and security holders are urged to read these documents free of charge on the SEC’s website at http://www.sec.gov. The Company assumes no obligation to publicly update or revise its forward-looking statements as a result of new information, future events or otherwise except as required by law.
SOURCE Medicine Man Technologies, Inc.
Schwazze Signs Definitive Agreement to Acquire Smoking Gun, LLC & Smoking Gun Land Company, LLC

Schwazze Signs Definitive Agreement to Acquire Smoking Gun, LLC & Smoking Gun Land Company, LLC
Schwazze Continues to widen its Colorado Expansion Strategy
DENVER, Nov. 15, 2021 /CNW/ – Schwazze, (OTCQX: SHWZ) (“Schwazze” or the “Company”), announced that it has signed definitive documents to acquire the assets of Smoking Gun, LLC and Smoking Gun Land Company, LLC (“Smoking Gun”).
The Smoking Gun dispensary and assets are located on a prime retail corner on Colorado Blvd. in Glendale, Colorado in the center of the greater Denver metro area. This acquisition is part of the Company’s continuing retail expansion plan in Colorado bringing the total number of dispensaries including announced acquisitions to 20.
Total consideration for the acquisition will be $4 million in cash and 100,000 shares in Schwazze common stock upon closing. The acquisition is expected to close during the fourth quarter of 2021, subject to closing conditions and covenants customary for this type of transaction, including, without limitation, obtaining Colorado Marijuana Enforcement Division and local licensing approval.
About Schwazze
Schwazze (OTCQX: SHWZ) is building the premier vertically integrated cannabis company in Colorado and plans to take its operating system to other states where it can develop a differentiated leadership position. Schwazze is the parent company of a portfolio of leading cannabis businesses and brands spanning seed to sale. The Company is committed to unlocking the full potential of the cannabis plant to improve the human condition. Schwazze is anchored by a high-performance culture that combines customer-centric thinking and data science to test, measure, and drive decisions and outcomes. The Company’s leadership team has deep expertise in retailing, wholesaling, and building consumer brands at Fortune 500 companies as well as in the cannabis sector. Schwazze is passionate about making a difference in our communities, promoting diversity and inclusion, and doing our part to incorporate climate-conscious best practices. Medicine Man Technologies, Inc. was Schwazze’s former operating trade name. The corporate entity continues to be named Medicine Man Technologies, Inc.
Schwazze derives its name from the pruning technique of a cannabis plant to enhance plant structure and promote healthy growth.
Forward-Looking Statements
This press release contains “forward-looking statements.” Such statements may be preceded by the words “plan,” “will,” “may,”, “predicts,” or similar words. Forward-looking statements are not guarantees of future events or performance, are based on certain assumptions, and are subject to various known and unknown risks and uncertainties, many of which are beyond the Company’s control and cannot be predicted or quantified. Consequently, actual events and results may differ materially from those expressed or implied by such forward-looking statements. Such risks and uncertainties include, without limitation, risks and uncertainties associated with (i) our inability to manufacture our products and product candidates on a commercial scale on our own or in collaboration with third parties; (ii) difficulties in obtaining financing on commercially reasonable terms; (iii) changes in the size and nature of our competition; (iv) loss of one or more key executives or scientists; (v) difficulties in securing regulatory approval to market our products and product candidates; (vi) our ability to successfully execute our growth strategy in Colorado and outside the state, (vii) our ability to consummate the acquisition described in this press release or to identify and consummate future acquisitions that meet our criteria, (viii) our ability to successfully integrate acquired businesses and realize synergies therefrom, (ix) the ongoing COVID-19 pandemic, * the timing and extent of governmental stimulus programs, and (xi) the uncertainty in the application of federal, state and local laws to our business, and any changes in such laws. More detailed information about the Company and the risk factors that may affect the realization of forward-looking statements is set forth in the Company’s filings with the Securities and Exchange Commission (SEC), including the Company’s Annual Report on Form 10-K and its Quarterly Reports on Form 10-Q. Investors and security holders are urged to read these documents free of charge on the SEC’s website at http://www.sec.gov. The Company assumes no obligation to publicly update or revise its forward-looking statements as a result of new information, future events or otherwise except as required by law.
SOURCE Medicine Man Technologies, Inc.
Cannabis Bill Proposed by Republican House Member Softer on Marijuana Taxes
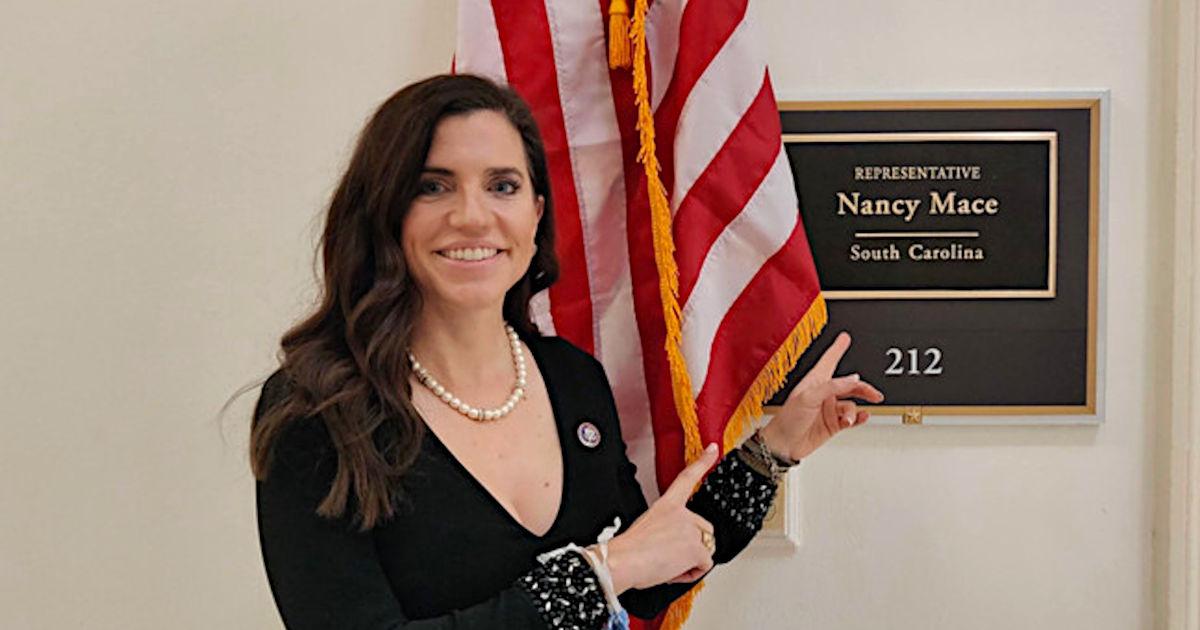
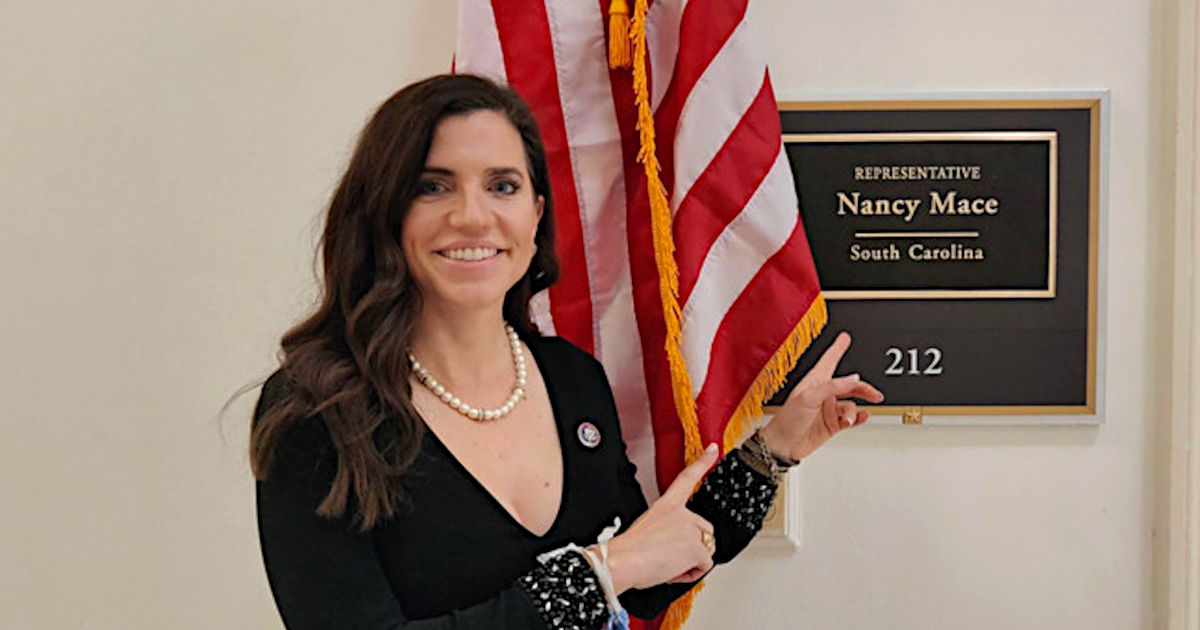
Image Credit: @nancymace (Twitter)
The House Now Has Democrat-led and Republican-led Marijuana Bills, the President is Still Opposed
In a positive turn of events for those supporting federal rescheduling of marijuana, a freshman congresswoman, who was the only Republican vote in favor of a cannabis research bill for veterans last Thursday (11/4), has presented a bill that is an alternative to the Democrats bill in The House’s Marijuana Opportunity, Reinvestment, and Expungement (MORE) Act.
Like the MORE Act, the Republican draft bill aims to decriminalize marijuana. Both proposals would also work to address previous incarcerations and enact criminal and social justice reforms, including the expungement of prior convictions. However, the Republican proposal has specifically mentioned that only those cannabis-related convictions with no-violent records will be eligible for expungement.
One important difference in what may become competing thoughts between this new bill and the MORE Act is the level of excise tax. The tax on cannabis as envisioned in the Republican-led draft bill is 3.75%. The MORE Act Proposes a 5% tax to start with a final rate of 8% over three years.
In the meantime, cannabis stocks have been outperforming the overall market since last Thursday. As of now, using diversified cannabis ETFs as a proxy (MJ, TOKE), stocks in this industry are up on average over 14%.
Oversight
The chief regulator in the market under the proposal would be the Treasury Department’s Alcohol and Tobacco Tax and Trade Bureau (TTB). The Food and Drug Administration (FDA) oversight would be limited to advising serving size, certifying designated state medical cannabis products, and approving pharmaceutical derivatives. The FDA would be prevented from banning the use of cannabis products for non-medical use.
Not unlike cigarettes or spirits, advertising could be restricted, and only adults (from 21 years old) will be legally permitted to consume recreational cannabis.
Revenue from taxation would aim to support grant programs for reintegration, law enforcement, and aids for newly licensed businesses and Small Business Administration (SBA) activities, which would need to treat marijuana businesses the same as other regulated markets.
Why it’s Important
The President personally opposes ending marijuana prohibitions. He does; however, support repairing the harm that harsh criminalization has had on individuals and families. This is the first Republican-led bill introduced in the House of Representatives; it could set up a debate over issues in the competing bill rather than just debate as to whether one side is for full decriminalization or against.
As for the President and Congress members who are still opposed to ending prohibition, a new Gallup poll shows that 68% of Americans support legalization. This is the same percentage as one year ago in the previous Gallup Poll. According to the poll, 50% of registered Republicans support legalization and 83% of Democrats support the measure.
Take-Away
Cannabis stocks moved up double digits after a Republican Bill emerged as an alternative to the Democrat’s More Act. This is the first of its kind on the Republican side and could change the discussion from “should we oppose” to, “let’s debate the differences.” One of the major differences is the excise tax level.
Suggested Reading:
 Marijuana, CBD, and Hemp Vapes Can Never Be Mailed to Customers
|
 Cannabis Related Businesses (CRB) New Access to Banking Services
|
 Federal Law Questions Still Loom for the Cannabis Industry
|
 Tradestation and Trump Media aren’t the Only Hot SPAC Stories
|
Sources:
https://news.gallup.com/poll/356939/support-legal-marijuana-holds-record-high.aspx
https://www.congress.gov/bill/117th-congress/house-bill/2916/
Stay up to date. Follow us:

|

