Schwazze Closes New Mexico Acquisition


Schwazze Closes New Mexico Acquisition

Research, News, and Market Data on Schwazze


Achieves Regional Operator Status with Acquisition of: Reynold Greenleaf & Associates, R. Greenleaf Organics, Medzen Services, Elemental Kitchen & Laboratories 

DENVER, Feb. 8, 2022 /CNW/ – Schwazze, (OTCQX: SHWZ) (“Schwazze” or the “Company”), one of the largest vertically integrated cannabis operators in Colorado, is pleased to announced that it has closed the transaction to acquire substantially all the operating assets of Reynold Greenleaf & Associates, LLC, and the equity of Elemental Kitchen & Laboratories, LLC. As part of the transaction, the Company will also have a right to purchase or acquire cannabis licenses held by Medzen Services, Inc., (“Medzen”) and R. Greenleaf Organics, Inc. (“RGO”), not-for-profit organizations that hold medical cannabis licenses in New Mexico (the assets and licenses described herein are referenced collectively as “Greenleaf”).

Total consideration for the acquisition was $42 million (subject to potential working capital adjustments) with a potential performance based earnout. The consideration consists of $25 million in cash paid at closing and $17 million in a 3-year seller note at 5% interest.

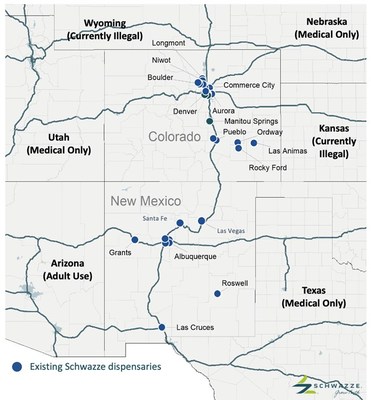
Greenleaf is a licensed medical cannabis provider with ten dispensaries, four cultivation facilities – three operating and one in development – and one manufacturing location. The dispensaries are located in Albuquerque, Santa Fe, Roswell, Las Cruces, Grants and Las Vegas, New Mexico.  Greenleaf’s approximately 70,000 square feet of cultivation as well as 6,000 square feet of manufacturing space are located in Albuquerque.  The State of New Mexico currently allows medical cannabis and has approved adult use recreational cannabis sales which by law begin no later than April 2022.  The New Mexico market is expected to grow approximately 300% in the next 5 years. (1)

With this acquisition, Schwazze is now a multi-state operator (“MSO”) with a total of 32 announced and acquired dispensaries, seven cultivation facilities and two manufacturing operations located in either Colorado or New Mexico. (see Figure #1)

With our regional expansion into New Mexico now complete, we have firmly graduated to the MSO category but with a differentiated regional focus which we and our stakeholders believe will be successful as we continue to position the Company for rapid expansion as the market opens for adult use consumption.  We welcome the Greenleaf team to Schwazze, particularly Willie Ford who joins us in an advisory capacity, and are excited about our future together,” stated Justin Dye, CEO & Chairman.

Willie Ford, Managing Director and Founder of Greenleaf added; “We are very excited to work with Schwazze given the depth of the team, their strong experience in retail and cannabis and their commitment to regional growth.  This will be critical for us as New Mexico makes the move into legalization of cannabis for recreational use in April of this year.

Figure #1 (CNW Group/Schwazze)

About Schwazze
Schwazze (OTCQX: SHWZ) is building a premier vertically integrated regional cannabis company with assets in Colorado and New Mexico and will continue to take its operating system to other states where it can develop a differentiated regional leadership position.  Schwazze is the parent company of a portfolio of leading cannabis businesses and brands spanning seed to sale.  The Company is committed to unlocking the full potential of the cannabis plant to improve the human condition.  Schwazze is anchored by a high-performance culture that combines customer-centric thinking and data science to test, measure, and drive decisions and outcomes.  The Company’s leadership team has deep expertise in retailing, wholesaling, and building consumer brands at Fortune 500 companies as well as in the cannabis sector.  Schwazze is passionate about making a difference in our communities, promoting diversity and inclusion, and doing our part to incorporate climate-conscious best practices.  Medicine Man Technologies, Inc. was Schwazze’s former operating trade name.  The corporate entity continues to be named Medicine Man Technologies, Inc.

Schwazze derives its name from the pruning technique of a cannabis plant to enhance plant structure and promote healthy growth.

Forward-Looking Statements
This press release contains “forward-looking statements.” Such statements may be preceded by the words “plan,” “will,” “may,”, “predicts,” or similar words. Forward-looking statements are not guarantees of future events or performance, are based on certain assumptions, and are subject to various known and unknown risks and uncertainties, many of which are beyond the Company’s control and cannot be predicted or quantified. Consequently, actual events and results may differ materially from those expressed or implied by such forward-looking statements. Such risks and uncertainties include, without limitation, risks and uncertainties associated with (i) our inability to manufacture our products and product candidates on a commercial scale on our own or in collaboration with third parties; (ii) difficulties in obtaining financing on commercially reasonable terms; (iii) changes in the size and nature of our competition; (iv) loss of one or more key executives or scientists; (v) difficulties in securing regulatory approval to market our products and product candidates; (vi) our ability to successfully execute our growth strategy in Colorado and outside the state, (vii) our ability to consummate the acquisition described in this press release or to identify and consummate future acquisitions that meet our criteria, (viii) our ability to successfully integrate acquired businesses and realize synergies therefrom, (ix) the ongoing COVID-19 pandemic, * the timing and extent of governmental stimulus programs, (xi) the uncertainty in the application of federal, state and local laws to our business, and any changes in such laws, and * out ability to satisfy the closing conditions for the private finding described in this press release. More detailed information about the Company and the risk factors that may affect the realization of forward-looking statements is set forth in the Company’s filings with the Securities and Exchange Commission (SEC), including the Company’s Annual Report on Form 10-K and its Quarterly Reports on Form 10-Q. Investors and security holders are urged to read these documents free of charge on the SEC’s website at http://www.sec.gov. The Company assumes no obligation to publicly update or revise its forward-looking statements as a result of new information, future events or otherwise except as required by law.

SOURCE Schwazze

Bowlero Corp. Announces $200 Million Share And Warrant Repurchase Program


Bowlero Corp. Announces $200 Million Share And Warrant Repurchase Program

Research, News, and Market Data on Bowlero


RICHMOND, Va., Feb. 07, 2022 (GLOBE NEWSWIRE) — Bowlero Corp. (NYSE: BOWL) (“Bowlero” or the “Company”), the world’s largest owner and operator of bowling centers, today announced that its board of directors has approved a repurchase program for up to $200 million of its outstanding shares of Class A common stock and warrants through February 3, 2024. Bowlero plans to repurchase its shares or warrants either in the open market or through privately negotiated transactions.

“The authorization to buy back up to $200 million of its shares of Class A common stock and warrants provides the Company with another mechanism to maximize long-term value for our shareholders,” said Tom Shannon, Bowlero Corp’s Chairman and CEO. “We remain confident in our strategy and believe that our current stock price represents a significant discount to the intrinsic value of the Company. We plan to continue to invest in the acquisition, building and converting of bowling centers, and the repurchase program announced today provides us with additional flexibility to create long-term value for investors. We remain committed to a disciplined capital allocation strategy, including investments in our strategic priorities and return of capital to our shareholders.”

Share and warrant repurchases and the timing thereof will depend upon market conditions, corporate liquidity requirements and priorities, debt agreement limitations and other factors as may be considered in the Company’s sole discretion. The share repurchase program does not obligate the Company to repurchase any particular amount of Class A common stock or warrants and may be suspended or discontinued at any time without notice.

About Bowlero Corp.
Bowlero Corp. is the worldwide leader in bowling entertainment. With more than 300 bowling centers across North America, Bowlero Corp. serves more than 26 million guests each year through a family of brands that includes Bowlero, Bowlmor Lanes, and AMF. Bowlero Corp. is also home to the Professional Bowlers Association, which it acquired in 2019 and which boasts thousands of members and millions of fans across the globe. For more information on Bowlero Corp., please visit BowleroCorp.com.

Forward Looking Statements

Some of the statements contained in this press release are forward-looking statements within the meaning of Section 27A of the Securities Act of 1933, as amended, and Section 21E of the Securities Exchange Act of 1934, as amended. These forward-looking statements are generally identified by the use of words such as “anticipate,” “believe,” “could,” “estimate,” “expect,” “intend,” “may,” “plan,” “potential,” “predict,” “project,” “should,” “target,” “will,” “would” and, in each case, their negative or other various or comparable terminology. These forward-looking statements reflect our views with respect to future events as of the date of this release and are based on our management’s current expectations, estimates, forecasts, projections, assumptions, beliefs and information. Although management believes that the expectations reflected in these forward-looking statements are reasonable, it can give no assurance that these expectations will prove to have been correct. All such forward-looking statements are subject to risks and uncertainties, many of which are outside of our control, and could cause future events or results to be materially different from those stated or implied in this document. It is not possible to predict or identify all such risks. These risks include, but are not limited to: the impact of COVID-19 or other adverse public health developments on our business; our ability to grow and manage growth profitably, maintain relationships with customers, compete within our industry and retain our key employees; changes in consumer preferences and buying patterns; the possibility that we may be adversely affected by other economic, business, and/or competitive factors; the risk that the market for our entertainment offerings may not develop on the timeframe or in the manner that we currently anticipate; general economic conditions and uncertainties affecting markets in which we operate and economic volatility that could adversely impact our business, including the COVID-19 pandemic and other factors described under the section titled “Risk Factors” in the registration statement on Form S-1 filed with the U.S. Securities and Exchange Commission (the “SEC”) by the Company, as well as other filings that the Company will make, or has made, with the SEC, such as Annual Reports on Form 10-K, Quarterly Reports on Form 10-Q and Current Reports on Form 8-K. These factors should not be construed as exhaustive and should be read in conjunction with the other cautionary statements that are included in this press release and in other filings. We expressly disclaim any obligation to publicly update or review any forward-looking statements, whether as a result of new information, future developments or otherwise, except as required by applicable law.

Contacts:

For Media:
Jillian Laufer
JLaufer@BowleroCorp.com

For Investors:
ICR, Inc.
Ryan Lawrence
Ryan.Lawrence@icrinc.com

Ashley DeSimone
Ashley.desimone@icrinc.com 

Source: Bowlero Corp

Release – Motorsport Games Announces rFactor 2 Content Update And User Interface Refresh


Motorsport Games Announces rFactor 2 Content Update And User Interface Refresh

Research, News, and Market Data on Motorsport Games


THIS IS THE FIRST OF FOUR QUARTERLY UPDATES PLANNED FOR THE SIMULATION DURING THE 2022 CALENDAR YEAR

MIAMI, Feb. 07, 2022 (GLOBE NEWSWIRE) — Motorsport Games Inc. (NASDAQ: MSGM) (“Motorsport Games”), a leading racing game developer, publisher and esports ecosystem provider of official motorsport racing series throughout the world, announces today the release of the first rFactor 2 content update and user interface refresh of 2022. This content drop, set to continue quarterly, includes the addition of brand new tracks and car chassis from the world of motorsport. The refreshed UI provides users an easy-to-navigate interface that contains all of the optionality necessary for players to create the most authentic driving experience. To view the release trailer, please click here.

The quarterly content and UI updates within rFactor 2 will breathe new life into the simulation platform on a regular basis, consistently providing players with the most robust offering for their virtual racing needs. Motorsport Games expects the updates to revamp and improve both the rFactor 2 platform and user experience. The team has already implemented rFactor 2 into its portfolio of live esports events, such as the 24 Hours of Le Mans Virtual Series and the recently-announced, inaugural INDYCAR-Motorsport Games Pro Challenge (kicking off February 9, 2022). Motorsport Games’ commitment to continuously upgrading and improving the overall experience within rFactor 2 will allow the simulation to remain as the top offering available to virtual SIM racers around the world.

“Acquiring rFactor 2 was a massive enhancement to our product offerings, as we believe that it is truly the best-in-class simulation platform on the market today,” said Zach Griffin, Director of Technology at Motorsport Games. “For the past year, we have not only sought to maintain rFactor 2’s customary level of excellence, but iterate and push it further forward in content, user interface and overall capability. We give thanks to the Studio397 team for developing such a robust product and we look forward to releasing future highly requested quarterly content and UI updates for our racers.”

“I have used rFactor 2 a tremendous amount to properly prepare for my real life races, as no other simulation provides the same level of authenticity and feel,” said Fernando Alonso, current Alpine Formula One driver, 2-time F1 World Drivers’ Champion, 2-time 24 Hours of Le Mans Champion and former Karting World Champion. “It is of the utmost importance that drivers feel ready to take on challenging circuits and the demands of specific cars and rFactor 2 gives me the tools to be completely comfortable behind the wheel at any track. It has and will continue to be an invaluable resource during my career.”

Content additions include the INDYCAR IR-18, the BMW M4 for the GT3 class, the Ligier JS P320 for the LMP3 roster and the iconic Daytona International Speedway, both the oval and road courses. INDYCAR’s IR-18 addition to rFactor 2 is the latest in a line of additions to replicate as many forms of motorsport as possible within the platform, with the INDYCAR-Motorsport Games Pro Challenge providing a showcase event. These cars will give users three highly requested and immensely popular options to race in. Lastly, the implementation of the Daytona International Speedway brings to life the premium endurance racing circuit in the U.S. to rFactor 2, allowing racers to achieve glory at one of the most historic venues in the entire world of motorsport. The track is entirely laser scanned to include as much detail as possible and the IR-18 features both Push to Pass and Weight Jacker.

“In my first year competing in INDYCAR, I learned quite quickly how demanding and tough the cars, competition and circuits are,” said Romain Grosjean, current Andretti Autosport driver in the NTT INDYCAR Series and former Haas and Lotus Formula One driver. “Having come directly from Formula One, where there are no oval circuits and the cars are quite different, without the time I spent training with rFactor 2, I would not have been able to achieve the level of success or familiarity I did last season. With another full year of racing coming up and new goals in sight, I cannot wait to test myself on rFactor 2 and be ahead of the competition as a result of its many offerings that are applicable to our real world racing experiences.”

“I have always been a massive fan of rFactor 2 and I am thrilled with the additions the team continues to make to ensure it stays as the pinnacle of racing simulations,” said Juan Pablo Montoya, current DragonSpeed driver in the IMSA WeatherTech SportsCar Championship and former winner of prestigious races such as the Monaco Grand Prix, Indianapolis 500 and 24 Hours of Daytona. “As someone who has competed in so many different series of motorsport throughout my career, it’s incredible to see each form authentically replicated within the virtual world. rFactor 2 and its team of developers continue to outdo themselves.”

All content additions and user interface upgrades are currently live within rFactor 2 starting today. Players can find a full breakdown of features here. The quarterly release cycle will proceed with content and build updates throughout 2022, with tentative release dates set for May, August and November of 2022.

To keep up with the latest Motorsport Game news, please visit www.motorsportgames.com and follow on TwitterInstagramFacebook and LinkedIn.

About Motorsport Games:
Motorsport Games, a Motorsport Network company, combines innovative and engaging video games with exciting esports competitions and content for racing fans and gamers around the globe. The Company is the officially licensed video game developer and publisher for iconic motorsport racing series across PC, PlayStation, Xbox, Nintendo Switch and mobile, including NASCAR, INDYCAR, 24 Hours of Le Mans and the British Touring Car Championship (“BTCC”). Motorsport Games is an award-winning esports partner of choice for 24 Hours of Le Mans, Formula E, BTCC, the FIA World Rallycross Championship and the eNASCAR Heat Pro League, among others.

Forward-Looking Statements:
Certain statements in this press release which are not historical facts are forward-looking statements within the meaning of Section 27A of the Securities Act of 1933, as amended, and Section 21E of the Securities Exchange Act of 1934, as amended, and are provided pursuant to the safe harbor provisions of the Private Securities Litigation Reform Act of 1995. Any statements in this press release that are not statements of historical fact may be deemed forward-looking statements. Words such as “continue,” “will,” “may,” “could,” “should,” “expect,” “expected,” “plans,” “intend,” “anticipate,” “believe,” “estimate,” “predict,” “potential,” and similar expressions are intended to identify such forward-looking statements. These forward-looking statements include, but are not limited to, statements concerning: (i) the expected benefits, content and features from rFactor 2 updates and user interfaces and from the rFactor 2 platform; and (ii) the Company’s expected timing of releasing future updates and user interfaces to rFactor 2, including, without limitation, the Company’s plans to release quarterly updates in the future. All forward-looking statements involve significant risks and uncertainties that could cause actual results to differ materially from those expressed or implied in the forward-looking statements, many of which are generally outside the control of Motorsport Games and are difficult to predict. Examples of such risks and uncertainties include, but are not limited to the Company experiencing difficulties and/or delays in releasing future rFactor 2 updates and interfaces and/or enhancing the quality of its product offerings that could negatively impact its future development plans, such as due to higher than anticipated costs incurred in developing, launching and continuing to enhance and improve such products and/or less than anticipated consumer acceptance of the Company’s products and/or difficulties, delays in or unanticipated events that may impact the timing and scope of new updates and user interfaces, such as due to delays and higher than anticipated expenses related to the ongoing and prolonged COVID-19 pandemic and related economic lockdowns and government mandates; unanticipated operating costs, transaction costs and actual or contingent liabilities; adverse effects of increased competition; and unanticipated changes in consumer behavior, including as a result of general economic factors, such as increased inflation. Factors other than those referred to above could also cause Motorsport Games’ results to differ materially from expected results. All forward-looking statements involve significant risks and uncertainties that could cause actual results to differ materially from those expressed or implied in the forward-looking statements, many of which are generally outside the control of Motorsport Games and are difficult to predict. Factors other than those referred to above could also cause Motorsport Games’ results to differ materially from expected results. Additional factors that could cause actual results to differ materially from those expressed or implied in the forward-looking statements can be found in Motorsport Games’ filings with the SEC, which may be found at www.sec.gov and at ir.motorsportgames.com, including its Annual Report on Form 10-K for the fiscal year ended December 31, 2020, its Quarterly Reports on Form 10-Q filed with the SEC during 2021, as well as in its subsequent filings with the SEC. Motorsport Games anticipates that subsequent events and developments may cause its plans, intentions and expectations to change. Motorsport Games assumes no obligation, and it specifically disclaims any intention or obligation, to update any forward-looking statements, whether as a result of new information, future events or otherwise, except as expressly required by law. Forward-looking statements speak only as of the date they are made and should not be relied upon as representing Motorsport Games’ plans and expectations as of any subsequent date. Additionally, the business and financial materials and any other statement or disclosure on, or made available through, Motorsport Games’ website or other websites referenced or linked to this press release shall not be incorporated by reference into this press release.

Website and Social Media Disclosure:

Investors and others should note that we announce material financial information to our investors using our investor relations website (ir.motorsportgames.com), SEC filings, press releases, public conference calls and webcasts. We use these channels, as well as social media and blogs, to communicate with our investors and the public about our company and our products. It is possible that the information we post on our websites, social media and blogs could be deemed to be material information. Therefore, we encourage investors, the media and others interested in our company to review the information we post on the websites, social media channels and blogs, including the following (which list we will update from time to time on our investor relations website):

Websites Social Media
motorsportgames.com Twitter: @msportgames & @traxiongg
traxion.gg Instagram: msportgames & traxiongg
motorsport.com Facebook: Motorsport Games & traxiongg
  LinkedIn: Motorsport Games
  Twitch: traxiongg
  Reddit: traxiongg

The contents of these websites and social media channels are not part of, nor will they be incorporated by reference into, this press release.

Investors:
Ashley DeSimone
Ashley.Desimone@icrinc.com

Press:
ASTRSK PR
motorsportgames@astrskpr.com

Motorsport Games Announces rFactor 2 Content Update And User Interface Refresh


Motorsport Games Announces rFactor 2 Content Update And User Interface Refresh

Research, News, and Market Data on Motorsport Games


THIS IS THE FIRST OF FOUR QUARTERLY UPDATES PLANNED FOR THE SIMULATION DURING THE 2022 CALENDAR YEAR

MIAMI, Feb. 07, 2022 (GLOBE NEWSWIRE) — Motorsport Games Inc. (NASDAQ: MSGM) (“Motorsport Games”), a leading racing game developer, publisher and esports ecosystem provider of official motorsport racing series throughout the world, announces today the release of the first rFactor 2 content update and user interface refresh of 2022. This content drop, set to continue quarterly, includes the addition of brand new tracks and car chassis from the world of motorsport. The refreshed UI provides users an easy-to-navigate interface that contains all of the optionality necessary for players to create the most authentic driving experience. To view the release trailer, please click here.

The quarterly content and UI updates within rFactor 2 will breathe new life into the simulation platform on a regular basis, consistently providing players with the most robust offering for their virtual racing needs. Motorsport Games expects the updates to revamp and improve both the rFactor 2 platform and user experience. The team has already implemented rFactor 2 into its portfolio of live esports events, such as the 24 Hours of Le Mans Virtual Series and the recently-announced, inaugural INDYCAR-Motorsport Games Pro Challenge (kicking off February 9, 2022). Motorsport Games’ commitment to continuously upgrading and improving the overall experience within rFactor 2 will allow the simulation to remain as the top offering available to virtual SIM racers around the world.

“Acquiring rFactor 2 was a massive enhancement to our product offerings, as we believe that it is truly the best-in-class simulation platform on the market today,” said Zach Griffin, Director of Technology at Motorsport Games. “For the past year, we have not only sought to maintain rFactor 2’s customary level of excellence, but iterate and push it further forward in content, user interface and overall capability. We give thanks to the Studio397 team for developing such a robust product and we look forward to releasing future highly requested quarterly content and UI updates for our racers.”

“I have used rFactor 2 a tremendous amount to properly prepare for my real life races, as no other simulation provides the same level of authenticity and feel,” said Fernando Alonso, current Alpine Formula One driver, 2-time F1 World Drivers’ Champion, 2-time 24 Hours of Le Mans Champion and former Karting World Champion. “It is of the utmost importance that drivers feel ready to take on challenging circuits and the demands of specific cars and rFactor 2 gives me the tools to be completely comfortable behind the wheel at any track. It has and will continue to be an invaluable resource during my career.”

Content additions include the INDYCAR IR-18, the BMW M4 for the GT3 class, the Ligier JS P320 for the LMP3 roster and the iconic Daytona International Speedway, both the oval and road courses. INDYCAR’s IR-18 addition to rFactor 2 is the latest in a line of additions to replicate as many forms of motorsport as possible within the platform, with the INDYCAR-Motorsport Games Pro Challenge providing a showcase event. These cars will give users three highly requested and immensely popular options to race in. Lastly, the implementation of the Daytona International Speedway brings to life the premium endurance racing circuit in the U.S. to rFactor 2, allowing racers to achieve glory at one of the most historic venues in the entire world of motorsport. The track is entirely laser scanned to include as much detail as possible and the IR-18 features both Push to Pass and Weight Jacker.

“In my first year competing in INDYCAR, I learned quite quickly how demanding and tough the cars, competition and circuits are,” said Romain Grosjean, current Andretti Autosport driver in the NTT INDYCAR Series and former Haas and Lotus Formula One driver. “Having come directly from Formula One, where there are no oval circuits and the cars are quite different, without the time I spent training with rFactor 2, I would not have been able to achieve the level of success or familiarity I did last season. With another full year of racing coming up and new goals in sight, I cannot wait to test myself on rFactor 2 and be ahead of the competition as a result of its many offerings that are applicable to our real world racing experiences.”

“I have always been a massive fan of rFactor 2 and I am thrilled with the additions the team continues to make to ensure it stays as the pinnacle of racing simulations,” said Juan Pablo Montoya, current DragonSpeed driver in the IMSA WeatherTech SportsCar Championship and former winner of prestigious races such as the Monaco Grand Prix, Indianapolis 500 and 24 Hours of Daytona. “As someone who has competed in so many different series of motorsport throughout my career, it’s incredible to see each form authentically replicated within the virtual world. rFactor 2 and its team of developers continue to outdo themselves.”

All content additions and user interface upgrades are currently live within rFactor 2 starting today. Players can find a full breakdown of features here. The quarterly release cycle will proceed with content and build updates throughout 2022, with tentative release dates set for May, August and November of 2022.

To keep up with the latest Motorsport Game news, please visit www.motorsportgames.com and follow on TwitterInstagramFacebook and LinkedIn.

About Motorsport Games:
Motorsport Games, a Motorsport Network company, combines innovative and engaging video games with exciting esports competitions and content for racing fans and gamers around the globe. The Company is the officially licensed video game developer and publisher for iconic motorsport racing series across PC, PlayStation, Xbox, Nintendo Switch and mobile, including NASCAR, INDYCAR, 24 Hours of Le Mans and the British Touring Car Championship (“BTCC”). Motorsport Games is an award-winning esports partner of choice for 24 Hours of Le Mans, Formula E, BTCC, the FIA World Rallycross Championship and the eNASCAR Heat Pro League, among others.

Forward-Looking Statements:
Certain statements in this press release which are not historical facts are forward-looking statements within the meaning of Section 27A of the Securities Act of 1933, as amended, and Section 21E of the Securities Exchange Act of 1934, as amended, and are provided pursuant to the safe harbor provisions of the Private Securities Litigation Reform Act of 1995. Any statements in this press release that are not statements of historical fact may be deemed forward-looking statements. Words such as “continue,” “will,” “may,” “could,” “should,” “expect,” “expected,” “plans,” “intend,” “anticipate,” “believe,” “estimate,” “predict,” “potential,” and similar expressions are intended to identify such forward-looking statements. These forward-looking statements include, but are not limited to, statements concerning: (i) the expected benefits, content and features from rFactor 2 updates and user interfaces and from the rFactor 2 platform; and (ii) the Company’s expected timing of releasing future updates and user interfaces to rFactor 2, including, without limitation, the Company’s plans to release quarterly updates in the future. All forward-looking statements involve significant risks and uncertainties that could cause actual results to differ materially from those expressed or implied in the forward-looking statements, many of which are generally outside the control of Motorsport Games and are difficult to predict. Examples of such risks and uncertainties include, but are not limited to the Company experiencing difficulties and/or delays in releasing future rFactor 2 updates and interfaces and/or enhancing the quality of its product offerings that could negatively impact its future development plans, such as due to higher than anticipated costs incurred in developing, launching and continuing to enhance and improve such products and/or less than anticipated consumer acceptance of the Company’s products and/or difficulties, delays in or unanticipated events that may impact the timing and scope of new updates and user interfaces, such as due to delays and higher than anticipated expenses related to the ongoing and prolonged COVID-19 pandemic and related economic lockdowns and government mandates; unanticipated operating costs, transaction costs and actual or contingent liabilities; adverse effects of increased competition; and unanticipated changes in consumer behavior, including as a result of general economic factors, such as increased inflation. Factors other than those referred to above could also cause Motorsport Games’ results to differ materially from expected results. All forward-looking statements involve significant risks and uncertainties that could cause actual results to differ materially from those expressed or implied in the forward-looking statements, many of which are generally outside the control of Motorsport Games and are difficult to predict. Factors other than those referred to above could also cause Motorsport Games’ results to differ materially from expected results. Additional factors that could cause actual results to differ materially from those expressed or implied in the forward-looking statements can be found in Motorsport Games’ filings with the SEC, which may be found at www.sec.gov and at ir.motorsportgames.com, including its Annual Report on Form 10-K for the fiscal year ended December 31, 2020, its Quarterly Reports on Form 10-Q filed with the SEC during 2021, as well as in its subsequent filings with the SEC. Motorsport Games anticipates that subsequent events and developments may cause its plans, intentions and expectations to change. Motorsport Games assumes no obligation, and it specifically disclaims any intention or obligation, to update any forward-looking statements, whether as a result of new information, future events or otherwise, except as expressly required by law. Forward-looking statements speak only as of the date they are made and should not be relied upon as representing Motorsport Games’ plans and expectations as of any subsequent date. Additionally, the business and financial materials and any other statement or disclosure on, or made available through, Motorsport Games’ website or other websites referenced or linked to this press release shall not be incorporated by reference into this press release.

Website and Social Media Disclosure:

Investors and others should note that we announce material financial information to our investors using our investor relations website (ir.motorsportgames.com), SEC filings, press releases, public conference calls and webcasts. We use these channels, as well as social media and blogs, to communicate with our investors and the public about our company and our products. It is possible that the information we post on our websites, social media and blogs could be deemed to be material information. Therefore, we encourage investors, the media and others interested in our company to review the information we post on the websites, social media channels and blogs, including the following (which list we will update from time to time on our investor relations website):

Websites Social Media
motorsportgames.com Twitter: @msportgames & @traxiongg
traxion.gg Instagram: msportgames & traxiongg
motorsport.com Facebook: Motorsport Games & traxiongg
  LinkedIn: Motorsport Games
  Twitch: traxiongg
  Reddit: traxiongg

The contents of these websites and social media channels are not part of, nor will they be incorporated by reference into, this press release.

Investors:
Ashley DeSimone
Ashley.Desimone@icrinc.com

Press:
ASTRSK PR
motorsportgames@astrskpr.com

Verifying Cannabis COAs with NFTs


Image: ACS Laboratories


Can Marijuana Businesses Benefit from NFTs?


Non-fungible tokens (NFT) are developing a growing role in cannabis businesses. While cryptocurrency may still be used to carry out transactions without involving a bank, NFTs are being adopted to create interest in brands and to verify they are tested and are bonafide by validating the Certificate of Authenticity (COA).

Branding

As a business, cannabis sales are like many others. First, produce a product people want, then build followers of the product. Many large popular companies have adopted the use of NFTs to build their brand and reach different consumer types. One example of this is the Under Armour Curry Flow Sneaker. In December, when brand ambassador Stephen Curry broke the NBA’s three-point record, Under Armour (NYSE: UAA) celebrated by releasing a collection of nonfungible tokens (NFTs) related to the shoe.

Gary Vaynerchuk, motivational influencer and founder of The Wine Library recently announced he will open a restaurant where patrons must purchase NFTs to gain membership.

Adidas and the Bored Ape Yacht Club have partnered to offer NFTs that allow owners exclusive access to buy real-world physical products.  Another shoe company, Nike (NYSE:NKE) bought RTFKT, which makes NFTs and shoes only used within the metaverse. In this way users who are seen at home just doing it in their Nikes can portray themselves similarly in the metaverse.

As for Cannabis companies, It’s easy to understand how the attention received by NFTs can be used to help stand out among competitors. Within the metaverse, consumers see the same brands that exist in the physical world; added recognition can make the products more desirable in both. Jeffrey Welsh, an intellectual and entertainment lawyer for Denver-based law firm Vicente Sederberg, said the “low-hanging fruit” for marijuana businesses is to build memberships around NFTs that are associated with cool or unique digital assets that, in turn, are connected to products such as popular or exotic strains.” Sederberg concedes, “We haven’t yet seen the power for NFTs in cannabis.”

Crypto-Hesitancy

As with anything new, despite mainstream companies embracing NFTs and using them within their marketing and brand recognition strategies, there are skeptics of tokens. The primary argument against the use is that the market is new so assessing value is difficult. It is possible for owners to wind up with something down the road of little or no value. That would not be a positive for customer relations.

Verifying COAs With NFTs

ACS Laboratory is a large marijuana and hemp test lab in Boca Raton, Florida. In November, the lab launched a certificate of analysis (COA) on a cannabis strain as an NFT during the Art Basel Miami Beach annual fair.

A COA includes all details of a product or artwork to help verify its origin. Within the context of cannabis products, an NFT of the COA can prove ownership and verify chemical makeup.

ACS created the NFT by partnering with Blockticity, which describes itself as a “leader in guaranteed certificates of authenticity for the most valuable of possessions.” With this, last December, the first-ever COA for marijuana was encrypted forever on the blockchain as an NFT for a COA. “The blockchain is the future for cannabis and hemp to secure the integrity of the analytical results and the COA, determine permissions and eventually to include payments,” said Roger Brown, president of ACS Laboratories.

Brown said he first thought, “Who is going to buy a digital picture?” He said he later understood that the NFT could help authenticate his companies authentification. ACS now gets calls regularly with questions about the validity of test results.

How it Works

 Using recent innovations, a business or individual can scan a QR code that brings up an NFT of the COA they are interested in. There they have the ability to understand everything about the product. ACS doesn’t think of NFT creation as a revenue stream. The NFT serves to improve consumer confidence of one brand over another as consumers or wholesalers make purchasing decisions

There is now a team at ACS whose job it is to get COAs on blockchain via token technology.

Take-Away

Two very young businesses are finding they may be able to help each other. The Cannabis industry which once only benefitted from the blockchain by using digital currency now is seeing the benefits of non-fungible tokens.  The NFTs are being adopted for brand awareness and recognition as sellers’ marketing departments understand the power of building communities. The industry can also benefit from being able to prove authenticity on everything about the products. This is particularly important for some with ingested, smoked, or vaped consumables. Perhaps other consumable products will also begin using blockchain verification.

Suggested Reading


The Cannabis Path to Legalization and its Implications for Psychedelics


Clarence Thomas’ Statement on Half-in, Half-out Marijuana Laws


NFTs are Being Used to Unlock Revenue in Old Industries


NFTs Explained, What They Are, Why the Excitement


Sources

https://mjbizdaily.com/are-nfts-a-scam-or-a-smart-play-for-marijuana-companies/?utm_medium=email&utm_source=newsletter&utm_campaign=MJD_20220202_NEWS_Daily

https://artbasel.com/stories/art-market-report-2021

https://www.marketingdive.com/news/under-armours-wearable-nfts-honor-steph-curry-shattering-3-point-record/616472/

https://www.voguebusiness.com/technology/adidas-reveals-new-nft-project-with-bored-ape-yacht-club

https://www.entrepreneur.com/article/415203

https://www.theverge.com/22833369/nike-rtfkt-nft-sneaker-shoe-metaverse-company

https://www.cnbc.com/2022/01/12/kim-kardashian-and-floyd-mayweather-sued-over-alleged-crypto-scam.html

https://app.poap.xyz/r/token/2227842

https://www.tappancollective.com/pages/about-our-nft-coa

https://www.prnewswire.com/news-releases/acs-laboratory-launches-first-national-hemp-client-coa-nft-301433872.html

https://www.forbes.com/sites/chrisroberts/2021/03/01/would-you-buy-digital-marijuana-blockchain-based-nfts-arrive-in-cannabis/?sh=73b4ed030a3e


Stay up to date. Follow us:


Bassett Furniture (BSET) – What Does the Sale of Zenith Portend? Reports 4Q21 Results

Wednesday, February 02, 2022

Bassett Furniture (BSET)
What Does the Sale of Zenith Portend? Reports 4Q21 Results

Bassett Furniture Industries, Inc. is a leading manufacturer and marketer of high-quality home furnishings. With 96 company- and licensee-owned stores located throughout the United States, Bassett has leveraged its strong brand name in furniture into a network of corporate and licensed stores that focus on providing consumers with a friendly environment for buying furniture and accessories. Bassett’s retail strategy includes stylish, custom-built furniture that features the latest on-trend furniture styles, free in-home design visits, and coordinated decorating accessories. The Company also has a traditional wholesale business with more than 700 accounts on the open market and a logistics business specializing in the transport and warehousing of home furnishings. In addition, Bassett sells its products through its website at www.bassettfurniture.com. With revenues in excess of $450 million, approximately 75% of its goods are manufactured, assembled and/or finished in factories located in Virginia, North Carolina and Alabama with the remainder primarily sourced from Asia. The Company was founded in 1902 and is based in Bassett, Virginia.

Joe Gomes, Senior Research Analyst, Noble Capital Markets, Inc.

Joshua Zoepfel, Research Associate, Noble Capital Markets, Inc.

Refer to the full report for the price target, fundamental analysis, and rating.

    4Q21 Results. Revenue was $129.9 million, up 9.7% y-o-y and up 14.3% compared to the non-COVID impacted 4Q19. Backlog fell modestly sequentially to $90.1 million. Bassett reported net income of $5.0 million, or $0.52 per share, compared to net income of $6.5 million, or $0.65 per share, in the prior year. We had forecast revenue of $122 million and EPS of $0.54.

    Zenith Sale.  Bassett announced a proposed sale of its logistics arm, Zenith Freight Lines to J.B. Hunt for $87 million, or an estimated $65 million after taxes. Bassett will work closely with J.B. Hunt to build out a nationwide network of regional fulfillment centers with a goal of delivering goods faster and at reduced cost …


This Company Sponsored Research is provided by Noble Capital Markets, Inc., a FINRA and S.E.C. registered broker-dealer (B/D).

*Analyst certification and important disclosures included in the full report. NOTE: investment decisions should not be based upon the content of this research summary.  Proper due diligence is required before making any investment decision. 

RCI Hospitality (RICK) – Follow the Cash Flow Initiation on RCI Hospitality Holdings

Tuesday, February 01, 2022

RCI Hospitality (RICK)
Follow the Cash Flow; Initiation on RCI Hospitality Holdings

RCI Hospitality Holdings, Inc. through its subsidiaries owns and operates establishments that offer live adult entertainment, restaurant, and/or bar operations. The company also owns and operates a communication company serving the adult nightclubs industry. RCI’s operating business segments includes Nightclubs and Bombshells restaurants and bars. It operates nightclubs through the following brands: Rick’s Cabaret, Vivid Cabaret, Tootsie’s Cabaret, Club Onyx, and Jaguars Club. In the restaurants segment, the company is building a chain of Bombshells Restaurants and Sports Bars in Dallas, Austin, and Houston, Texas.

Joe Gomes, Senior Research Analyst, Noble Capital Markets, Inc.

Joshua Zoepfel, Research Associate, Noble Capital Markets, Inc.

Refer to the full report for the price target, fundamental analysis, and rating.

    Initiation. We are initiating research coverage on RCI Hospitality Holdings, Inc. RCI is the only publicly traded Gentlemen’s club operator with a fast growing military themed sports bar and restaurant chain. We believe the unique combination, with significant inorganic and organic growth opportunities, presents investors with a favorable risk/reward opportunity.

    A Cash Flow Focus.  Management employs a disciplined cash flow focus, seeking 25-33% cash-on-cash returns for both the Gentlemen’s clubs and Bombshells business, with stock repurchases employed when FCF yield exceeds 10%. The goal is to drive 10-15% compound annual FCF per share growth …


This Company Sponsored Research is provided by Noble Capital Markets, Inc., a FINRA and S.E.C. registered broker-dealer (B/D).

*Analyst certification and important disclosures included in the full report. NOTE: investment decisions should not be based upon the content of this research summary.  Proper due diligence is required before making any investment decision. 

Release – Schwazze Adds Key Hires To Senior Leadership Team


Schwazze Adds Key Hires To Senior Leadership Team

Research, News, and Market Data on Schwazze


Ramps Up for Growth, Expanding Manufacturing, Information Technology and Cultivation Expertise

DENVER, Feb. 1, 2022 /CNW/ – Schwazze, (OTCQX: SHWZ) (“Schwazze” or the “Company”), is pleased to announce the addition of key roles to support the Company’s significant expansion within manufacturing, cultivation, and information technology.

As Vice President of Manufacturing and Supply Chain, David Kaufman joined the leadership team from Carlex Glass where he was responsible for global operations. Kaufman is a seasoned executive with experience identifying and yielding multimillion-dollar improvements in operations and supply chain through LEAN manufacturing, procurement, and distribution strategies. He had full P&L responsibility for the European business segment where he led a significant turnaround in operating performance and financial improvement. Kaufman holds a distinguished certificate in general management from the Darden School of Business at the University of Virginia, MBA from the University of St. Francis, and BS in Chemistry from Purdue University.

Steven Liedtke joins Schwazze as Vice President, Information Services. Liedtke is an experienced Information Technology Executive with more than 25 years of leadership experience across industry sectors such as: CPG, Food & Beverage, Retail, and High Technology industries, including The Hain Celestial Group, The Whitewave Foods Company and Maines Group. Technology is a key pillar in Schwazze’s growth strategy to help drive digital transformation, operational efficiencies, and synergies. With his M&A systems integration experience, Liedtke brings the expertise Schwazze needs in this period of significant organic and new acquisition growth. 

The third key addition to the leadership team is in cannabis cultivation. Robert Piziali joins Schwazze as Vice President, Cultivation, overseeing its grow operations. Piziali was formerly the President of FarmPerfect, a cannabis farm management company based in Mendocino County, CA. He has 20 years of experience in operations management and, prior to cannabis, comes from the wine industry where he was involved in all aspects – from the vineyard to the cellar, to tasting rooms and retail operations. He was also the Co-Founder and President of FLO Wine, which he launched nationally in chains including Wal-Mart, Costco, Target, Jewel-Osco, and Albertsons. Piziali has an MBA from University of North Carolina, Chapel Hill and a BA in Psychology from Rollins College.

We are excited about the key additions to our operational leadership team. Kaufman, Piziali and Liedtke bring a wealth of knowledge and experience in their respective areas which are both critical to Schwazze’s growth strategy in manufacturing, grow operations, distribution and digital commerce,” said Nirup Krishnamurthy, Chief Operating Officer. “We continue to be proud of what we’ve built in Colorado since 2019 and look forward to our continued expansion.”

About Schwazze
Schwazze (OTCQX: SHWZ) is building a premier vertically integrated regional cannabis company with assets in Colorado and New Mexico and will continue to take its operating system to other states where it can develop a differentiated regional leadership position. Schwazze is the parent company of a portfolio of leading cannabis businesses and brands spanning seed to sale. The Company is committed to unlocking the full potential of the cannabis plant to improve the human condition. Schwazze is anchored by a high-performance culture that combines customer-centric thinking and data science to test, measure, and drive decisions and outcomes. The Company’s leadership team has deep expertise in retailing, wholesaling, and building consumer brands at Fortune 500 companies as well as in the cannabis sector. Schwazze is passionate about making a difference in our communities, promoting diversity and inclusion, and doing our part to incorporate climate-conscious best practices. Medicine Man Technologies, Inc. was Schwazze’s former operating trade name. The corporate entity continues to be named Medicine Man Technologies, Inc.

Schwazze derives its name from the pruning technique of a cannabis plant to enhance plant structure and promote healthy growth.

Forward-Looking Statements
This press release contains “forward-looking statements.” Such statements may be preceded by the words “may,” “estimates”, “predicts,” or similar words. Forward-looking statements are not guarantees of future performance, are based on certain assumptions, and are subject to various known and unknown risks and uncertainties, many of which are beyond the Company’s control and cannot be predicted or quantified. Consequently, actual results may differ materially from those expressed or implied by such forward-looking statements. Such risks and uncertainties include, without limitation, risks and uncertainties associated with (i) our inability to manufacture our products and product candidates on a commercial scale on our own or in collaboration with third parties; (ii) difficulties in obtaining financing on commercially reasonable terms; (iii) changes in the size and nature of our competition; (iv) loss of one or more key executives or scientists; (v) difficulties in securing regulatory approval to market our products and product candidates; (vi) our ability to successfully execute our growth strategy in Colorado and outside the state, (vii) our ability to identify and consummate future acquisitions that meet our criteria, (viii) our ability to successfully integrate acquired businesses and realize synergies therefrom, (ix) the actual revenues derived from the Company’s Star Buds assets, * the Company’s actual revenue and adjusted EBITDA for 2021, (xi) the Company’s ability to generate positive cash flow for the rest of 2021 (xii) the ongoing COVID-19 pandemic, (xiii) the timing and extent of governmental stimulus programs, and (xiv) the uncertainty in the application of federal, state and local laws to our business, and any changes in such laws. More detailed information about the Company and the risk factors that may affect the realization of forward-looking statements is set forth in the Company’s filings with the Securities and Exchange Commission (SEC), including the Company’s Annual Report on Form 10-K and its Quarterly Reports on Form 10-Q. Investors and security holders are urged to read these documents free of charge on the SEC’s website at http://www.sec.gov. The Company assumes no obligation to publicly update or revise its forward-looking statements as a result of new information, future events or otherwise except as required by law.

SOURCE Schwazze

Schwazze Adds Key Hires To Senior Leadership Team


Schwazze Adds Key Hires To Senior Leadership Team

Research, News, and Market Data on Schwazze


Ramps Up for Growth, Expanding Manufacturing, Information Technology and Cultivation Expertise

DENVER, Feb. 1, 2022 /CNW/ – Schwazze, (OTCQX: SHWZ) (“Schwazze” or the “Company”), is pleased to announce the addition of key roles to support the Company’s significant expansion within manufacturing, cultivation, and information technology.

As Vice President of Manufacturing and Supply Chain, David Kaufman joined the leadership team from Carlex Glass where he was responsible for global operations. Kaufman is a seasoned executive with experience identifying and yielding multimillion-dollar improvements in operations and supply chain through LEAN manufacturing, procurement, and distribution strategies. He had full P&L responsibility for the European business segment where he led a significant turnaround in operating performance and financial improvement. Kaufman holds a distinguished certificate in general management from the Darden School of Business at the University of Virginia, MBA from the University of St. Francis, and BS in Chemistry from Purdue University.

Steven Liedtke joins Schwazze as Vice President, Information Services. Liedtke is an experienced Information Technology Executive with more than 25 years of leadership experience across industry sectors such as: CPG, Food & Beverage, Retail, and High Technology industries, including The Hain Celestial Group, The Whitewave Foods Company and Maines Group. Technology is a key pillar in Schwazze’s growth strategy to help drive digital transformation, operational efficiencies, and synergies. With his M&A systems integration experience, Liedtke brings the expertise Schwazze needs in this period of significant organic and new acquisition growth. 

The third key addition to the leadership team is in cannabis cultivation. Robert Piziali joins Schwazze as Vice President, Cultivation, overseeing its grow operations. Piziali was formerly the President of FarmPerfect, a cannabis farm management company based in Mendocino County, CA. He has 20 years of experience in operations management and, prior to cannabis, comes from the wine industry where he was involved in all aspects – from the vineyard to the cellar, to tasting rooms and retail operations. He was also the Co-Founder and President of FLO Wine, which he launched nationally in chains including Wal-Mart, Costco, Target, Jewel-Osco, and Albertsons. Piziali has an MBA from University of North Carolina, Chapel Hill and a BA in Psychology from Rollins College.

We are excited about the key additions to our operational leadership team. Kaufman, Piziali and Liedtke bring a wealth of knowledge and experience in their respective areas which are both critical to Schwazze’s growth strategy in manufacturing, grow operations, distribution and digital commerce,” said Nirup Krishnamurthy, Chief Operating Officer. “We continue to be proud of what we’ve built in Colorado since 2019 and look forward to our continued expansion.”

About Schwazze
Schwazze (OTCQX: SHWZ) is building a premier vertically integrated regional cannabis company with assets in Colorado and New Mexico and will continue to take its operating system to other states where it can develop a differentiated regional leadership position. Schwazze is the parent company of a portfolio of leading cannabis businesses and brands spanning seed to sale. The Company is committed to unlocking the full potential of the cannabis plant to improve the human condition. Schwazze is anchored by a high-performance culture that combines customer-centric thinking and data science to test, measure, and drive decisions and outcomes. The Company’s leadership team has deep expertise in retailing, wholesaling, and building consumer brands at Fortune 500 companies as well as in the cannabis sector. Schwazze is passionate about making a difference in our communities, promoting diversity and inclusion, and doing our part to incorporate climate-conscious best practices. Medicine Man Technologies, Inc. was Schwazze’s former operating trade name. The corporate entity continues to be named Medicine Man Technologies, Inc.

Schwazze derives its name from the pruning technique of a cannabis plant to enhance plant structure and promote healthy growth.

Forward-Looking Statements
This press release contains “forward-looking statements.” Such statements may be preceded by the words “may,” “estimates”, “predicts,” or similar words. Forward-looking statements are not guarantees of future performance, are based on certain assumptions, and are subject to various known and unknown risks and uncertainties, many of which are beyond the Company’s control and cannot be predicted or quantified. Consequently, actual results may differ materially from those expressed or implied by such forward-looking statements. Such risks and uncertainties include, without limitation, risks and uncertainties associated with (i) our inability to manufacture our products and product candidates on a commercial scale on our own or in collaboration with third parties; (ii) difficulties in obtaining financing on commercially reasonable terms; (iii) changes in the size and nature of our competition; (iv) loss of one or more key executives or scientists; (v) difficulties in securing regulatory approval to market our products and product candidates; (vi) our ability to successfully execute our growth strategy in Colorado and outside the state, (vii) our ability to identify and consummate future acquisitions that meet our criteria, (viii) our ability to successfully integrate acquired businesses and realize synergies therefrom, (ix) the actual revenues derived from the Company’s Star Buds assets, * the Company’s actual revenue and adjusted EBITDA for 2021, (xi) the Company’s ability to generate positive cash flow for the rest of 2021 (xii) the ongoing COVID-19 pandemic, (xiii) the timing and extent of governmental stimulus programs, and (xiv) the uncertainty in the application of federal, state and local laws to our business, and any changes in such laws. More detailed information about the Company and the risk factors that may affect the realization of forward-looking statements is set forth in the Company’s filings with the Securities and Exchange Commission (SEC), including the Company’s Annual Report on Form 10-K and its Quarterly Reports on Form 10-Q. Investors and security holders are urged to read these documents free of charge on the SEC’s website at http://www.sec.gov. The Company assumes no obligation to publicly update or revise its forward-looking statements as a result of new information, future events or otherwise except as required by law.

SOURCE Schwazze

RCI Hospitality (RICK) – Follow the Cash Flow; Initiation on RCI Hospitality Holdings

Tuesday, February 01, 2022

RCI Hospitality (RICK)
Follow the Cash Flow; Initiation on RCI Hospitality Holdings

RCI Hospitality Holdings, Inc. through its subsidiaries owns and operates establishments that offer live adult entertainment, restaurant, and/or bar operations. The company also owns and operates a communication company serving the adult nightclubs industry. RCI’s operating business segments includes Nightclubs and Bombshells restaurants and bars. It operates nightclubs through the following brands: Rick’s Cabaret, Vivid Cabaret, Tootsie’s Cabaret, Club Onyx, and Jaguars Club. In the restaurants segment, the company is building a chain of Bombshells Restaurants and Sports Bars in Dallas, Austin, and Houston, Texas.

Joe Gomes, Senior Research Analyst, Noble Capital Markets, Inc.

Joshua Zoepfel, Research Associate, Noble Capital Markets, Inc.

Refer to the full report for the price target, fundamental analysis, and rating.

    Initiation. We are initiating research coverage on RCI Hospitality Holdings, Inc. RCI is the only publicly traded Gentlemen’s club operator with a fast growing military themed sports bar and restaurant chain. We believe the unique combination, with significant inorganic and organic growth opportunities, presents investors with a favorable risk/reward opportunity.

    A Cash Flow Focus.  Management employs a disciplined cash flow focus, seeking 25-33% cash-on-cash returns for both the Gentlemen’s clubs and Bombshells business, with stock repurchases employed when FCF yield exceeds 10%. The goal is to drive 10-15% compound annual FCF per share growth …


This Company Sponsored Research is provided by Noble Capital Markets, Inc., a FINRA and S.E.C. registered broker-dealer (B/D).

*Analyst certification and important disclosures included in the full report. NOTE: investment decisions should not be based upon the content of this research summary.  Proper due diligence is required before making any investment decision. 

1-800-Flowers.com (FLWS) – Is The Glass Half Empty?

Friday, January 28, 2022

1-800-Flowers.com (FLWS)
Is The Glass Half Empty?

1-800-FLOWERS.COM, Inc. is the leading provider of gourmet and floral gifts for all occasions. For nearly 40 years, 1-800-FLOWERS® has been helping deliver smiles for customers with gifts for every occasion, including fresh flowers, premium, gift-quality fruits, and other gourmet items from Harry & David®, popcorn and specialty treats from The Popcorn Factory®; cookies and baked gifts from Cheryl’s®; premium chocolates and confections from Fannie May®; gift baskets and towers from 1-800-Baskets.com®; premium English muffins and other breakfast treats from Wolferman’s; carved fresh fruit arrangements from FruitBouquets.com; and top quality steaks and chops from Stock Yards®. The Company’s BloomNet® international floral wire service provides a broad range of quality products and value-added services designed to help professional florists grow their businesses profitably.

Michael Kupinski, Director of Research, Noble Capital Markets, Inc.

Patrick McCann, Research Associate, Noble Capital Markets, Inc.

Refer to the full report for the price target, fundamental analysis, and rating.

    A surprise miss. Fiscal Q2 total revenues were $943 million, up a solid 7.5% from the year earlier quarter, but missed expectations. Adj. EBITDA was $133 million, down 17%, missing our estimate of $179 million. The miss was due to cancelled orders, higher than expected costs for ocean freight, inbound and outbound shipping costs and labor.

    Gross margins take a hit.  Gross profit margin declined 530 basis points from 45.4% in the prior year quarter to 40.1% due to increased inbound and outbound shipping costs as well as the rising cost of labor. All three operating segments took a hit to margins on a year-over-year basis: gross margins for Gourmet Foods and Gift Baskets declined 660 basis points, Consumer Floral and Gifts declined 270 …


This Company Sponsored Research is provided by Noble Capital Markets, Inc., a FINRA and S.E.C. registered broker-dealer (B/D).

*Analyst certification and important disclosures included in the full report. NOTE: investment decisions should not be based upon the content of this research summary.  Proper due diligence is required before making any investment decision. 

Release – 1-800-FLOWERS.COM Inc. Reports 7.5 Percent Revenue Growth for Its Fiscal 2022 Second Quarter


1-800-FLOWERS.COM, Inc. Reports 7.5 Percent Revenue Growth for Its Fiscal 2022 Second Quarter

Research, News, and Market Data on 1-800-FLOWERS.COM


Jan 27, 2022

  • Total net revenues increased 7.5 percent, or $65.8 million, to $943.0 million, compared with $877.3 million in the prior year period. This revenue growth was on top of the 44.8 percent revenue growth reported in the Company’s 2021 fiscal second quarter.
  • Net income for the quarter was $88.5 million, or $1.34 per diluted share compared with net income of $113.7 million, or $1.71 per diluted share, in the prior year period, primarily reflecting significant year-over-year cost increases for inbound and outbound shipping, labor, and digital marketing. Adjusted net income1 for the quarter was $88.6 million, or $1.34 per diluted share, compared with adjusted net income1 of $114.2 million, or $1.72 per diluted share, in the prior year period.
  • Adjusted EBITDA1 for the quarter was $133.1 million, down 19.0 percent compared with adjusted EBITDA1 of $164.3 million in the prior year period.
  • Company provides revised full-year guidance including revenue growth of 7.0 percent-to-9.0 percent, adjusted EBITDA in a range of $140.0 million-to-$150.0 million and EPS in a range of $0.90 -to- $1.00 per diluted share.

(1 Refer to “Definitions of Non-GAAP Financial Measures” and the tables attached at the end of this press release for reconciliation of non-GAAP results to applicable GAAP results.)

JERICHO, N.Y.–(BUSINESS WIRE)– 1-800-FLOWERS.COM, Inc. (NASDAQ: FLWS), a leading e-commerce provider of products and services designed to inspire more human expression, connection, and celebration, today reported results for its fiscal 2022 second quarter ended December 26, 2021.

Chris McCann, CEO of 1-800-FLOWERS.COM, Inc., said, “Our revenue growth of 7.5 percent in the quarter – on top of the 45 percent growth in last year’s fiscal second quarter – reflected continued growth across our three business segments, highlighted by growth of approximately ten percent in our Gourmet Foods and Gift Baskets segment, led by our Harry & David® brand.” McCann noted that, in addition to representing a very challenging year-over-year comparison, the holiday period was characterized by several significant headwinds including limited availability and increased costs for seasonal labor, ongoing supply-chain disruptions that caused shortages of key components for some holiday products and the resurgence of COVID pandemic cases across the country. “The widely reported cost increases associated with these macro headwinds significantly exceeded our expectations during the quarter, impacting our margins and bottom-line results,” he said.

McCann said the Company will continue to invest in its operating platform, including initiatives to bring imported inventory in early and optimize outbound shipping methods as well as automating of its warehouse and distribution facilities to help mitigate the continuing cost headwinds. “Over the longer term, we anticipate these initiatives will enable us to improve our gross margins and drive enhanced bottom-line performance.”

McCann noted that during the second quarter the Company saw continued strong, year-over-year growth in its customer file and in its Celebrations Passport® loyalty program, which helps drive increased purchase frequency, retention, and cross-category/cross-brand purchases. “We also saw double-digit growth in our best performing customer cohort – customers that buy from multiple product categories and multiple brands within a given year. We believe these positive trends will provide increased marketing leverage over the longer term, particularly as we continue to see a larger percentage of our total revenues coming from existing customers.”

Second Quarter 2022 Financial Results
Total consolidated revenues increased 7.5 percent, or 
$65.8 million, to 
$943.0 million, compared with 
$877.3 million in the prior year period. This revenue growth was on top of the 44.8 percent revenue growth reported in the Company’s 2021 fiscal second quarter. The Company achieved revenue growth across its three business segments, including growth of 9.8 percent in its Gourmet Foods and Gift Baskets segment, led by growth of more than 10.0 percent in its Harry & David brand.

Gross profit margin for the quarter was 40.1 percent, a decline of 530 basis points compared with 45.4 percent in the prior year period, primarily reflecting increased costs for inbound and outbound shipping and labor. Operating expenses as a percent of total revenues, improved 70 basis points to 27.9 percent of total sales, compared with 28.6 percent of total sales in the prior year period.

The combination of these factors resulted in net income for the quarter of 
$88.5 million, or 
$1.34 per diluted share compared with net income of 
$113.7 million, or 
$1.71 per diluted share, in the prior year period, primarily reflecting significant year-over-year cost increases in labor, inbound and outbound shipping, and digital marketing. Adjusted net income1 for the quarter was 
$88.6 million, or 
$1.34 per share, compared with adjusted net income of 
$114.2 million, or 
$1.72 per share, in the prior year period. Adjusted EBITDA1 for the quarter was 
$133.1 million, down 19.0 percent compared with adjusted EBITDA1 of 
$164.3 million in the prior year period.

Segment Results:
The Company provides selected financial results for its Gourmet Foods and Gift Baskets, Consumer Floral and Gifts, and BloomNet® segments in the tables attached to this release and as follows:

  • Gourmet Foods and Gift Baskets: Revenues for the quarter increased 9.8 percent to 
    $590.9 million, compared with 
    $538.3 million in the prior year period. The strong growth was primarily driven by growth of more than 10.0 percent in the Company’s Harry & David business. Gross profit margin was 39.3 percent, a decline of 660 basis points compared with 45.9 percent in the prior year period, primarily reflecting increased costs for inbound and outbound shipping as well as limited availability and higher costs for labor. Segment contribution margin was 
    $110.5 million, down 18.5 percent compared with 
    $135.6 million in the prior year period, reflecting the reduced gross margin as well as higher year-over-year digital marketing costs.
  • Consumer Floral and Gifts: Total revenues in this segment increased 3.2 percent to 
    $315.1 million, compared with 
    $305.5 million in the prior year period. Gross profit margin was 41.3 percent, down 270 basis points compared with 44.0 percent in the prior year period, primarily reflecting increased costs for inbound and outbound shipping and labor. Segment contribution margin was 
    $38.2 million, down 16.4 percent compared with 
    $45.7 million in the prior year period, primarily reflecting the reduced gross margin as well as higher year-over-year digital marketing costs.
  • BloomNet: Revenues for the quarter increased 11.4 percent to 
    $37.9 million, compared with 
    $34.1 million in the prior year period. Gross profit margin was 42.2 percent, down 720 basis points, compared with 49.4 percent in the prior year period, primarily reflecting higher inbound shipping costs and product mix. Segment contribution margin was 
    $11.9 million, down 2.1 percent compared with 
    $12.1 million in the prior year period primarily reflecting increased in-bound and outbound shipping costs which reduced gross margin.

Company Guidance
The Company is updating its guidance for the fiscal 2022 year reflecting reported results for the first half of the year as well as its outlook for the remainder of the year. The updated guidance includes:

  • Total revenue growth of 7.0 percent-to-9.0 percent compared with the prior year;
  • Adjusted EBITDA in a range of 
    $140.0 million-to-
    $150.0 million;
  • EPS in a range of 
    $0.90 -to- 
    $1.00 per diluted share, and;
  • The Company anticipates that Free Cash Flow for the year will be down significantly compared with the prior year based on its updated guidance and its plans to use its strong balance sheet to continue to invest in inventory to support its growth plans and address the headwinds it sees in the macro economy.

The Company’s guidance for the year is based on several factors, including:

  • the continuing headwinds associated with the ongoing pandemic, increased costs for labor, inbound and outbound shipping, and marketing as well as consumer concerns regarding rising price inflation somewhat offset by;
  • the Company’s ability to continue to attract new customers and add new members to its Celebrations Passport® loyalty program, which is helping drive increased frequency, retention, and cross-category/cross-brand purchases.

Definitions of non-GAAP Financial Measures:
We sometimes use financial measures derived from consolidated financial information, but not presented in our financial statements prepared in accordance with 
U.S. generally accepted accounting principles(“GAAP”). Certain of these are considered “non-GAAP financial measures” under the 
U.S. Securities and Exchange Commission rules. Non-GAAP financial measures referred to in this document are either labeled as “non-GAAP” or designated as such with a “1”. See below for definitions and the reasons why we use these non-GAAP financial measures. Where applicable, see the Selected Financial Information below for reconciliations of these non-GAAP measures to their most directly comparable GAAP financial measures.

EBITDA and Adjusted EBITDA:
We define EBITDA as net income (loss) before interest, taxes, depreciation, and amortization. Adjusted EBITDA is defined as EBITDA adjusted for the impact of stock-based compensation, Non-Qualified Plan Investment appreciation/depreciation, and for certain items affecting period-to-period comparability. See Selected Financial Information for details on how EBITDA and adjusted EBITDA were calculated for each period presented. The Company presents EBITDA and adjusted EBITDA because it considers such information meaningful supplemental measures of its performance and believes such information is frequently used by the investment community in the evaluation of similarly situated companies. The Company uses EBITDA and adjusted EBITDA as factors to determine the total amount of incentive compensation available to be awarded to executive officers and other employees. The Company’s credit agreement uses EBITDA and adjusted EBITDA to determine its interest rate and to measure compliance with certain covenants. EBITDA and adjusted EBITDA are also used by the Company to evaluate and price potential acquisition candidates. EBITDA and adjusted EBITDA have limitations as analytical tools and should not be considered in isolation or as a substitute for analysis of the Company’s results as reported under GAAP. Some of the limitations are: (a) EBITDA and adjusted EBITDA do not reflect changes in, or cash requirements for, the Company’s working capital needs; (b) EBITDA and adjusted EBITDA do not reflect the significant interest expense, or the cash requirements necessary to service interest or principal payments, on the Company’s debts; and (c) although depreciation and amortization are non-cash charges, the assets being depreciated and amortized may have to be replaced in the future and EBITDA does not reflect any cash requirements for such capital expenditures. EBITDA and adjusted EBITDA should only be used on a supplemental basis combined with GAAP results when evaluating the Company’s performance.

Segment Contribution Margin and Adjusted Segment Contribution Margin:
We define segment contribution margin as earnings before interest, taxes, depreciation, and amortization, before the allocation of corporate overhead expenses. Adjusted contribution margin is defined as contribution margin adjusted for certain items affecting period-to-period comparability. See Selected Financial Information for details on how segment contribution margin and adjusted segment contribution margin was calculated for each period presented. When viewed together with our GAAP results, we believe segment contribution margin and adjusted segment contribution margin provide management and users of the financial statements meaningful information about the performance of our business segments. Segment contribution margin and adjusted segment contribution margin are used in addition to and in conjunction with results presented in accordance with GAAP and should not be relied upon to the exclusion of GAAP financial measures. The material limitation associated with the use of the segment contribution margin and adjusted segment contribution margin is that they are an incomplete measure of profitability as they do not include all operating expenses or non-operating income and expenses. Management compensates for these limitations when using this measure by looking at other GAAP measures, such as operating income and net income.

Adjusted Net Income (Loss) and Adjusted or Comparable Net Income (Loss) Per Common Share:
We define adjusted net income (loss) and adjusted or comparable net income (loss) per common share as net income (loss) and net income (loss) per common share adjusted for certain items affecting period to period comparability. See Selected Financial Information below for details on how adjusted net income (loss) and adjusted or comparable net income (loss) per common share were calculated for each period presented. We believe that adjusted net income (loss) and adjusted or comparable EPS are meaningful measures because they increase the comparability of period-to-period results. Since these are not measures of performance calculated in accordance with GAAP, they should not be considered in isolation of, or as a substitute for, GAAP net income (loss) and net income (loss) per common share, as indicators of operating performance and they may not be comparable to similarly titled measures employed by other companies.

Free Cash Flow:
We define free cash flow as net cash provided by operating activities less capital expenditures. The Company considers free cash flow to be a liquidity measure that provides useful information to management and investors about the amount of cash generated by the business after the purchases of fixed assets, which can then be used to, among other things, invest in the Company’s business, make strategic acquisitions, strengthen the balance sheet, and repurchase stock or retire debt. Free cash flow is a liquidity measure that is frequently used by the investment community in the evaluation of similarly situated companies. Since free cash flow is not a measure of performance calculated in accordance with GAAP, it should not be considered in isolation or as a substitute for analysis of the Company’s results as reported under GAAP. A limitation of the utility of free cash flow as a measure of financial performance is that it does not represent the total increase or decrease in the company’s cash balance for the period.

About 1-800-FLOWERS.COM, Inc.
1-800-FLOWERS.COM, Inc. is a leading provider of gifts designed to help customers express, connect and celebrate. The Company’s e-commerce business platform features an all-star family of brands, including: 1-800-Flowers.com®, 1-800-Baskets.com®, Cheryl’s Cookies®, Harry & David®, PersonalizationMall.com®, Shari’s Berries®, FruitBouquets.com®, Moose Munch®, The Popcorn Factory®, Wolferman’s Bakery®, Vital Choice®, Stock Yards® and Simply Chocolate®. Through the Celebrations Passport® loyalty program, which provides members with free standard shipping and no service charge across our portfolio of brands, 1-800-FLOWERS.COM, Inc. strives to deepen relationships with customers. The Company also operates BloomNet®, an international floral and gift industry service provider offering a broad range of products and services designed to help members grow their businesses profitably Napco?, a resource for floral gifts and seasonal décor; DesignPac Gifts, LLC, a manufacturer of gift baskets and towers; and Alice’s Table®, a lifestyle business offering fully digital livestreaming floral, culinary and other experiences to guests across the country. 1-800-FLOWERS.COM, Inc. was recognized among the top 5 on the National Retail Federation’s 2021 Hot 25 Retailers list, which ranks the nation’s fastest-growing retail companies. Shares in 1-800-FLOWERS.COM, Inc. are traded on the NASDAQ Global Select Market, ticker symbol: FLWS. For more information, visit 1800flowersinc.com or follow @1800FLOWERSInc on Twitter.

FLWS-COMP
FLWS-FN

Special Note Regarding Forward Looking Statements:
This press release contains forward-looking statements within the meaning of the Private Securities Litigation Reform Act of 1995. These forward-looking statements represent the Company’s current expectations or beliefs concerning future events and can generally be identified using statements that include words such as “estimate,” “expects,” “project,” “believe,” “anticipate,” “intend,” “plan,” “foresee,” “forecast,” “likely,” “will,” “target” or similar words or phrases. These forward-looking statements are subject to risks, uncertainties, and other factors, many of which are outside of the Company’s control, which could cause actual results to differ materially from the results expressed or implied in the forward-looking statements, including, but not limited to, statements regarding the Company’s ability to achieve its guidance for fiscal-year 2022; the impact of the Covid-19 pandemic on the Company; its ability to successfully integrate acquired businesses and assets; its ability to successfully execute its strategic initiatives; its ability to cost-effectively acquire and retain customers; the outcome of contingencies, including legal proceedings in the normal course of business; its ability to compete against existing and new competitors; its ability to manage expenses associated with sales and marketing and necessary general and administrative and technology investments; its ability to reduce promotional activities and achieve more efficient marketing programs; and general consumer sentiment and industry and economic conditions that may affect levels of discretionary customer purchases of the Company’s products. Reconciliations for forward looking figures would require unreasonable efforts at this time because of the uncertainty and variability of the nature and amount of certain components of various necessary GAAP components, including for example those related to compensation, tax items, amortization or others that may arise during the year, and the Company’s management believes such reconciliations would imply a degree of precision that would be confusing or misleading to investors. The lack of such reconciling information should be considered when assessing the impact of such disclosures. The Company undertakes no obligation to publicly update any of the forward-looking statements, whether because of new information, future events or otherwise, made in this release or in any of its SEC filings. Consequently, you should not consider any such list to be a complete set of all potential risks and uncertainties. For a more detailed description of these and other risk factors, refer to the Company’s SEC filings, including the Company’s Annual Reports on Form 10-K and its Quarterly Reports on Form 10-Q.

Conference Call:
The Company will conduct a conference call to discuss the above details and attached financial results today, Thursday, January 27, 2022, at 8:00 a.m. (ET). The conference call will be webcast live from the Investor Relations section of the Company’s website at www.1800flowersinc.com. A recording of the call will be posted on the Investor Relations section of the Company’s web site within two hours of the call’s completion. A replay of the call can be accessed beginning at 2:00 p.m. ET on the day of the call through February 3, 2022, at: (US) 1-877-344-7529; (
Canada) 855-669-9658; (International) 1-412-317-0088; enter conference ID #:5113256.

Note: The attached tables are an integral part of this press release without which the information presented in this press release should be considered incomplete.

1-800-FLOWERS.COM, Inc. and Subsidiaries
Condensed Consolidated Balance Sheets
(in thousands)


December 26, 2021

June 27, 2021


(unaudited)


Assets


Current assets:


Cash and cash equivalents

$

271,068

$

173,573

Trade receivables, net


77,797


20,831

Inventories, net


191,050


153,863

Prepaid and other


32,956


51,792

Total current assets


572,871


400,059


Property, plant and equipment, net


226,660


215,287

Operating lease right-of-use assets


134,932


86,230

Goodwill


212,533


208,150

Other intangibles, net


147,178


139,048

Other assets


27,164


27,905

Total assets

$

1,321,338

$

1,076,679


Liabilities and Stockholders’ Equity


Current liabilities:


Accounts payable

$

109,257

$

57,434

Accrued expenses


279,345


178,512

Current maturities of long-term debt


20,000


20,000

Current portion of long-term operating lease liabilities


12,344


9,992

Total current liabilities


420,946


265,938


Long-term debt, net


151,844


161,512

Long-term operating lease liabilities


128,620


79,375

Deferred tax liabilities


32,856


34,162

Other liabilities


22,112


26,622

Total liabilities

756,378


567,609

Total stockholders’ equity


564,960


509,070

Total liabilities and stockholders’ equity

$

1,321,338

$

1,076,679

1-800-FLOWERS.COM, Inc. and Subsidiaries
Selected Financial Information
Consolidated Statements of Operations
(in thousands, except for per share data)
(unaudited)


Three Months Ended

Six Months Ended


December 26,
2021

December 27,
2020

December 26,
2021

December 27,
2020

Net revenues:


E-Commerce

$

827,522


$

777,810


$

1,090,893


$

1,016,673


Other


115,522


99,446


161,524


144,355


Total net revenues


943,044


877,256


1,252,417


1,161,028


Cost of revenues


564,594


479,010


748,453


647,302


Gross profit


378,450


398,246


503,964


513,726


Operating expenses:


Marketing and sales


207,771


194,696


302,150


274,981


Technology and development


13,490


14,053


26,913


25,656


General and administrative


28,872


30,835


55,938


59,048


Depreciation and amortization


12,588


11,060


23,558


19,900


Total operating expenses


262,721


250,644


408,559


379,585


Operating income


115,729


147,602


95,405


134,141


Interest expense, net


1,723


1,927


3,251


2,967


Other income, net


(2,457

)


(2,257

)


(3,053

)


(3,256

)

Income before income taxes


116,463


147,932


95,207


134,430


Income tax expense


27,995


34,255


19,938


30,515


Net income

$

88,468


$

113,677


$

75,269


$

103,915


Basic net income per common share

$

1.36


$

1.76


$

1.16


$

1.61


Diluted net income per common share

$

1.34


$

1.71


$

1.14


$

1.56


Weighted average shares used in the calculation of net income per common share:


Basic


65,261


64,728


65,161


64,524


Diluted


65,969


66,543


65,954


66,593


1-800-FLOWERS.COM, Inc. and Subsidiaries
Selected Financial Information
Consolidated Statements of Cash Flows
(in thousands)
(unaudited)


Six months ended


December 26, 2021

December 27, 2020


Operating activities:


Net income

$

75,269


$

103,915


Adjustments to reconcile net income to net cash provided by operating activities:


Depreciation and amortization


23,558


19,900


Amortization of deferred financing costs


616


545


Deferred income taxes


(1,306

)


(1,388

)

Bad debt expense


(1,285

)


341


Stock-based compensation


5,296


5,358


Other non-cash items


(448

)


(321

)

Changes in operating items:


Trade receivables


(55,074

)


(56,372

)

Inventories


(28,534

)


25,369


Prepaid and other


8,172


(1,937

)

Accounts payable and accrued expenses


160,459


212,340


Other assets and liabilities


(875

)


8,897


Net cash provided by operating activities


185,848


316,647


Investing activities:


Acquisitions, net of cash acquired


(20,786

)


(250,943

)

Capital expenditures, net of non-cash expenditures


(32,608

)


(15,708

)

Purchase of equity investments


(1,285

)

Net cash used in investing activities


(53,394

)


(267,936

)


Financing activities:


Acquisition of treasury stock


(25,521

)


(12,470

)

Proceeds from exercise of employee stock options


846


1,032


Proceeds from bank borrowings


125,000


265,000


Repayment of bank borrowings


(135,000

)


(170,000

)

Debt issuance cost


(284

)


(2,193

)

Net cash used in (provided by) financing activities


(34,959

)


81,369


Net change in cash and cash equivalents


97,495


130,080


Cash and cash equivalents:


Beginning of period


173,573


240,506


End of period

$

271,068


$

370,586


1-800-FLOWERS.COM, Inc. and Subsidiaries
Selected Financial Information – Category Information
(dollars in thousands) (unaudited)
 

Three Months Ended

December 26,
2021

Vital Choice and
Alices’s Table
Transaction
Costs

As Adjusted
(non-GAAP)
December 26, 2021

December 27,
2020

PersonalizationMall
Litigation
& Transaction Costs

Harry & David
Store Closure
Costs

As Adjusted
(non-GAAP)
December 27,
2020

%
Change

Net revenues:

Consumer Floral & Gifts

$

315,083


$

$

315,083


$

305,357


$

$


$

305,357


3.2

%

BloomNet


37,930


37,930


34,051


34,051


11.4

%

Gourmet Foods & Gift Baskets


590,946


590,946


538,265


538,265


9.8

%

Corporate


69


69


135


135


-48.9

%

Intercompany eliminations


(984

)


(984

)


(552

)


(552

)

-78.3

%

Total net revenues

$

943,044


$

$

943,044


$

877,256


$

$


$

877,256


7.5

%


Gross profit:

Consumer Floral & Gifts

$

130,025


$

130,025


$

134,474


$

134,474


-3.3

%


41.3

%


41.3

%


44.0

%


44.0

%


BloomNet


16,021


16,021


16,820


16,820


-4.8

%


42.2

%


42.2

%


49.4

%


49.4

%


Gourmet Foods & Gift Baskets


232,239


232,239


246,890


246,890


-5.9

%


39.3

%


39.3

%


45.9

%


45.9

%


Corporate


165


165


62


62


166.1

%


239.1

%


239.1

%


45.9

%


45.9

%


Total gross profit

$

378,450


$

$

378,450


$

398,246


$

$


$

398,246


-5.0

%


40.1

%


40.1

%


45.4

%


45.4

%


EBITDA (non-GAAP):

Segment Contribution Margin (non-GAAP) (a):

Consumer Floral & Gifts

$

38,156


$

$

38,156


$

45,657


$

$


$

45,657


-16.4

%

BloomNet


11,887


11,887


12,141


12,141


-2.1

%

Gourmet Foods & Gift Baskets


110,502


110,502


135,621


(78

)


135,543


-18.5

%

Segment Contribution Margin Subtotal


160,545


160,545


193,419


(78

)


193,341


-17.0

%

Corporate (b)


(32,228

)


59


(32,169

)


(34,757

)


513


(34,244

)

6.1

%

EBITDA (non-GAAP)


128,317


59


128,376


158,662


513


(78

)


159,097


-19.3

%

Add: Stock-based compensation


2,291


2,291


2,965


2,965


-22.7

%

Add: Compensation charge related to NQ Plan Investment Appreciation


2,425


2,425


2,227


2,227


8.9

%

Adjusted EBITDA (non-GAAP)

$

133,033


$

59

$

133,092


$

163,854


$

513

$

(78

)

$

164,289


-19.0

%

1-800-FLOWERS.COM, Inc. and Subsidiaries
Selected Financial Information – Category Information
(dollars in thousands) (unaudited)
 

Six Months Ended

December 26,
2021

Vital Choice and
Alice’s Table
Transaction Costs

As Adjusted
(non-GAAP)
December 26,
2021

December 27,
2020

PersonalizationMall
Litigation
& Transaction Costs

Harry & David
Store Closure
Costs

As Adjusted
(non-GAAP)
December 27,
2020

%
Change

Net revenues:

Consumer Floral & Gifts

$

496,312


$

$

496,312


$

466,903


$

$


$

466,903


6.3

%

BloomNet


68,764


68,764


66,789


66,789


3.0

%

Gourmet Foods & Gift Baskets


688,428


688,428


628,194


628,194


9.6

%

Corporate


114


114


241


241


-52.7

%

Intercompany eliminations


(1,201

)


(1,201

)


(1,099

)


(1,099

)

-9.3

%

Total net revenues

$

1,252,417


$

$

1,252,417


$

1,161,028


$

$


$

1,161,028


7.9

%


Gross profit:

Consumer Floral & Gifts

$

206,028


$

$

206,028


$

200,060


$

$


$

200,060


3.0

%


41.5

%


41.5

%


42.8

%


42.8

%


BloomNet


31,430


31,430


31,658


31,658


-0.7

%


45.7

%


45.7

%


47.4

%


47.4

%


Gourmet Foods & Gift Baskets


266,402


266,402


281,897


281,897


-5.5

%


38.7

%


38.7

%


44.9

%


44.9

%


Corporate


104


104


111


111


-6.3

%


91.2

%


91.2

%


46.1

%


46.1

%


Total gross profit

$

503,964


$

$

503,964


$

513,726


$

$


$

513,726


-1.9

%


40.2

%


40.2

%


44.2

%


44.2

%


EBITDA (non-GAAP):

Segment Contribution Margin (non-GAAP) (a):

Consumer Floral & Gifts

$

57,346


$

$

57,346


$

64,893


$

$


$

64,893


-11.6

%

BloomNet


22,747


22,747


22,562


22,562


0.8

%

Gourmet Foods & Gift Baskets


102,829


102,829


133,040


(483

)


132,557


22.4

%

Segment Contribution Margin Subtotal


182,922


182,922


220,495


(483

)


220,012


-16.9

%

Corporate (b)


(63,959

)


515


(63,444

)


(66,454

)


5,403


(61,051

)

-3.9

%

EBITDA (non-GAAP)


118,963


515


119,478


154,041


5,403


(483

)


158,961


-24.8

%

Add: Stock-based compensation


5,296


5,296


5,358


5,358


-1.2

%

Add: Compensation charge related to NQ Plan Investment Appreciation


2,992


2,992


3,207


3,207


-6.7

%

Adjusted EBITDA (non-GAAP)

$

127,251


$

515

$

127,766


$

162,605


$

5,403

$

(483

)

$

167,526


-23.7

%

1-800-FLOWERS.COM, Inc. and Subsidiaries
Selected Financial Information
(in thousands) (unaudited)
 

Reconciliation of net income to adjusted net income (non-GAAP):


Three Months Ended


Six Months Ended


December 26, 2021

December 27, 2020

December 26, 2021

December 27, 2020


Net income


$

88,468

$

113,677


$

75,269


$

103,915


Adjustments to reconcile net income to adjusted net income (non-GAAP)


Add: Transaction costs


59


513


515


5,403


Deduct: Harry & David store closure cost adjustment


(78

)


(483

)

Deduct: Income tax effect on adjustments


65


125


(108

)


(1,117

)

Adjusted net income (non-GAAP)


$

88,592

$

114,237


$

75,676


$

107,718


Basic and diluted net income per common share


Basic


$

1.36

$

1.76


$

1.16


$

1.61


Diluted


$

1.34

$

1.71


$

1.14


$

1.56


Basic and diluted adjusted net income per common share (non-GAAP)


Basic


$

1.36

$

1.76


$

1.16


$

1.67


Diluted


$

1.34

$

1.72


$

1.15


$

1.62


Weighted average shares used in the calculation of net income and adjusted net income per common share


Basic


65,261


64,728


65,161


64,524


Diluted


65,969


66,543


65,954


66,593


1-800-FLOWERS.COM, Inc. and Subsidiaries
Selected Financial Information
(in thousands) (unaudited)
 

Reconciliation of net income to adjusted EBITDA (non-GAAP):


Three Months Ended


Six Months Ended

December 26, 2021

December 27, 2020

December 26, 2021

December 27, 2020


Net income

$

88,468


$

113,677


$

75,269

$

103,915


Add: Interest (income) expense, net


(734

)


(330

)


198


(289

)

Add: Depreciation and amortization


12,588


11,060


23,558


19,900


Add: Income tax expense


27,995


34,255


19,938


30,515


EBITDA


128,317


158,662


118,963


154,041


Add: Stock-based compensation


2,291


2,965


5,296


5,358


Add: Compensation charge related to NQ plan investment

appreciation


2,425


2,227


2,992


3,207


Add: Transaction costs


59


513


515


5,403


Deduct: Harry & David store closure cost adjustment


(78

)


(483

)

Adjusted EBITDA

$

133,092


$

164,289


$

127,766

$

167,526


(a) Segment performance is measured based on segment contribution margin or segment Adjusted EBITDA, reflecting only the direct controllable revenue and operating expenses of the segments, both of which are non-GAAP measurements. As such, management’s measure of profitability for these segments does not include the effect of corporate overhead, described above, depreciation and amortization, other income (net), and other items that we do not consider indicative of our core operating performance.

(b) Corporate expenses consist of the Company’s enterprise shared service cost centers, and include, among other items, Information Technology, Human Resources, Accounting and Finance, Legal, Executive and Customer Service Center functions, as well as Stock-Based Compensation. In order to leverage the Company’s infrastructure, these functions are operated under a centralized management platform, providing support services throughout the organization. The costs of these functions, other than those of the Customer Service Center, which are allocated directly to the above categories based upon usage, are included within corporate expenses as they are not directly allocable to a specific segment.

Investor Contact:

Joseph D. Pititto

(516) 237-6131

invest@1800flowers.com

Media Contact:

Kathleen Waugh

(516) 237-6028

kwaugh@1800flowers.com

Source: 1-800-FLOWERS.COM, Inc.

1-800-FLOWERS.COM, Inc. Reports 7.5 Percent Revenue Growth for Its Fiscal 2022 Second Quarter


1-800-FLOWERS.COM, Inc. Reports 7.5 Percent Revenue Growth for Its Fiscal 2022 Second Quarter

Research, News, and Market Data on 1-800-FLOWERS.COM


Jan 27, 2022

  • Total net revenues increased 7.5 percent, or $65.8 million, to $943.0 million, compared with $877.3 million in the prior year period. This revenue growth was on top of the 44.8 percent revenue growth reported in the Company’s 2021 fiscal second quarter.
  • Net income for the quarter was $88.5 million, or $1.34 per diluted share compared with net income of $113.7 million, or $1.71 per diluted share, in the prior year period, primarily reflecting significant year-over-year cost increases for inbound and outbound shipping, labor, and digital marketing. Adjusted net income1 for the quarter was $88.6 million, or $1.34 per diluted share, compared with adjusted net income1 of $114.2 million, or $1.72 per diluted share, in the prior year period.
  • Adjusted EBITDA1 for the quarter was $133.1 million, down 19.0 percent compared with adjusted EBITDA1 of $164.3 million in the prior year period.
  • Company provides revised full-year guidance including revenue growth of 7.0 percent-to-9.0 percent, adjusted EBITDA in a range of $140.0 million-to-$150.0 million and EPS in a range of $0.90 -to- $1.00 per diluted share.

(1 Refer to “Definitions of Non-GAAP Financial Measures” and the tables attached at the end of this press release for reconciliation of non-GAAP results to applicable GAAP results.)

JERICHO, N.Y.–(BUSINESS WIRE)– 1-800-FLOWERS.COM, Inc. (NASDAQ: FLWS), a leading e-commerce provider of products and services designed to inspire more human expression, connection, and celebration, today reported results for its fiscal 2022 second quarter ended December 26, 2021.

Chris McCann, CEO of 1-800-FLOWERS.COM, Inc., said, “Our revenue growth of 7.5 percent in the quarter – on top of the 45 percent growth in last year’s fiscal second quarter – reflected continued growth across our three business segments, highlighted by growth of approximately ten percent in our Gourmet Foods and Gift Baskets segment, led by our Harry & David® brand.” McCann noted that, in addition to representing a very challenging year-over-year comparison, the holiday period was characterized by several significant headwinds including limited availability and increased costs for seasonal labor, ongoing supply-chain disruptions that caused shortages of key components for some holiday products and the resurgence of COVID pandemic cases across the country. “The widely reported cost increases associated with these macro headwinds significantly exceeded our expectations during the quarter, impacting our margins and bottom-line results,” he said.

McCann said the Company will continue to invest in its operating platform, including initiatives to bring imported inventory in early and optimize outbound shipping methods as well as automating of its warehouse and distribution facilities to help mitigate the continuing cost headwinds. “Over the longer term, we anticipate these initiatives will enable us to improve our gross margins and drive enhanced bottom-line performance.”

McCann noted that during the second quarter the Company saw continued strong, year-over-year growth in its customer file and in its Celebrations Passport® loyalty program, which helps drive increased purchase frequency, retention, and cross-category/cross-brand purchases. “We also saw double-digit growth in our best performing customer cohort – customers that buy from multiple product categories and multiple brands within a given year. We believe these positive trends will provide increased marketing leverage over the longer term, particularly as we continue to see a larger percentage of our total revenues coming from existing customers.”

Second Quarter 2022 Financial Results
Total consolidated revenues increased 7.5 percent, or 
$65.8 million, to 
$943.0 million, compared with 
$877.3 million in the prior year period. This revenue growth was on top of the 44.8 percent revenue growth reported in the Company’s 2021 fiscal second quarter. The Company achieved revenue growth across its three business segments, including growth of 9.8 percent in its Gourmet Foods and Gift Baskets segment, led by growth of more than 10.0 percent in its Harry & David brand.

Gross profit margin for the quarter was 40.1 percent, a decline of 530 basis points compared with 45.4 percent in the prior year period, primarily reflecting increased costs for inbound and outbound shipping and labor. Operating expenses as a percent of total revenues, improved 70 basis points to 27.9 percent of total sales, compared with 28.6 percent of total sales in the prior year period.

The combination of these factors resulted in net income for the quarter of 
$88.5 million, or 
$1.34 per diluted share compared with net income of 
$113.7 million, or 
$1.71 per diluted share, in the prior year period, primarily reflecting significant year-over-year cost increases in labor, inbound and outbound shipping, and digital marketing. Adjusted net income1 for the quarter was 
$88.6 million, or 
$1.34 per share, compared with adjusted net income of 
$114.2 million, or 
$1.72 per share, in the prior year period. Adjusted EBITDA1 for the quarter was 
$133.1 million, down 19.0 percent compared with adjusted EBITDA1 of 
$164.3 million in the prior year period.

Segment Results:
The Company provides selected financial results for its Gourmet Foods and Gift Baskets, Consumer Floral and Gifts, and BloomNet® segments in the tables attached to this release and as follows:

  • Gourmet Foods and Gift Baskets: Revenues for the quarter increased 9.8 percent to 
    $590.9 million, compared with 
    $538.3 million in the prior year period. The strong growth was primarily driven by growth of more than 10.0 percent in the Company’s Harry & David business. Gross profit margin was 39.3 percent, a decline of 660 basis points compared with 45.9 percent in the prior year period, primarily reflecting increased costs for inbound and outbound shipping as well as limited availability and higher costs for labor. Segment contribution margin was 
    $110.5 million, down 18.5 percent compared with 
    $135.6 million in the prior year period, reflecting the reduced gross margin as well as higher year-over-year digital marketing costs.
  • Consumer Floral and Gifts: Total revenues in this segment increased 3.2 percent to 
    $315.1 million, compared with 
    $305.5 million in the prior year period. Gross profit margin was 41.3 percent, down 270 basis points compared with 44.0 percent in the prior year period, primarily reflecting increased costs for inbound and outbound shipping and labor. Segment contribution margin was 
    $38.2 million, down 16.4 percent compared with 
    $45.7 million in the prior year period, primarily reflecting the reduced gross margin as well as higher year-over-year digital marketing costs.
  • BloomNet: Revenues for the quarter increased 11.4 percent to 
    $37.9 million, compared with 
    $34.1 million in the prior year period. Gross profit margin was 42.2 percent, down 720 basis points, compared with 49.4 percent in the prior year period, primarily reflecting higher inbound shipping costs and product mix. Segment contribution margin was 
    $11.9 million, down 2.1 percent compared with 
    $12.1 million in the prior year period primarily reflecting increased in-bound and outbound shipping costs which reduced gross margin.

Company Guidance
The Company is updating its guidance for the fiscal 2022 year reflecting reported results for the first half of the year as well as its outlook for the remainder of the year. The updated guidance includes:

  • Total revenue growth of 7.0 percent-to-9.0 percent compared with the prior year;
  • Adjusted EBITDA in a range of 
    $140.0 million-to-
    $150.0 million;
  • EPS in a range of 
    $0.90 -to- 
    $1.00 per diluted share, and;
  • The Company anticipates that Free Cash Flow for the year will be down significantly compared with the prior year based on its updated guidance and its plans to use its strong balance sheet to continue to invest in inventory to support its growth plans and address the headwinds it sees in the macro economy.

The Company’s guidance for the year is based on several factors, including:

  • the continuing headwinds associated with the ongoing pandemic, increased costs for labor, inbound and outbound shipping, and marketing as well as consumer concerns regarding rising price inflation somewhat offset by;
  • the Company’s ability to continue to attract new customers and add new members to its Celebrations Passport® loyalty program, which is helping drive increased frequency, retention, and cross-category/cross-brand purchases.

Definitions of non-GAAP Financial Measures:
We sometimes use financial measures derived from consolidated financial information, but not presented in our financial statements prepared in accordance with 
U.S. generally accepted accounting principles(“GAAP”). Certain of these are considered “non-GAAP financial measures” under the 
U.S. Securities and Exchange Commission rules. Non-GAAP financial measures referred to in this document are either labeled as “non-GAAP” or designated as such with a “1”. See below for definitions and the reasons why we use these non-GAAP financial measures. Where applicable, see the Selected Financial Information below for reconciliations of these non-GAAP measures to their most directly comparable GAAP financial measures.

EBITDA and Adjusted EBITDA:
We define EBITDA as net income (loss) before interest, taxes, depreciation, and amortization. Adjusted EBITDA is defined as EBITDA adjusted for the impact of stock-based compensation, Non-Qualified Plan Investment appreciation/depreciation, and for certain items affecting period-to-period comparability. See Selected Financial Information for details on how EBITDA and adjusted EBITDA were calculated for each period presented. The Company presents EBITDA and adjusted EBITDA because it considers such information meaningful supplemental measures of its performance and believes such information is frequently used by the investment community in the evaluation of similarly situated companies. The Company uses EBITDA and adjusted EBITDA as factors to determine the total amount of incentive compensation available to be awarded to executive officers and other employees. The Company’s credit agreement uses EBITDA and adjusted EBITDA to determine its interest rate and to measure compliance with certain covenants. EBITDA and adjusted EBITDA are also used by the Company to evaluate and price potential acquisition candidates. EBITDA and adjusted EBITDA have limitations as analytical tools and should not be considered in isolation or as a substitute for analysis of the Company’s results as reported under GAAP. Some of the limitations are: (a) EBITDA and adjusted EBITDA do not reflect changes in, or cash requirements for, the Company’s working capital needs; (b) EBITDA and adjusted EBITDA do not reflect the significant interest expense, or the cash requirements necessary to service interest or principal payments, on the Company’s debts; and (c) although depreciation and amortization are non-cash charges, the assets being depreciated and amortized may have to be replaced in the future and EBITDA does not reflect any cash requirements for such capital expenditures. EBITDA and adjusted EBITDA should only be used on a supplemental basis combined with GAAP results when evaluating the Company’s performance.

Segment Contribution Margin and Adjusted Segment Contribution Margin:
We define segment contribution margin as earnings before interest, taxes, depreciation, and amortization, before the allocation of corporate overhead expenses. Adjusted contribution margin is defined as contribution margin adjusted for certain items affecting period-to-period comparability. See Selected Financial Information for details on how segment contribution margin and adjusted segment contribution margin was calculated for each period presented. When viewed together with our GAAP results, we believe segment contribution margin and adjusted segment contribution margin provide management and users of the financial statements meaningful information about the performance of our business segments. Segment contribution margin and adjusted segment contribution margin are used in addition to and in conjunction with results presented in accordance with GAAP and should not be relied upon to the exclusion of GAAP financial measures. The material limitation associated with the use of the segment contribution margin and adjusted segment contribution margin is that they are an incomplete measure of profitability as they do not include all operating expenses or non-operating income and expenses. Management compensates for these limitations when using this measure by looking at other GAAP measures, such as operating income and net income.

Adjusted Net Income (Loss) and Adjusted or Comparable Net Income (Loss) Per Common Share:
We define adjusted net income (loss) and adjusted or comparable net income (loss) per common share as net income (loss) and net income (loss) per common share adjusted for certain items affecting period to period comparability. See Selected Financial Information below for details on how adjusted net income (loss) and adjusted or comparable net income (loss) per common share were calculated for each period presented. We believe that adjusted net income (loss) and adjusted or comparable EPS are meaningful measures because they increase the comparability of period-to-period results. Since these are not measures of performance calculated in accordance with GAAP, they should not be considered in isolation of, or as a substitute for, GAAP net income (loss) and net income (loss) per common share, as indicators of operating performance and they may not be comparable to similarly titled measures employed by other companies.

Free Cash Flow:
We define free cash flow as net cash provided by operating activities less capital expenditures. The Company considers free cash flow to be a liquidity measure that provides useful information to management and investors about the amount of cash generated by the business after the purchases of fixed assets, which can then be used to, among other things, invest in the Company’s business, make strategic acquisitions, strengthen the balance sheet, and repurchase stock or retire debt. Free cash flow is a liquidity measure that is frequently used by the investment community in the evaluation of similarly situated companies. Since free cash flow is not a measure of performance calculated in accordance with GAAP, it should not be considered in isolation or as a substitute for analysis of the Company’s results as reported under GAAP. A limitation of the utility of free cash flow as a measure of financial performance is that it does not represent the total increase or decrease in the company’s cash balance for the period.

About 1-800-FLOWERS.COM, Inc.
1-800-FLOWERS.COM, Inc. is a leading provider of gifts designed to help customers express, connect and celebrate. The Company’s e-commerce business platform features an all-star family of brands, including: 1-800-Flowers.com®, 1-800-Baskets.com®, Cheryl’s Cookies®, Harry & David®, PersonalizationMall.com®, Shari’s Berries®, FruitBouquets.com®, Moose Munch®, The Popcorn Factory®, Wolferman’s Bakery®, Vital Choice®, Stock Yards® and Simply Chocolate®. Through the Celebrations Passport® loyalty program, which provides members with free standard shipping and no service charge across our portfolio of brands, 1-800-FLOWERS.COM, Inc. strives to deepen relationships with customers. The Company also operates BloomNet®, an international floral and gift industry service provider offering a broad range of products and services designed to help members grow their businesses profitably Napco?, a resource for floral gifts and seasonal décor; DesignPac Gifts, LLC, a manufacturer of gift baskets and towers; and Alice’s Table®, a lifestyle business offering fully digital livestreaming floral, culinary and other experiences to guests across the country. 1-800-FLOWERS.COM, Inc. was recognized among the top 5 on the National Retail Federation’s 2021 Hot 25 Retailers list, which ranks the nation’s fastest-growing retail companies. Shares in 1-800-FLOWERS.COM, Inc. are traded on the NASDAQ Global Select Market, ticker symbol: FLWS. For more information, visit 1800flowersinc.com or follow @1800FLOWERSInc on Twitter.

FLWS-COMP
FLWS-FN

Special Note Regarding Forward Looking Statements:
This press release contains forward-looking statements within the meaning of the Private Securities Litigation Reform Act of 1995. These forward-looking statements represent the Company’s current expectations or beliefs concerning future events and can generally be identified using statements that include words such as “estimate,” “expects,” “project,” “believe,” “anticipate,” “intend,” “plan,” “foresee,” “forecast,” “likely,” “will,” “target” or similar words or phrases. These forward-looking statements are subject to risks, uncertainties, and other factors, many of which are outside of the Company’s control, which could cause actual results to differ materially from the results expressed or implied in the forward-looking statements, including, but not limited to, statements regarding the Company’s ability to achieve its guidance for fiscal-year 2022; the impact of the Covid-19 pandemic on the Company; its ability to successfully integrate acquired businesses and assets; its ability to successfully execute its strategic initiatives; its ability to cost-effectively acquire and retain customers; the outcome of contingencies, including legal proceedings in the normal course of business; its ability to compete against existing and new competitors; its ability to manage expenses associated with sales and marketing and necessary general and administrative and technology investments; its ability to reduce promotional activities and achieve more efficient marketing programs; and general consumer sentiment and industry and economic conditions that may affect levels of discretionary customer purchases of the Company’s products. Reconciliations for forward looking figures would require unreasonable efforts at this time because of the uncertainty and variability of the nature and amount of certain components of various necessary GAAP components, including for example those related to compensation, tax items, amortization or others that may arise during the year, and the Company’s management believes such reconciliations would imply a degree of precision that would be confusing or misleading to investors. The lack of such reconciling information should be considered when assessing the impact of such disclosures. The Company undertakes no obligation to publicly update any of the forward-looking statements, whether because of new information, future events or otherwise, made in this release or in any of its SEC filings. Consequently, you should not consider any such list to be a complete set of all potential risks and uncertainties. For a more detailed description of these and other risk factors, refer to the Company’s SEC filings, including the Company’s Annual Reports on Form 10-K and its Quarterly Reports on Form 10-Q.

Conference Call:
The Company will conduct a conference call to discuss the above details and attached financial results today, Thursday, January 27, 2022, at 8:00 a.m. (ET). The conference call will be webcast live from the Investor Relations section of the Company’s website at www.1800flowersinc.com. A recording of the call will be posted on the Investor Relations section of the Company’s web site within two hours of the call’s completion. A replay of the call can be accessed beginning at 2:00 p.m. ET on the day of the call through February 3, 2022, at: (US) 1-877-344-7529; (
Canada) 855-669-9658; (International) 1-412-317-0088; enter conference ID #:5113256.

Note: The attached tables are an integral part of this press release without which the information presented in this press release should be considered incomplete.

1-800-FLOWERS.COM, Inc. and Subsidiaries
Condensed Consolidated Balance Sheets
(in thousands)


December 26, 2021

June 27, 2021


(unaudited)


Assets


Current assets:


Cash and cash equivalents

$

271,068

$

173,573

Trade receivables, net


77,797


20,831

Inventories, net


191,050


153,863

Prepaid and other


32,956


51,792

Total current assets


572,871


400,059


Property, plant and equipment, net


226,660


215,287

Operating lease right-of-use assets


134,932


86,230

Goodwill


212,533


208,150

Other intangibles, net


147,178


139,048

Other assets


27,164


27,905

Total assets

$

1,321,338

$

1,076,679


Liabilities and Stockholders’ Equity


Current liabilities:


Accounts payable

$

109,257

$

57,434

Accrued expenses


279,345


178,512

Current maturities of long-term debt


20,000


20,000

Current portion of long-term operating lease liabilities


12,344


9,992

Total current liabilities


420,946


265,938


Long-term debt, net


151,844


161,512

Long-term operating lease liabilities


128,620


79,375

Deferred tax liabilities


32,856


34,162

Other liabilities


22,112


26,622

Total liabilities

756,378


567,609

Total stockholders’ equity


564,960


509,070

Total liabilities and stockholders’ equity

$

1,321,338

$

1,076,679

1-800-FLOWERS.COM, Inc. and Subsidiaries
Selected Financial Information
Consolidated Statements of Operations
(in thousands, except for per share data)
(unaudited)


Three Months Ended

Six Months Ended


December 26,
2021

December 27,
2020

December 26,
2021

December 27,
2020

Net revenues:


E-Commerce

$

827,522


$

777,810


$

1,090,893


$

1,016,673


Other


115,522


99,446


161,524


144,355


Total net revenues


943,044


877,256


1,252,417


1,161,028


Cost of revenues


564,594


479,010


748,453


647,302


Gross profit


378,450


398,246


503,964


513,726


Operating expenses:


Marketing and sales


207,771


194,696


302,150


274,981


Technology and development


13,490


14,053


26,913


25,656


General and administrative


28,872


30,835


55,938


59,048


Depreciation and amortization


12,588


11,060


23,558


19,900


Total operating expenses


262,721


250,644


408,559


379,585


Operating income


115,729


147,602


95,405


134,141


Interest expense, net


1,723


1,927


3,251


2,967


Other income, net


(2,457

)


(2,257

)


(3,053

)


(3,256

)

Income before income taxes


116,463


147,932


95,207


134,430


Income tax expense


27,995


34,255


19,938


30,515


Net income

$

88,468


$

113,677


$

75,269


$

103,915


Basic net income per common share

$

1.36


$

1.76


$

1.16


$

1.61


Diluted net income per common share

$

1.34


$

1.71


$

1.14


$

1.56


Weighted average shares used in the calculation of net income per common share:


Basic


65,261


64,728


65,161


64,524


Diluted


65,969


66,543


65,954


66,593


1-800-FLOWERS.COM, Inc. and Subsidiaries
Selected Financial Information
Consolidated Statements of Cash Flows
(in thousands)
(unaudited)


Six months ended


December 26, 2021

December 27, 2020


Operating activities:


Net income

$

75,269


$

103,915


Adjustments to reconcile net income to net cash provided by operating activities:


Depreciation and amortization


23,558


19,900


Amortization of deferred financing costs


616


545


Deferred income taxes


(1,306

)


(1,388

)

Bad debt expense


(1,285

)


341


Stock-based compensation


5,296


5,358


Other non-cash items


(448

)


(321

)

Changes in operating items:


Trade receivables


(55,074

)


(56,372

)

Inventories


(28,534

)


25,369


Prepaid and other


8,172


(1,937

)

Accounts payable and accrued expenses


160,459


212,340


Other assets and liabilities


(875

)


8,897


Net cash provided by operating activities


185,848


316,647


Investing activities:


Acquisitions, net of cash acquired


(20,786

)


(250,943

)

Capital expenditures, net of non-cash expenditures


(32,608

)


(15,708

)

Purchase of equity investments


(1,285

)

Net cash used in investing activities


(53,394

)


(267,936

)


Financing activities:


Acquisition of treasury stock


(25,521

)


(12,470

)

Proceeds from exercise of employee stock options


846


1,032


Proceeds from bank borrowings


125,000


265,000


Repayment of bank borrowings


(135,000

)


(170,000

)

Debt issuance cost


(284

)


(2,193

)

Net cash used in (provided by) financing activities


(34,959

)


81,369


Net change in cash and cash equivalents


97,495


130,080


Cash and cash equivalents:


Beginning of period


173,573


240,506


End of period

$

271,068


$

370,586


1-800-FLOWERS.COM, Inc. and Subsidiaries
Selected Financial Information – Category Information
(dollars in thousands) (unaudited)
 

Three Months Ended

December 26,
2021

Vital Choice and
Alices’s Table
Transaction
Costs

As Adjusted
(non-GAAP)
December 26, 2021

December 27,
2020

PersonalizationMall
Litigation
& Transaction Costs

Harry & David
Store Closure
Costs

As Adjusted
(non-GAAP)
December 27,
2020

%
Change

Net revenues:

Consumer Floral & Gifts

$

315,083


$

$

315,083


$

305,357


$

$


$

305,357


3.2

%

BloomNet


37,930


37,930


34,051


34,051


11.4

%

Gourmet Foods & Gift Baskets


590,946


590,946


538,265


538,265


9.8

%

Corporate


69


69


135


135


-48.9

%

Intercompany eliminations


(984

)


(984

)


(552

)


(552

)

-78.3

%

Total net revenues

$

943,044


$

$

943,044


$

877,256


$

$


$

877,256


7.5

%


Gross profit:

Consumer Floral & Gifts

$

130,025


$

130,025


$

134,474


$

134,474


-3.3

%


41.3

%


41.3

%


44.0

%


44.0

%


BloomNet


16,021


16,021


16,820


16,820


-4.8

%


42.2

%


42.2

%


49.4

%


49.4

%


Gourmet Foods & Gift Baskets


232,239


232,239


246,890


246,890


-5.9

%


39.3

%


39.3

%


45.9

%


45.9

%


Corporate


165


165


62


62


166.1

%


239.1

%


239.1

%


45.9

%


45.9

%


Total gross profit

$

378,450


$

$

378,450


$

398,246


$

$


$

398,246


-5.0

%


40.1

%


40.1

%


45.4

%


45.4

%


EBITDA (non-GAAP):

Segment Contribution Margin (non-GAAP) (a):

Consumer Floral & Gifts

$

38,156


$

$

38,156


$

45,657


$

$


$

45,657


-16.4

%

BloomNet


11,887


11,887


12,141


12,141


-2.1

%

Gourmet Foods & Gift Baskets


110,502


110,502


135,621


(78

)


135,543


-18.5

%

Segment Contribution Margin Subtotal


160,545


160,545


193,419


(78

)


193,341


-17.0

%

Corporate (b)


(32,228

)


59


(32,169

)


(34,757

)


513


(34,244

)

6.1

%

EBITDA (non-GAAP)


128,317


59


128,376


158,662


513


(78

)


159,097


-19.3

%

Add: Stock-based compensation


2,291


2,291


2,965


2,965


-22.7

%

Add: Compensation charge related to NQ Plan Investment Appreciation


2,425


2,425


2,227


2,227


8.9

%

Adjusted EBITDA (non-GAAP)

$

133,033


$

59

$

133,092


$

163,854


$

513

$

(78

)

$

164,289


-19.0

%

1-800-FLOWERS.COM, Inc. and Subsidiaries
Selected Financial Information – Category Information
(dollars in thousands) (unaudited)
 

Six Months Ended

December 26,
2021

Vital Choice and
Alice’s Table
Transaction Costs

As Adjusted
(non-GAAP)
December 26,
2021

December 27,
2020

PersonalizationMall
Litigation
& Transaction Costs

Harry & David
Store Closure
Costs

As Adjusted
(non-GAAP)
December 27,
2020

%
Change

Net revenues:

Consumer Floral & Gifts

$

496,312


$

$

496,312


$

466,903


$

$


$

466,903


6.3

%

BloomNet


68,764


68,764


66,789


66,789


3.0

%

Gourmet Foods & Gift Baskets


688,428


688,428


628,194


628,194


9.6

%

Corporate


114


114


241


241


-52.7

%

Intercompany eliminations


(1,201

)


(1,201

)


(1,099

)


(1,099

)

-9.3

%

Total net revenues

$

1,252,417


$

$

1,252,417


$

1,161,028


$

$


$

1,161,028


7.9

%


Gross profit:

Consumer Floral & Gifts

$

206,028


$

$

206,028


$

200,060


$

$


$

200,060


3.0

%


41.5

%


41.5

%


42.8

%


42.8

%


BloomNet


31,430


31,430


31,658


31,658


-0.7

%


45.7

%


45.7

%


47.4

%


47.4

%


Gourmet Foods & Gift Baskets


266,402


266,402


281,897


281,897


-5.5

%


38.7

%


38.7

%


44.9

%


44.9

%


Corporate


104


104


111


111


-6.3

%


91.2

%


91.2

%


46.1

%


46.1

%


Total gross profit

$

503,964


$

$

503,964


$

513,726


$

$


$

513,726


-1.9

%


40.2

%


40.2

%


44.2

%


44.2

%


EBITDA (non-GAAP):

Segment Contribution Margin (non-GAAP) (a):

Consumer Floral & Gifts

$

57,346


$

$

57,346


$

64,893


$

$


$

64,893


-11.6

%

BloomNet


22,747


22,747


22,562


22,562


0.8

%

Gourmet Foods & Gift Baskets


102,829


102,829


133,040


(483

)


132,557


22.4

%

Segment Contribution Margin Subtotal


182,922


182,922


220,495


(483

)


220,012


-16.9

%

Corporate (b)


(63,959

)


515


(63,444

)


(66,454

)


5,403


(61,051

)

-3.9

%

EBITDA (non-GAAP)


118,963


515


119,478


154,041


5,403


(483

)


158,961


-24.8

%

Add: Stock-based compensation


5,296


5,296


5,358


5,358


-1.2

%

Add: Compensation charge related to NQ Plan Investment Appreciation


2,992


2,992


3,207


3,207


-6.7

%

Adjusted EBITDA (non-GAAP)

$

127,251


$

515

$

127,766


$

162,605


$

5,403

$

(483

)

$

167,526


-23.7

%

1-800-FLOWERS.COM, Inc. and Subsidiaries
Selected Financial Information
(in thousands) (unaudited)
 

Reconciliation of net income to adjusted net income (non-GAAP):


Three Months Ended


Six Months Ended


December 26, 2021

December 27, 2020

December 26, 2021

December 27, 2020


Net income


$

88,468

$

113,677


$

75,269


$

103,915


Adjustments to reconcile net income to adjusted net income (non-GAAP)


Add: Transaction costs


59


513


515


5,403


Deduct: Harry & David store closure cost adjustment


(78

)


(483

)

Deduct: Income tax effect on adjustments


65


125


(108

)


(1,117

)

Adjusted net income (non-GAAP)


$

88,592

$

114,237


$

75,676


$

107,718


Basic and diluted net income per common share


Basic


$

1.36

$

1.76


$

1.16


$

1.61


Diluted


$

1.34

$

1.71


$

1.14


$

1.56


Basic and diluted adjusted net income per common share (non-GAAP)


Basic


$

1.36

$

1.76


$

1.16


$

1.67


Diluted


$

1.34

$

1.72


$

1.15


$

1.62


Weighted average shares used in the calculation of net income and adjusted net income per common share


Basic


65,261


64,728


65,161


64,524


Diluted


65,969


66,543


65,954


66,593


1-800-FLOWERS.COM, Inc. and Subsidiaries
Selected Financial Information
(in thousands) (unaudited)
 

Reconciliation of net income to adjusted EBITDA (non-GAAP):


Three Months Ended


Six Months Ended

December 26, 2021

December 27, 2020

December 26, 2021

December 27, 2020


Net income

$

88,468


$

113,677


$

75,269

$

103,915


Add: Interest (income) expense, net


(734

)


(330

)


198


(289

)

Add: Depreciation and amortization


12,588


11,060


23,558


19,900


Add: Income tax expense


27,995


34,255


19,938


30,515


EBITDA


128,317


158,662


118,963


154,041


Add: Stock-based compensation


2,291


2,965


5,296


5,358


Add: Compensation charge related to NQ plan investment

appreciation


2,425


2,227


2,992


3,207


Add: Transaction costs


59


513


515


5,403


Deduct: Harry & David store closure cost adjustment


(78

)


(483

)

Adjusted EBITDA

$

133,092


$

164,289


$

127,766

$

167,526


(a) Segment performance is measured based on segment contribution margin or segment Adjusted EBITDA, reflecting only the direct controllable revenue and operating expenses of the segments, both of which are non-GAAP measurements. As such, management’s measure of profitability for these segments does not include the effect of corporate overhead, described above, depreciation and amortization, other income (net), and other items that we do not consider indicative of our core operating performance.

(b) Corporate expenses consist of the Company’s enterprise shared service cost centers, and include, among other items, Information Technology, Human Resources, Accounting and Finance, Legal, Executive and Customer Service Center functions, as well as Stock-Based Compensation. In order to leverage the Company’s infrastructure, these functions are operated under a centralized management platform, providing support services throughout the organization. The costs of these functions, other than those of the Customer Service Center, which are allocated directly to the above categories based upon usage, are included within corporate expenses as they are not directly allocable to a specific segment.

Investor Contact:

Joseph D. Pititto

(516) 237-6131

invest@1800flowers.com

Media Contact:

Kathleen Waugh

(516) 237-6028

kwaugh@1800flowers.com

Source: 1-800-FLOWERS.COM, Inc.