Solid Evidence a Recession is Unlikely this Year

Reliable Data, Not Emotions, are Pointing to a Growing U.S. Economy

In roughly one month, we will be halfway through 2023. While many point to the Fed’s pace of tightening and the downward sloping yield curve, as a reason to run around like Chicken Little warning of a coming recession, a fresh read of the economic tea leaves tells a different story. Just today, May 23, the PMI Output Index (PMI) rose to its highest reading in over a year. Home sales figures were also reported to show that new homes in May sold at the highest rate in over a year. These are both reliable leading indicators that point to growth in both services and manufacturing.

U.S. Composite PMI Output Index

Business activity in the U.S. increased to a 13-month high in May due in large part to strong growth in the services sector. This is a reliable indication that economic expansion has growing momentum. Despite the negative talk of those that are concerned that the Fed has lifted interest rates closer to historical norms and that the yield curve is still inverted, in part due to Covid era Fed yield-curve-control, the numbers suggest less caution might be warranted.

S&P Global said on Tuesday (May 23) its flash U.S. Composite PMI Output Index, which tracks the manufacturing and services sectors, rose to a reading of 54.5 this month. It indicates the highest level since April 2022 and is up from a reading of 53.4 in April. A reading above 50 indicates growth, this is the fourth consecutive month it has been above 50. The consensus among economists was only 52.6.

Home Sales

One sector that is directly impacted by interest rates is real estate. However, new home sales rose in April, this is a clear sign that prospective buyers are making deals with builders.

New homes in April were sold at a seasonally-adjusted annual rate of 683,000, Its the highest rate since March 2022. The April data represents a 4.1% gain from March’s revised rate of 656,000,. The report was from the Census and Department of Housing and Urban Development and was reported Tuesday May 23. Economists had expected new home sales to decline to 670,000 from a March rate of 683,000. It was the largest month-over-month increase since December 2022.

Leading Indicators

PMI is forward-looking as it surveys purchasing managers’ expectations and intentions for the coming months. By capturing their sentiment on future orders, production plans, and hiring intentions, PMI offers insights into economic trends that have yet to be reflected in other after-the-fact indicators.

Home sales are considered a leading indicator because they can serve as a measure of other needs and broader economic trends. Home sales have a significant impact on related sectors, such as construction, home improvement, finance, and consumer spending. Changes in home sales can influence economic activity and indicate shifts in consumer confidence, employment levels, and overall economic health.

While many economic reports offer rear-view mirror data, these reports are true indicators of business behavior as it plans for future expectations, and consumer behavior as it is confident that it will have the resources available to purchase and outfit a new home.

The upbeat reports prompted the Atlanta Federal Reserve to raise its second-quarter gross domestic product estimate to a 2.9% annualized rate from a 2.6% pace. The economy grew at a 1.1% rate in the first quarter.

Take Away

Many economists are negative about the economic outlook later this year. Market participants have been positioning themselves with the notion that there may be a late year recession. Is the notion misguided? Recent data suggests there may be buying opportunities for those willing to go against the tide of pundits preaching recession.

No one has a crystal ball. In good markets and bad, there is no replacement for good research before you put on a position, and then for as long as the position remains in your portfolio.

Channelchek is a great resource for information to follow the companies not likely being reported in traditional outlets. Turn to this online free resource as you evaluate small and microcap stocks.

Paul Hoffman

Managing Editor, Channelchek

Sources

World Economic Outlook

Barron’s (May 23, 2023)

Reuters (May 23, 2023)

The Russell Reconstitution Preliminary List

Image Credit: Channelchek (S.L)

The New Russell Indexes Unconfirmed Versions – How Investors Use Them

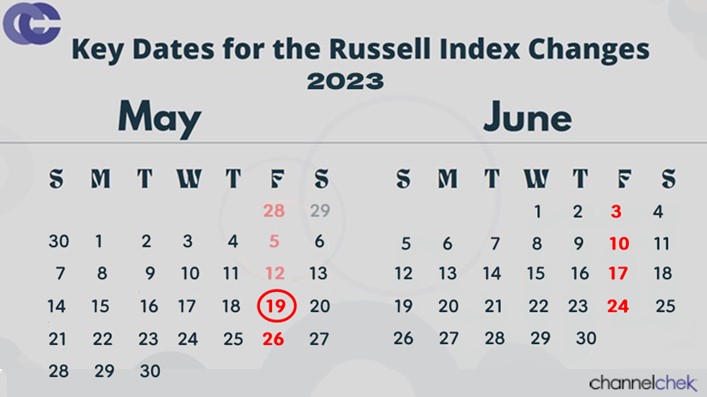
The preliminary list of stocks to be included in the Russell Reconstitution, and also which Russell Index, is a huge day for many stock investors and the impacted companies as well. This year, it occurs on Friday, May 19. The list, although preliminary and subject to refinements each Friday through June, includes the stocks that are believed to meet the requirements based on valuations taken on April 28. This is the first official file from the popular index provider, in addition to informing the investor public what to expect when the indexes are reconstituted. The reconstitution can be expected to impact prices as index fund managers readjust holdings. The event also, for many, redefines market-cap levels that are considered small-cap, mid-cap, and large-cap.

Background

The Russell Reconstitution is an annual event that reconfigures the membership of the Russell indexes by defining the top 3000 stocks based on market-cap (Russell 3000), then the top 1000 stocks (Russell 1000), and reclassifying the smaller 2000 stocks to form the Russell 2000 Small Cap Index. These serve as a benchmark for many institutional investors, as the indexes reflect the performance of the U.S. equity market across different market-cap classifications. The reconstitution process adds, removes, and weights stocks to ensure the indexes accurately represent the market.

The Preliminary List which will be published after the market closes on May 19, 2023, is a crucial step in the market cap reclassification process. It provides market participants with an initial glimpse into potential additions and deletions from the indexes. The stocks listed on this preliminary roster may experience increased attention from investors, as it hints at potential buying or selling pressure once the final reconstitution is completed.

The newly reconstituted indexes become live after the market close on June 23.

Implications for Investors

The release of the Russell Preliminary List on May 19 could provide opportunities for investors, including:

Enhanced Market Visibility – Companies listed on the Preliminary List may experience increased trading volumes and heightened market popularity, or even scrutiny, as investors evaluate their potential inclusion in the Russell indexes.

Potential Price Movements – Stocks slated for addition or deletion from the indexes can experience price volatility as market participants adjust their positions to align with the anticipated reconstitution changes.

Portfolio Adjustments – Active managers who track the Russell indexes may need to realign their portfolios to reflect the new index constituents, potentially triggering buying or selling activity in affected stocks.

Investor Considerations

Stock market participants should consider the following factors when analyzing the Preliminary List and its potential impact:

Final Reconstitution – The Preliminary List is subject to changes in the final reconstitution, which is typically announced in late June. Investors should monitor subsequent updates to confirm the actual index membership changes. These updates may occur as the result of faulty data or dramatic changes to the company such as a merger since the April 28 market cap snapshot.

Fundamental Analysis – As always, the fundamentals and financial health of the companies should be among the most important factors for non-index investors to consider. In the past, potential additions often presented attractive investment opportunities, while potential deletions may mean the stock gets less attention from investors.

Take Away

The release of the Preliminary List on May 19, 2023, marks a significant milestone in the Russell Reconstitution process. Investors should pay close attention to the stocks listed, as they may experience increased market visibility and potential price movements. However, it is important to remember that the Preliminary List is subject to changes. Thorough fundamental analysis, including earnings, potential growth, and liquidity assessment, is prudent for most stock investments. For information to evaluate small-cap names, look to Channelchek as a source of data on over 6,000 small cap companies.

Paul Hoffman

Managing Editor, Channelchek

Sources

https://research.ftserussell.com/products/downloads/FTSE_FAQ_Document_Russell_US_Equity_2023.pdf

The Reasons Veteran Investors are Now Eyeing Small-Cap Stocks

The Growing Case for Small-Cap Stocks: Is it Time to Make the Shift?

The more time that passes with small cap stocks lagging the large and mega caps, the louder very respected market voices are urging investors to move more assets to these smaller companies. The pro small cap stock outlook was reflected again in a recent Barron’s article. The piece highlighted what others continue to point out, that the large cap, S&P 500, is up nearly 8% on the year, but the gains have only been because of the performance of a few big tech stocks and the math used to measure the equity index.

A very eye-opening line in Barron’s points out that, “Apple (ticker: AAPL), Amazon.com (AMZN), Meta Platforms (META), Alphabet (GOOGL), Microsoft (MSFT), Nvidia (NVDA), and Tesla (TSLA) are up between 29% and 99% for the year.” These stocks make up a significant weighting of the large cap index, which means that much of the other large cap stocks have been negative in order to only provide an 8% return. To demonstrate how the weighting of the larger companies distorts return, just look at the Invesco S&P 500 Equal Weight ETF (RSP). This ETF weighs each stock in the S&P 500 equally. This has the effect of avoiding overweighting and one stock. This ETF is flat year-to-date. In contrast, The few tech names listed above total just under a third of the entire index.

The article also pointed out the truth that smaller names, those not in the S&P 500, have struggled. What does this mean for investors? Barron’s wrote, “They also look cheap—-and it may be time to take a nibble.” The case that others are also making is based on a number of current market setups. These include value, market history, and even macroeconomic trends that now may favor smaller companies over larger ones.

Big Tech companies like those mentioned above borrow massive amounts of money, they have been the beneficiaries of lower bond rates out on the yield curve. In addition to borrowing costs still below normal, valuing these stocks based on future earnings and comparing the expected earnings to available interest rates have caused investors to be less inclined to tie up money for ten years or more, (at 3.50%). Also, better than expected first-quarter earnings of big tech-inspired investors – product enhancements using artificial intelligence was credited with much of this.

Royce Funds’ Premier Quality Fund invests in “small cap quality.” In a recent article to investors co-lead portfolio managers Lauren Romeo and Steven McBoyle explained why, “small-cap quality looks so compelling in today’s uncertain investment environment.”  The portfolio managers wrote, “Secular changes in economic trends, interest rates, and monetary and fiscal policies are creating seismic shifts in the investment landscape. The types of companies that benefited most from the past decade’s zero interest rate, low inflation, and low nominal growth regime—specifically, mega-caps and growth stocks—are unlikely to lead going forward.” Under this backdrop, the two gave their perspective which is that, “the unfolding macro environment appears to be set for quality small caps to capture and sustain long-term outperformance over large cap” through an uncertain period that is characterized by a near certain transition.

If tech stocks again falter because rates rise, advancement slows, or competition grows, the appearance of the S&P 500 large cap index stocks performing well could diminish. “Market gains continue to be dominated by uber-caps, masking the fact that 48% of S&P 500 member stocks are down year to date,” wrote Chris Harvey, chief U.S. equity strategist at Wells Fargo, on May 12. 

Within the same index family (S&P), is the S&P 600, which is a small cap index. It is not currently having a positive year, and is down about 3%. Interestingly, the reverse argument can be made for this benchmark since it is overweighted in one specific sector. Financials, which have taken a beating this year is the largest sector weighting in the S&P 600. It accounts for just over a fifth of the performance. This has dragged the index lower, as regional banks have seen billions of depositor dollars walk out the door as savers and investors move assets to higher-yielding money-market funds. This, as we know, has caused liquidity problems at many banks, and caused some to fail.

2023 has been a challenging market for stocks despite the S&P 500 performance. It has been challenging for small caps too, but not as challenging as the S&P 600 performance would have one believe without looking under the hood. Small caps, independent of the high weighting of financials in the benchmark are positive on the year. One very real concern large cap investors are now facing is whether the flow into large cap funds have overly inflated the value, based on most stock valuation metrics, above where they would naturally trade if not for indexed funds.

The economy is not expected to get much stronger this year. Higher interest rates have already begun to stress the US economy, and banking problems are expected to cause tighter lending and consumer spending. And as mentioned a few times, the widely quoted S&P 500’s performance, is covering up what has mostly been a tough equity market.

But while large caps look expensive, for the reasons mentioned, respected experts say small caps look cheap. The S&P 600’s aggregate forward price/earnings multiple is just under 13 times – this compares with the S&P 500 which is 18 times. While on the surface, this doesn’t seem striking, it is! While the difference between 13 times and 18 times doesn’t sound wide, it marks a 30% difference. That is a massive discount. Historically the small cap index trades at a slight premium to its large-cap counterpart, but even in times of economic stress, it doesn’t trade at such a wide discount. In March of 2020, the height of pandemic risk aversion, its multiple was only 25% below the S&P 500.

Take Away

It has been a tougher year for stocks than the performance of the large cap S&P 500 would have one think without digging below the surface and netting out its largest sector weighting. The small cap S&P 600 is down, but largely because of its own largest sector weighting. This is one of the many problems inherent in how popular index investing has become. While stocks in general seem to be facing increasing headwinds, investors that selectively evaluate small cap names for inclusion in the equity portion of their portfolio may find the payoff is better than the alternatives.

Evaluating small cap opportunities is easy with  Channelchek as the platform specializes in supplying data, information, and no-nonsense research on smaller opportunities. Please feel free to explore further by scrolling up to the search bar and typing in an industry, company name, or ticker. Channelchek is a free platform designed to help investors and opportunities find each other.

Paul Hoffman

Managing Editor, Channelchek

Sources

https://www.barrons.com/articles/small-cap-stocks-big-tech-15df5779?mod=hp_LEAD_2

https://www.royceinvest.com/insights/2023/2Q23/why-the-time-looks-right-for-quality?utm_source=royce-mktg&utm_medium=email&utm_campaign=insights&utm_content=txt-3

https://app.koyfin.com/share/084b52d626

How Family Offices are Reallocating Portfolios

A New Report Indicates How the Uber Wealthy Have Adjusted Investments

What are the uber-wealthy investing in? Goldman Sachs just released its annual Family Office Investment Insight Report titled Eyes on the Horizon. The report presents the perspectives of 166 investment decision-makers at family offices. This is interesting because the still turbulent investment climate has shifted dramatically over 12 months, and comparisons of family office (FO) portfolio construction with last year indicate the mindset of the FOs they entrust to implement large investment portfolios.  

Who was Surveyed

A family office is a private wealth management firm that provides investment management, financial planning, tax and estate planning, and other services to ultra-high-net-worth families. Family offices are typically set up by families with assets of at least $100 million.

The Goldman report pulls information from FOs across the globe. It includes 57% in the Americas, 21% in Europe, and 22% in Asia-Pacific. Within the survey, 72% reported a net worth in excess of a billion.

What was Discovered

Family offices continue to concentrate on secular growth themes that could withstand economic cycles and create value over time: Worldwide, 43% of FOs believe that information technology is overweighted in their holdings, 34% of family offices plan to lighten up on healthcare.

Family offices still allocate a significant amount of money to alternatives. Of their average holdings 44% are made up of real estate, infrastructure, hedge funds, and private credit. While the markets are different behaving differently, the long-term view held by most is that they intend to roughly maintain their allocations over the next 12 months. The average allocation to private equity increased from 24% to 26%, compare this against the public market allocation, which declined from 31% to 28%.

For those that anticipate larger reallocations, several family offices anticipate expanding their investments in private credit, private real estate, and private infrastructure.

The hold-the-course mindset, focusing on long-term growth themes, also applies to geographic allocations, with a strong focus on U.S. markets. The U.S. represents 63%, and “other developed nations” average 21% of holdings. Interestingly, the report reveals that 41% of Asia Pacific offices included in the report expect to increase allocations to the U.S. in the next 12 months.

Despite the high inflation being experienced globally, 12% of portfolios are in cash and cash equivalents. This capital is expected to be deployed in non-cash investments by 35% of the respondents.

One clue as to where this may go is the finding that 39% of family offices plan to up their allocation in fixed income. In comparison to the start of last year, yields on fixed income investments are currently much higher.

In the category of digital assets, both cryptocurrencies and other blockchain-derived financial investments, 32% of FOs are currently invested here. This is a much deeper plunge into this asset class than had been reported in 2021 when just 16% held cryptocurrencies. However, a large portion is still uninvested in digital assets, and they don’t expect to be over the coming 12 months. This percentage of uninvested in digital assets that don’t intend to be has jumped from 39% to 62%. Those that had replied a year earlier that they might be interested in digital in the coming year was much higher at 45%. The current survey now has that expectation at 12%.

A full 42% of family offices don’t use traditional investment leverage.

Actual Change in Allocation

Source: Eyes on the Horizon

According to the Goldman Sachs report, providing venture capital is a popular among family offices worldwide. The lowest percentage of family offices with VC investments are from Europe, this compares with 86% in the Americas, and 91 in Asia Pacific.

Looking Forward

Private credit is a small part of the average family office portfolio at only 3%. What is noteworthy is that 30% of respondents said they expect to increase their allocation here in the next year. One reason this may be attractive to them is that the rates paid on these arrangements typically resets as interest rates move up or down.

“Sustainable” investments, particularly carbon transition related holdings, account for 39% of respondents that are focused on sustainable strategic investments. Among these, 48% invest directly in companies that they expect will have a positive environmental impact. The regulatory climate provides tailwinds for this investment category.

Expected Change in Allocation (Future)

Source: Eyes on the Horizon

Family office allocation to alternative investments is higher than the average household. The long-term time horizon, due diligence capabilities, and lower liquidity needs makes the higher allocation unsurprising. The turbulent economic environment has, for some, made this asset class more compelling. Private markets have been characterized by historically higher returns with less specific valuation changes.

Take Away

Family offices are private wealth management firms that provide customized services to ultra-high-net-worth families. Reviewing how teams of financial and investment professionals shift allocations at FOs is worth reviewing for a number of reasons. Chief among them is they control large sums of cash, so opportunities they are moving out of or into can help solidify market trends. There is also, of course, the tendency for investors to look a little closer when they see a professional or successful investor involved. This can at times, provide seeds for ideas on what to do within one’s own portfolio.

Some of the investments used by family offices require one to be an accredited investor. Do you know if you’re considered by the SEC as an accredited investor, one good way to know is by clicking here to get answers.

Paul Hoffman

Managing Editor, Channelchek

Sources

https://www.gsam.com/content/dam/pwm/direct-links/us/en/PDF/onegs_familyoffice_eyesonthehorizon.pdf?sa=n&rd=n

Understanding Stock Options: A Comprehensive Guide for Investors

Stock Options Trading Explained

Stock options, sometimes referred to as derivatives, are a tool for managing risk when combined with a related equity holding, or as a means to amplify return on moves made by a stock or index. There are also related income strategies investors should know about. Newer investors often learn they could have benefited from options after it’s too late. Below we talk about stock options, what they are and how they are used to fill some investor knowledge gaps they may not even be aware they have. This discussion includes understanding what options are, why they are used, the different types of options available, and how you can use them to hedge against the market moving in the wrong direction. You’ll also discover how options can be used to amplify portfolio results.

What are Options?

Options are contracts that give the buyer the right, but not the obligation, to buy or sell an underlying asset at a specified price and date(s). The underlying asset can be anything from stocks, bonds, commodities, or even currencies, for the purpose of this article, we focus on stocks and stock indices.  

There are two types of stock options: call options and put options. A call option gives the buyer the right, but not the obligation, to buy the underlying stock at a specified price and date. A put option gives the buyer the right, but not the obligation, to sell the underlying stock at a specified price and date.

When an investor buys an option, they are said to be “long” the option. When they sell an option, they are said to be “short” the option. Being long a call option is similar to being long the stock, as the investor profits if the stock rises. Being long a put option is similar to being short the stock, as the investor profits if the stock price falls.

Why Are Options Used?

Options are used for various reasons, such as speculation, hedging, and income generation. Speculators implement strategies to bet on the direction of the options underlying stock. For example, an investor that expects a stock price may rise will buy a call option. It they believe it will fall, they could get short exposure by going long a put option.

Options can also serve investors to hedge (protect) their holdings and offset potential losses in the underlying position. For example, if an investor owns XYZ Stock, they can buy a put option to protect against a potential drop in XYZ Stock. If the stock price falls, the put option will increase in value; depending on the shares controlled by the option, it can offset the decline in the stock.

Income generation using stock options is growing in usage. The scenario where this works is when an investor sells a call option against a stock they own, as part of the sale, they collect a premium for the option. If the stock price remains below the strike price of the call option, the investor keeps the premium and the stock. If the stock price rises above the strike price, the investor must sell the stock at the strike price, but still keeps the premium. This works best in a flat or declining market.

Using Options as a Hedge Against Losses

Options can be used as a hedge against the market moving against a stock position. For example, if an investor owns 100 shares of ABC Stock, currently trading at $50 per share. And the investor is concerned that the stock price may fall, but does not want to sell the stock and miss out on potential gains if the stock price rises, or in some cases, create a tax situation.

To hedge against a potential drop in ABC’s stock price, the investor may decide to buy a put option with a strike price of $45, expiring in three months, for a premium (cost) of $2 per share. If the stock price falls below $45, the put option will increase in value, offsetting the losses in the stock. If the stock price remains above $45, the put option will expire worthless, and the investor keeps the stock and the premium.

Time Decay, Intrinsic Value, and Extrinsic Value

So far, the use of options described here have been fairly straightforward. But there are considerations that might help keep this portfolio tool in the toolbox until it is most needed. The considerations are time decay, intrinsic value, and extrinsic value. Here is what is important to understand about these realities.  

Time Decay:

Time decay, also known as theta, refers to the decrease in the value of an option as it approaches its expiration date. Options have a limited lifespan, and as time passes, the likelihood of the option ending up in the money decreases. Therefore, the time value of an option decreases as it approaches its expiration date, resulting in a decrease in the option premium.

Intrinsic Value:

Intrinsic value is the amount by which an option is in the money. In other words, it is the difference between the current market price of the stock and the strike price of the option. For example, if a call option has a strike price of $50 and the underlying stock is currently trading at $60, the intrinsic value of the option is $10 ($60 – $50).

Intrinsic value only applies to in-the-money options, as options that are out-of-the-money or at-the-money have no intrinsic value. The intrinsic value of an option is important because it represents the profit that an option holder would realize if they exercised the option immediately.

Extrinsic Value:

Extrinsic value, also known as time value, is the portion of an option’s premium that is not attributed to its intrinsic value. Extrinsic value is the amount that investors are willing to pay for the time left until expiration and the possibility of the underlying asset moving in their favor.

Extrinsic value is affected by several factors, including the time left until expiration, and the volatility of the underlying stock. As the expiration date approaches, the extrinsic value of an option decreases, and the option premium decreases as well.

Options Premium:

The options premium is the price that the buyer pays to purchase an option. The options premium is determined by various factors, including the current market price of the underlying asset, the strike price, the expiration date, and the level of volatility in the stocks price.

The options premium is made up of intrinsic value and extrinsic value. The intrinsic value represents the portion of the premium that is directly attributable to the difference between the current market price of the underlying asset and the strike price of the option. The extrinsic value represents the portion of the premium that is not attributable to the intrinsic value and is based on the time left until expiration, the level of volatility in the market, and other factors.

Understanding time decay, intrinsic value, and extrinsic value is crucial when it comes to trading stock options. Time decay affects the value of an option as it approaches its expiration date, while intrinsic value and extrinsic value make up the options premium. By understanding these concepts, investors can better understand their costs and make more enlightened decisions.

Take Away

Stock investors transact in stock options for various reasons. These include portfolio protection, income generation for an existing portfolio, and speculating on the direction of an asset. There are considerations associated with holding options beyond any commission or bid/offer spread. These are intrinsic premium costs for in-the-money trades, extrinsic as they relate to value and decay on the position as it approaches its expiration date.

Adding risk management using options to your investment tools to call upon when appropriate can reduce stress; speculating with the help of derivatives can be very rewarding but may have the impact of increasing portfolio swings in value along the way.

Paul Hoffman

Managing Editor, Channelchek

US Debt Ceiling Explained

Source: The White House

What Happens if the US Hits the Debt Ceiling?

The US debt limit is the total amount of money the United States government is authorized to borrow to meet its existing obligations. These include interest on debt, Social Security, military costs, government payroll, utilities, tax refunds, and all costs associated with running the country.

The debt limit is not designed to authorize new spending commitments. Its purpose is to provide adequate financing for existing obligations that Congress, through the years, has approved. While taxes provide revenue to the US Treasury Department, taxation has not been adequate since the mid-1990s to satisfy US spending. This borrowing cap, the so-called debt ceiling, is the maximum congressional representatives have deemed prudent each year, and has always been raised to avert lost faith in the US and its currency.

Failing to increase the debt limit would have catastrophic economic consequences. It would cause the government to default on its legal obligations – which has never happened before. Default would bring about another financial crisis and threaten the financial well-being of American citizens. Since a default would be much more costly than Congress meeting to approve a bump up in the borrowing limit, which the President could then sign, it is likely that any stand-offf will be resolved on time.

Congress has always acted when called upon to raise the debt limit. Since 1960, Congress has acted 78 separate times to permanently raise, temporarily extend, or revise the definition of the debt.

How Does this Apply Today?

According to the Congressional Budget Office, tax receipts through April have been less than the CBO anticipated in February. The Budget Office now estimates that there is a significantly elevated risk that the US Treasury will run out of funds in early June 2023. The US Treasury Secretary has even warned that after June 1, the US will have trouble meeting its obligations. The implications could include a credit rating downgrade in US debt which could translate to higher interest rates. If US Treasury obligations, the so-called “risk free” investments, does not pay bondholders on time (interest), then the entire underpinning of an economy that relies on the faith in its economic system, could quickly unravel.

What Took Us Here?

On January 19, 2023, the statutory limit on the amount of debt that the Department of the Treasury could issue was reached. At that time, the Treasury announced a “debt issuance suspension period” during which, under the law, can take “extraordinary measures” to borrow additional funds without breaching the debt ceiling.

The Treasury Dept. and the CBO projected that the measures would likely be exhausted between July and September 2023. They warned that the projections were uncertain, especially since tax receipts in April were a wildcard.

It’s now known that receipts from income tax payments processed in April were less than anticipated. Making matters more difficult, the Internal Revenue Service (IRS) is quickly processing tax return payments.

If the debt limit is not raised or suspended before the extraordinary measures are exhausted, the government will ultimately be unable to pay its obligations fully. As a result, the government will have to delay making payments for some activities, default on its debt obligations, or both.

What Now?

The House of Representatives passed a package to raise the debt ceiling by $1.5 trillion in late April. The bill, includes spending cuts, additional work requirements in safety net programs, and other measures that are unpopular with Democrats. To pass, the Senate, which has a Democratic majority, would have to pass it. Democratic Senator Chuck Schumer described the chances as “dead on arrival.”

House Speaker McCarthy has accepted an invitation from President Biden to meet on May 9 to discuss debt ceiling limits. The position the White House is maintaining is that it will not negotiate over the debt ceiling. The President’s party is looking for a much higher debt ceiling that allows for greater borrowing powers.

In the past, debt ceiling negotiations have often gone into the night on the last day and have suddenly been resolved in the nick of time. Treasury Secretary Yellen made mention of this and warned that past debt limit impasses have shown that waiting until the last minute can cause serious harm, including damage to business and consumer confidence as well as increased short-term borrowing costs for taxpayers. She added that it also makes the US vulnerable in terms of national security.

Expect volatility in all markets as open discussions and likely disappointments will heat up beginning at the May 9th meeting between McCarthy and Biden.

Paul Hoffman

Managing Editor, Channelchek

Sources

https://fiscaldata.treasury.gov/americas-finance-guide/

https://www.cbo.gov/taxonomy/term/2/latest

https://www.cbo.gov/publication/58906

Which Other Banks Could Wipeout?

Image Credit: Hellinahandbasket (Flickr)

Well Known Banks that May be Secretly Insolvent

The taming of monetary policy necessary to slow price inflation has triggered a corrective trend in the valuation of financial instruments. Many big banks in the United States have substantially increased their use of an accounting technique that allows them to avoid marking certain assets at their current market value, instead using the face value in their balance sheet calculations. This accounting technique consists of announcing that they intend to hold such assets to maturity.

As of the end of 2022, the bank with the largest amount of assets marked as “held to maturity” relative to capital was Charles Schwab. Apart from being structured as a bank, Charles Schwab is a prominent stockbroker and owns TD Ameritrade, another prominent stockbroker. Charles Schwab had over $173 billion in assets marked as “held to maturity.” Its capital (assets minus liabilities) stood at under $37 billion. At that time, the difference between the market value and face value of assets held to maturity was over $14 billion.

If the accounting technique had not been used the capital would have stood at around $23 billion. This amount is under half the $56 billion Charles Schwab had in capital at the end of 2021. This is also under 15 percent of the amount of assets held to maturity, under 10 percent of securities, and under 5 percent of total assets. An asset ten years from maturity is reduced in present value by 15 percent with a 3 percent increase in the interest rate. An asset twenty years from maturity is reduced in present value by 15 percent with a 1.5 percent increase in the interest rate.

The interest rates for long-term financial instruments have remained relatively stable throughout the first quarter of 2023, but this may be subject to change as many of the long-term assets of recently failed Silicon Valley Bank and Signature Bank must be sold off for the Federal Deposit Insurance Corporation to replenish its liquidity. The long-term interest rate is also heavily dependent on inflation expectations, as with higher inflation a higher nominal rate is necessary to obtain the same real rate. It is also important to remember that the US Congress has persisted in not raising the debt ceiling for the government, which is currently projected to not be able to meet all its obligations by August. This could impact the value of treasuries held by the banks.

Other banks that may be close to an effective insolvency include the Bank of Hawaii and the Banco Popular de Puerto Rico (BPPR). The Bank of Hawaii’s hypothetical shortfall as of the end of 2022 already exceeded 60 percent of its capital. The BPPR has over double its capital in assets held to maturity. All three banks—Bank of Hawaii, BPPR, and Charles Schwab—have lost between one-third and one-half of their market capitalization over the last month.

It is difficult to say with certainty whether they are indeed secretly close to insolvency as they may have some form of insurance that could absorb some of the impact from a loss of value in their assets, but if this were the case it is not clear why they would need to employ this questionable accounting technique so heavily. The risk of insolvency is currently the highest it’s been in over a decade.

Central banks can solve liquidity problems while continuing to raise interest rates and fight price inflation, but they cannot solve solvency problems without pivoting monetary policy or through blatant bailouts, which could increase inflation expectations, exacerbating the problem of decreasing valuations of long-term assets. In the end, the Federal Reserve might find that the most effective way to preserve the entire system is to let the weakest fail.

Are You an Accredited Investor? Here’s What You Need to Know

Demystifying What it Means to be an Accredited Investor

Have you looked into determing if you qualify as an accredited investor? Individuals and entities that are deemed “accredited” may be permitted to participate in certain types of investment offerings that would not otherwise be available to those that don’t meet the criteria. It allows access to a broader range of offerings, many of which are considered to allow for greater potential returns in exchange for higher potential downside.

What is an Accredited Investor?

An accredited investor includes those that meet certain financial criteria set by the Securities and Exchange Commission (SEC) in order to participate in certain types of private securities offerings. Accredited investors are deemed to have the financial sophistication and ability to bear the risks associated with these investments.

The SEC defines an accredited investor as someone who has a net worth of at least $1 million (excluding the value of their primary residence) or who has earned at least $200,000 in annual income ($300,000 for married couples) for the last two years and has a reasonable expectation of earning the same income in the current year. Entities such as trusts, partnerships, corporations, and certain types of retirement accounts can also be accredited investors if they meet certain financial criteria.

Why Learn if You’re Accredited

So why is it worth knowing if you qualify as an accredited investor? For one, it opens up a wider range of investment opportunities to allocate your capital to. This can include private securities offerings, private equity funds, venture capital funds, and direct investment in hedge funds. These types of investments are considered riskier than publicly offered registered securities but may offer higher potential returns.

Another benefit of being an accredited investor is that it allows you to invest in crowdfunding opportunities that are only available to accredited investors. Crowdfunding is the practice of funding a project or venture by raising small amounts of money from a large number of people, typically via the internet. While crowdfunding is open to anyone, there are certain types of crowdfunding that are only available to accredited investors. These offerings, called Regulation D (Reg D) offerings, allow companies to raise capital without having to register with the SEC.

Reg D offerings can take several forms, including Rule 506(b) and Rule 506(c) offerings. Rule 506(b) offerings allow up to 35 non-accredited investors to participate in the offering, while Rule 506(c) offerings are only available to accredited investors. Companies raising capital through a Rule 506(c) offering are required to verify the accredited investor status of participants through documentation such as tax returns or financial statements.

Important to Think About

It seems obvious, but worth noting that just because you are an accredited investor does not necessarily mean that investment opportunities that become available to you will work out well. It’s crucial to do your due diligence and thoroughly research any investment opportunity before committing funds. While those that meet the definition of accredited and may have attained a higher degree of financial sophistication increase their opportunities, investing always involves a varying degree of risk.

Is it worth becoming an accredited investor to open the door to exploring private securities offerings? While this decision ultimately depends on your individual financial goals and circumstances, it’s worth considering the potential downsides of becoming an accredited investor solely for this reason.

For one, becoming an accredited investor often requires a significant amount of wealth, which may not be feasible for everyone. Additionally, investing in private securities offerings often requires a higher degree of financial sophistication and access to professional investment advice. It’s important to consider whether or not you have the resources to properly evaluate investment opportunities and make informed decisions.

Furthermore, private securities offerings are often less liquid or illiquid, meaning that it can be challenging to sell your investment if you need to access your funds quickly. This lack of liquidity can be a significant disadvantage for investors who may need to access their funds in the short term.

Take Away

Being an accredited investor allows individuals and entities to participate in certain types of private securities offerings that are typically not available to non-accredited investors. This can provide access to higher potential returns but also comes with a higher degree of risk. It’s important to thoroughly research any investment opportunity before committing your funds and to consider the potential downsides of becoming an accredited investor solely for the purpose of investing in private securities offerings.

Did you Know?

From time to time, Noble Capital Markets, Inc. may post Investment opportunities (“Offerings”) on its site that may only be purchased by accredited investors, as defined by Rule 501 of Regulation D under the Securities Act of 1933 (“Regulation D”). To learn more about your qualifications and potentially these offerings, click here to explore further.

Paul Hoffman

Managing Editor, Channelchek

Sources

https://www.sec.gov/education/capitalraising/building-blocks/accredited-investor

https://www.finra.org/rules-guidance/guidance/faqs/private-placement-frequently-asked-questions-faq

https://www.channelchek.com/terms/accredited-investors

Hedge Funds 101: What They Are and How They Work in Investing

Developing a Deeper Understanding of Hedge Fund Investments

Hedge funds have become a buzzword in the world of investing, it’s one of those investment instruments that people think they can explain until they’re asked to – not everyone understands what they are or how they work. In simple terms, a hedge fund is a private investment vehicle that is managed by a professional investment manager or team. The primary goal of the fund is to generate above market returns for its investors by using various investment strategies that are often more complex and riskier than traditional investment vehicles like managed mutual funds or index funds. The following should help fill many of the gaps in investors understanding of these funds, including their legal structure, investment strategies, and how they differ from other types of investment vehicles.

Structure of a Hedge Fund

Hedge funds are formed as limited partnerships. This makes investors in the fund limited partners. The investment manager is the general partner of the fund and is responsible for making investment decisions on behalf of the limited partners. The general partner is also responsible for raising capital for the fund, safekeeping, and negotiating fees with investors.

Hedge funds are typically only available to accredited investors, which requires that they meet SEC wealth, income, or financial sophistication thresholds. This is because hedge funds are considered to be high-risk investments and are not subject to the same regulations as other types of investment vehicles. Accredited investors are assumed to have the financial sophistication and resources to handle the risks associated with hedge fund investments.

Investment Strategies

Hedge funds use a wide variety of investment strategies to generate returns for their investors. These strategies can range from relatively simple, such as long/short equity, to highly complex, such as quantitative trading or event-driven investing. Some of the most common investment strategies used by hedge funds include:

Long/Short Equity – This strategy involves buying stocks that are expected to increase in value (long) and shorting stocks that are expected to decrease in value (short).

Event-Driven – This strategy involves investing in stocks that are likely to be impacted by specific events, such as mergers, acquisitions, or bankruptcies.

Quantitative Trading – This strategy involves using mathematical models to identify trading opportunities based on patterns in historical data.

Distressed Investing – This strategy involves investing in companies that are in financial distress or undergoing restructuring.

Global Macro – This strategy involves investing in currencies, commodities, and other assets based on macroeconomic trends.

Valuing a Stock

One of the key skills required to be a successful hedge fund manager is the ability to value a stock or other opportunity. This involves analyzing a company’s financial statements, industry trends, and other relevant factors to determine the intrinsic value of the company’s worth. If the stock is undervalued, the hedge fund may decide to invest in it in the hopes that its value will increase over time. Conversely, if the stock is overvalued, the hedge fund may decide to create a short position in it in the hopes that its value will decrease.

Compared to Other Investment Vehicles

Hedge funds differ from other types of investment vehicles in several ways. First, hedge funds are not subject to the same regulations as other types of investment vehicles, which means that they have more flexibility to use complex investment strategies and take on higher levels of risk. Second, as mentioned above, hedge funds are typically only available to accredited investors, whereas more traditional types of investments like mutual funds or index funds are available to the general public.  Finally, hedge funds typically charge higher fees than other types of investment vehicles, which can include both management fees and performance fees.

Take Away

Hedge funds are complex investment vehicles that can use a variety of riskier methods in an attempt to generate high returns for their investors by using a wide variety of investment strategies. These strategies can range from relatively simple to highly complex and are often more risky than other types of investments. Hedge funds are structured as limited partnerships and are typically only available to accredited investors. They differ from other types of investment vehicles in their lack of regulatory oversight, and known to charge higher fees.

Paul Hoffman

Managing Editor, Channelchek

Sources:

https://www.sec.gov/education/capitalraising/building-blocks/accredited-investor

Will the IRS Accept Cash?

I Tried to Pay My Taxes in Cash – Here’s What Happened

About two-thirds of all U.S. residents who file federal income taxes typically get a refund. Unfortunately, this year I am among the other third who owe the Internal Revenue Service money. So I tried something I’ve never done before and few people do: I wanted to pay my tax bill in cash – that is, with real paper currency.

In our nearly cashless society, this might sound like a hassle.

This article was republished with permission from The Conversation, a news site dedicated to sharing ideas from academic experts. It represents the research-based findings and thoughts of, Jay L. Zagorsky, Clinical Associate Professor, Boston University.

Why Pay Taxes in Cash?

For one thing, I’m an economist writing a book explaining the advantages of using cash, and I was simply curious what might happen.

But beyond my own book-related interest in paying taxes in cash, I had other reasons for wanting to do so. For years while teaching students about money, I noted the front of every piece of U.S. currency declares: “This note is legal tender for all debts public and private.”

The statement seemed ironic since I couldn’t figure out how to pay income taxes, one of people’s most significant public debts, with currency.

I also wondered how difficult it is for the unbanked to pay taxes. Federal Deposit Insurance Corp. data shows about 6 million households have no connection to the formal banking system.

The IRS does not publish data on the methods people use to pay their taxes, but several IRS employees I spoke with told me almost no one pays the IRS in cash.

Every U.S. bill declares that it can be used to pay any debt.

How to Pay in Cash

The IRS certainly doesn’t make it easy to do so.

Recently, a student of mine pointed out where the instructions for paying the government with paper money are buried, so I gave it a try. The five-step set of instructions hinted that paying cash directly is a time-consuming process and that I needed to start a month or two before taxes are due.

Following the instructions, I completed my taxes early and learned I owed a bit more than US$1,000. Then I called on the phone to schedule a face-to-face appointment with the IRS to see when and where I could pay.

The operator, who told me her name was “Ms. Johnson,” was cheerful and helpful – but tried her very best to dissuade me from paying in cash. She offered to walk me through the steps on the phone so that I could pay online and not have to come into my local IRS office.

Alternative Ways to Pay ‘In Cash’

For example, the IRS suggests cash payers can “Buy a prepaid credit card and pay online.”

This sounds easy but turns out to be costly. For example, Walmart, one of the largest U.S. retailers, offers a reloadable basic debit card. The card costs $1 to buy, $6 per month in fees and $3 to load with cash. Once the card is loaded with money, the businesses the IRS uses to accept debit card payments charge around $2.50 for each payment, with payments limited to two per year.

The IRS also has partnered with national chains like CVS, Walgreens, 7-Eleven and Family Dollar to accept cash on its behalf. Their service fees are less, either $1.50 or $2.50 per payment. However, the steps needed to navigate the online program before you can show up at a retailer seemed almost as difficult as filling in the tax forms.

More importantly, this program has a $500 per payment limit and a $1,000 maximum amount accepted per year. This made the method impractical for me and for most people who owe the IRS money. The latest IRS figures show people who owe income taxes on average pay over $6,000.

Or, I could use a credit or debit card, but these methods charged around 2.5% more for the convenience.

After I declined all of Ms. Johnson’s alternative payment offers, she told me I was lucky. There was an appointment available at the downtown Boston taxpayer assistance center in a few days. Her schedule showed many other centers around the country were booked until May, long after taxes were due.

The author had to go to an IRS assistance center to try to pay his taxes in cash. Alpha Photo (Flickr)

The author had to go to an IRS assistance center to try to pay his taxes in cash. Alpha Photo (Flickr)

An Arduous Process – But a Successful One

I had cash at home, but not enough. I went to the bank and made sure I got exact change in crisp new bills to make the transaction as easy as possible.

My goal was not to cause pain like the Virginia man who used 300,000 coins to pay his motor vehicle bill or the California man who pushed in wheelbarrows filled with $1 coins to pay his $13,000 property tax bill. Nor was I interested in recreating the famous but fictional British case of Board of Inland Revenue v. Haddock, in which Haddock tried paying his tax bill by writing a check on the side of a cow. Although it never happened, the case is still cited in legal circles.

I made it to the IRS building, went through airport-style screening and checked in on time. The receptionist was polite and again told me all the ways to pay without cash. After I declined, he asked me to take a seat in the waiting area filled with people clutching paperwork. As I walked away, the receptionist did a facepalm while shaking his head, which was not a positive sign.

After a 30-minute wait, another polite IRS worker came out and told me they could not accept cash that day because no courier was scheduled. Current IRS rules require that a courier take all cash immediately to the bank because they said “holding cash was not safe.” This is surprising given the federal office building was swarming with armed guards and required screening to enter.

I came back a week later when another cash payer was showing up. This time I had more success. It took 30 minutes, but after completing a multipart carbon form by hand, I got a receipt that said my taxes were paid.

A Simple Solution

Paying the IRS with cash is possible, but it turned out to be onerous and time-consuming.

I believe there is a simple solution. The Code of Federal Regulations, which governs the IRS and other agencies, allows authorized banks to accept tax payments. The law doesn’t specify payment only by check or other methods. This means if procedures existed, taxpayers could walk into major banks, hand the teller cash and have the bank inform the IRS of the amount paid.

For people without bank accounts, their only option for paying taxes shouldn’t require paying fees to credit card processors or retailers – especially since they are likely among the poorest taxpayers.

If the government wants everyone to pay their taxes, why doesn’t it make it as easy as possible?

Where Investors Might Hide in a Storm

Image Credit: DonkeyHotey (Flickr)

Doomsday Investor Sees Ongoing Moves by Policymakers as Destructive

We’d all like to think that global decision-makers responsible for economic conditions have the best interest of the world’s citizenry in mind when making decisions – but doubts and concerns are growing. Among the most concerned are economic stakeholders that don’t believe “bad” things should always be prevented. One very credible voice highlighting this idea is hedge fund manager Paul Singer. He’s the CEO of Elliot Investment Management and recently moved his firm’s offices out of NY, NY, to the more business-friendly West Palm Beach, FL. Singer says a credit collapse and deep recession may be needed to restore financial markets.

Paul Singer is the founder and CEO of Elliott Investment Management. Its year-end 13F reportable AUM was $12.25 billion. The firms opportunity-based investment style allows Singer and Company, known for their corporate activism, to move to wherever profit may lie.  

The current thinking of Singer, a registered Republican, has been making headlines. This includes a widely circulated opinion piece published in the Wall Street Journal last week. In it, he discusses more than a decade of what he believes are damaging easy-money policies and how a deep recession and even credit collapse will be necessary to purge financial markets of excesses.  

“I think that this is an extraordinarily dangerous and confusing period,” Singer told The Journal, in his interview, he warns that trouble in markets may only be getting started now that a full year has passed from the start of tighter monetary policy.

One of the more chilling quotes from Singer is, “Credit collapse, although terrible, is not as terrible as hyperinflation in terms of destruction wrought upon societies.”

The idea that we are headed down either one path or the other, he doesn’t mention a third option, may be why the New Yorker magazine calls him “Doomsday Investor.” He explains,  “Capitalism, which is economic freedom, can survive a credit crisis. We don’t think it can survive hyperinflation.”

The Doomsday Investor has been outspoken against government safety nets for a while, including the sweeping banking regulations from the Dodd-Frank Act of 2010. This act created the Financial Protection Bureau (CFPB) and established the Financial Stability Oversight Council (FSOC). Singer strongly opposed prolonged market interventions by global central banks following the 2008 global financial crisis. Interventions that still haven’t been drained from the U.S. monetary system.

Singer, who is 78 called crypto, “completely lacking in any value,” in his WSJ interview. He also said: “There are thousands of cryptocurrencies. That’s why they’re worth zero. Anybody can make one. All they are is nothing with a marketing pitch—literally nothing.”

While his funds performance have placed him near the top of hedge fund manager performance, Singer personally worries the Fed and other central banks will respond to the next downturn by referring to the failed playbook of slashing interest rates and potentially resuming large-scale asset purchases. The point was shown to be current, as Singer called the regulatory response to the collapse of Silicon Valley Bank and Signature Bank, including the guaranteeing of all deposits from the two lenders akin to “wrapping all market movements in security blankets.”

He complained, “…all concepts of risk management are based around the possibilities of loss.” He encouraged decision makers to, “Take it away, it’s going to have consequences.”

Where Can Investors Hide

Paul Singer said in his interview there may be a few places for investors to ride out what he sees as a coming storm. One place comes as no surprise, “At such times, some consider the safest bet to be relatively short-term U.S. government debt,” he said, adding that “such debt pays a decent return with virtually no chance of a negative outcome.” He is likely speaking of U.S. Treasuries two years and shorter as the longer duration bonds would be more volatile as rates shift, and other government debt like GNMAs are fraught with extension risk.

Singer also believes some gold in portfolios may make sense.

Take Away

Without some rain, nothing could flourish. Without an occasional brush fire, the risk of massive forest fire greatly increases. Paul Singer, in his interview with the WSJ, indicates he believes the economic brushfires that decision-makers have been preventing should have been allowed to run their course. Preventing them is a big mistake and a collapse may not be far off.

This collapse in easy credit and crypto, among other bubble-type excesses Singer believes could be destructive but preferred by society over continuing to move toward hyperinflation.

Paul Hoffman

Managing Editor, Channelchek

Sources

https://www.wsj.com/articles/the-man-who-saw-the-economic-crises-coming-paul-singer-banking-signature-svb-financial-downturn-asset-hyperinflation-recession-debt-federal-reserve-cd2638fe

https://www.newyorker.com/magazine/2018/08/27/paul-singer-doomsday-investor

https://opencorporates.com/companies/us_fl/B21000000006

https://www.marketwatch.com/story/hedge-fund-billionaire-paul-singer-still-sees-dangerous-bubble-securities-bubble-asset-classes-in-markets-4cd81a76?mod=search_headline

Twitter is Now Seated with eTORO, Which is a Breakthrough Expansion for Both

Image Credit: Web Summit (Flickr)

Elon Musk Announces New Financial Functionality on Twitter

Starting today, Twitter will provide tweeters the ability to buy and sell stocks and crypto on its platform via eTORO. Twitter owner, Elon Musk has been indicating he intends to turn the popular micro-blogging platform into a “super app.” Today’s move shows substantial headway in allowing financial transactions to be conducted on the social media platform. Other company goals since Musk’s purchase of the company include ride hailing, and attracting video influencers that may be disenchanted with YouTube restrictions on speech.  

What Will the Twitter eTORO Partnership Provide?

Founded in 2007, eTORO has become one of the largest social investment networks and trading platforms. According to its website, it is “built on social collaboration and investor education: a community where users can connect, share, and learn.”

Twitter will partner with the platform to allow users (known as tweeters and Twitterers) to trade stocks and cryptocurrencies as part of a deal with the social investing company.

This partnership will provide access to view charts and trade stocks, cryptocurrencies, and other investment assets from eToro via its mobile platform. Together this significantly expands real-time trading data available to users who already have access on Twitter to real-time data, however this arrangement adds all the bells and whistles a modern trading app can provide.

Twitter will be expanding its use of cashtags as well. Twitter added pricing data for $Cashtags (company ticker preceded by “$”) in December 2022. Since January, there have been more than 420 million searches using Cashtags – the number of searches averages 4.7 million a day.

eToro CEO Yoni Assia told CNBC the deal will help better connect the two brands, adding that in recent years its users have increasingly turned to Twitter to “educate themselves about the markets.”

Assia said there is a great deal of “very high quality” content available in real-time and that the partnership with Twitter will help eToro expand to reach new audiences tapping this as a source of information.

Update on Elon

After Musk’s purchase of Twitter, many advertisers stepped back and watched to see how far the company would go to allow less moderated interaction. On Wednesday (April 12) Musk said that “almost all” advertisers had returned to the app. However, Stellantis and Volkswagen, two large competitors with Musk run Tesla, said they do not yet plan to resume advertising.

Musk told a Morgan Stanley conference last month he wants Twitter to become “the biggest financial institution in the world.” This begs those that follow Musk to ask, “Why stop there, why not include Mars?”

What Else

Be sure to follow Channelchek on Twitter (@channelchek) to stay up to date on market insights, news, videos, and of course, top-tier investment analyst research on small and microcap opportunities.

Paul Hoffman

Managing Editor, Channelchek

Sources

https://www.etoro.com/en-us/about/

https://www.cnbc.com/2023/04/13/twitter-to-let-users-access-stocks-crypto-via-etoro-in-finance-push.html?__source=iosappshare%7Ccom.apple.UIKit.activity.PostToTwitter

https://www.forbes.com/sites/roberthart/2023/04/13/twitter-will-let-users-buy-stocks-and-crypto-as-elon-musk-pushes-for-everything-app/?sh=332662a26882

https://www.bloomberg.com/news/live-blog/2023-03-07/elon-musk-speaks-at-morgan-stanley-conference

Unexpected Adjustments Among Today’s Self-Directed Investors

Image Credit: Focal Foto (Flickr)

How Decision-Making and Market Impact is Shifting for Retail Investors

Retail investors’ preferences change over time. This impacts sector strength and the overall direction of markets. Even the methods of interacting with exchanges change as newer products like trading apps, artificial intelligence, and exchange-traded products (ETP) become available.

The influence retail has is growing, and anecdotally shifting preferences happen more quickly. Within this category, there are self-directed investors with different knowledge bases and at different stages of their lives. As people move through different stages, their concerns, outlooks, and risk tolerances adjust. Nasdaq just published its second annual survey of retail investors to measure how their interests are changing and what impact that may have. The survey of 2,000 investors from Gen Z to Baby Boomers uncovered some surprising trends in decision-making, fears, comfort zones, and asset class preferences.

Generational Groupings

There were a number of commonalities exposed by the Nasdaq survey between the different generations. They all listed their greatest concerns to be inflation and recession, but while the youngest (Gen Z, born 1997 – 2012) found housing and real estate a deep concern, the oldest group (Baby Boomers, born 1946 – 1964) are more concerned about tax rate changes. The generations in the middle (Gen X born 1965 –1980) and (Millennials born 1981 – 1996) show a greater concern over interest rate changes.

The survey question sought to understand how much time investors in each generation spent researching buy and sell investment decisions. Of Gen Z, on average 48% spent less than an hour, while 3% of these younger adults evaluated the transaction for at least a month. The next age category, Millennials, spent a bit more time on diligence. Only 28% would buy or sell with less than an hour of thought put into the transaction. Of this group, 4% took a month or longer to decide. This trend toward more time researching research continued as the survey reveals the Gen X greater propensity to spend more time evaluating before a purchase. Only 15% would press the buy or sell button with less than an hour spent understanding the investment – 7% of Gen X investors say they take a month or longer.

A big difference between the youngest and the oldest, is that among the Gen Z investors, although almost half said they spend fewer than 60 minutes researching, 0% said they did not research at all. Of the Baby Boomers surveyed, 24% indicated they spend no time researching before they buy or sell. It’s unclear if this is because the older group is less tech savvy, hires a professional to do the research, or believes they have the knowledge to move without digging deeper.

Overlap in Generational Preferences

Data Sources: Nasdaq

Other Trends

Despite their top concerns listed as recession and inflation, 71% of Gen Z and 50% of Millennials say they are investing more aggressively. This is in stark difference to the 9% of Boomers and 20% of Gen X describing their strategies as more aggressive than the previous year.

The influence of Twitter, Facebook and even TikTok keeps expanding. 73% of Gen Z use TikTok as a source for investment information. This is an 18% increase from the prior year. Baby boomer TikTok investment use rose by 16% to its current 25%.

The investment themes from year-to-year show ESG and crypto interest sinking, while robotics and other autonomous technology is where the focus has increased most. Younger investors are more active in their investments than before, and more frequently conducting their own research ahead of transacting. Investors of all ages are more likely to consider alternative options than they had before, these could include options, cryptocurrencies, exchange traded products, etc.

Competition among brokerage platforms is as fierce as it is in any innovative, tech heavy industry. The availability of advanced technology and commission-free trading have made investing more accessible, especially for the younger investors.

Take Away

The second annual survey conducted by Nasdaq indicates that the retail investor growth and power we’ve experienced in recent years was not a fad, it is growing and becoming more sophisticated. They are more influential and should be understood as they are here to stay. This is expected to continue to disrupt and influence markets dramatically.

As retail trends take a higher position of importance in defining the day-to-day challenges of investing and mapping the markets’ future, these self-directed investors are finding more services to accommodate them. One source is the Channelchek platform where retail and institutional investors, of all ages can review research reports, absorb video discussions with management of interesting opportunities, expand understanding through daily articles, and, if relevant, attend a roadshow to meet a particular company’s management.  

Signup for Channelchek emails and full access here.

Paul Hoffman

Managing Editor, Channelchek

Sources

https://www.nasdaq.com/articles/retail-revival%3A-how-a-year-of-market-volatility-reshaped-investor-strategies

https://nd.nasdaq.com/GENZ

https://nd.nasdaq.com/Millennials

https://nd.nasdaq.com/GENX

https://nd.nasdaq.com/BabyBoomers