Shrinkflation and Skimpflation Are Eating Our Lunch

Image Credit: Brett Jordan (Flickr)

Why Economic Data Doesn’t Reconcile With Personal Experience

Does grocery shopping and eating out cost the same as it did in 2019? Government statistics on personal consumption and expenditures would seem to indicate they do. Most of us know that we are paying noticeably more to eat than we did a few years ago. Below is an article explaining the flaws in government data and the nuances that hide actual experience from this set of numbers. It is written by Dr. Jonathan Newman, he is a Fellow at the Mises Institute, his research focuses on inflation and business cycles, and the history of economic thought.  – Paul Hoffman, Managing Editor, Channelchek.

Economist Jeremy Horpedahl dismissed the silly claim by anticapitalists that capitalism must engineer food scarcity for the sake of profits. He presented a graph of Bureau of Labor Statistics (BLS) data demonstrating a substantial decrease in household food expenditure as a percentage of income—from 44 percent in 1901 to a mere 9 percent in 2021. This is something to celebrate and certainly can be attributed to the abundance of market economies.

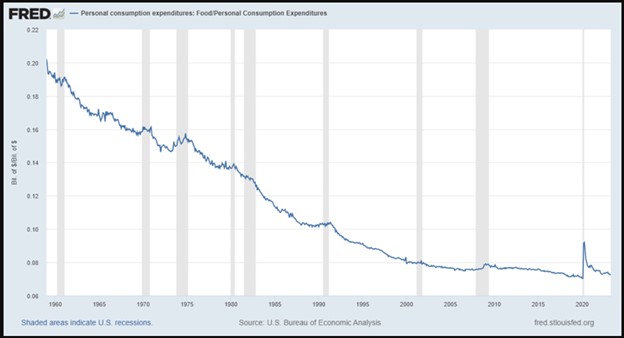
But when Jordan Peterson asked, “And what’s happened the last two years?” I went digging. First, I confirmed Horpedahl’s observation: the amount we spend on food as a proportion of our budget has fallen dramatically. Second, I saw what Peterson hinted at: a significant spike in food spending when covid and the associated mess of government interventions hit (figure 1).

Figure 1: Food and personal consumption expenditures, 1959–2023

Source: US Bureau of Economic Analysis, FRED.

Interestingly, the spike looks like a blip. Someone oblivious to the events of the past few years might see this chart and say, “Yeah, something strange happened in 2020, but it looks like everything is back to normal.” I’m certain that this doesn’t align with anyone’s experience, however. Even today, no one would say that restaurant visits and grocery store trips cost the same as they did in 2019.

What changed in 2020? Why does this graph not feel right? Assuming the Bureau of Economic Analysis data isn’t totally off (and it is important to be skeptical of government data), why would a January 2023 report on consumer inflation sentiment conclude that “there is a disconnect between the inflation data reported by the government and what consumers say they now pay for necessities”?

The difference lies in the qualitative aspects of our experience as consumers. Spending proportions may have returned to their trend, but that isn’t the whole story. “Shrinkflation” and “skimpflation” have taken their toll on the quantity and quality of the food we enjoy—or maybe the food we tolerate is more apt.

Businesses know that charging higher prices is unpopular, especially when many consumers are convinced that greed is driving price inflation. So businesses resort to reducing the amount of food in the package, diluting the product but keeping the same amount, or otherwise cutting corners in ways that consumers may not immediately notice.

Thankfully, websites such as mouseprint.org document some of these cases:

Sara Lee blueberry bagels reduced from 1 lb., 4.0 oz. per bag to 1 lb., 0.7 oz.

Bounty “double rolls” reduced from 98 sheets to 90 (how is it still a “double roll”?)

Gain laundry detergent containers reduced from 92 fl. oz. to 88 fl. oz. without any obvious difference in the size of the container

Dawn dish soap bottles reduced from 19.4 fl. oz. to 18.0 fl. oz.

Green Giant frozen broccoli and cheese sauce packages reduced from 10.0 oz. to 8.0 oz. with no change in the advertised number of servings per package

In some instances of skimpflation, the volume or weight of a product remains the same, but the proportions change. For example, Hungry-Man Double Chicken Bowls (a frozen dinner of fried chicken and macaroni and cheese) maintained a net weight of 15.0 oz., but the protein content dropped from 39 grams to 33 grams.

And while firms are reducing the quantity and quality of the food they sell, consumers are also choosing to purchase less food and even lower-quality food. The January 2023 report on consumer inflation sentiment shows that 69.4 percent of respondents “reduced quantity, quality or both in their grocery purchases due to price increases over the last 12 months.”

We have also seen a widespread and long-lasting change in customer service at restaurants. Many restaurants switched to providing only takeout for months or years. Even though the dine-in option has been reintroduced at some restaurants, the service hasn’t quite been the same, with QR-code menus, shorter hours, less staff, and terse demeanors.

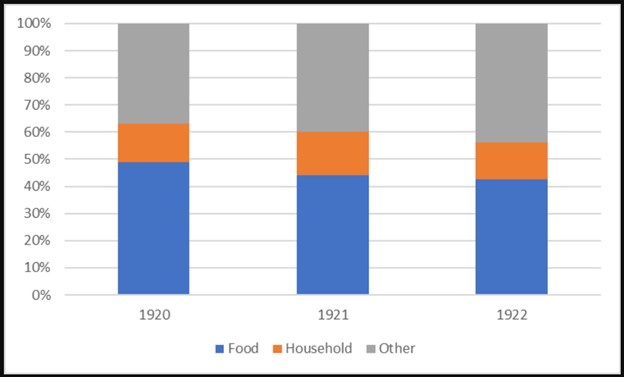
It’s not surprising that the massive government interventions, including creating trillions of new dollars, would have countless effects—some that show up in various statistics but many that do not. For example, if we look back at the period of German hyperinflation, we see surprisingly boring data on food spending proportions (figure 2).

Figure 2: Household expenditures in Germany, 1920–22

Source: Data from Carl-Ludwig Holtfrerich, The German Inflation, 1914–1923: Causes and Effects in International Perspective, trans. Theo Balderston (New York: Walter de Gruyter, 1986), cited in Gerald D. Feldman, The Great Disorder: Politics, Economics, and Society in the German Inflation 1914–1924 (New York: Oxford University Press, 1997), p. 549.

Historian Gerald D. Feldman commented on the German household expenditure data in a way that sounds familiar: “As one study after another pointed out, however, the full impact of these changes had to be understood in qualitative terms.” There was “reduced quality and quantity of the food consumed” and “poorer quality clothing,” among other qualitative changes.

Government statistics are unable to capture these subtleties. This should be obvious—your personal experience as a consumer is more than just the price you pay for a certain weight of food. We aren’t merely machines; we don’t describe our lives in miles per gallon or kilowatt hours.

This is why Ludwig von Mises attacked the conceited aggregates and indexes purported to measure various aspects of consumers’ lives: “The pretentious solemnity which statisticians and statistical bureaus display in computing indexes of purchasing power and cost of living is out of place. These index numbers are at best rather crude and inaccurate illustrations of changes which have occurred.”

He concludes: “A judicious housewife knows much more about price changes as far as they affect her own household than the statistical averages can tell.”

Original Source

https://mises.org/wire/shrinkflation-and-skimpflation-are-eating-our-lunch

New SEC Rules Could be Costly for Investors

Do New SEC Rules Bubble Wrap Money Market Funds?

What if you bought a new home in what has historically been a trouble-free neighborhood? You are not one to take big risks with your family or belongings so you also pay extra for what are expected to be the best locks, install a security camera, motion detector lights, and build a state-of-the-art fence behind which sits your German shepherd named Patton. The first week after you move in, a town representative comes by and tells you that they are worried about your safety, so you and everyone else in town must also spend a little money each month on an alarm system they approve of. To you, even this small amount of money is a waste as Patton is generally always on the job, you have ample protection in other ways, and the extra money is better spent on dog food. 

This is what many investors feel the SEC has just done by changing the already extremely low-risk rules for money market funds this week. These investors believe they already had ample safety in the “cash” allocation and may have already given up return in order to secure that safety. So the forced added layer of protection to MM funds, which have in over five decades only seen two funds in the asset class inch down in value, is an example of a regulator forcing them to pay for the protection they don’t need.   

Money Market Fund Background

Money market funds are governed by the SEC under rule 2a-7 of the Investment Company Act of 1940. These rules are very specific in defining the underlying assets in the fund. The most common use of MM funds, and the restrictions governing the holdings, is to provide a very liquid alternative that can be viewed as cash among your other investments. Fund families at times use their MM funds as a funnel or gateway investment from which they hope to have investors venture beyond to other higher fee offerings.

Money market funds, typically purchased through a broker, are not insured, but the extremely high credit quality of underlying securities required by the SEC, along with the very short average maturity required by the SEC, along with the amount each fund is required by the SEC to hold in overnight investments, has provided investors with a very low-risk harbor for balances that may be used as savings, or as a parking place while waiting for more aggressive investment opportunities.

Unlike other mutual funds, where investors buy shares and over time the share price changes, money market funds shares are valued at $1.00. When the underlying investments accrue or pay interest, the non-fee portion of income is credited to account holders as a share dividend, always valued at $1.00. In this way it is designed to feel like a bank savings account. This minimal risk, savers to the tune of trillions of dollars, endure in exchange for higher returns than available in a bank passbook account, and the convenience of transferring money to purchase other investments.

What is the risk of a 2a-7 money market fund breaking the buck? You can count on two fingers. Since the first money market fund came to market in 1971, it has briefly occurred in two funds, and no investors lost money.  

The first time a MM fund broke the buck was in 1994, a fund named Community Bankers U.S. Government Money Market Fund saw it’s NAV plummet from $1.00 to $0.96. This was after financial engineers at top Wall Street investment banks created derivative instruments that were far from liquid, and stopped accruing interest if markets didn’t perform as expected. Imagine being the first MM fund manager in history to drop below $1.00 because you disregarded prudence.   

The second time was in 2008. The Reserve Primary Fund held Lehman Brothers commercial paper (very short-term notes). On September 16th of that year the fund company announced it had suffered losses in the fund to the extent that assets fell below $1.00 per share to $0.97.

The U.S. Treasury Department guaranteed the $1.00 share price in 2008 to prevent a run on MM funds. And in both occurrences, fund companies, in order to restore faith in their other products, made sure money fund holders were whole by redeeming shares when requested at $1.00.

SEC New Rules for Money Funds Beginning October 2023

In 2010 The SEC created new rules to enhance transparency, liquidity, and bolster the credit quality of MM funds. Despite having only experienced two brief brushes with breaking the buck.

The new rules for 2a-7 SEC-regulated money funds (any fund with “money” in the title is regulated under 2a-7) included that daily maturities must equal at least 10% of the fund. And further, each week at least 30% of the fund notes need to mature. The weighted average maturity of all holdings in any non-government MM fund can not extend longer than 60 days, down from 90 days. The rules essentially were a safe cash alternative and made it super safe, and along the way, they rduced average return to the investors.

A reminder, there has not been an incident since the new rules, but there was some concern in 2020 as the financial system took measures in response to the novel coronavirus.

On July 12, 2023 the SEC announced it has decided that investors in MM funds need to be protected even better. Or perhaps it is better protecting the fund industry by adding extra safety measures that they all have to play by, giving none a real competitive advantage, and increasing their competitiveness against FDIC insure bank money funds. Either way, it is sure to lower, once again, the interest rates paid on the average MM fund. Considering interest rate compounding and the time value of money, investors this coming October will begin “paying” more for protections than they are probably worth.

The SEC explained its reasons for the added protection.“Money market funds – nearly $6 trillion in size today – provide millions of Americans with a deposit alternative to traditional bank accounts,” said SEC Chair Gary Gensler. “Money market funds, though, have a potential structural liquidity mismatch. As a result, when markets enter times of stress, some investors – fearing dilution or illiquidity – may try to escape the bear. This can lead to large amounts of rapid redemptions. Left unchecked, such stress can undermine these critical funds. I support this adoption because it will enhance these funds’ resiliency and ability to protect against dilution. Taken together, the rules will make money market funds more resilient, liquid, and transparent, including in times of stress. That benefits investors.”

The SEC finalized the most recent amendments to Rule 2a-7 on July 12, 2023. The amendments are designed to improve the resilience and transparency of money market funds by:

  • Requiring money market funds to impose a mandatory liquidity fee of 2% when daily net redemptions exceed 5% of total assets.
  • Increasing the minimum daily liquid asset requirement from 10% to 15% of total assets
  • Increasing the minimum weekly liquid asset requirement from 30% to 35% of total asset
  • Giving money market fund boards the discretion to impose a liquidity fee if daily net redemptions exceed 2.5% of total assets.

Beginning in October 1, 2023, money market funds will also disclose more information about their liquidity risk, including the daily and weekly liquid asset requirements, the amount of liquidity fees imposed, and the reasons for imposing liquidity fees.

What Could the Impact Be?

In economics, everything has an impact. To address redemption costs and liquidity concerns, the amendments will require institutional prime and institutional tax-exempt money market funds to impose liquidity fees when a fund experiences daily net redemptions exceeding 5 percent of net assets, unless the fund’s liquidity costs are de minimis. This alone could cause investors to try to be first to the door if trouble is perceived thereby increasing the number of runs on these low-risk funds. The shorter average maturity, and higher percentage of holdings held maturing in one day and seven days will also reduce earnings in a normal sloping yield curve environment.

In addition, the amendments will require any non-government money market fund to impose a discretionary liquidity fee if the board determines that a fee is in the best interest of the fund. This could be perceived as the funds management punishing investors for expecting a MM fund to provide liquidity on demand. It could also have the impact of funds taking more chances, as the fund manager knows that if a sudden withdrawal spree occurs and a large percentage of their holdings have gone down in value, they can charge customers for wanting their money. 

Take Away

When it comes to investing, risk versus return is a top consideration. Many investors know this and are concerned that regulatory bodies try to protect investors from the downside of risk. By doing this they shield investors from the benefits of risk. It can be argued that some IPOs may not be suitable for every investor, but should ultra-safe money market funds be further shored up at an ongoing cost in return, to reduce the unlikely day when they may lose 3 cents a share? Write to me and let me know what you think.

Paul Hoffman

Managing Editor, Channelchek

Sources

https://www.sec.gov/rules/proposed/2021/ic-34441-fact-sheet.pdf

https://www.investor.gov/introduction-investing/investing-basics/glossary/money-market-fund

Investment Articles from the First Half, That are Still Well-Worth Understanding

The Markets During the First Half of 2023 Were Reflective of the People that Trade Them

Financial markets reflect the collective actions and expectations of market participants. This includes rational analysis, irrational emotions, and at times less than rational analysis. The emotions and number crunching get their cue from a daily barrage of information including: profits, policy, panic, prices, politics, purchasing power, the president …and that’s just the Ps. So each day, as Channelchek prepares to deliver research, articles, and pertinent video content to subscriber’s inboxes, we plow through an abundance of information and hope to share what is either not being addressed or covered, or present front page news from the point of view of seasoned investors, not less experienced news writers.

Below are six articles, one from each month this year. Although I have favorites not included here, and these may not have been the most read or shared, they told a slightly expanded story than found on the mainstream take on the subject and are still relevant to some investors.  

As a content provider to this popular investment research platform, my job is not to call the market; it is to present thoughts and knowledge to help investors make decisions on small and microcap stocks along with the overall universe of investment opportunities. The insights below from earlier this year are still quite current, and worth digesting.  

January 2023

Will Three Bank Regulators Kill Cryptocurrency in 2023?

On the very first business day of 2023, three regulators announced concerns over businesses involved in cryptocurrency citing the lack of oversight, lack of standards, and unknown risk. As the year progressed, the three federal agencies, which do not include work on oversight being done by the SEC or CFTC, are now working hard to regulate what banks can do involving crypto. The SEC for its part has been creating headaches for some of the larger crypto exchanges. Banks are having a particularly difficult time incorporating the asset in their business.

February 2023

Michael Burry Warns Against the Market Hoping for Economic Weakness

Investment content providers love Michael Burry. The reason is that readership goes through the roof whenever his name is mentioned. Still, if there is nothing to write about the subject, or if it is old news, the writer, blogger, or vlogger is doing investors a disservice.

We’re choosy about when to take one of Burry’s rare tweets and decipher them for readers. But, we always try to be among the first when his fund’s public holdings are reported each quarter on SEC form 13-F. But there are only few times during the year when there is actually worthwhile news. This is because Burry is usually tightlipped. Unless required by a regulator, the successful hedge fund manager is out of the public spotlight, presumably crunching numbers and rebuilding old guitars.

This article is good advice that can be used any time the Fed is trying to reel in inflation.

March 2023

The CFA Institute Makes First Major Change to Program Since Inception

It was 1963 the last time the CFA Institute (Chartered Financial Analyst) made any changes to their prestigious designation. However, the investment world is changing, and the CFA Institute is responding in order to better serve those that benefit from the services of skilled analysts. In 2023 CFA candidates will have more choices, more study material available, and the ability to take credit for their rigorous studies beginning after passing Level I.

Some thoughts on why, eligibility, and the new focus are presented here along with how it should help keep the credential fresh and more useful.  

April 2023

U.S. Money Supply, Here’s Why it’s Critical for Inflation Forecasts

It wasn’t too long ago that the Federal Reserve did not announce its intentions. If a Fed-watcher or market participant wanted to know for certain if the FOMC adjusted monetary policy, the best they could do is see if measures of money supply increased or decreased. Weeks later the FOMC Minutes would be released, and the markets would know for sure what the Fed did at the previous meeting.

When the Fed became more transparent, the market focus on money-supply disappeared. This has now reversed as the stimulative money that had been injected into the economy to prevent undue weakness during the pandemic is now being methodically removed via quantitative tightening (Q.T.). The renewed focus on M2 is to make sure the Fed sticks with its plan. Signs that it may not be impact the amount of money available to chase goods and services, this impacts inflation.

The Fed’s battle to drain the cash put into the system, and do it in a way that doesn’t crash banks, or the overall economy is perilous, is continuing and well worth understanding.

May 2023

Solid Evidence a Recession is Unlikely this Year

Economists and news writers have been negative about the economic outlook, scaring people with the word recession since before the year even began. And while there are some weaknesses, the stimulative money supply is still exceedingly high, jobs are more abundant than workers, and home sales have not reacted as expected when mortgage rates rise from 3% to 7%.

The often-repeated line that the downward slope of the yield curve is a time-tested indicator of an impending recession was the echo chamber talking point that probably didn’t apply to this economy because of a novel Fed policy.

From a textbook position, those saying a negative yield curve indicates a recession got the answer right if they were taking a college quiz. However, those that were saying this inverted yield curve indicates a recession may have flunked. And if you copied off the economist next to you, and they somehow missed that the Fed owned 33% of all U.S. Treasuries outstanding, and because of their policy of yield-curve-control, the yield curve was not market-driven, and therefore not a reliable indicator of anything. What we know is that when the Fed buys one out of every three bonds, it leaves a mark on the area of the curve that they are active.

With higher than expected GDP released last week, most have stopped talking about a recession in 2023. We put out several articles beginning in 2022 explaining why others may have this yield curve indicator wrong, this is addition is most recent.

I highly recommend reviewing this article if your summer backyard barbecues include conversations about economic strength (or weakness).

June 2023

Why Small Cap Stocks Started to Attract Mega Cap Investors

Small Cap stocks had been lagging behind larger companies. Historically they are more volatile, but investors expect to be compensated over time for the additional risk they take. Yet, over a longer than normal period, they still lagged. This seemed to have changed; during the first week in June there were some days that small company returns had a little more giddy-up than they had in recent months or years. On June 6th we published the above article.

Small cap stocks finished the month well ahead of the large caps and even mega-cap companies. This momentum has carried into the second half.

Let’s Start the Second Half of 2023 Together

If you are one of our free subscribers, thank you for trusting us as one of your news and research resources.

If you have not yet signed up, now is a great time to make sure you don’t miss any research, videos, special events, and market insights. Sign up here.

I hope you found these six articles compelling, and if you have not registered for no-cost insights to your inbox each day, here’s your chance to start the second half with a slightly different investment angle.

Paul Hoffman

Managing Editor, Channelchek

What Investors in Stocks Can Learn from Index Investors

Why Aggregate Portfolio Return is More Important than Any Single Holding

Have you ever agonized over a stock in your portfolio that is not performing as you had hoped? While it’s the nature of investing to not bat 1000, it can be hard not to think of the decision to have bought it as a mistake. It probably isn’t. Here is a better way to look at it that uses a recent example (June 1, 2023).

On the first day of June, investors in the Nasdaq 100 (NDX) found themselves up 1.17%. That’s a decent run in one day, and since they are focused on the indexed fund that they are invested in as one investment (not 100), they are content and confident.

But what if they owned the underlying 100 stocks in the fund instead? They might be kicking themselves for having bought Lucid (LCID), or 22 other holdings that are down. Using Lucid as an example, it is lower by 15.6% (June 1); the day before it closed at $7.76, and it is only worth $6.55 today.

Ouch? Or no big deal?

The overall blend of the portfolio is up, yet at the same time, 23 holdings are down – no big deal – this is the way portfolio investing works. In fact ten of the stocks in the NDX declined by more than the 1.17% the overall portfolio is up. Most index fund investors just look at one number and don’t look under the hood for reasons to feel remorse (or glee).

Aggregate Return

There are many reasons investors, even professional financial advisors, avoid building a portfolio with individual stocks, but choose index funds. One is not taking responsibility. If you own, or if an investment manager buys a mix of stocks that are in total up a respectable amount, yet some are underperformers, laggards and drags on the overall portfolio performance, there is a feeling of responsibility for the holdings that are down, the dollar amount lost, and the drag on return that is staring them in the face possibly causing sleepless nights.

On this one day, almost 25% of the Nasdaq 100 was down while the index was up 1.17%. The biggest gainer, PDD Holdings (PDD), is only up by half the percentage of LCID’s is selloff. Yet those looking at the aggregate return and not individual return are feeling mighty good about themselves. And that’s good.

If you hold a portfolio of stocks and did your research, whether it be fundamental analysis, technical analysis, industry trends, etc., and understand why every stock is in your portfolio, you could easily be better off if you learn not to agonize over losers. The returns in most of the last five years in index funds have come because of the weighting of the stocks that have gained, not by having more winners. It has become normal for an index that is up on the year to have been carried by just a dozen or so stocks that are in the mix.

Don’t Undermine Your Portfolio

Investors can negatively impact their performance by focusing too much on one stock. When this happens, they can make bad decisions, some of these decisions might be pain-related, others ego, either way, rational decisions are based on investment probabilities, not human emotions, or overthinking; these can ruin good decisions that would have led to improved returns.

Other investors undermine their portfolio differently, by not wanting the responsibility. They buy the index, and they are done – its out of their hands. If average returns are their goal, they’ve succeeded. Or if they are a financial professional and separating themselves from responsibility is the objective, index funds allow them to blame “the market”; it isn’t their fault – they have succeeded.

If an investor can overcome both of these, they can manage their own holdings and be as or more content than an index fund investor. If they follow good portfolio management strategies including, diversification, analysis, research, etc., and then mainly focus on aggregate return, they can make bette decisions and lose less sleep. Individual stocks don’t matter as much when you are purposeful when choosing holdings. Most large indexed funds aren’t purposeful, they aren’t intended to be investments, there makeup is formulaic and meant to mimic the market, not provide stellar returns.  

Take Away

No investor bats 1000. Even top portfolios may have more losers than winners, the key is to have bigger winners and not overreact or over focus on a few holdings. For investors, a portfolio of individual companies can lead to more mental highs and lows as each stock is a personal decision with great expectations. Avoid this by thinking differently. If those one or two stocks don’t perform as expected, think of all the down stocks in all the index funds that the owners aren’t even paying attention to. All these investors are looking at is one number, aggregate return on all the holdings. Maybe you should too.

Paul Hoffman

Managing Editor, Channelchek

Source

Nasdaq Market Activity

Solid Evidence a Recession is Unlikely this Year

Reliable Data, Not Emotions, are Pointing to a Growing U.S. Economy

In roughly one month, we will be halfway through 2023. While many point to the Fed’s pace of tightening and the downward sloping yield curve, as a reason to run around like Chicken Little warning of a coming recession, a fresh read of the economic tea leaves tells a different story. Just today, May 23, the PMI Output Index (PMI) rose to its highest reading in over a year. Home sales figures were also reported to show that new homes in May sold at the highest rate in over a year. These are both reliable leading indicators that point to growth in both services and manufacturing.

U.S. Composite PMI Output Index

Business activity in the U.S. increased to a 13-month high in May due in large part to strong growth in the services sector. This is a reliable indication that economic expansion has growing momentum. Despite the negative talk of those that are concerned that the Fed has lifted interest rates closer to historical norms and that the yield curve is still inverted, in part due to Covid era Fed yield-curve-control, the numbers suggest less caution might be warranted.

S&P Global said on Tuesday (May 23) its flash U.S. Composite PMI Output Index, which tracks the manufacturing and services sectors, rose to a reading of 54.5 this month. It indicates the highest level since April 2022 and is up from a reading of 53.4 in April. A reading above 50 indicates growth, this is the fourth consecutive month it has been above 50. The consensus among economists was only 52.6.

Home Sales

One sector that is directly impacted by interest rates is real estate. However, new home sales rose in April, this is a clear sign that prospective buyers are making deals with builders.

New homes in April were sold at a seasonally-adjusted annual rate of 683,000, Its the highest rate since March 2022. The April data represents a 4.1% gain from March’s revised rate of 656,000,. The report was from the Census and Department of Housing and Urban Development and was reported Tuesday May 23. Economists had expected new home sales to decline to 670,000 from a March rate of 683,000. It was the largest month-over-month increase since December 2022.

Leading Indicators

PMI is forward-looking as it surveys purchasing managers’ expectations and intentions for the coming months. By capturing their sentiment on future orders, production plans, and hiring intentions, PMI offers insights into economic trends that have yet to be reflected in other after-the-fact indicators.

Home sales are considered a leading indicator because they can serve as a measure of other needs and broader economic trends. Home sales have a significant impact on related sectors, such as construction, home improvement, finance, and consumer spending. Changes in home sales can influence economic activity and indicate shifts in consumer confidence, employment levels, and overall economic health.

While many economic reports offer rear-view mirror data, these reports are true indicators of business behavior as it plans for future expectations, and consumer behavior as it is confident that it will have the resources available to purchase and outfit a new home.

The upbeat reports prompted the Atlanta Federal Reserve to raise its second-quarter gross domestic product estimate to a 2.9% annualized rate from a 2.6% pace. The economy grew at a 1.1% rate in the first quarter.

Take Away

Many economists are negative about the economic outlook later this year. Market participants have been positioning themselves with the notion that there may be a late year recession. Is the notion misguided? Recent data suggests there may be buying opportunities for those willing to go against the tide of pundits preaching recession.

No one has a crystal ball. In good markets and bad, there is no replacement for good research before you put on a position, and then for as long as the position remains in your portfolio.

Channelchek is a great resource for information to follow the companies not likely being reported in traditional outlets. Turn to this online free resource as you evaluate small and microcap stocks.

Paul Hoffman

Managing Editor, Channelchek

Sources

World Economic Outlook

Barron’s (May 23, 2023)

Reuters (May 23, 2023)

Cathie Wood’s Non-Mainstream Inflation Concern Could Unfold as Feared

Image: An Artificial Intelligence Rendering of Tech Investor Cathie Wood

Cathie Wood’s Deflationary Expectations May Become Reality

Before Fed Chair Powell realized inflation might not be transitory, during the Fall of 2021, Cathie Wood sounded alarm bells about the risks of great deflationary pressures not being far off. The renowned hedge fund manager and founder of ARK Funds stood far apart from her peers with this forecast. Since then, the disruptive technologies investment expert has indicated the Federal Reserve should stop raising interest rates because the economy is poised for deflation rather than inflation. As most of the world has come to accept the notion that inflation may be a problem for years to come, her thoughts have been dismissed by most economists as wishful thinking.

Wood has not budged on her position, and it may serve her and her customers well. Investment success often comes with pointing yourself in a different direction than the loud narrative is pointing you. But, in the end, you have to eventually be right, and others then have to change their tune to match the once contrarian view – after all, you will need late-comers to buy your position from you.

I have to confess, as a lifelong Fedwatcher, market analyst, and cynic, I didn’t think there was a chance in the world that she could be right. Since her October of 2021 comments, not a long period of time, We’ve all witnessed a dramatic leap in technology that reduces costs, is easy to adopt, and is progressing at an exponential rate.

Cathie Wood may not be as wrong as most people thought, perhaps she is even right. Here are just some examples of when she spoke out about her deflationary outlook:

2022-10-10: Wood wrote an open letter to the Federal Reserve accusing it of stoking ‘deflation’ and looking at the wrong economic indicators.

2023-02-02: Wood gave a speech at the Sohn Investment Conference where she said that she believes deflation is a bigger threat to the US economy than inflation.

2023-03-08: Wood appeared on CNBC’s Squawk Box where she said that she believes deflation is “the biggest risk” to the global economy.

Cathie Wood has been quoted as saying:

“Deflation is the biggest risk to the global economy.”

“The rise of artificial intelligence is leading to a productivity boom, which is driving down prices.”

Less related to disruptive technologies providing businesses a more efficient means, Wood has also argued:

“The decline of globalization is leading to a decline in demand for goods and services.”

“The aging population is leading to a decline in consumption.”

“Deflation is not a bad thing. It can lead to a more sustainable economy, with lower interest rates and less debt.”

In November of 2022, ChatGPT was unveiled by OpenAI. Most everyone paying attention, including those in related tech businesses, were stunned at how far along the technology is and the potential for quickly advancing AI platforms. Currently, ChatGPT is trained on a dataset large enough that it can generate text, translate languages, write different kinds of creative content, and answer your questions in an informative way.

In 2023, ChatGPT was released to the broader public, it broke records for sign-ups and it has continued to grow in popularity. It is now used by a wide range of people, including students, writers, and businesses. This is still a beta version they are using and getting excellent results.

While generative AI for text is only one next-generation technology, example; this still under development tool alone is world-changing powerful. And it has the potential to dramatically alter the way we interact with computers – all of which can lead to dramatic gains in efficiency and productivity. Efficiency and productivity are ingredients that can stave off inflation, they can even bring prices lower – we know this because we experienced it for decades following the tech revolution.

ChatGPT and other OpenAI products are still beta tests of a text program from one institution. I understand OpenAI products can also write computer code, create graphics, and carry on a conversation.  Where will OpenAI take their products next, how will the products take part in machine learning and then serve to better themselves, and how many other companies are dreaming up and developing new sources to enrich out lives at lower expense?

While Artificial Intelligence may or may not be able to lower the price of a dozen eggs, it can increase output across many industries or reduce expensive labor needs. I see examples of this in the office and at home where a search using ChatGPT can more precisely provide a response to a query than a Google internet search.

Take Away

Investors are often hurt by their ego, preventing them from rethinking and reevaluating. When exposed to new information, it’s good to take the time to reevaluate the probability of being incorrect or correct in one’s outlook.

It’s too early to know if Cathie Wood will turn out to be correct in her inflation forecasts. She lives and breathes high tech and I’m sure gets early behind-the-scenes glimpses of what has yet to come. For me, it is now easier to see how new business solutions could possibly unfold to a point where deflation becomes an issue in the world economies. I’m not sold on the idea, but I am not dismissing it as impossible either.

Paul Hoffman

Managing Editor, Channelchek

Sources

https://ark-funds.com/articles/commentary/q3-2022-commentary-from-arks-cio/

https://www.cnbc.com/2023/03/09/cnbc-transcript-ark-invest-ceo-cio-cathie-wood-speaks-with-cnbcs-brian-sullivan-on-last-call-today.html

The Limits to the Artificial Intelligence Revolution

What Will AI Never Be Good At?

Artificial intelligence (AI) is a true disruptive technology. As any informed content writer can tell you, the technology creates efficiencies by speeding up data gathering, research, and even graphics that specifically reflect the content. As an example, it is arguably quicker to use ChatGPT to provide a list of ticker symbols from company names, than it is to look them up one by one. With these small time savers, over the course of a week, far more can be produced as a result of AI tools saving a few minutes here and there.

This presents the question, what are the limits of AI – what can’t it do?

Worker Displacement

Technological revolutions have always benefitted humankind in the long run; in the short run, they have been disruptive, often displacing people who then have to retrain.

A new Goldman Sachs report says “significant disruption” could be on the horizon for the labor market. Goldman’s analysis of jobs in the U.S. and Europe shows that two-thirds of jobs could be automated at least to some degree. In the U.S., “of those occupations which are exposed, most have a significant — but partial — share of their workload (25-50%) that can be replaced,” Goldman Sachs’ analysts said in the paper.

Around the world, as many as 300 million jobs could be affected, the report says. Changes to labor markets are therefore likely – although historically, technological progress doesn’t just make jobs redundant, it also creates new ones. And the added productivity allows the masses to live wealthier lives. This clearly was the end result of the  industrial revolution, and years after the computer revolution, we are at a high rate of employment and have at our fingertips much which we never even dreamed.

The Goldman report says the use of AI technology could boost labor productivity growth and boost global GDP by as much as 7% over time.

There are few reasons to expect that the AI revolution won’t also provide more goods and services per person for a richer existence. But, what about the disruption in the interim? I was curious to know what artificial intelligence is not expected to be able to do. There isn’t much information out there, so I went to an AI source and fed it a bunch of pointed questions about its nature. Part of that nature is to not intentionally lie, I found the responses worth sharing as we will all soon be impacted by what the technology can and cannot do.

Limitations of AI that Will Persist

Artificial intelligence has come a long way in recent years and the speed of progression and adoption is accelerating. As a result, applications have become increasingly sophisticated. But, there are still many things that AI cannot do now and may never be able to do.

One thing that AI cannot do now and may never be able to do is to truly understand human emotions and intentions. While AI algorithms can detect patterns in data and recognize certain emotional expressions, they do not have the ability to experience emotions themselves. This means that AI cannot truly understand the nuances of human communication, which can lead to misinterpretation and miscommunication.

Another limitation of AI is that it cannot replicate the creativity and intuition of humans. While AI can generate new ideas based on existing data, it lacks the ability to come up with truly original and innovative ideas. This is because creativity and intuition are often based on a combination of experience, emotion, and imagination, which are difficult to replicate in a machine.

AI also struggles with tasks that require common sense reasoning or context awareness. For example, AI may be able to identify a picture of a cat, but it may struggle to understand that a cat is an animal that can be petted or that it can climb trees. This is because AI lacks the contextual understanding that humans have built up through years of experience and interaction with the world around us.

In the realm of stocks and economics, AI has shown promise in analyzing data and making predictions, but there are still limitations to its abilities. For example, AI can analyze large datasets and identify patterns in market trends, but it cannot account for unexpected events or human behavior that may affect the market. This means that while AI can provide valuable insights, it cannot guarantee accurate predictions or prevent market volatility.

Another limitation of AI in economics is its inability to understand the complexities of social and political systems. Economic decisions are often influenced by social and political factors, such as government policies and public opinion. While AI can analyze economic data and identify correlations, it lacks the ability to understand the underlying social and political context that drives economic decisions.

A concern some have about artificial intelligence is that it may perpetuate biases that exist in the data it analyzes. This is the “garbage in, garbage out” data problem on steroids. For example, if historical data on stock prices is biased towards a certain demographic or industry, AI algorithms may replicate these biases in their predictions. This can lead to an amplified bias that proves faulty and not useful for economic decision making.

Take Away

AI has shown remarkable progress in recent years, but, as with everything that came before, there are still things that it cannot do now and may never be able to do. AI lacks the emotional intelligence, creativity, and intuition of humans, as well as common sense reasoning and social and political systems. In economics and stock market analysis, AI can provide valuable insights, but it cannot assure accurate predictions or prevent market volatility. So while companies are investing in ways to make our lives more productive with artificial intelligence and machine learning, it remains important to invest in our own human intelligence, growth and expertise.

Paul Hoffman

Managing Editor, Channelchek

Sources

OpenAI. (2021). ChatGPT [Computer software]. Retrieved from https://openai.com

https://www.cnbc.com/2023/05/16/how-generative-ai-chatgpt-will-change-jobs-at-all-work-levels.html

In the Event of an Official U.S. Bankruptcy…

Is a U.S. Default or Bankruptcy Possible – How Would that Work?

It seems no one is talking about what would happen if the U.S. defaulted on maturing debt, yet it is within the realm of possibilities. Also not impossible is the idea of the powerful country joining the list of sovereign nations that once declared bankruptcy and survived. A retired government employee with a passion for economic history wrote a timely piece on this subject. It was originally published on the Mises Institute website on  May 12, 2023. Channelchek has shared it here with permission.

The current known federal debt is $31.7 trillion, according to the website, U.S. Debt Clock, this is about $94,726 for every man, woman, and child who are citizens as of April 24, 2023. Can you write a check right now made payable to the United States Treasury for the known share of the federal debt of each member of your family after liquidating the assets you own?

A report released by the St. Louis Federal Reserve Branch on March 6, 2023, stated a similar figure for the total known federal debt of about $31.4 trillion as of December 31, 2022. The federal debt size is so great, it can never be repaid in its current form.

Some of us have been in or known families or businesses who had financial debt that could not be paid when adjustments like reducing expenses, increasing income, renegotiating loan repayments to lender(s), and selling assets to raise money for loan repayment were not enough. The reality is that they still could not pay the debt owed to the lender(s).

This leads to filing bankruptcy under federal bankruptcy laws overseen by a federal bankruptcy court.

Chapter 7 bankruptcy is a liquidation proceeding available to consumers and businesses. It allows for assets of a debtor that are not exempt from creditors to be collected and liquidated (turned to cash), and the proceeds distributed to creditors. A consumer debtor receives a complete discharge from debt under Chapter 7, except for certain debts that are prohibited from discharge by the Bankruptcy Code.

Chapter 11 bankruptcy provides a procedure by which an individual or a business can reorganize its debts while continuing to operate. The vast majority of Chapter 11 cases are filed by businesses. The debtor, often with participation from creditors, creates a plan of reorganization under which to repay part or all its debts.

These government entities have filed for Chapter 9 federal bankruptcy:

Orange County, California, in 1994 for about $1.7 billion

Jefferson County, Alabama, in 2011 for about $5 billion

The City of Detroit, Michigan, in 2013 for about $18 billion

The Commonwealth of Puerto Rico in 2017 for $72 billion

According to the United States Courts website:

The purpose of Chapter 9 is to provide a financially-distressed municipality protection from its creditors while it develops and negotiates a plan for adjusting its debts. Reorganization of the debts of a municipality is typically accomplished either by extending debt maturities, reducing the amount of principal or interest, or refinancing the debt by obtaining a new loan.

Although similar to other Chapters in some respects, Chapter 9 is significantly different in that there is no provision in the law for liquidation of the assets of the municipality and distribution of the proceeds to creditors.

The bankruptcies of two counties, a major city, and a sovereign territory resulted in bondholders with financial losses not repaid in full as well as reforms enacted in each governmental entity. Each one emerged from bankruptcy, one hopes, humbled and better able to manage their finances.

The federal government’s best solution for bondholders, taxpayers, and other interested parties is to default, declare sovereign bankruptcy, and make the required changes to get the fiscal business in order. Default, as defined by Dictionary.com as a verb, is “to fail to meet financial obligations or to account properly for money in one’s care.”

Sovereign government defaults are not new in our lifetime with Argentina in 1989, 2001, 2014, and 2020; South Korea, Indonesia, and Thailand in 1997, known as the Asian flu; Greece in 2009; and Russia in 1998.

Possible Outcomes

Some outcomes from these defaults lead to sovereign government debt bond ratings being reduced by the private rating agencies, bondholders losing value on their holdings, debt repayments being renegotiated with lenders, many countries receiving loans with a repayment plan from the International Monetary Fund (IMF), reforms being required to nations’ entitlement programs, a number of government taxes being raised, their currency losing value on currency trading exchanges, price inflation becoming more of a reality to its citizens, and higher interest rates being offered on future government debt bond offerings.

Very few in the financial world are talking about any outcomes of a U.S. federal government debt default. One outcome from the 2011 near default was Standard & Poor’s lowering their AAA federal bond rating to AA+ where it has remained.

What organization would oversee the execution of a U.S. federal government debt default, and what authorization would they be given to deal with the situation? No suggestions are offered when its scale is numerically mind-numbing since the U.S. has used debt as its drug of choice to overdose on fiscal reality.

Some outcomes would include a lowered federal bond rating by the three private bond rating agencies, where the reality of higher interest rates being offered on newly issued federal debt cannot be ignored. Federal government spending cuts in some form will be required by the realities of economic law, which includes reducing the number of federal employees, abolishing federal agencies, reducing and reforming military budgets, selling federal government property, delegating federal programs to the states, and reforming the federal entitlement programs of Medicaid, Medicare, and Social Security. Federal government tax revenue to repay the known debt with interest will rise as a percentage of each year’s future federal budget.

One real impact from a federal government debt default would be that the U.S. dollar would no longer be the global reserve currency, with dollars in many national reserve banks coming back to the U.S. Holding dollars will be like holding a hot potato. Nations holding federal debt paper—like China ($859 billion), Great Britain ($668 billion), Japan ($1.11 trillion), and others as of the January 2023 numbers published by the U.S. Treasury—as well as many mutual funds and others will see their holdings reduced in value leading to a selling off of a magnitude one cannot imagine in scale and timing. Many mutual fund holders like retirees, city and state retirement systems, and 401(k) account holders will be impacted by this unfolding event.

The direction of an individual or business when they emerge from federal bankruptcy is hopefully humility—looking back with the perspective of mistakes made, learning from these mistakes, and moving forward with a focus to benefit their family and community.

However, cities, counties, and sovereign territories differ from individuals, families, and private businesses in emerging from federal bankruptcy. What the outcome of a federal government debt default will be is unknown. Yet its reality is before us.

About the Author:

Stephen Anderson is retired from state government service and is a graduate of The University of Texas at Austin. He currently lives in Texas. His passions are reading, writing, and helping friends and family understand economic history.

Minutes and Other Indicators are Now Showing Less Agreement on Policy by the FOMC

Image Credit: Federal Reserve (Flickr)

The March FOMC Minutes Show the Fed is Less Aligned

We may be entering a period when we have a Federal Reserve that is split on the direction of monetary policy. This could be the case as early as the May 2-3 FOMC meeting. At least, that is one indication that arose from the just-released minutes of the Committee from the March 21-22 meeting. U.S. economic activity was strong leading up to the meeting, then the collapse of two banks occurred. The concerns that followed prompted several Federal Reserve officials to consider whether the central bank should pause its aggressive pace of hiking interest rates.

Split Federal Reserve

The minutes offer insight into what may follow this year. Over the past ten sessions, the FOMC minutes showed the central bank’s focus has been on quickly tightening policy to squelch persistent inflation. Now after nine consecutive interest-rate hikes and quantitative tightening, the conversation has shifted from wondering how fast they can move to whether and when the Fed should pause. At least, it has for some of the Committee members. Soft landings are seldom successfully orchestrated by monetary policy changes; more often, they set the stage for a recession.

In public addresses since the March meeting, Fed officials have appeared to be somewhat split on the way forward. Chicago Fed President Austan Goolsbee, for example, said on April 11 that the Fed needs to be cautious. “We should gather further data and be careful about raising rates too aggressively until we see how much work the headwinds are doing for us in getting down inflation,” Goolsbee said.

Less concerned about a recession and more concerned about winning the war on inflation, Cleveland Fed President Loretta Mester said last week she believes the correct move is for the Fed to continue tightening “a little bit higher” before pausing as the economy and inflation adjusts.

Bank Failure Considerations

The March monetary policy meeting was surrounded by uncertainty for both Fed watchers and some FOMC members. The meeting took place only days after the collapse of Silicon Valley Bank and Signature Bank. Other indicators of a strong economy pointed to an aggressive move from the voting members. But, with the banking sector wounded or perhaps worse, it remained a nailbiter up until 2 pm on March 22 when the Federal Open Market Committee announced a quarter-point interest-rate hike.

While all has since been quiet related to U.S. banks, at the time, the extent of the problem was far from known. The potential economic impact it could have, led Fed staff to project a mild recession starting later in 2023, according to the minutes. This tells financial markets and others impacted by Fed moves that some Fed officials were seriously considering holding steady on rates.

The minutes show, the combination of “slower-than-expected progress on disinflation,” a tight labor market, and the view that the new emergency lending programs had stabilized the financial sector, allowed the central bank to again raise rates. The minutes indicated, “Many participants remarked that the incoming data before the onset of the banking sector stresses had led them to see the appropriate path for the federal funds rate as somewhat higher than their assessment at the time of the December meeting.” Reading on, the minutes said, “After incorporating the banking-sector developments, participants indicated that their policy rate projections were now about unchanged from December.”

Take Away

Although they are released several weeks after each meeting, the Fed minutes are always closely watched for clues as to how central-bank officials are feeling and where monetary policy is likely heading over the next several weeks or months. The indication from these minutes, behind a backdrop of Fed regional president addresses, indicate a less than unified Fed. Unless there is a good deal of unexpected trouble within the banking sector or economy or a clear tick up in economic measures such as employment, the May 3 post-meeting announcement on policy will be tough to forecast.

Paul Hoffman

Managing Editor, Channelchek

Sources

https://www.federalreserve.gov/newsevents/pressreleases/monetary20230412a.htm

https://news.yahoo.com/wall-street-split-on-feds-next-move-as-financial-sector-buckles-after-bank-failures-150737804.html

https://www.barrons.com/articles/march-fed-meeting-minutes-today-cf27aa2?mod=hp_LATEST

The Decision By OPEC Isn’t Bad News for All Investors

Image Credit: Wayne Hsieh (Flickr)

Could Small Oil Companies Perform Especially Well With OPEC’s Reduced Output   

Earlier this week, OPEC+ announced the cartel’s plans for production cuts. Saudi Arabia and other oil-producing members of OPEC+ defied expectations by announcing they would implement production cuts of around 1.1 million barrels a day. Prices of WTI and Brent crude quickly moved higher in the futures market – energy stocks followed. The increased cost of petroleum directly impacts the price of fuel and plastics and indirectly impacts goods that involve transportation – which is mostly all goods.

The decision by OPEC+ is highly likely to put upward pressure on CPI and PPI inflation measures as early as April. The CPI report for April will be released on May 10, and PPI on May 11. Id there good news for investors in the OPEC decision? What stocks might investors look at as potentially benefiting, assuming the OPEC countries adhere to the new production levels?

Background

U.S. markets were not open when the Organization of Petroleum Exporting Countries announced the large cut of over one million barrels per day. When regular trading resumed in the U.S. on Monday, oil prices jumped up 6.3%, and crude oil prices breached $80. Energy stocks, as measured by the Energy Sector SPDR (XLE) rose 4.5%. The price of crude based on futures contracts and the XLE have remained near these levels.

With change comes opportunity. Investors and traders are now trying to determine if this is the start of a new upward trend for the energy sector and, if so, what specific moves may benefit investors most.

One consideration they may have is that, although OPEC is cutting production, the members aren’t the only producers. Historically, domestic production was increased in N. America when prices climbed. This has been less so in recent years as the number of U.S. rigs operating hasn’t increased as might have been expected.

Will this dramatic price spike now prompt action from domestic producers? In his Energy Industry Report published on April 4, titled Why Domestic Producers Cannot Offset OPEC Production Cuts, Michael Heim, CFA, Senior Research Analyst, Noble Capital Markets, says that oil is produced in the U.S. at around $30-$40 per barrel. Heim says in his report, “If producers had the ability to ramp up drilling, we would have thought they would have done so even at $60/bbl. prices.”

Possible Beneficiaries

According to the Noble Analyst, large producers have been constrained from growing their oil operations which stems from political and even shareholder pressures to move away from carbon-based energy products. However, Heim says in his report, “Smaller producers face less pressure. Companies with ample acreage and drilling prospects are best positioned to take advantage of a prolonged oil price upcycle.”

In a conversation with the analyst, he shared that when oil prices spiked during the second half of the pandemic and later had added upward movement with the start of the Russia/Ukraine war, many small oil companies took in enough additional revenue to strengthen their finances. Some even began paying dividends for the first time, while others increased their regular dividend to shareholders.

These smaller oil producers not in the political spotlight that may reap additional benefits from OPEC’s cut could include Hemisphere Energy (HMENF). This company increased production by 55% in 2022. According to a research report by Noble Capital Markets initiating coverage on Hemisphere (dated April 3, 2023), “proven reserve findings and development costs are less than C$12/barrel, providing an extremely attractive return on investment for drilling.” It continued, “Hemisphere’s finding and development costs are among the lowest of western Canadian producers and reflect its favorable drilling locations and the company’s experience drilling in the area.” The increase in price per barrel could enhance cash flow for this North American producer, allowing it to expand production.

Permex Petroleum (OILCD, OIL.CN) is a junior oil and gas company that already had a significant upside potential before the jump in per-barrel prices. This boost in cash from higher oil prices and a possible uplisting to the NYSE, could work to benefit shareholders.

InPlay Oil (IPOOF) increased annual production last year by 58%. InPlay is an example of a smaller producer that has been able to increase drilling when prices rise. It has used increased cash flow to lower debt levels by 59% and pay shareholders with its first dividend payment.

Indonesia Energy Corporation Ltd. (INDO) is an oil and gas exploration and production company operating in Indonesia. The company plans on drilling 18 wells in the Kruh Block (four have been completed). Covid19 steps in the region where Indo Energy operates have pushed back drilling that was expected in 2023-2024 one year.

 Take Away

With change comes opportunity. Higher oil prices will impact all of us that must still occasionally stop our internal combustion engine vehicles at gas stations. But the oil price increase may lead to a melting up of some stocks.

There are arguments that can be made that smaller, more nimble producers, not burdened by the political spotlight and perhaps enjoying a better financial position from the last run-up in oil, are worth looking into. A Channelchek search returned over 200 companies that may fall into this category. This search result is available here.

Paul Hoffman

Managing Editor, Channelchek

Sources

https://www.channelchek.com/research-reports/25689

https://www.channelchek.com/research-reports/25307

https://www.channelchek.com/news-channel/energy-industry-report-why-domestic-producers-cannot-offset-opec-production-cuts

Can the Factors Pushing Gold Higher Continue?

Image Credit: Michael Steinberg (Pexels)

Are Safe Haven Investments Just Beginning Their Rise?

Gold is continuing to move up. Fueled by global tensions, rising prices, a weakening dollar, and new wariness of the banking system, gold seems to have regained its place as a safe haven portfolio allocation. Over the past five calendar days, the precious metal has gained $84 per ounce or 4.3%. In recent days price movement has been helped by lower yields on U.S. Treasuries and OPEC+ oil production cuts which can be expected to increase inflationary pressures as the cost of transportation and production rises for the majority of new goods.

Physical gold, priced in $USD, as seen on the chart below, is up 10.62% on the year. But that does little to tell the recent story. The investments in the yellow metal had gone negative on the year until two days before the Silicon Valley Bank’s problems became widely known in early March. This means much of the current increase on the year has occurred in under a month’s time. And the mindset that is driving the rise seems to be lingering.

Technicians point out that the $2020 level was an area of resistance that traders easily pushed through on Tuesday. Are there also fundamental reasons for it to continue its upward climb?

Global Tensions

Global tensions and geopolitical events can have a significant impact on the price of gold. Uncertainty surrounding the war in Europe, U.S. enemies forming closer alliances with each other, and a former U.S. President being indicted are providing heightened tensions. Gold has remained a safe-haven asset historically because investors turn to in times of political or economic uncertainty – it is perceived to be a store of value that is less vulnerable to fluctuations in currency values and stock markets.

We are in times of political and economic certainty now, this can continue to increase the demand for gold and drive up its price.

Inflation

Gold is often considered a hedge against inflation, so as inflation rises, the price of gold tends to increase. Recent reports in the U.S. have shown inflation, especially core inflation (net of food and energy price changes), has resumed an upward move. The spike in oil stemming from recently announced production cuts should increase both core and overall inflationary pressures.

When inflation is running high, the value of the U.S. dollar erodes. Investors gravitate to alternative stores of wealth that can maintain their purchasing power. Gold is seen as a safe-haven asset that can protect against inflation and currency devaluation. As a result, investors tend to buy more gold, driving up its price.

Watch the replay of the Channelchek Takeaway of the PDAC mining convention

Weaker Dollar

As mentioned above, a weakening U.S. dollar can have a significant impact on the price of gold expressed in U.S. dollars. Precious metals are typically priced in terms of U.S. dollars globally. When inflation runs higher than safe-haven U.S. Treasury yields than assets move toward alternatives like gold, real estate, or cryptocurrencies.

As a result, when the U.S. dollar weakens, the demand for gold may increase, driving up its price.

Systemic Risk

The risk of bank failures can impact gold prices in several ways. In times of perceived financial instability and/or economic uncertainty, investors’ confidence in banks and other financial institutions weakens. This often leads to a shift to safe-haven assets like gold.

In addition, if there is a continued risk of bank failures. If it happens, central banks could take steps to stabilize the financial system by injecting liquidity into the markets and lowering interest rates. These actions weaken currency which increases inflation. Inflation expectations, as mentioned earlier,  support higher gold prices.

Source: Koyfin

Gaining Exposure

The chart shows the correlation between gold, and mining stocks since the beginning of the year. As a reference, the performance of the VanEck gold mining ETF (GDX), and the junior gold mining ETF (GDXJ) are charted against the S&P 500 (SPY),  and an S&P mining index (XME). The XME is designed to track changes across a broad market-cap spectrum of metals and mining segments in the U.S.

The mining stocks have been moving in the same direction and pivoting at the same time as gold (XAUUSD). The difference is the moves have been more pronounced (up and down) for the mining stocks.

Investors expecting gold to continue to increase and considering increasing their exposure to safe-haven precious metals, ought to do their due diligence and determine if gold mining stocks are a better fit for what they are trying to accomplish.

In his Metals & Mining First Quarter 2023 Review and Outlook (April 3, 2023) Mark Reichman, Senior Research Analyst, Natural Resources, at Noble Capital Markets provides various potential scenarios to his outlook for gold and other metals. The report (available at this link) is a good place to start to weigh this industry expert’s considerations with your own.

Paul Hoffman

Managing Editor, Channelchek

Sources

https://www.channelchek.com/news-channel/metals-mining-first-quarter-2023-review-and-outlook

https://www.fxempire.com/forecasts/article/gold-price-forecast-gold-markets-continue-to-pressure-the-upside-2-1328755

https://www.kitco.com/news/2023-04-03/OPEC-oil-cuts-won-t-drive-inflation-high-enough-to-stop-gold-s-run-above-2-000.html

https://www.channelchek.com/videos/noble-analyst-takeaways-channelchek-takeaway-series-pdac-convention-2

Does it Make Sense to Invest New IRA Deposits in a Confusing Market?

Image Credit: Marco Verch (Flickr)

With New Money Deposited Into Their IRA Accounts, Savers Are Faced With an Age-Old Question

With days until the IRS is expecting our tax filings, IRA season is in full swing. With this comes contributions to IRA accounts and individual investment decisions. This year economic uncertainty is a regular topic of conversation; the question has come up in both personal and professional conversations whether or not this money should be invested immediately or wait for a clearer sign of economic and market direction. I asked three financial professionals, each of whose opinion I respect. Did I get three different answers? You be the judge.

Robert R. Johnson, PhD, CFA, CAIA, is the former deputy CEO of the CFA Institute and was President of the College of Financial Services. Currently Dr. Johnson is a Professor of Finance, Heider College of Business at Creighton University. His credentials also include co-author of The Tools and Techniques of Investment Planning, Strategic Value Investing, Investment Banking for Dummies, and others. Overall, his response argues for not shying away from what traditionally has been better-performing investments over time.

He highlighted that investing for as long as possible should involve not waiting until a week before the tax date and making a maximum deposit. If your money is sitting in cash rather than invested, there is a cash performance drag as cash including money markets, more often than not, is a worse performer than equities.

The finance professor pointed out the statistical truth that holding significant amounts of cash ensures that one will suffer significant opportunity losses. Johnson says, “when it comes to building wealth, one can either sleep well or eat well.” He explains, “investing conservatively allows one to sleep well, as there isn’t much volatility. But, it doesn’t allow you to eat well in the long run because your account won’t grow much.”

He backs this up with data compiled by Ibbotson Associates data on large capitalization stocks (think S&P 500), which returned 10.1% compounded annually from 1926-2022. Johnson points out that during the same years, government bonds returned 5.2% annually and T-bills returned 3.2% annually. He explained, “to put it in perspective, $1.00 in invested in the S&P 500 at the start of 1926 would have grown to $11,307.59 (with all dividends reinvested).” He then compared, “that same dollar invested in T-bills would have grown to $21.23.”

What to invest in is certainly an important decision, Dr. Johnson explained, “The surest way to build wealth over long time horizons is to invest in a diversified portfolio of common stocks. Someone with a long time horizon should not have exposure to money market instruments, yet many investors do because they fear the volatility of the stock market.”

Dennie Ceelen, CFP has been part of the Noble Capital Markets Private Client Group in Boca Raton, FL since 2002. He provides wealth management services to NOBLE Clients. He’s also a committee member of The Society of Financial Service Professionals.

When asked if one should invest or wait, he apologetically answered, “it depends.”

Mr. Ceelen explains that when it comes to investments, one size does not fit all. A nineteen-year-old with little or no table income and only an extra $1,000 to put away may be better off investing in education or a car to get them to work. This idea of no IRA deposit at all could even be true of a couple saving to buy their first home. If putting the maximum away for retirement, 40 years away, prevents the purchase of a home in the next year or two, it may not make sense to fund an IRA at all for them this tax year.

For those that are regularly funding an IRA he said, “if your timeline is 30-years until you retire, invest immediately.” Ceelen explained, the general rule of thumb is that the markets over time will go up, the market will be higher in 30 years,” is the expectation based on past experience.

While talking about those with far less than 30-years until retirement, he pulled out a simple spreadsheet that shows that markets don’t always go up. A screenshot of this spreadsheet of major index performance from the close of business the last day of 2021 until March 29, 2023 is provided below.

After 15-months of market downturn, history suggests the losses are temporary

Dennie Ceelen used the spreadsheet to show why he said “it depends.” He said, “if you are retiring in the next two years, make the contribution, take advantage of the tax break but let it sit in cash, or take advantage of the high rates on money markets/short term CD’s.”

“There is no reason to partake in this volatile market if you are that close to retirement,” he cautioned for those close to retirement. Making decisions like this is why many hire financial professionals.

David M. Wright, CLU, ChFC, president and owner of Wright Financial Group, with offices in Ohio and Florida is a 36-year veteran in the financial services industry. He hosts a local radio show called Retirement Income Source with David Wright, and is a frequent guest on TD Ameritrade Insights. One of Mr. Wright’s focuses is on providing workable retirement solutions for those in or close to retirement. His upcoming book, Bonfire of the Sanities: Reset Your Retirement Portfolio for Today’s Financial Lunacy, will be available later this year.

“How you invest your IRA for the 2022-23 tax season has been and always will be a function of your time horizon and propensity for risk,” Wright was quick to point out.  

Wright’s explanation as to whether the timing is right also included what he believes would be the more suitable investment. He offered, “for individuals who are more than 10-15 years away from needing to access their cash, choosing high quality, dividend-paying companies with good cash flow are probably the best bet right now, given the economic tightening that will certainly impact more highly leveraged companies that have to refinance their debt in the future.” He cautioned that those in the age category above,  “growth stocks, in particular those that pay very small dividends will probably be the most impacted by the Federal Reserve’s mandate to fight inflation by raising rates.”

For those even closer to retirement, five to ten years, he said that a dollar-cost averaging strategy to more slowly enter the market is more prudent,  “you are systematically buying into the market without worrying about the purchase price of the investment itself,” Wright said.   

“For those individuals that are within five years or less of retirement, pushing the pause button and purchasing short duration treasuries probably makes the most sense right now due to the higher yields offered courtesy of the Federal Reserve – with 3 month yields 4.8% at the moment,” David Wright explained for those with less time before needing the account for living expenses.

Wright added one more note of advice for the current tax season,  “with the mixed signals of financial news from bank failures to reducing inflation, it probably makes sense to be more cautious right now until the financial storms subside.”

Take Away

There are many right ways to do anything. Multiply that by the different stages of life, and then there are many more. If you are making a last-minute 2022 tax year IRA deposit, hopefully, there are words of wisdom among these three professionals that have been useful.

Overall it seems time in the market is expected to outperform time out of the market, with the caveat, over the short term, anything can happen.

Paul Hoffman

Managing Editor, Channelchek

A Reason for Investors to Look at the New Dynamics of Broadcast Media

Image Credit: Cottonbro Studio (Pexels)

Selling Air Time is Getting Easier for Broadcast Radio

Is broadcast radio losing its power? It doesn’t appear to be, and the medium may be of interest to investors that prefer to shy away from short-lived investment trends and instead look to more easily understood opportunities. According to the industry publication Ad Age, the industry is nearing an intersection where “18- to 49-year-olds are spending more time listening to radio than watching linear TV.” At least one large company has reworked its advertising budget to save money with the expectation of reaching more people. Is this a trend hat will grow?

Re-investing in Radio

Soap opera’s got their start nearly 100 years ago as Proctor and Gamble, manufacturer of soap and candles, created the addictive entertainment to position its product ads in front of the typical soap decision maker of the time. As TV became a fixture in households in the 1950s, P&G adapted and brought the shows and the advertising to television. Last year P&G increased its spending on traditional broadcast radio by 43%. Despite all the new advertising options available, and the ability to refine targeting, P&G has a method to their madness, and it’s worth understanding.

Why the Reversal?

Last year, in the face of rising costs, the marketing giant came under margin pressure. In an attempt to minimize price hikes and maintain old margins, they cut ad spending by 10%, with a new budget of $2.2 billion.

The CEO Jon Moeller had told P&G brand marketers to focus on how many people they reach and how often, rather than how targeted or how much they spend. Chief Brand Officer Marc Pritchard became focused on the effectiveness of radio, connected TV, and streaming free ad-supported TV (FAST).

Belt Tightening

Just as inflation has caused many households to be more frugal, perhaps use less expensive brands, and eat more at home, companies like P&G are finding they are taking a similar approach. And if it helps keep prices down, they can more easily retain customers and attract new ones.  

Here is some data on the extreme cost of reaching a broadcast TV audience. In the business, CPM (cost per mile) is a paid ad method where there is a certain rate for every 1000 impressions an ad receives. The CPM to reach TV audiences is as high as $35 to $65. For comparison, YouTube video CPMs range from $20 to $25, and linear TV is in the $10 to $15 range.

But radio can be bought in the $5-$6 CPM range. The targeting may not be as precise as broadcast TV or other media, but the amount spent for every 1000 impressions is a fraction of the alternatives.

Places Investors Might Explore

Other large advertisers are stepping up their radio efforts as well. Pharmaceutical companies Pfizer, and Johnson & Johnson have started to spend more. According ad intelligence provider Vivvix. Pfizer became a top-five radio advertiser last year. They did this by more than doubling spending.

If you haven’t been following media companies, there is some acclimating to terminology, seasons, and how they profit. Two key places for information is the media report that Noble Capital Markets published late January of this year. The report which is available at this link was prepared by top analysts and discusses the recent state of radio, TV, digital media, and publishing.

A video produced just weeks before the published report by members of the same team can be helpful in providing you with insight as to one media company’s strengths over another. The video, featuring Michael Kupinski, Director of Research at Noble Capital Markets, is a half-hour full of insights. At this link.

Do you wish to hear directly from management of broadcast media companies impacted by new trends?

There are two companies that will be conducting three roadshows in Florida over the next two weeks. If you can attend, you’ll have the opportunity to hear directly from management what the future expectations are, and you’ll have the opportunity to ask questions of your own. The company names, locations and dates are available at this link, along with other scheduled roadshows.

Take Away

The most talked about stocks on the chat boards aren’t the only actionable opportunities astute investors can select from. As with all investing, growing your knowledge base can help one expand their watch-list.

P&G’s ad spend adjustment comes at a time when standard AM/FM radio has caught to and is neck and neck with linear TV (for people 18-49 in the U.S.). Radio audiences may not be growing, but they are not declining as broadcast TV audiences have – they are fairly consistent, and ad costs are a great value at a time when companies are dealing with their own increasing costs. This is getting the attention of large advertisers, and it perhaps should get the attention of investors.

Paul Hoffman

Managing Editor, Channelchek