Great Bear Discovers New Gold Zone West of Hinge and Limb Zones: 20.27 g/t Gold Over 1.75 m, Within 5.69 g/t Gold Over 7.05 m; Reports New LP Fault Results Including 16.07 g/t Gold Over 3.70 m Within 3.10 g/t Gold Over 28.30 m
November 24, 2021 – Vancouver, British Columbia, Canada – Great Bear Resources Ltd. (the “Company” or “Great Bear”, TSX-V: GBR; OTCQX: GTBAF) today reported drill results from its 100% owned flagship Dixie Project, in the Red Lake district of Ontario.
Chris Taylor, President and CEO of Great Bear said, “We recently resumed drilling near the Hinge and Limb zones and discovered a new, high-grade gold zone west of those targets. The new “Midwest” zone closely resembles the style of gold mineralization observed at the Dixie Limb zone; both occur at the sheet-like contacts between different basalt units and consist of silica-sulphide replacement style mineralization including high-grade gold. Several historical holes which tested the Limb zone, did not penetrate far enough to the west to intersect the Midwest zone. In addition to drilling other new, untested basalt contacts, the Company will re-enter and extend previously drilled holes into the Midwest area. Additionally, ongoing drilling of the LP Fault zone continues to return significant gold intervals at depths ranging from bedrock surface to over 600 vertical metres.”
New Midwest Zone Drilling Highlights
- Drill hole DL-071 intersected the new “Midwest” zone, located 275 metres northwest of the Hinge zone and 250 metres south of the Dixie Limb zone, assaying 20.27 g/t gold over 1.75 metres from 812.35 to 814.10 metres downhole. The total mineralized interval was 5.69 g/t gold over 7.05 metres from 809.95 to 817.00 metres downhole. Table 1.
- The new discovery consists of high-grade gold in silica-sulphide replacement alteration at the subvertical planar contact between two basalt flows and is most similar to the Dixie Limb zone in style.
- Until this discovery, it was thought that the only mineralized basalt-basalt contact occurred at the Dixie Limb zone. It is now confirmed that additional basalt-basalt contacts can also localize silica-sulphide replacement mineralization including high-grade gold.
- Great Bear’s drilling and geophysical data suggest additional basalt-basalt contacts may occur within the mafic volcanic package southwest of the LP Fault zone, defining new drill targets.
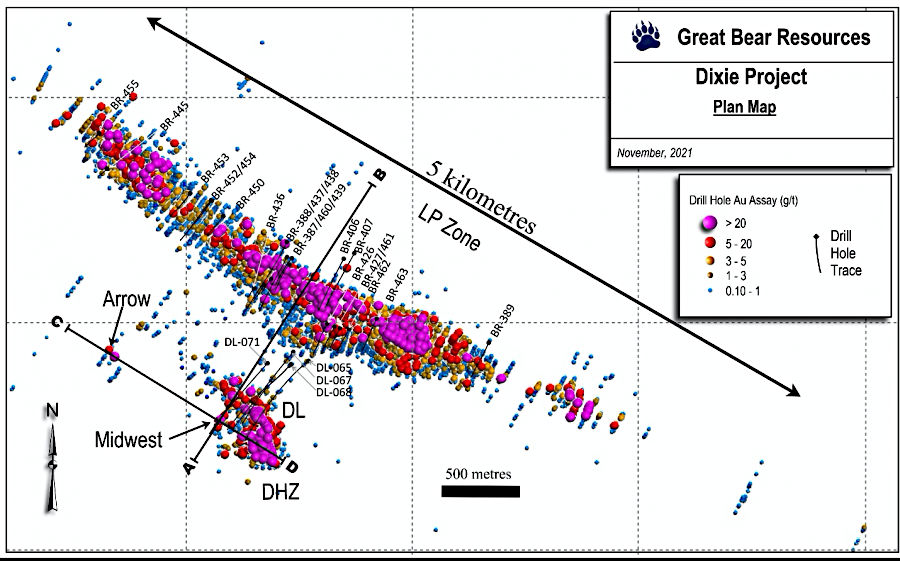
All significant gold zones at Dixie occupy a 1.4 kilometre wide “dilation zone” shown on Figure 1, where many geological contacts and structures are mineralized. A report on seismic surveys by Zeng and Calvert, 2006 presents an interpretation that this structural zone reaches the base of the continental crust. At the Dixie project, the zone contains a broad structural corridor with more than 18 kilometres of strike length. Gold has been drilled along 11 kilometres of strike length to date. In addition to ongoing drilling of the LP Fault, Phase 2 drilling will continue to test various new targets such as the new Midwest zone within this broad structurally dilated and mineralized corridor.
New LP Fault Drilling Highlights
Ongoing LP Fault drilling continues to systematically expand gold mineralization, including at depth. Current drill holes targeted the zone at various points along 2.9 kilometres of strike length, between bedrock surface and approximately 600 metres vertical depth. Table 2.
New drilling primarily targeted 1) extensions to the 23 high-grade domains currently being modeled, including at depth, and 2) the lower-grade halo up to 200 metres from the centre of the zone. Gold mineralization is typically strongest within, and proximal to, the high-grade domains that occur towards the centre of the zone. Highlights include:
- Drill holes BR-406 and BR-407 increase the drilled depth of the LP Fault gold zone to approximately 450 metres vertically from surface on their drill section. Results include:
- BR-406: 66.30 g/t gold over 0.50 metres from 407.30 metres to 407.80 metres downhole. This occurred within a broader interval assaying 6.15 g/t gold over 7.20 metres from 406.80 to 414.00 metres downhole.
- BR-406: 42.60 g/t gold over 0.50 metres from 452.15 to 452.65 metres downhole. This also occurred within a broader interval assaying 3.24 g/t gold over 12.25 metres.
- BR-406: The total mineralized interval was 2.03 g/t gold over 45.85 metres from 406.80 to 452.65 metres downhole.
- BR-407: 11.29 g/t gold over 3.00 metres from 496.00 to 499.00 metres downhole, which occurred within a broad interval of 4.55 g/t gold over 25.50 metres from 473.50 to 499.00 metres downhole.
- BR-407: The total mineralized interval was 1.83 g/t gold over 91.35 metres from 430.40 to 521.75 metres downhole.
- Shallower LP Fault drill holes were also completed to fill in gaps of up to 100 metres in past drilling. Drill hole BR-426 intersected several high-grade, mid-grade and low-grade gold intervals over 150.20 metres of core length, consistent with previously reported continuity of gold mineralization in this area (see news releases of June 3, 2021 and September 9, 2021). Results include:
- BR-426 collared in a broad low-grade gold interval from bedrock surface assaying 0.59 g/t gold over 65.70 metres from 28.50 to 94.20 metres downhole.
- It also intersected high-grade gold assaying 16.07 g/t gold over 3.70 metres from 174.30 to 178.00 metres downhole. The broader mineralized interval was 3.10 g/t gold over 28.30 metres from 165.20 to 193.50 metres downhole.
- Shallow drill hole BR-438 intersected several mineralized intervals over 258.10 metres of core length, including:
- 32.40 g/t gold over 0.50 metres from 72.10 to 72.60 metres downhole, within a broader interval assaying 1.62 g/t gold over 11.20 metres from 66.70 to 77.09 metres downhole,
- 24.84 g/t gold over 0.90 metres from 128.35 to 129.25 metres downhole, within a broader interval assaying 6.00 g/t gold over 3.90 metres from 128.35 to 129.25 metres downhole,
- 37.50 g/t gold over 1.00 metre from 153.60 to 154.50 metres downhole, within a broader interval assaying 2.53 g/t gold over 16.70 metres from 147.60 to 164.30 metres downhole, and
- 40.00 g/t gold over 1.50 metres from 323.30 to 324.80 metres downhole.
- Shallow drill hole BR-463 intersected near-surface high-grade gold assaying 21.00 g/t gold over 1.10 metres from 49.60 to 50.70 metres downhole. The broader mineralized interval was 8.38 g/t gold over 4.20 metres from 46.50 to 50.70 metres downhole.
- Upcoming LP Fault drill results include direct targeting of high-grade domains such as BR7 at depth (see news release of May 19, 2021). Assay results are pending.
Grid Drilling the Hinge, Limb and Midwest Area
Results from the Hinge and Dixie Limb zones were last reported on May 11, 2020 (Dixie Limb zone: 10.19 g/t gold over 19.00 metres from 1,008.55 metres downhole), and December 9, 2020 (Hinge zone: 15.18 g/t gold over 4.90 metres from 1,190.00 metres downhole). The Company has focused more than 90% of its drilling on the adjacent LP Fault zone throughout 2020 and 2021.
Great Bear has begun a new grid-based drill program on 25 – 100 metre centres in the Hinge, Limb and Midwest zone area which will support detailed mineral resource estimation drilling of these zones later in 2022. Grid drilling is initially expected to cover an area of approximately 400 metres of strike length by 600 metres of vertical extent, as shown in Figure 2.
The purpose of grid drilling is to collect gold mineralization results, together with geological and oriented structural data that will be used to target steeply-plunging high-grade gold zones with shoot-like geometries that comprise the primary targets within each of these zones, throughout 2022.
The new Midwest zone was discovered in a previously undrilled area in a 200 to 300 metre step-out hole near the western margin of the newly planned drill grid. Figure 2 and Figure 3.
The Hinge zone was discovered by Great Bear in 2018 (see news release of August 22, 2018) and consists of multiple sub-parallel “Red Lake style” high-grade gold-bearing, anastomosing quartz veins hosted by mafic rocks. High-grade gold frequently concentrates in steeply-plunging shoot-like mineralized zones, as is typical in the Red Lake district.
The adjacent Dixie Limb zone was discovered by Teck Resources Ltd. in the 1980’s and was the first gold zone explored by Great Bear (see news release of September 7, 2017). The Limb zone consists of silica-sulphide replacement mineralization containing mid- to high-grade gold located at the subvertical contact between two basalt units.
Table 1: Dixie Limb, Hinge and Midwest zone drill results from expanded drill grid. Multiple gold-bearing veins and mineralized contacts occur in this area. Grid drilling will define areas to focus upcoming detailed definition of the high-grade “shoot-like” mineralized zones that are the primary targets in this area.
|
Drill Hole
|
|
From (m)
|
To (m)
|
Width* (m)
|
Gold (g/t)
|
Zone
|
|
DL-065
|
|
779.30
|
788.50
|
9.20
|
1.78
|
Limb
|
|
|
including
|
786.00
|
788.50
|
2.50
|
4.66
|
Limb
|
|
|
and including
|
787.25
|
788.50
|
1.25
|
6.39
|
Limb
|
|
|
and
|
976.45
|
977.30
|
0.85
|
6.70
|
Hinge Vein 1
|
|
|
and
|
984.35
|
989.00
|
4.65
|
3.15
|
Hinge Vein 2
|
|
|
including
|
985.75
|
987.50
|
1.75
|
5.38
|
Hinge Vein 2
|
|
|
and
|
1054.95
|
1061.20
|
6.25
|
1.55
|
Hinge Vein 3
|
|
|
including
|
1059.00
|
1059.55
|
0.55
|
14.70
|
Hinge Vein 3
|
|
|
and
|
1069.70
|
1072.70
|
3.00
|
3.45
|
Hinge Vein 4
|
|
|
including
|
1070.20
|
1071.20
|
1.00
|
9.72
|
Hinge Vein 4
|
|
DL-066
|
|
636.50
|
645.30
|
8.80
|
2.81
|
Limb
|
|
|
including
|
638.35
|
645.30
|
6.95
|
3.28
|
Limb
|
|
|
and including
|
638.35
|
639.75
|
1.40
|
5.77
|
Limb
|
|
|
and including
|
643.60
|
645.30
|
1.70
|
6.69
|
Limb
|
|
|
and
|
731.50
|
732.00
|
0.50
|
3.85
|
Unnamed Vein
|
|
DL-067
|
|
538.20
|
541.00
|
2.80
|
1.02
|
Unnamed Vein
|
|
|
and
|
575.90
|
582.80
|
6.90
|
0.57
|
Unnamed Vein
|
|
|
and
|
752.50
|
757.05
|
4.55
|
0.55
|
Unnamed Vein
|
|
|
and
|
871.55
|
872.10
|
0.55
|
7.12
|
Limb
|
|
DL-068
|
|
739.75
|
750.80
|
11.05
|
1.15
|
Limb
|
| |
including
|
746.85
|
750.80
|
3.95
|
2.26
|
Limb
|
|
DL-071
|
|
494.30
|
501.35
|
7.05
|
1.78
|
Unnamed Vein
|
|
|
including
|
494.30
|
497.60
|
3.30
|
2.26
|
Unnamed Vein
|
|
|
and
|
650.40
|
659.75
|
9.35
|
1.03
|
Limb
|
|
|
|
809.95
|
817.00
|
7.05
|
5.69
|
Midwest
|
|
|
including
|
812.35
|
817.00
|
4.65
|
8.31
|
Midwest
|
|
|
and including
|
812.35
|
814.10
|
1.75
|
20.27
|
Midwest
|
|
|
and including
|
812.35
|
813.45
|
1.10
|
30.35
|
Midwest
|
*True widths are 90% of interval widths based on intersection points of the drill hole intercept with the geological model and oriented drill core data. Interval widths are calculated using a 0.10 g/t gold cut-off grade with up to 3 m of internal dilution of zero grade.
Table 2: New LP Fault drill results. Drill hole traces are shown on Figure 3.
|
Drill Hole
|
|
From (m)
|
To (m)
|
Width* (m)
|
Gold (g/t)
|
Section
|
|
BR-387
|
|
255.50
|
256.60
|
1.10
|
2.59
|
20975
|
|
|
and
|
318.70
|
321.00
|
2.30
|
2.27
|
|
|
|
including
|
320.45
|
321.00
|
0.55
|
7.86
|
|
|
|
and
|
346.80
|
348.10
|
1.30
|
1.92
|
|
|
|
and
|
436.00
|
438.00
|
2.00
|
4.25
|
|
|
|
including
|
437.00
|
438.00
|
1.00
|
7.76
|
|
|
BR-388
|
|
136.00
|
142.50
|
6.50
|
0.98
|
21025
|
|
|
and
|
554.00
|
568.90
|
14.90
|
0.57
|
|
|
BR-389
|
|
216.10
|
219.85
|
3.75
|
1.18
|
19550
|
|
|
including
|
218.95
|
219.55
|
0.60
|
4.14
|
|
|
|
and
|
249.00
|
262.75
|
13.75
|
0.66
|
|
|
|
including
|
259.80
|
262.75
|
2.95
|
1.99
|
|
|
BR-406
|
|
354.25
|
355.75
|
1.50
|
5.34
|
20625
|
|
|
and
|
406.80
|
452.65
|
45.85
|
2.03
|
|
|
|
including
|
406.80
|
414.00
|
7.20
|
6.15
|
|
|
|
and including
|
407.30
|
407.80
|
0.50
|
66.30
|
|
|
|
and including
|
440.40
|
452.65
|
12.25
|
3.24
|
|
|
|
and including
|
446.00
|
452.65
|
6.65
|
5.24
|
|
|
|
and including
|
452.15
|
452.65
|
0.50
|
42.60
|
|
|
BR-407
|
|
195.85
|
196.15
|
0.30
|
5.58
|
20600
|
|
|
and
|
430.40
|
521.75
|
91.35
|
1.83
|
|
|
|
including
|
431.50
|
500.00
|
68.50
|
2.30
|
|
|
|
and including
|
431.50
|
432.35
|
0.85
|
9.55
|
|
|
|
and including
|
443.60
|
447.70
|
4.10
|
3.59
|
|
|
|
and including
|
466.50
|
499.00
|
32.50
|
3.86
|
|
|
|
and including
|
473.50
|
499.00
|
25.50
|
4.55
|
|
|
|
and including
|
473.50
|
486.00
|
12.50
|
5.63
|
|
|
|
and including
|
496.00
|
499.00
|
3.00
|
11.29
|
|
|
|
and including
|
497.00
|
498.00
|
1.00
|
22.40
|
|
|
BR-426
|
|
28.50
|
94.20
|
65.70
|
0.59
|
20525
|
|
|
including
|
40.50
|
44.60
|
4.10
|
4.60
|
|
|
|
and including
|
40.50
|
43.00
|
2.50
|
6.02
|
|
|
|
and
|
165.20
|
193.50
|
28.30
|
3.10
|
|
|
|
including
|
168.00
|
178.70
|
10.70
|
7.45
|
|
|
|
and including
|
172.30
|
178.70
|
6.40
|
11.08
|
|
|
|
and including
|
174.30
|
178.00
|
3.70
|
16.07
|
|
|
|
and including
|
174.30
|
175.90
|
1.60
|
28.65
|
|
|
|
and including
|
174.30
|
175.10
|
0.80
|
34.10
|
|
|
BR-427
|
|
59.05
|
89.15
|
30.10
|
0.19
|
20475
|
|
|
and
|
217.25
|
224.20
|
6.95
|
0.50
|
|
|
|
including
|
230.70
|
232.55
|
1.85
|
1.58
|
|
|
BR-428
|
|
133.90
|
136.50
|
2.60
|
1.70
|
19775
|
|
BR-436
|
anomalous
|
14.70
|
16.50
|
1.80
|
0.21
|
21075
|
|
BR-437
|
anomalous
|
22.00
|
36.60
|
14.60
|
0.26
|
21025
|
|
BR-438
|
|
81.90
|
85.00
|
3.10
|
1.93
|
21000
|
|
|
including
|
84.50
|
85.00
|
0.50
|
9.48
|
|
|
BR-439
|
|
66.70
|
77.90
|
11.20
|
1.62
|
20950
|
|
|
including
|
72.10
|
72.60
|
0.50
|
32.40
|
|
|
|
and
|
108.50
|
111.30
|
2.80
|
1.95
|
|
|
|
and
|
128.35
|
132.25
|
3.90
|
6.00
|
|
|
|
including
|
128.35
|
129.25
|
0.90
|
24.84
|
|
|
|
and
|
147.60
|
164.30
|
16.70
|
2.53
|
|
|
|
including
|
153.60
|
154.60
|
1.00
|
37.50
|
|
|
|
and
|
268.70
|
269.40
|
0.70
|
4.25
|
|
|
|
and
|
323.30
|
324.80
|
1.50
|
40.00
|
|
|
BR-445
|
|
74.30
|
75.80
|
1.50
|
1.40
|
22300
|
|
BR-450
|
|
98.10
|
103.60
|
5.50
|
0.39
|
21500
|
|
BR-452
|
|
178.45
|
184.00
|
5.55
|
0.52
|
21625
|
|
BR-453
|
|
29.50
|
40.95
|
11.45
|
0.36
|
21775
|
|
BR-454
|
|
216.50
|
243.25
|
26.75
|
0.40
|
21625
|
|
|
and
|
288.70
|
289.70
|
1.00
|
4.94
|
|
|
BR-455
|
|
82.00
|
97.15
|
15.15
|
0.28
|
22475
|
|
BR-460
|
|
324.00
|
328.00
|
4.00
|
2.54
|
20950
|
|
|
including
|
326.00
|
327.00
|
1.00
|
9.54
|
|
|
|
and
|
407.00
|
418.00
|
11.00
|
0.52
|
|
|
BR-461
|
|
51.40
|
54.50
|
3.10
|
1.99
|
20425
|
|
|
including
|
53.80
|
54.50
|
0.70
|
7.94
|
|
|
|
and
|
74.10
|
105.90
|
31.80
|
0.41
|
|
|
BR-462
|
|
127.10
|
132.30
|
5.20
|
0.49
|
20375
|
|
BR-463
|
|
46.50
|
50.70
|
4.20
|
8.38
|
20250
|
| |
including
|
49.60
|
50.70
|
1.10
|
21.00
|
|
*Represents core length. True mineralization widths range between 65- 95% of reported intervals as they are determined by both structural analyses obtained from oriented drill core data and orientations of individual high grade domains and bulk tonnage domains. Mineralized domains vary in strike between 340 to 270 degrees and dip between 85 to 65 degrees to the north. All drillholes intersect both high grade and bulk tonnage domains and often intersect multiple domains resulting in a range of true widths within the same drillhole.
Figure 1: 1.4 kilometre wide mineralized structural dilation zone at the centre of the Dixie property, section A-B. New Midwest zone shown adjacent to Limb and Hinge zones. Image of visible gold from the Midwest zone hole DL-071 is of a selected interval and does not represent all of the mineralization on the property.
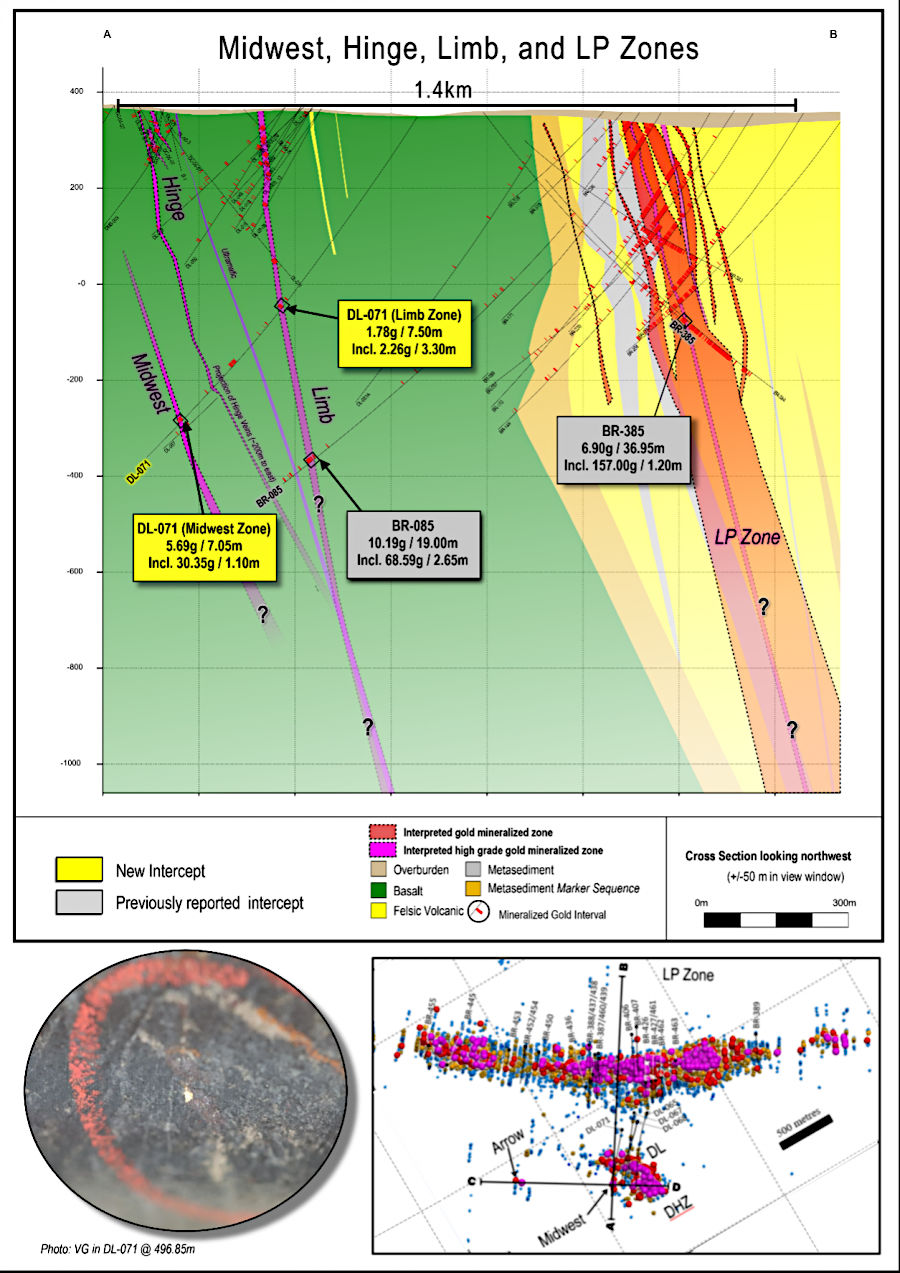
Figure 2: Long section of gold zones within the mafic volcanic rocks to the west of the LP Fault zone. Arrow, Midwest, and Hinge zones shown. Limb zone is located away from the viewer, into the page. Image of visible gold from the Midwest zone hole DL-071 is of a selected interval and does not represent all of the mineralization on the property.
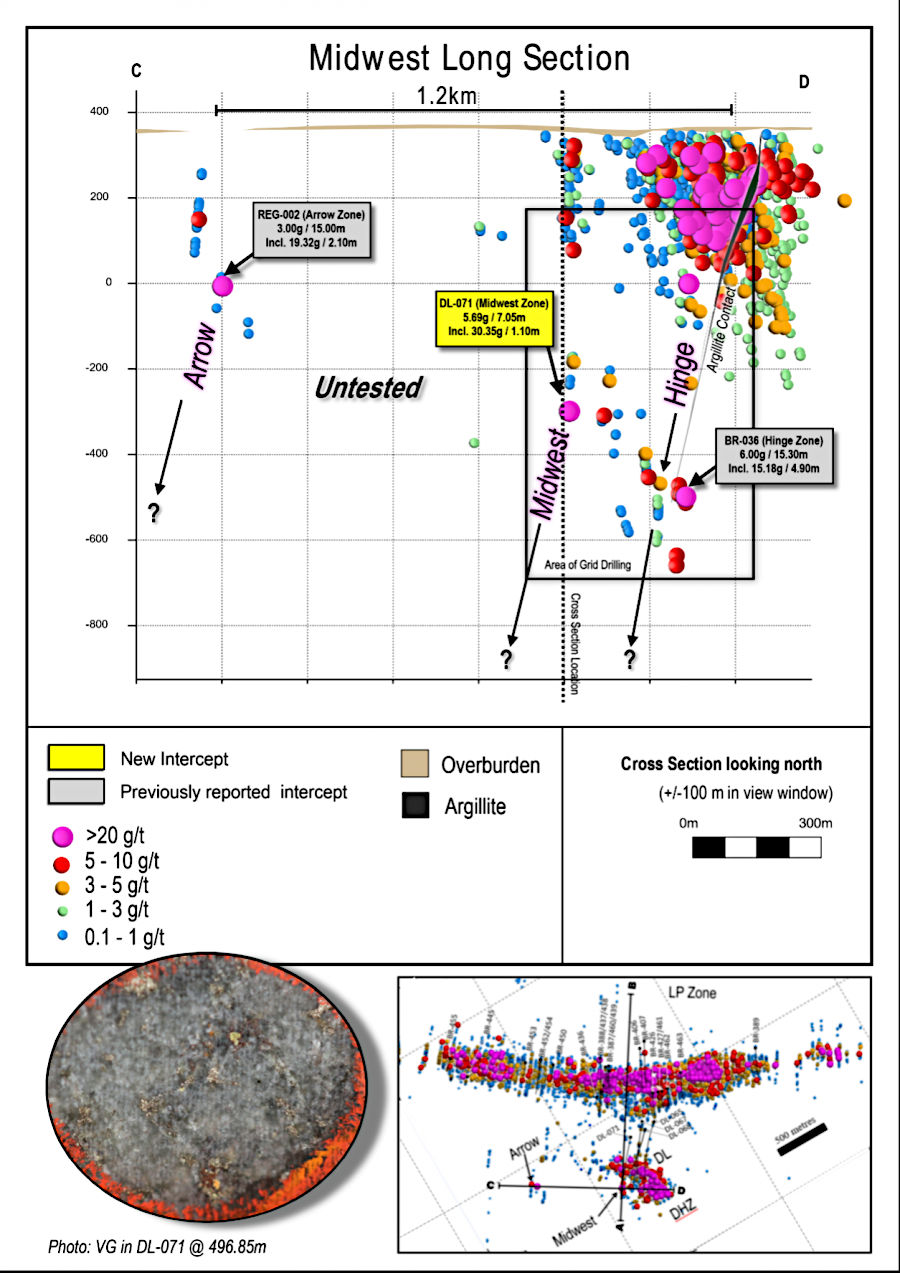
Figure 3: Inclined plan map of the main gold zones at the Dixie property, showing the sections lines of Figures 1 and 2.
Drill collar location, azimuth and dip for drill holes included in this release are provided in the table below (UTM zone 15, NAD 83):
|
Hole ID
|
Easting
|
Northing
|
Elevation
|
Length
|
Dip
|
Azimuth
|
|
BR-387
|
456488
|
5634078
|
366
|
594
|
-51
|
29
|
|
BR-388
|
456388
|
5634043
|
367
|
846
|
-55
|
31
|
|
BR-389
|
458005
|
5633861
|
368
|
372
|
-52
|
212
|
|
BR-406
|
457070
|
5634439
|
357
|
606
|
-53
|
221
|
|
BR-407
|
457137
|
5634466
|
357
|
633
|
-54
|
211
|
|
BR-426
|
456947
|
5634000
|
357
|
394
|
-55
|
209
|
|
BR-427
|
456997
|
5633979
|
357
|
345
|
-55
|
210
|
|
BR-428
|
457756
|
5633909
|
364
|
348
|
53
|
207
|
|
BR-436
|
456468
|
5634235
|
361
|
144
|
-55
|
213
|
|
BR-437
|
456532
|
5634252
|
358
|
234
|
-56
|
213
|
|
BR-438
|
456580
|
5634298
|
358
|
207
|
-55
|
214
|
|
BR-439
|
456697
|
5634387
|
357
|
381
|
-55
|
212
|
|
BR-445
|
455496
|
5635017
|
377
|
150
|
-56
|
226
|
|
BR-450
|
456155
|
5634576
|
363
|
255
|
-49
|
41
|
|
BR-452
|
456075
|
5634654
|
364
|
279
|
-48
|
36
|
|
BR-453
|
455919
|
5634705
|
372
|
291
|
-49
|
39
|
|
BR-454
|
455983
|
5634549
|
371
|
435
|
-50
|
37
|
|
BR-455
|
455453
|
5635258
|
383
|
264
|
-59
|
226
|
|
BR-460
|
456710
|
5634430
|
357
|
534
|
-67
|
215
|
|
BR-461
|
457039
|
5633967
|
359
|
225
|
-51
|
211
|
|
BR-462
|
457097
|
5633964
|
361
|
285
|
-50
|
211
|
|
BR-463
|
457276
|
5634038
|
360
|
351
|
-51
|
206
|
|
DL-065
|
456829
|
5633763
|
361
|
1221
|
-56
|
227
|
|
DL-066
|
456720
|
5633739
|
354
|
999
|
-59
|
229
|
|
DL-067
|
456720
|
5633739
|
354
|
939
|
-54
|
231
|
|
DL-068
|
456741
|
5633815
|
360
|
1068
|
-61
|
227
|
|
DL-071
|
456568
|
5633740
|
354
|
993
|
-56
|
225
|
About the Dixie Project
The 100% owned flagship Dixie project boasts one of the largest recent gold discoveries in a Canadian mining jurisdiction. Proximal to major infrastructure near the town of Red Lake, Ontario, the Dixie property comprises over 91.4 square kilometres of contiguous claims that extend over 22 kilometres with a paved highway and provincial power and natural gas lines. The property also hosts a network of well-maintained logging roads which facilitate access.
23 high-grade domains are structurally and geologically distinctive from the surrounding lower grade, bulk tonnage style gold mineralization. Together, they span a strike length of 4.2 kilometres and occur within larger stratigraphically controlled lower grade domains. They are characterized by high degrees of strain and/or transposed quartz vein zones following two distinct structural fabrics and transition from upper greenschist to lower amphibolite facies metamorphism. Gold in the high-grade domains is generally observed as free gold, is often transposed into, and overgrows the dominant structural fabrics, and is higher-grade on average than the surrounding bulk tonnage gold zones.
To date, Great Bear has completed a total of 721 drill holes, identifying five high-grade gold discoveries. The most significant discovery is the large-scale “LP Fault” zone, which comprises high-grade disseminated gold mineralization within broad moderate-to-lower-grade envelopes in felsic volcanic and sediment units. LP Fault drilling has identified gold mineralization along 11 kilometres of strike length to date, and a detailed drill grid is being completed along approximately 4 kilometres of strike length. The nearby “Hinge”, “Limb”, “Midwest” and “Arrow” gold zones are more characteristic of the renowned Red Lake mined deposits, comprising gold-bearing quartz veins and silica-sulphide replacement zones hosted by mafic volcanic units. Over 80% of the Company’s drill holes into the LP Fault, Dixie Limb and Hinge zones contain visible gold mineralization. Gold occurs mainly as free gold, neither bound to nor within sulphide minerals.
Great Bear adheres to industry-leading quality assurance / quality control (QA/QC) practices in data collection, analysis and disclosure, and detailed assays including all historical LP Fault drill hole data are available on the Company’s website at https://greatbearresources.ca/projects/overview/dixie-project-data/.
About Great Bear
Great Bear Resources Ltd. is a Vancouver-based gold exploration company focused on advancing its 100% owned Dixie project in Northwestern Ontario, Canada. A significant exploration drill program is currently underway to define the mineralization within a large-scale, high-grade disseminated gold discovery made in 2019, the LP Fault. Additional exploration drilling is also in progress to expand and infill nearby high-grade gold zones, as well as to test new regional targets. The Company is currently in the process of compiling all historical data together with incoming assay results, with the goal of publishing an initial multi-million ounce mineral resource estimate in accordance with NI 43-101 for the Dixie project in early 2022.
Great Bear is a committed partner to all stakeholders, with a long-term vision of sustainable exploration to advance the Dixie project in a manner that demonstrates good stewardship of land, operational excellence and accountability.
QA/QC and Core Sampling Protocols
Drill core is logged and sampled in a secure core storage facility located in Red Lake Ontario. Core samples from the program are cut in half, using a diamond cutting saw, and are sent to Activation Laboratories in Ontario, an accredited mineral analysis laboratory, for analysis. All samples are analysed for gold using standard Fire Assay-AA techniques. Samples returning over 10.0 g/t gold are analysed utilizing standard Fire Assay-Gravimetric methods. Pulps from approximately 5% of the gold mineralized samples are submitted for check analysis to a second lab. Selected samples are also chosen for duplicate assay from the coarse reject of the original sample. Selected samples with visible gold are also analyzed with a standard 1 kg metallic screen fire assay. Certified gold reference standards, blanks and field duplicates are routinely inserted into the sample stream, as part of Great Bear’s quality control/quality assurance program (QAQC). No QAQC issues were noted with the results reported herein.
Qualified Person and NI 43-101 Disclosure
Mr. R. Bob Singh, P.Geo, VP Exploration, and Ms. Andrea Diakow P.Geo, VP Projects for Great Bear are the Qualified Persons as defined by National Instrument 43-101 responsible for the accuracy of technical information contained in this news release.
ON BEHALF OF THE BOARD
“Chris Taylor”
Chris Taylor, President and CEO
Investor Inquiries:
Ms. Jenni Piette,
Director, Sustainability and Stakeholder Relations
Tel: 604-646-8354
info@greatbearresources.ca
www.greatbearresources.ca
Cautionary note regarding forward-looking statements
This release contains certain “forward looking statements” and certain “forward-looking information” as defined under applicable Canadian and U.S. securities laws. Forward-looking statements and information can generally be identified by the use of forward-looking terminology such as “may”, “will”, “should”, “expect”, “intend”, “estimate”, “anticipate”, “believe”, “continue”, “plans” or similar terminology. The forward-looking information contained herein is provided for the purpose of assisting readers in understanding management’s current expectations and plans relating to the future. Readers are cautioned that such information may not be appropriate for other purposes.
Forward-looking information are based on management of the parties’ reasonable assumptions, estimates, expectations, analyses and opinions, which are based on such management’s experience and perception of trends, current conditions and expected developments, and other factors that management believes are relevant and reasonable in the circumstances, but which may prove to be incorrect.
Such factors, among other things, include: impacts arising from the global disruption caused by the Covid-19 coronavirus outbreak, business integration risks; fluctuations in general macroeconomic conditions; fluctuations in securities markets; fluctuations in spot and forward prices of gold or certain other commodities; change in national and local government, legislation, taxation, controls, regulations and political or economic developments; risks and hazards associated with the business of mineral exploration, development and mining (including environmental hazards, industrial accidents, unusual or unexpected formations pressures, cave-ins and flooding); discrepancies between actual and estimated metallurgical recoveries; inability to obtain adequate insurance to cover risks and hazards; the presence of laws and regulations that may impose restrictions on mining; employee relations; relationships with and claims by local communities and indigenous populations; availability of increasing costs associated with mining inputs and labour; the speculative nature of mineral exploration and development (including the risks of obtaining necessary licenses, permits and approvals from government authorities); and title to properties.
Great Bear undertakes no obligation to update forward-looking information except as required by applicable law. Such forward-looking information represents management’s best judgment based on information currently available. No forward-looking statement can be guaranteed and actual future results may vary materially. Accordingly, readers are advised not to place undue reliance on forward-looking statements or information.