Metals & Mining Fourth Quarter 2021 Review and Outlook
Noble Capital Markets Natural Resources Sector Review
Source: Capital IQ as of 12/31/2021
Source: Capital IQ as of 12/31/2021; Company Filings
METALS AND MINING INDUSTRY OUTLOOK
Metals & Mining Fourth Quarter 2021 Review and Outlook
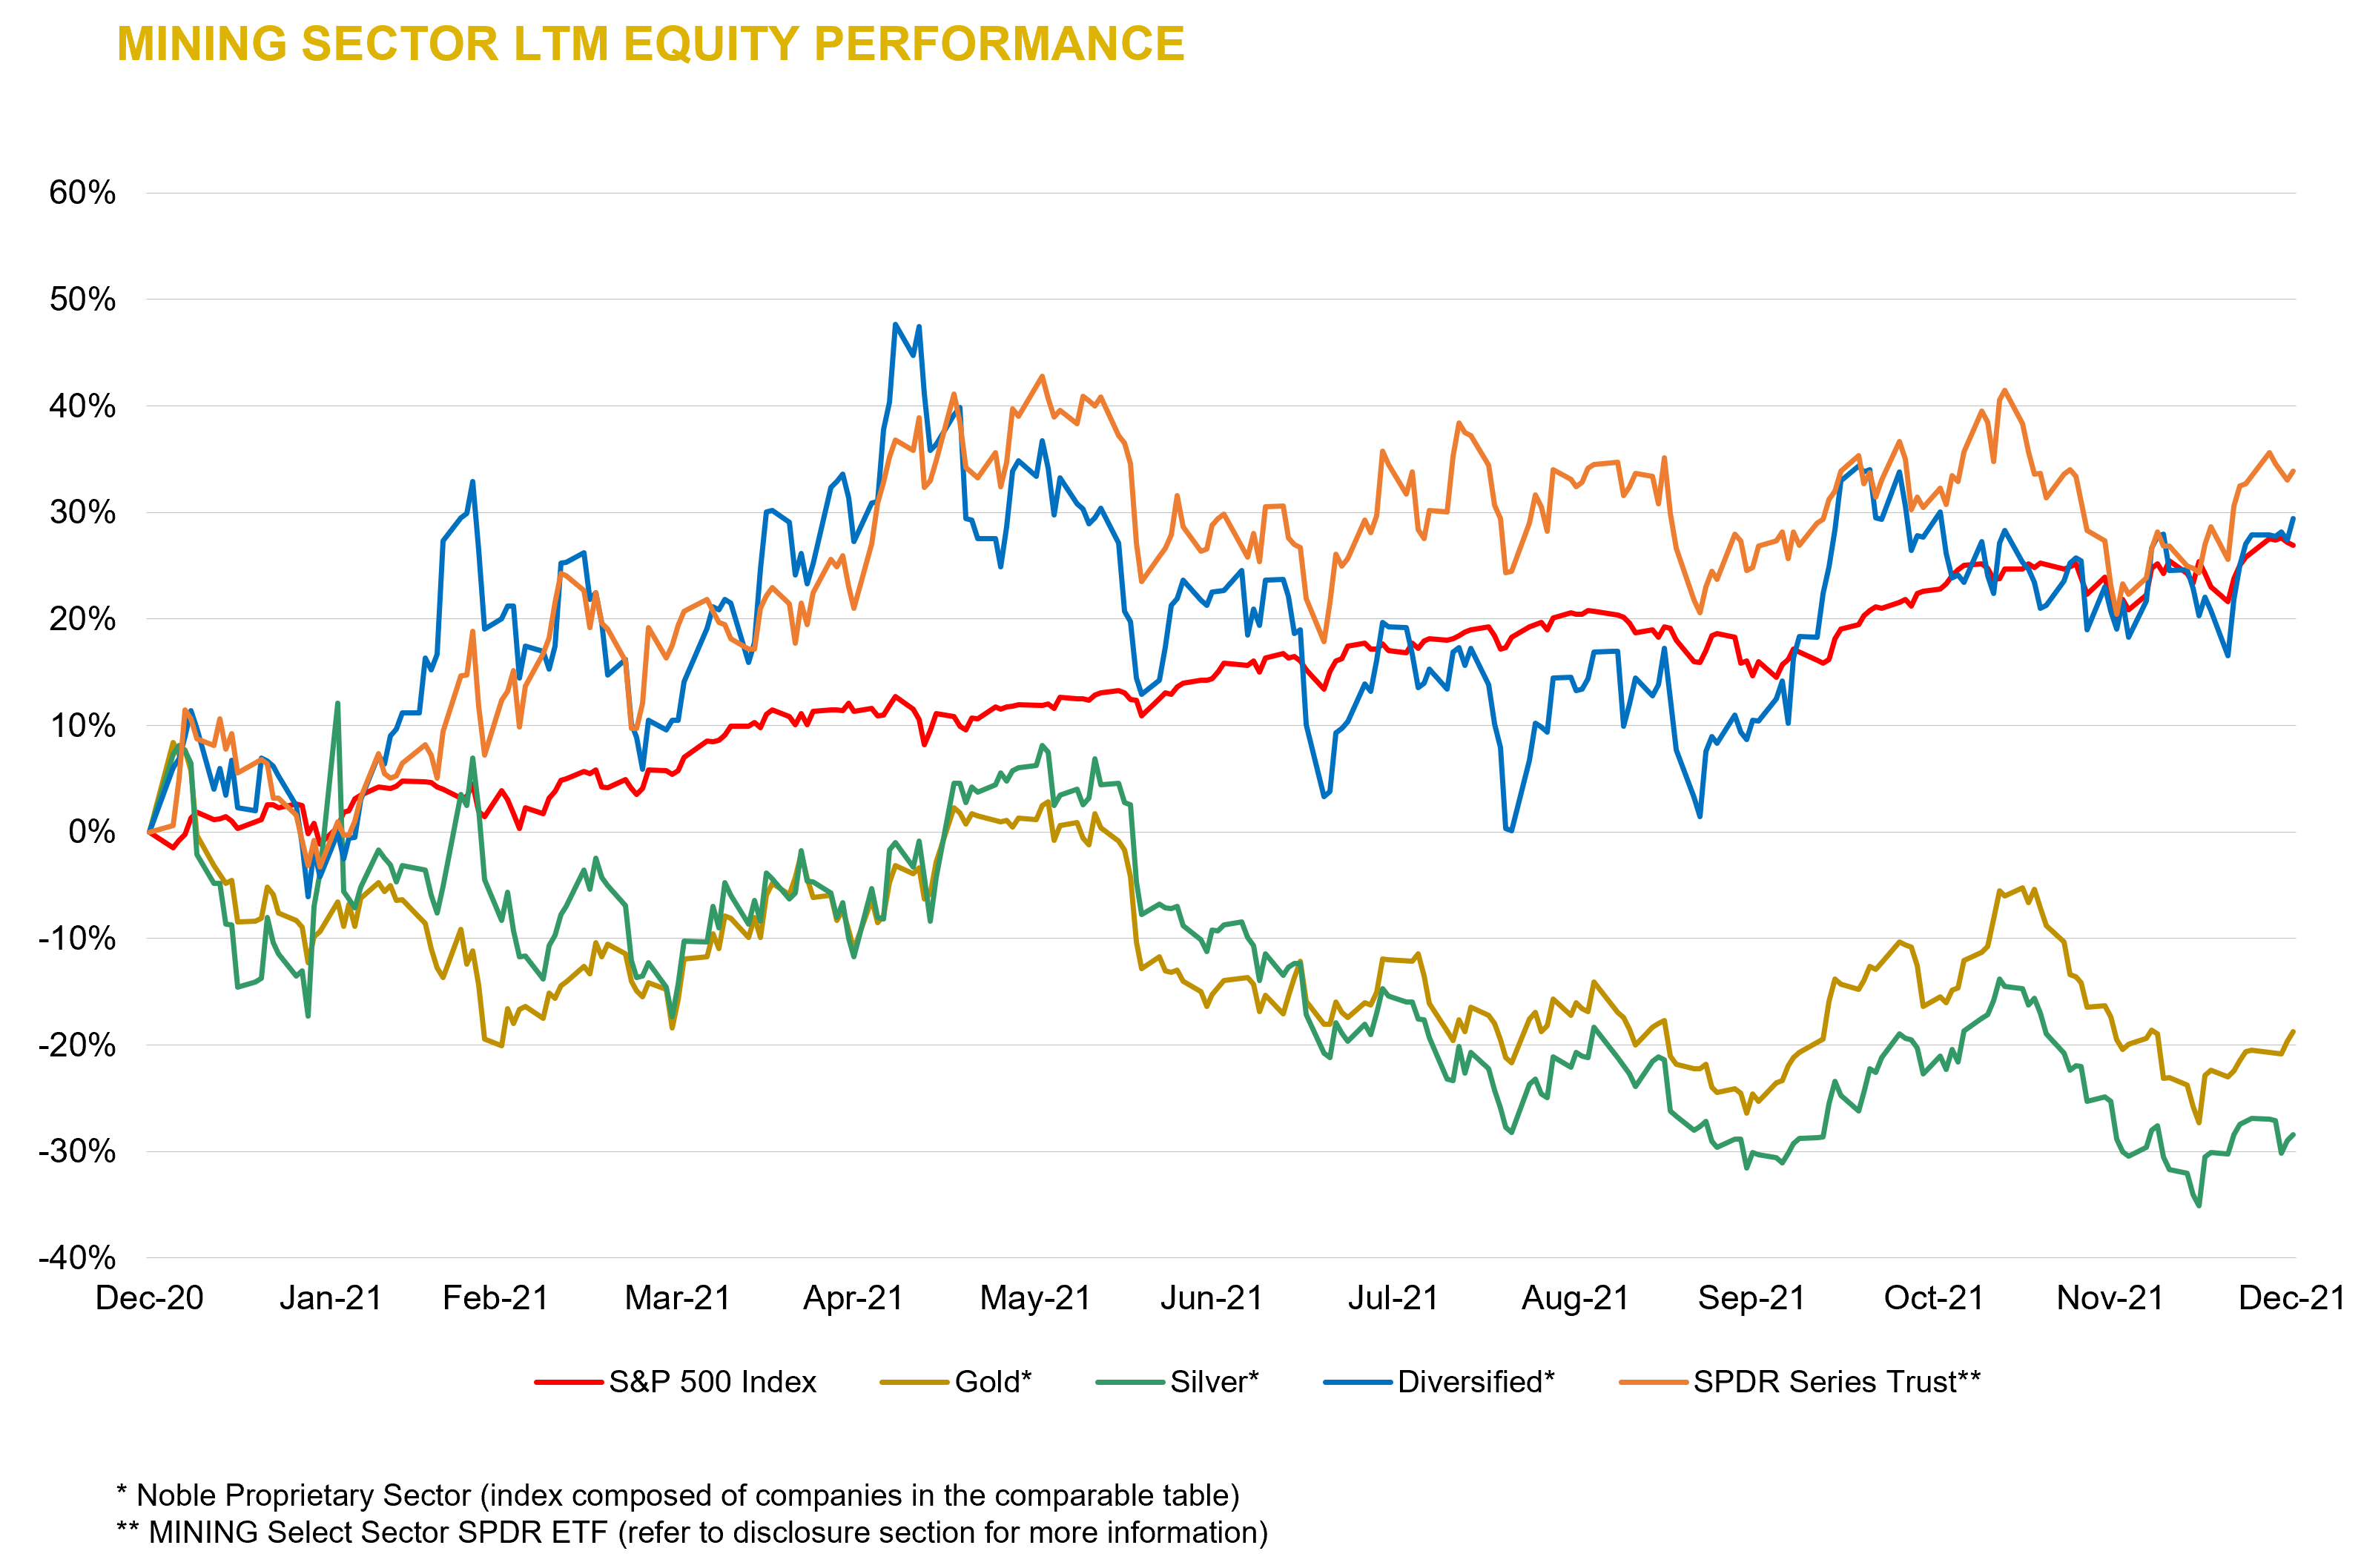
Mining companies post a strong finish.
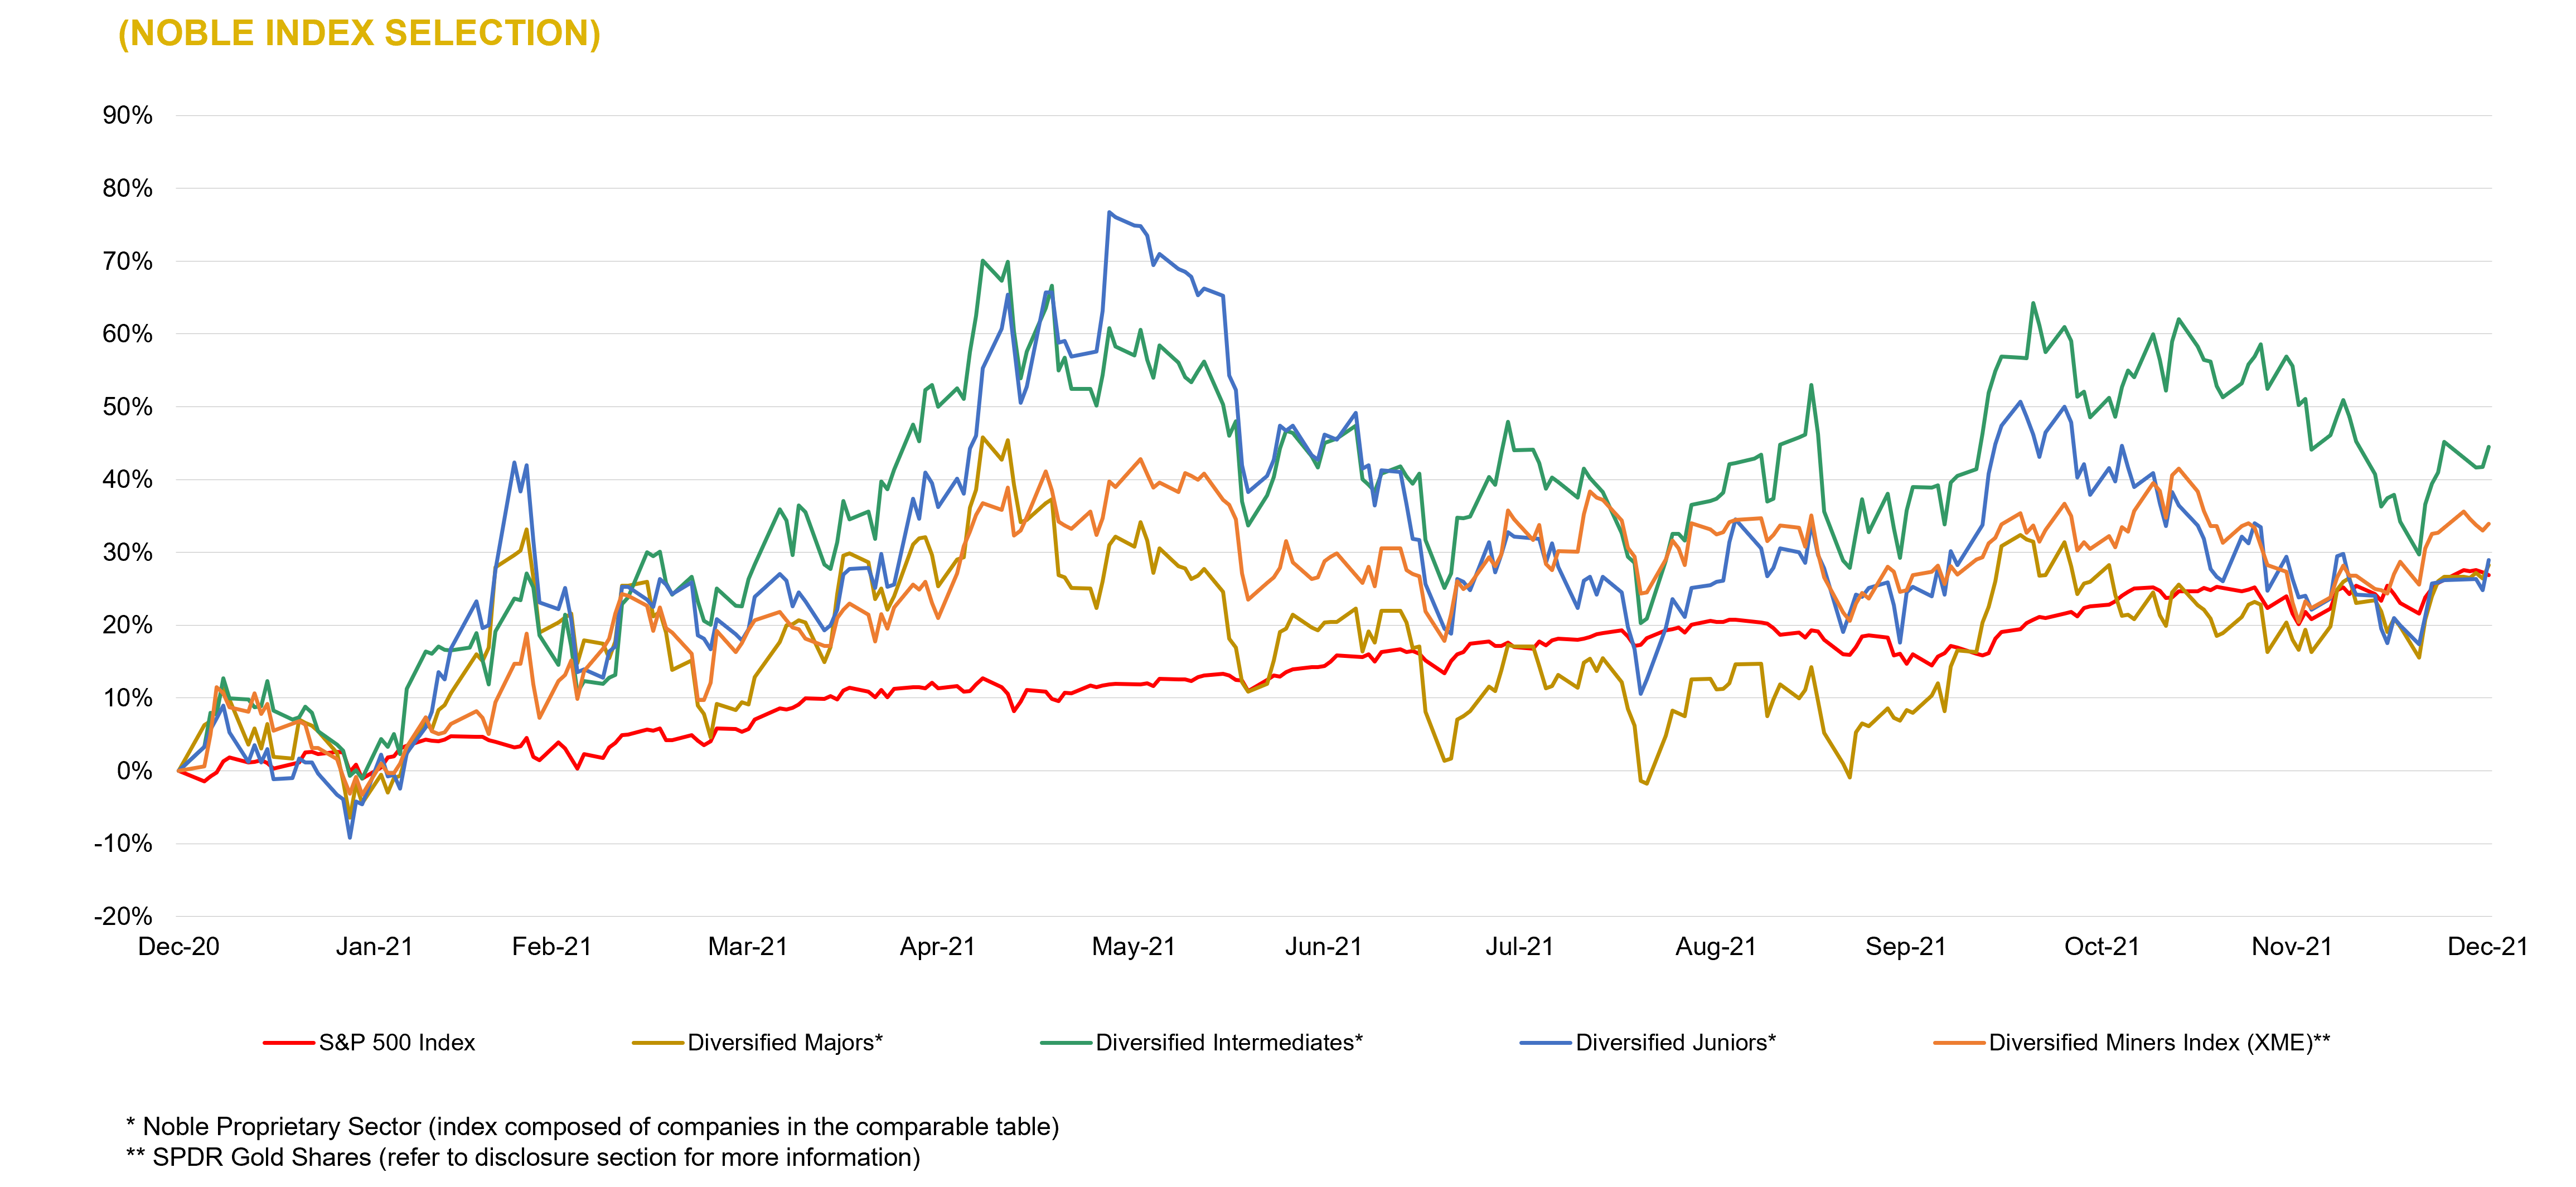
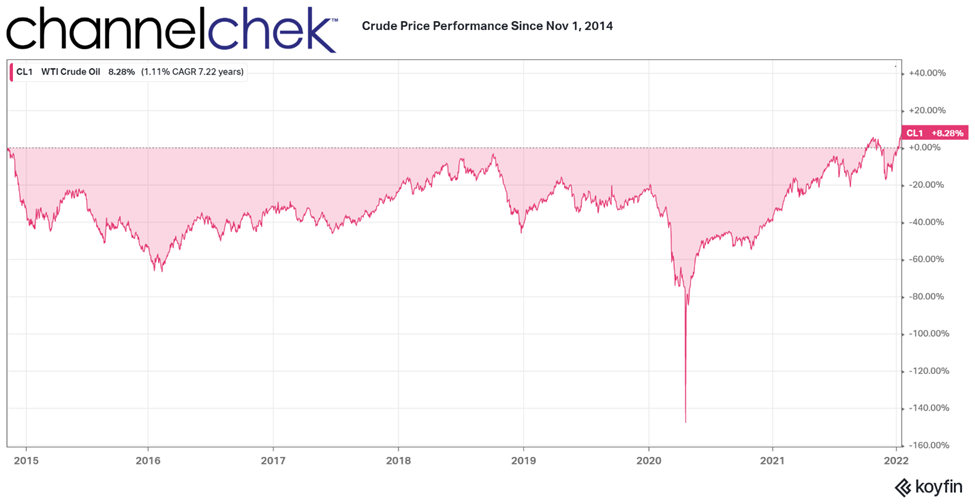
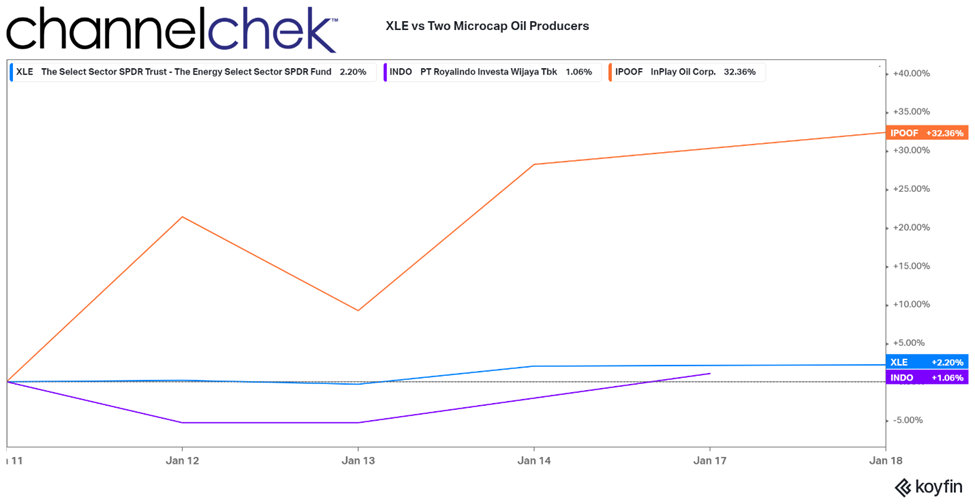
During the fourth quarter, mining companies (as measured by the XME) appreciated 7.3% compared to a gain of 10.6% for the S&P 500 index. The VanEck Vectors Gold Miners (GDX) and Junior Gold Miners (GDXJ) ETFs were up 8.7% and 9.4%, respectively. Gold, silver, copper, and zinc futures prices were up 4.0%, 6.1%, 9.1%, and 8.5%, respectively, while lead was down 2.4%. For the full year, gold and silver prices declined 4.5% and 12.1%, respectively, while copper, lead, and zinc prices were up 26.4%, 21.3%, and 33.6%. Performance in 2021 was driven by base metals equities as underscored by the 33.9% price return on the XME versus -11.1% and -22.7% for the GDX and GDXJ, respectively. The S&P 500 appreciated 26.9%.
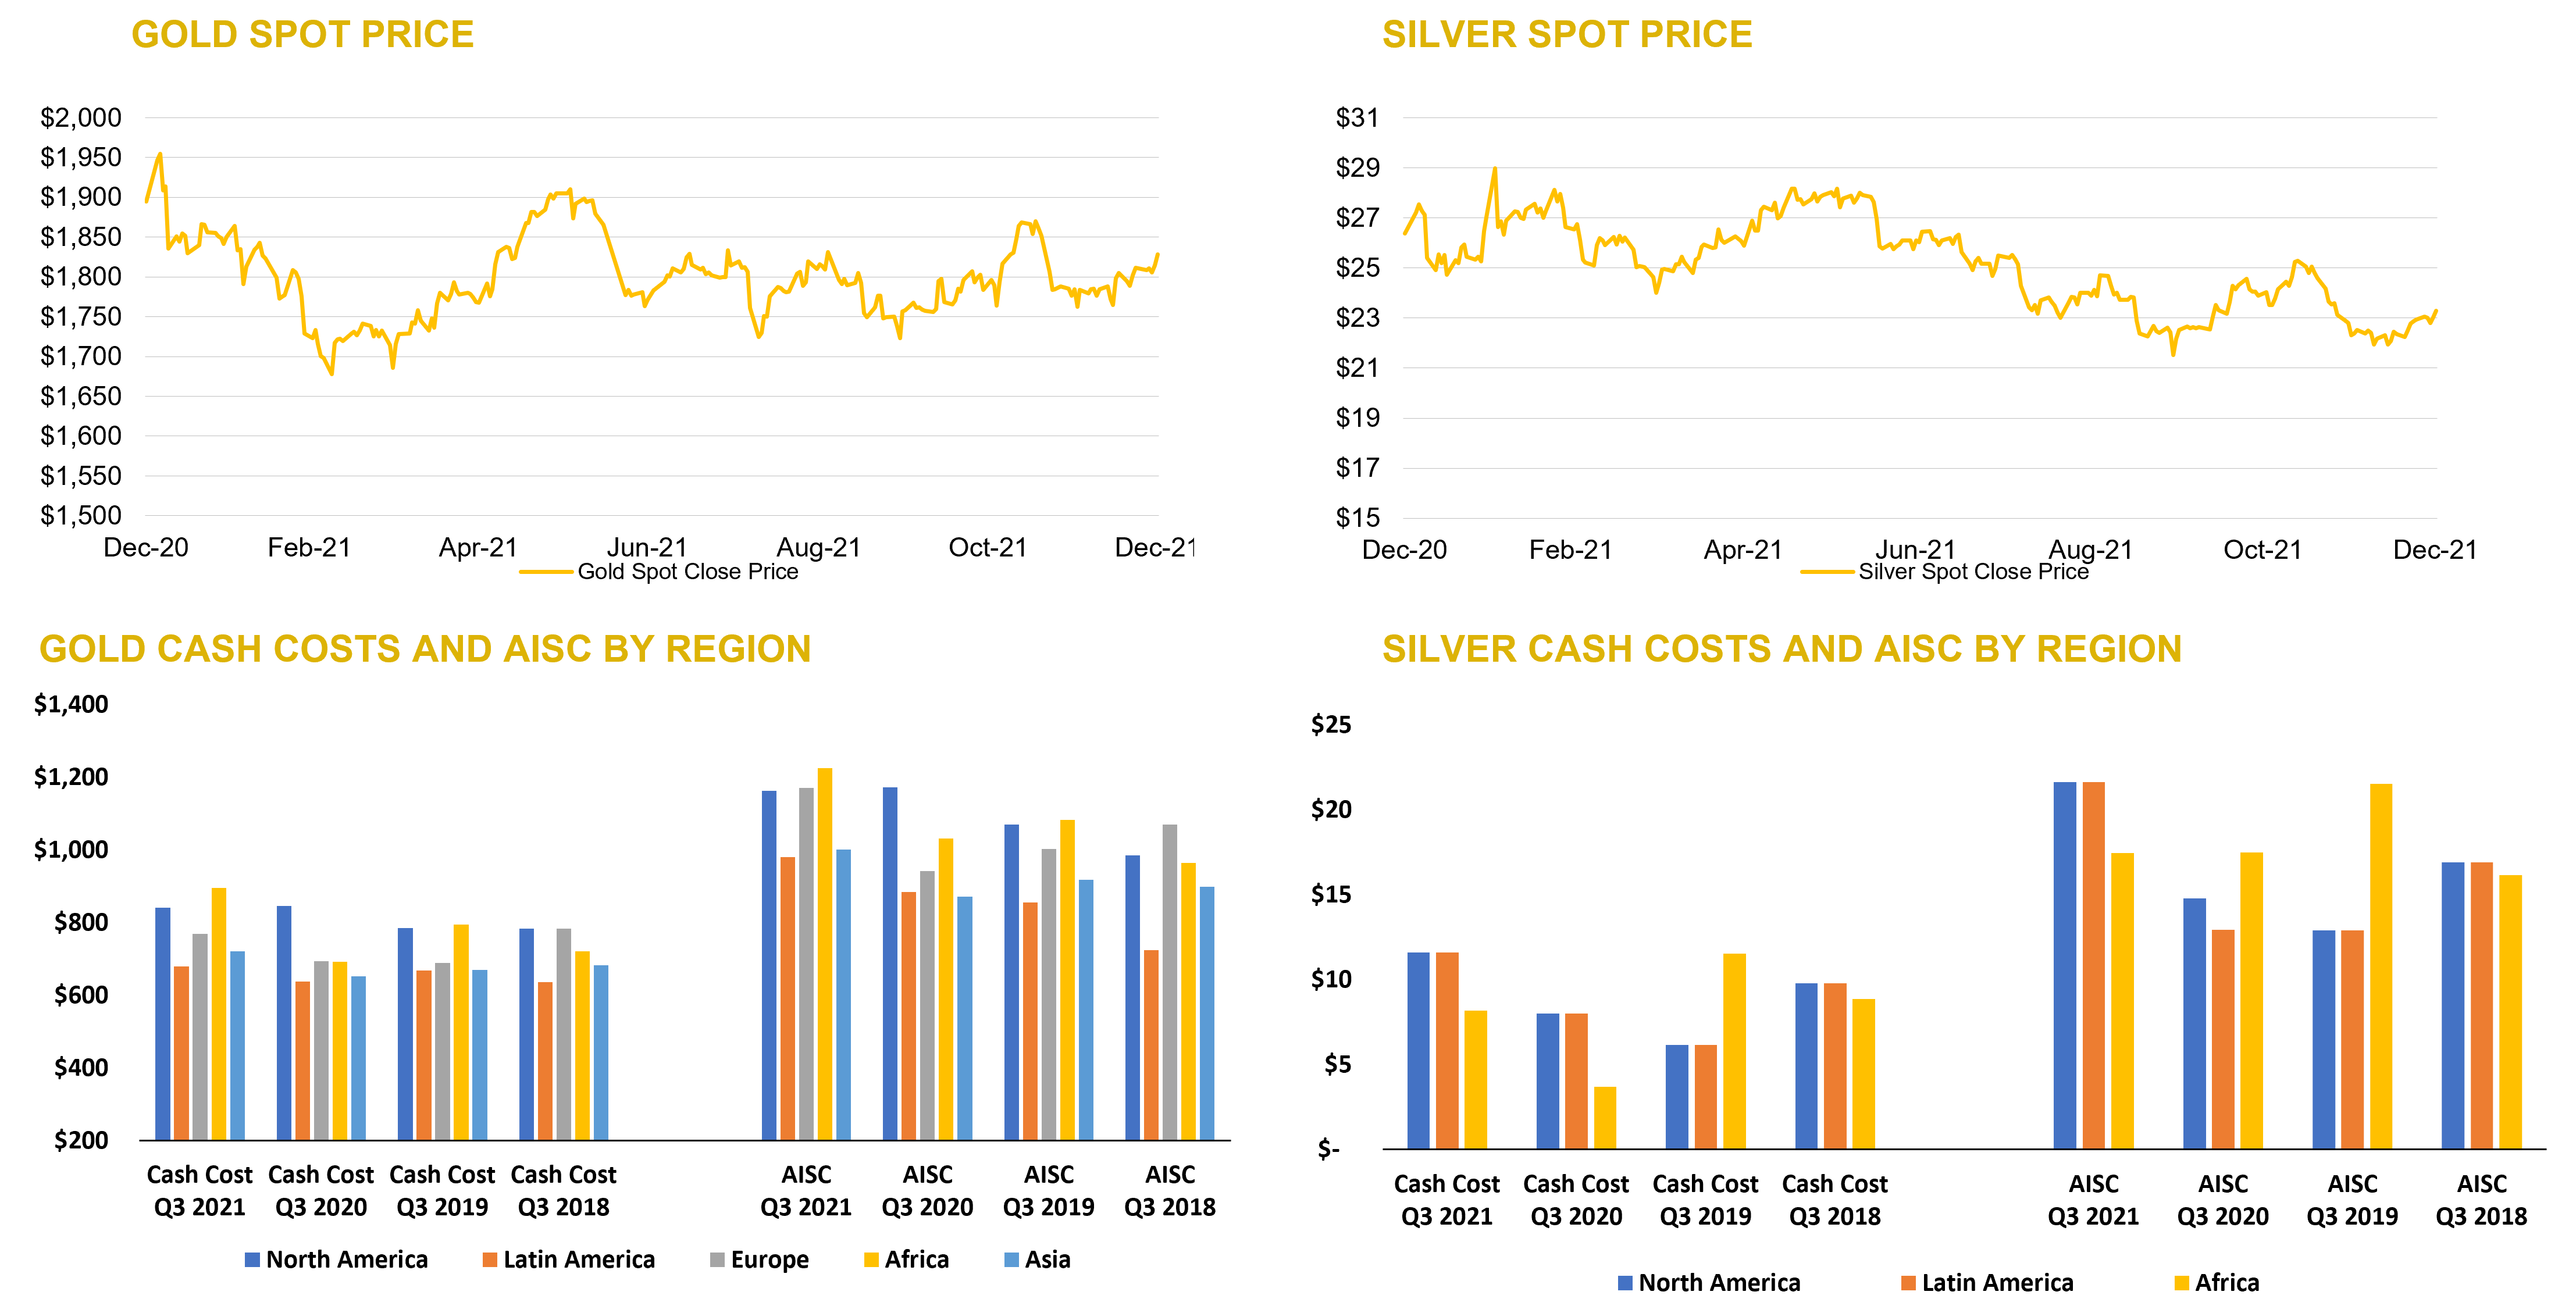
Outlook for precious metals.
The U.S. Dollar Index rose 1.7% during the fourth quarter and 6.4% in 2021. The yield on the 10-year rose modestly during the fourth quarter to 1.51% and was up 59.5 basis points compared to year-end 2020. While a rise in the U.S. dollar and treasury yields are headwinds for gold, we believe investors may view precious metals more favorably in 2022 to protect portfolio values from potential volatility in equity markets, an uncertain path for inflation, and the risk of Federal Reserve monetary policy errors. While the Federal Reserve has signaled that it will end monthly bond purchases in March and could raise interest rates three times in 2022, we think market expectations are partially baked in and investors will likely focus on real interest rates which are expected to remain low.
Can industrial metals continue their ascent?
While U.S. and global economic growth is expected to moderate and we don’t expect the same level of gains for industrial metals in 2022, cash flow generation should remain strong for industrial metals companies while supply and demand fundamentals remain favorable. Improving supply chains, inventory re-stocking, and greater capital spending could be supportive of pricing, and we believe the long-term investment case for owning industrial metals mining companies remains favorable. Weaker growth abroad, particularly in China, remains a near-term threat.
Putting it all together.
We remain constructive on the Metals and Mining sector. While precious metals underperformed industrial metals in 2021, we believe precious metals mining equities could outperform in 2022. Valuations, particularly among junior companies, remain attractive while current gold and silver prices are sufficient to be profitable. Additionally, we are beginning to observe an increase in M&A activity which highlight value in the sector based on acquisition premiums.
Source: Capital IQ as of 12/31/2021
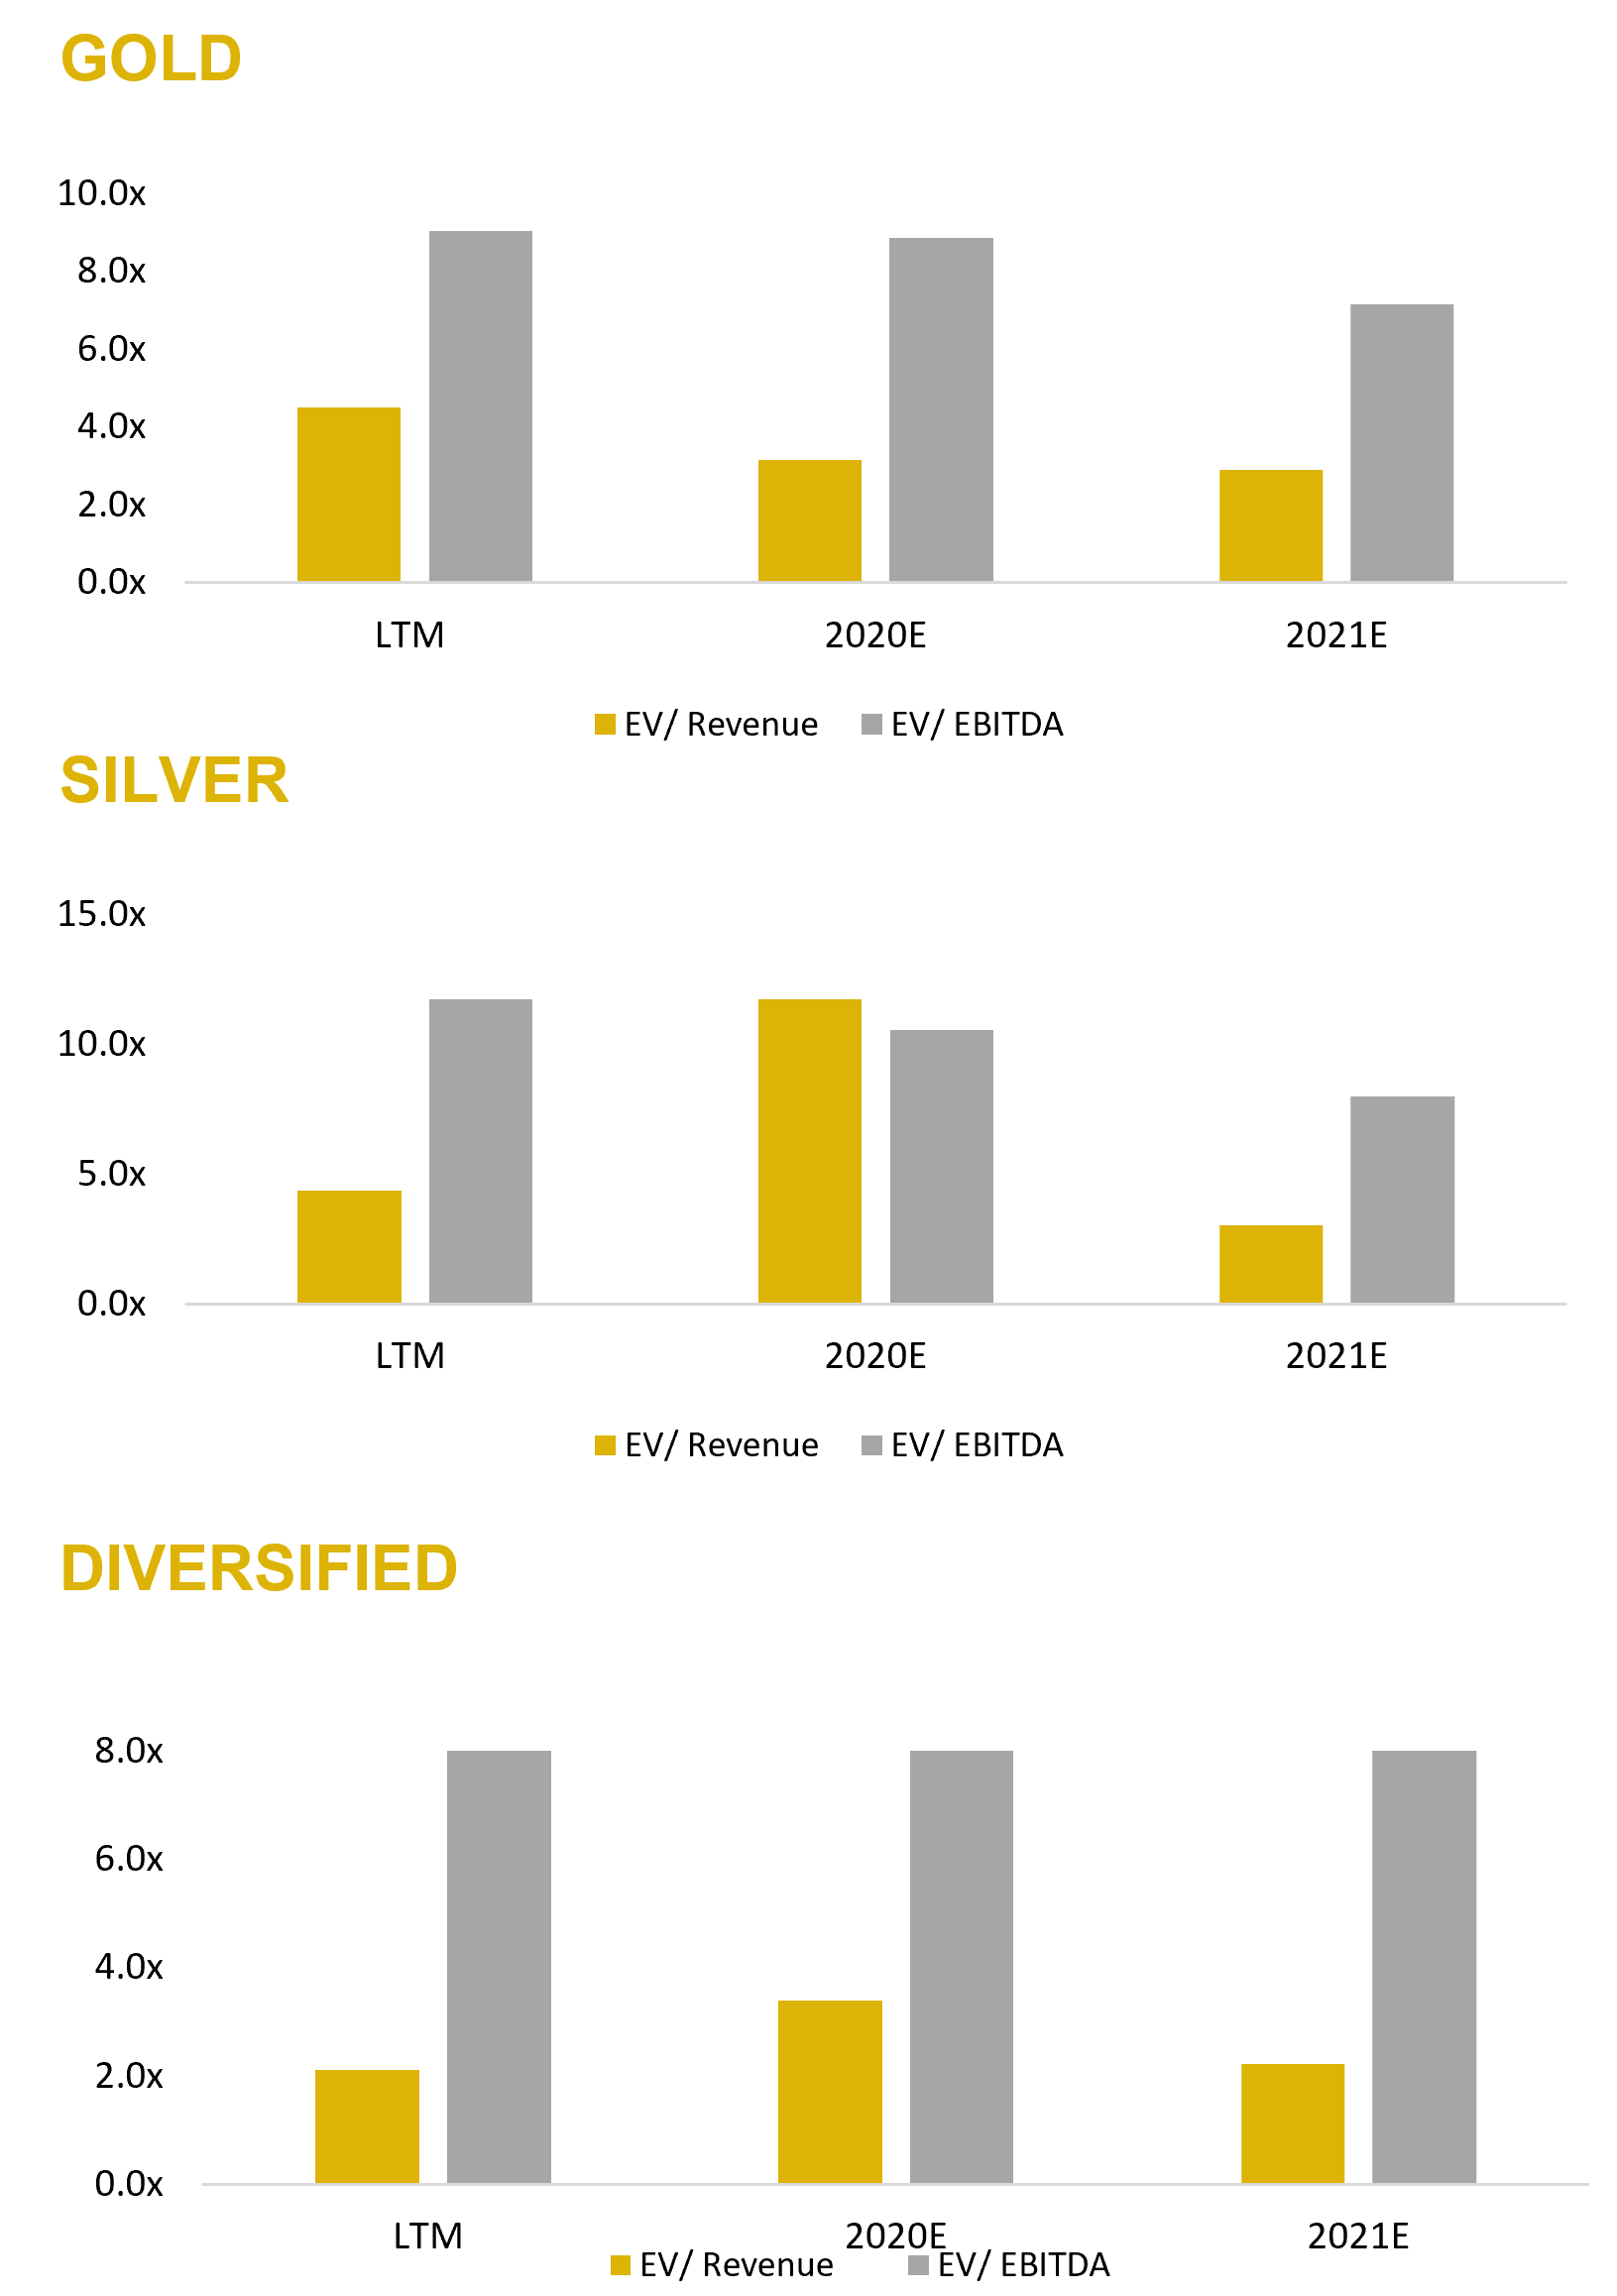
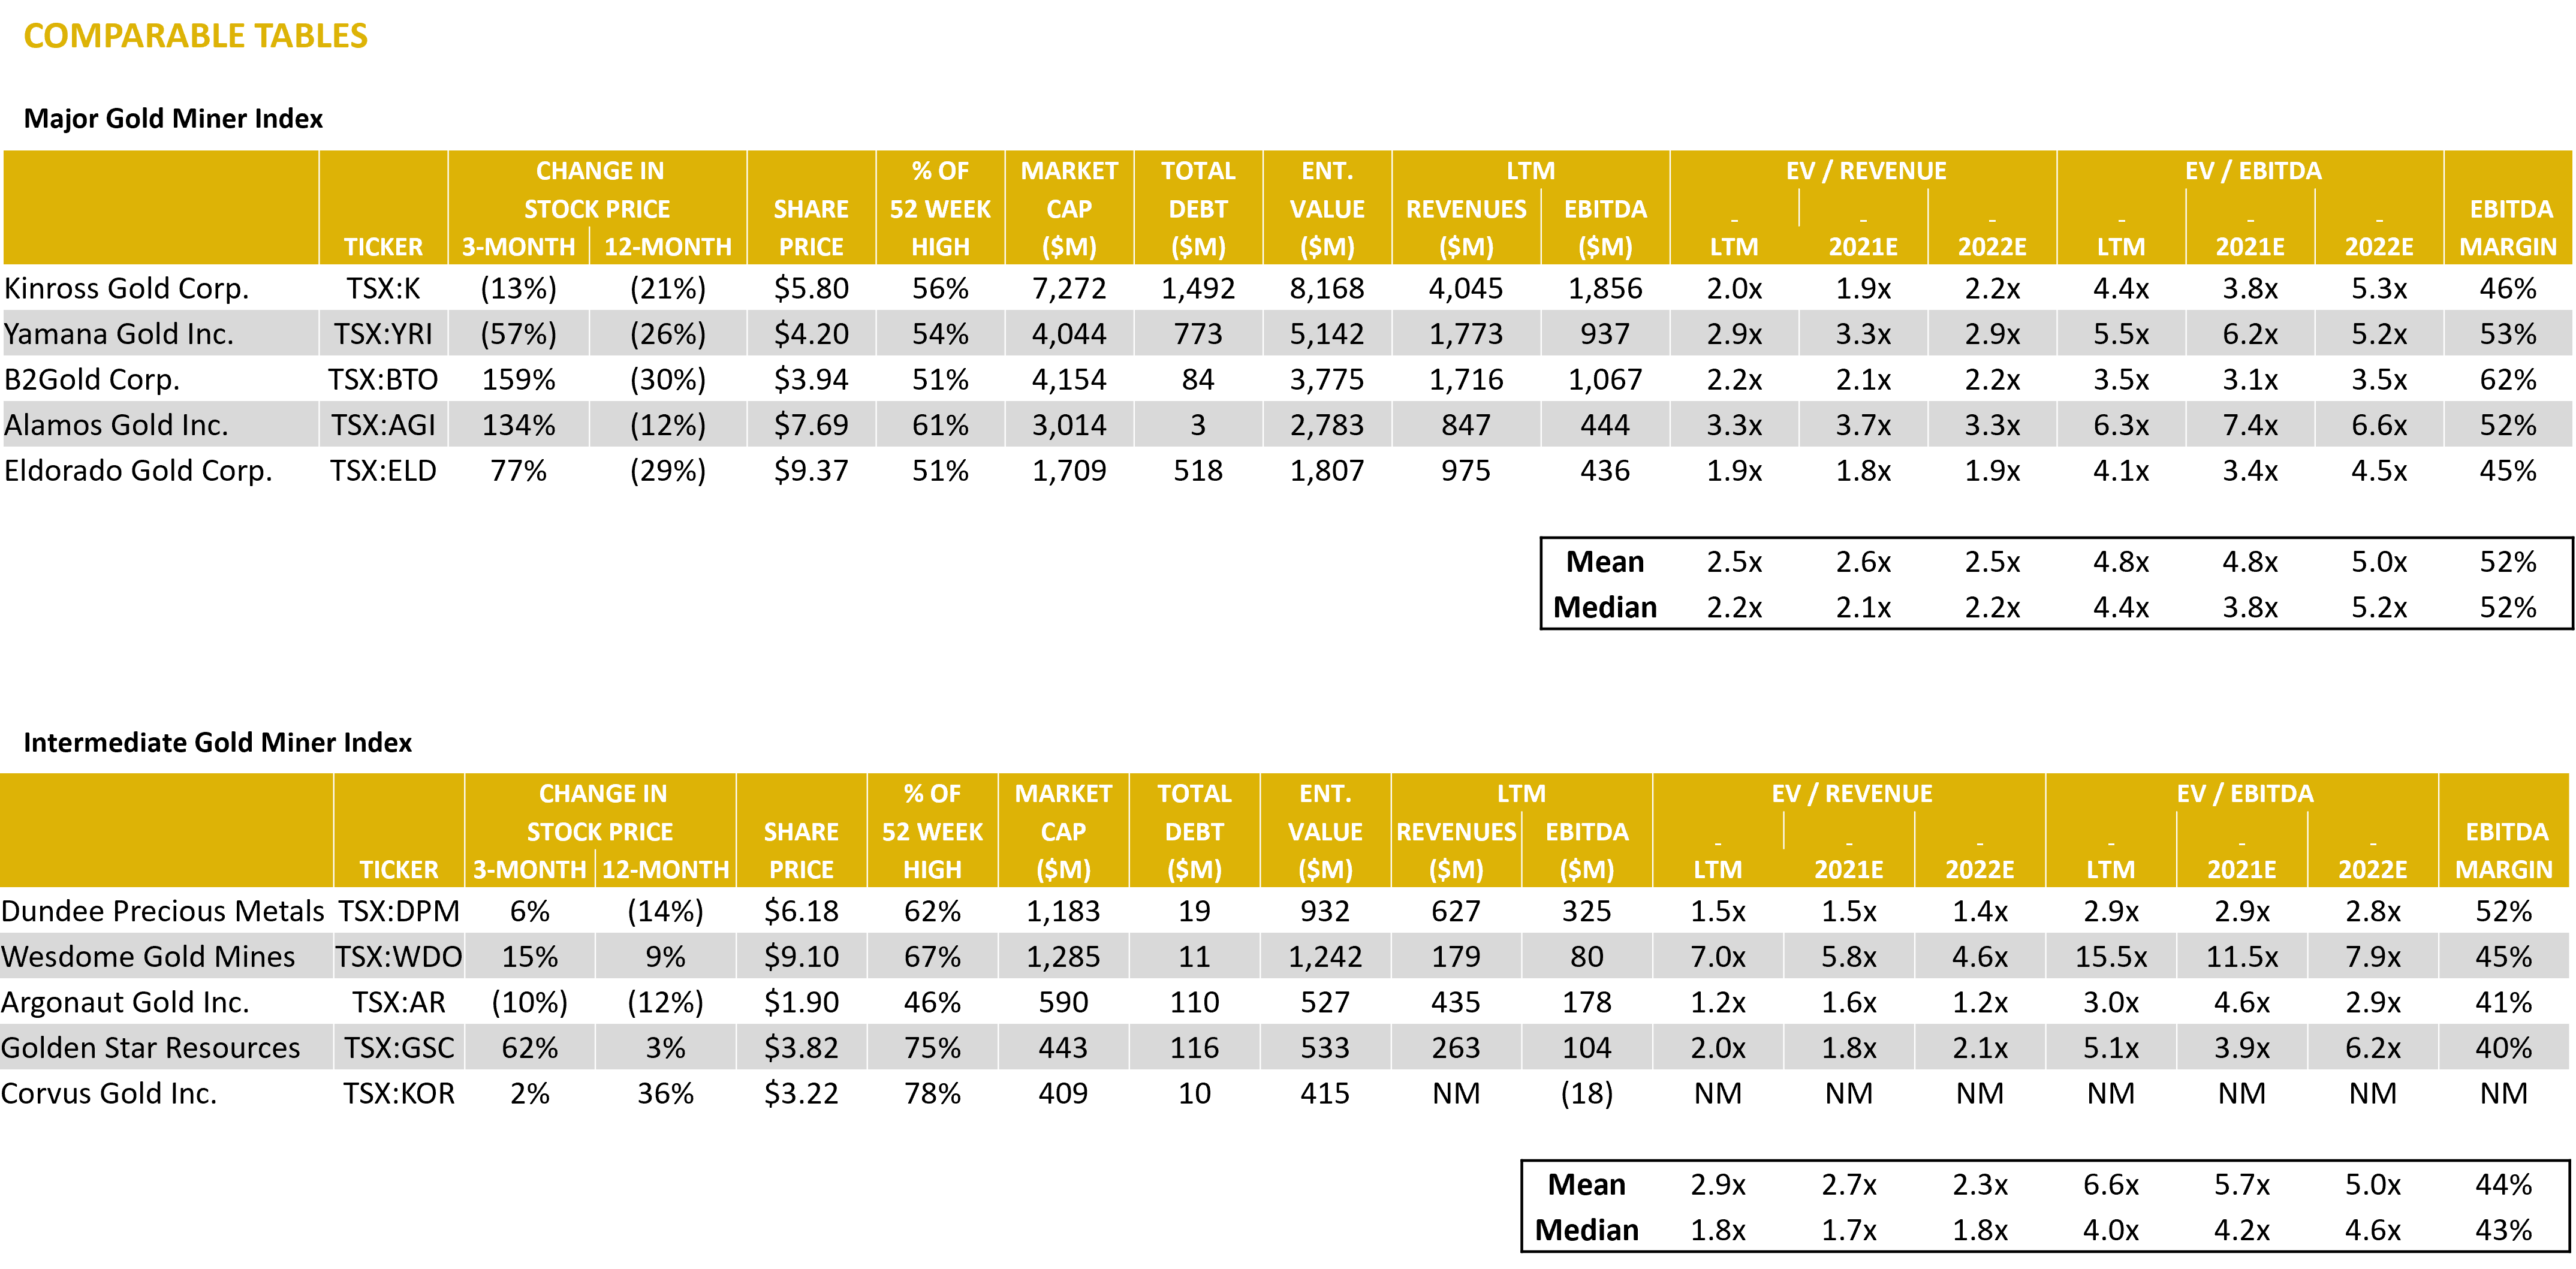
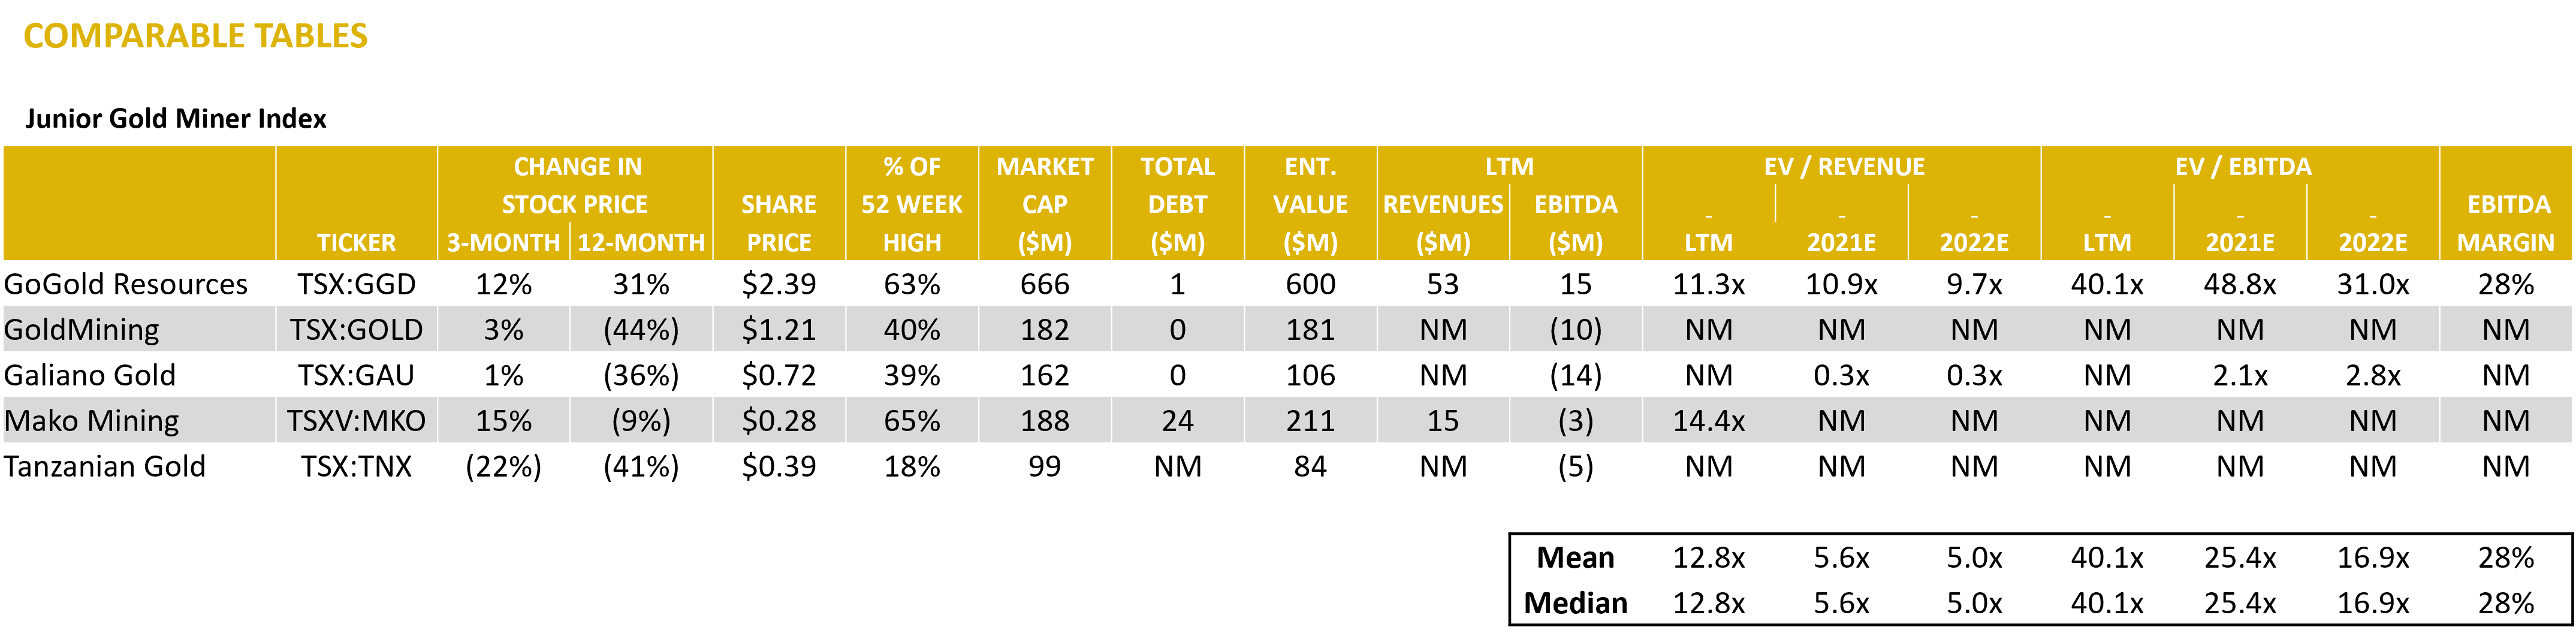
Gold Mining – Comparable Tables
Source: Capital IQ as of 12/31/2021
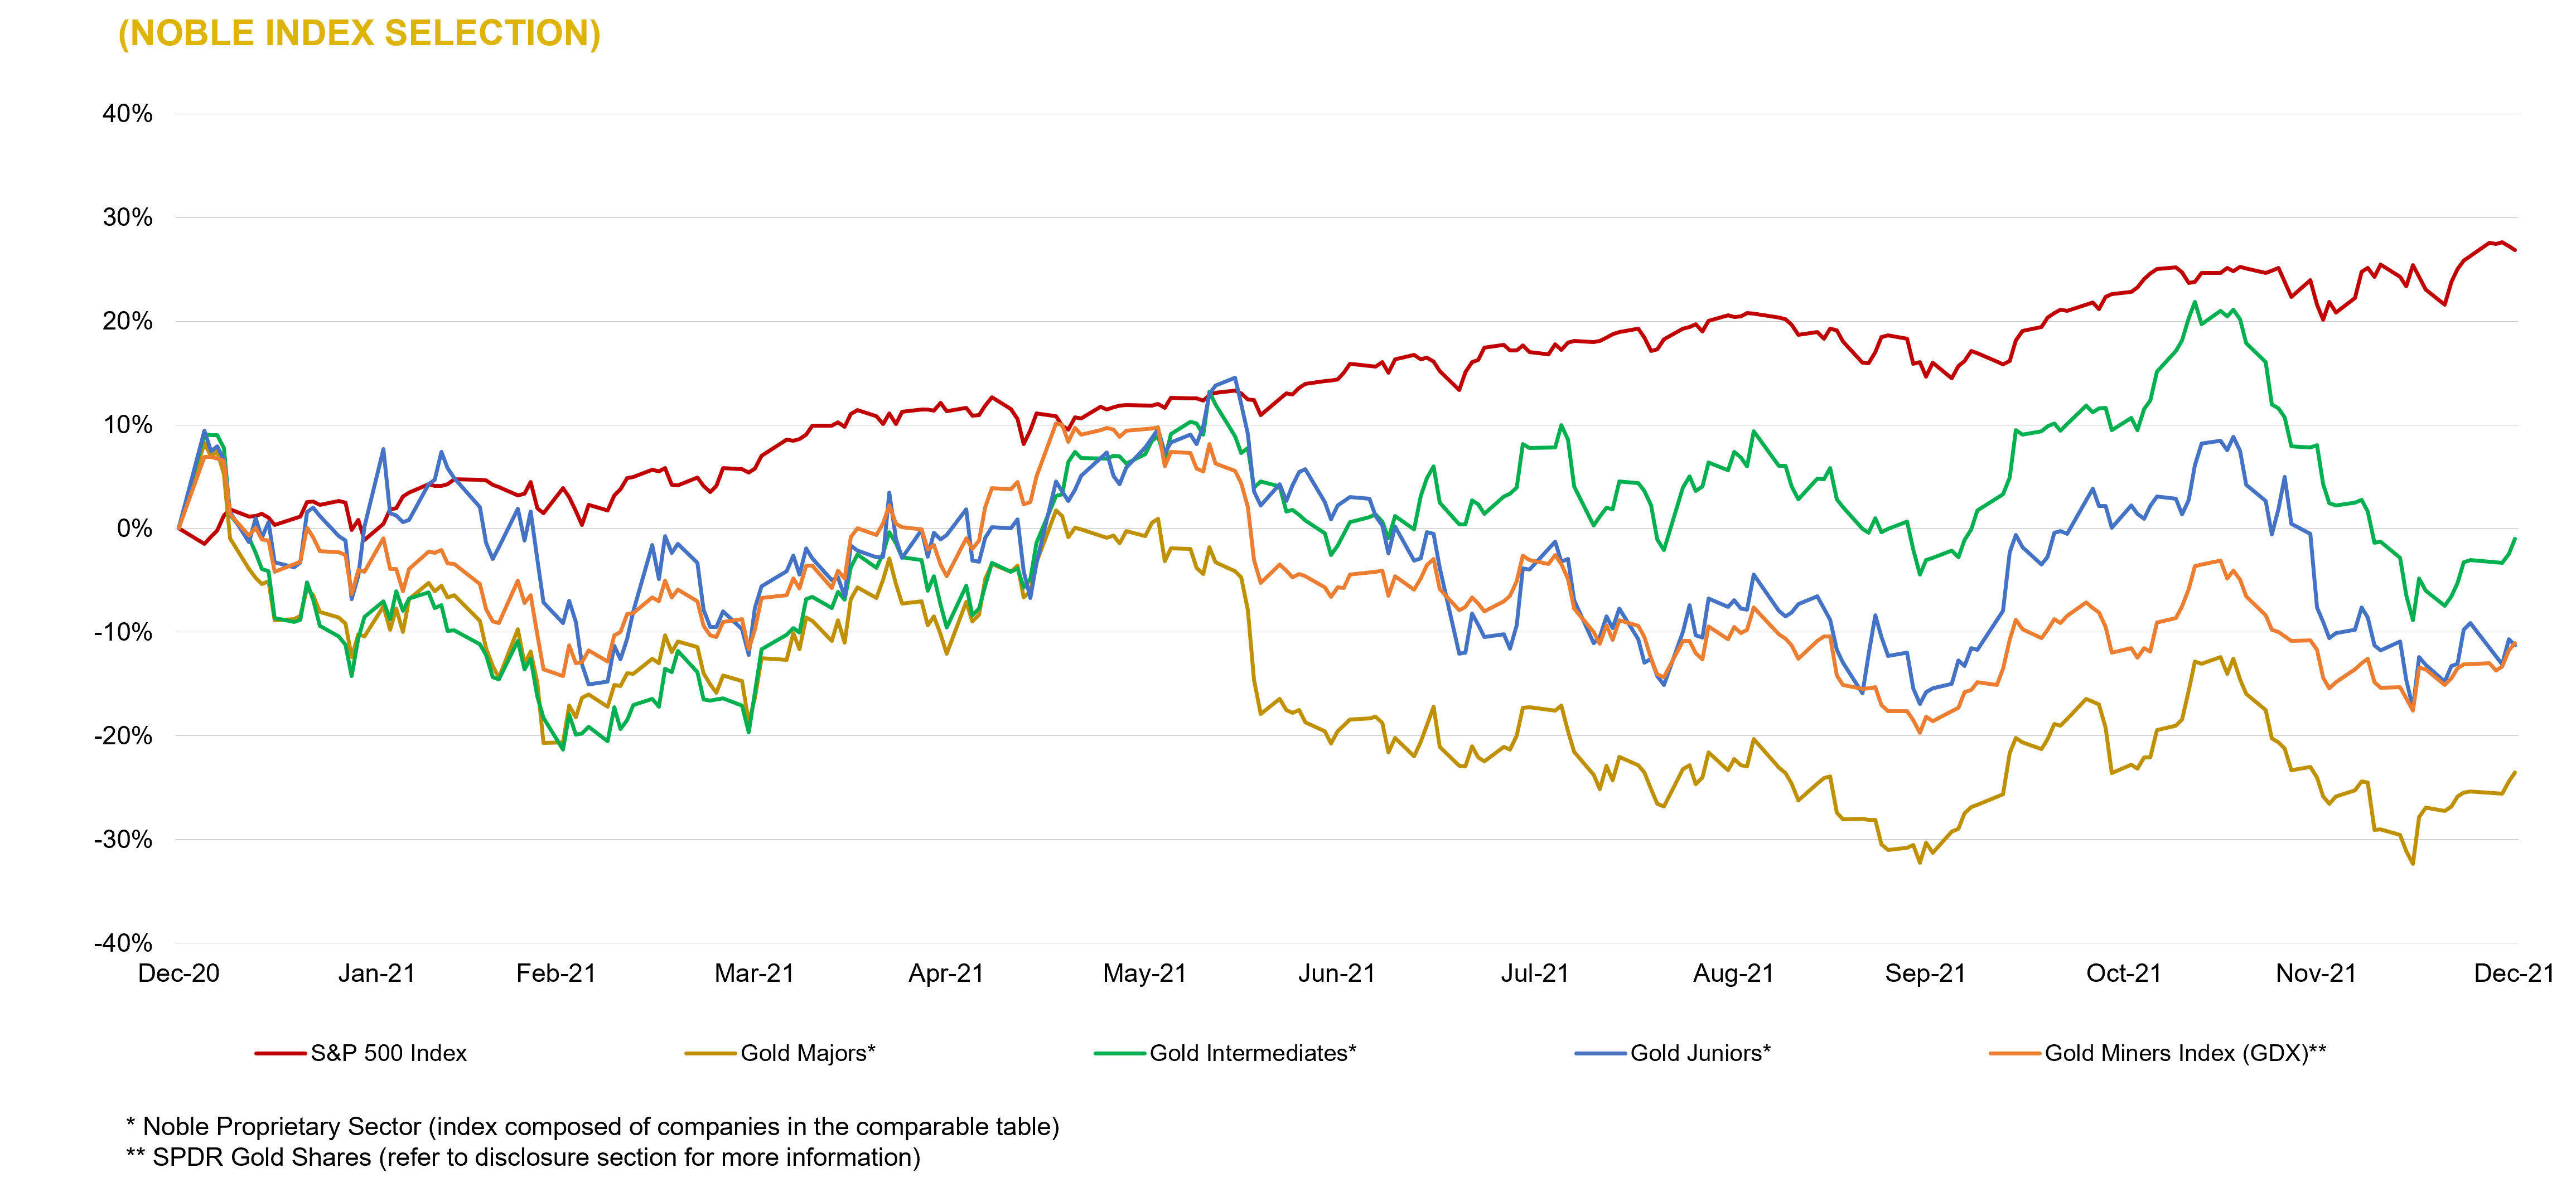
Gold Mining – LTM Equity Performance
Source: Capital IQ as of 12/31/2021
Silver Mining – Comparable Tables
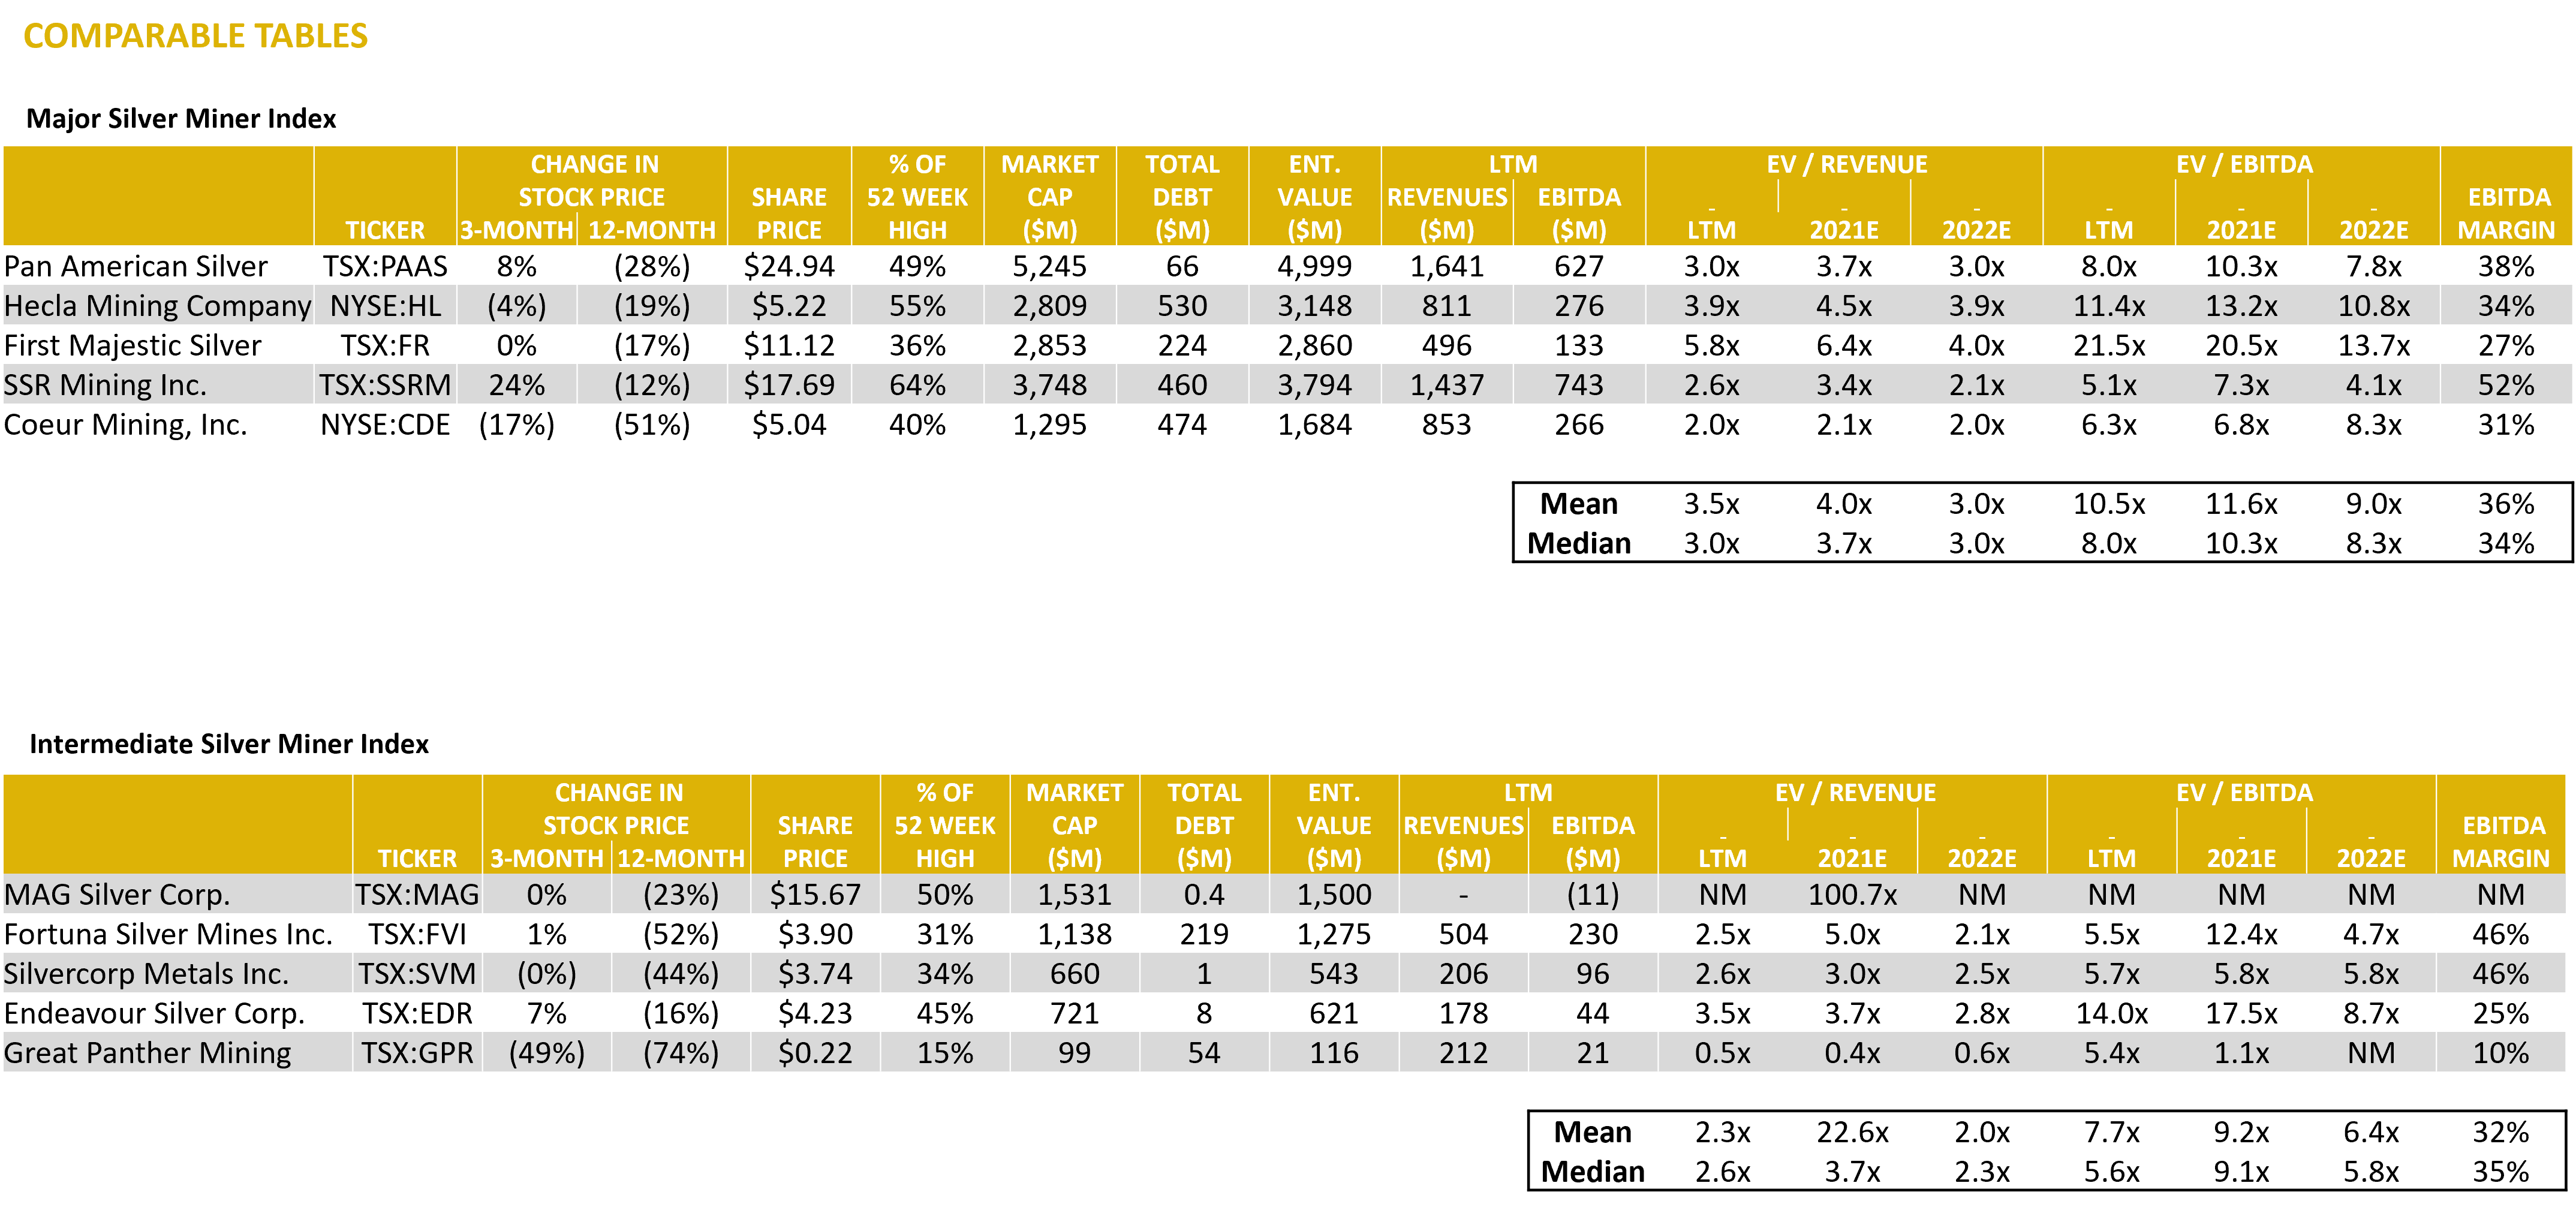
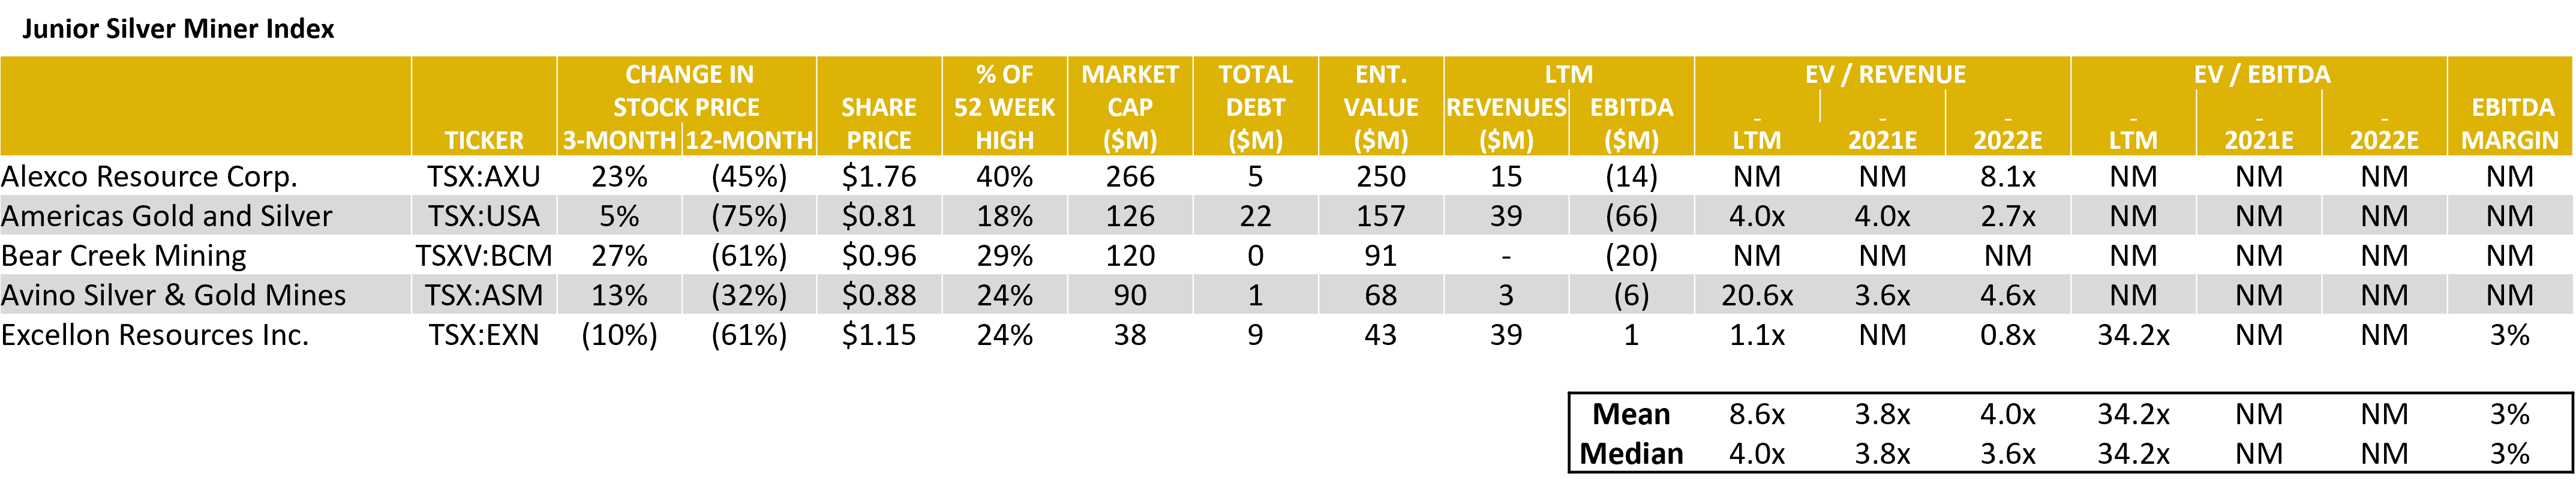
Source: Capital IQ as of 12/31/2021
Silver Mining – LTM Equity Performance
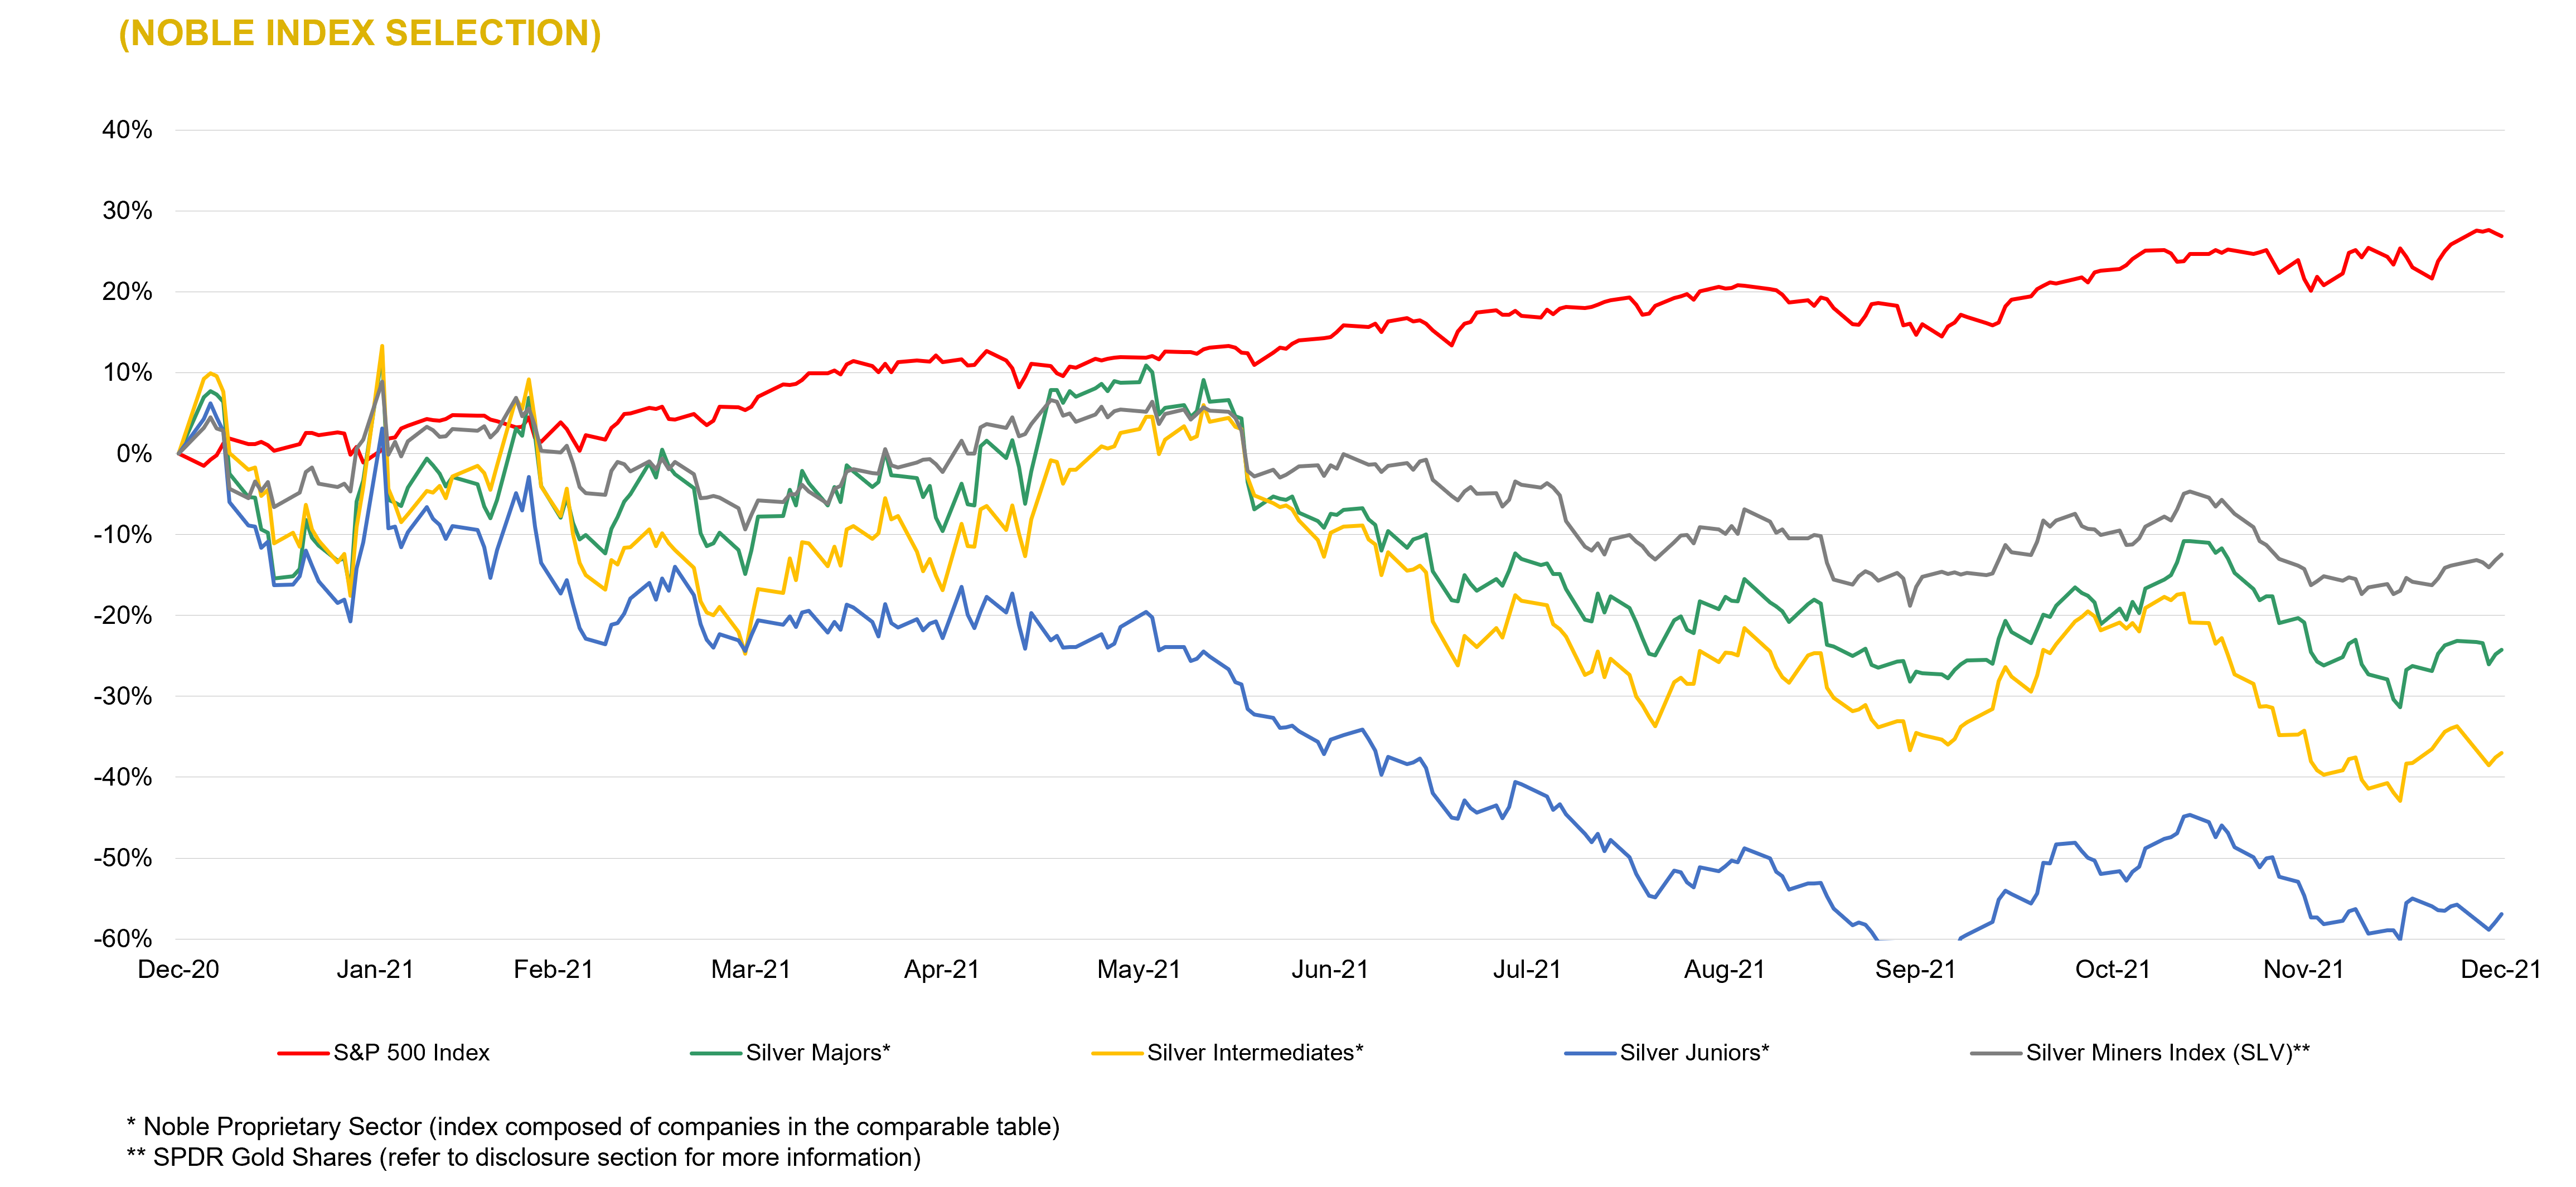
Source: Capital IQ as of 12/31/2021
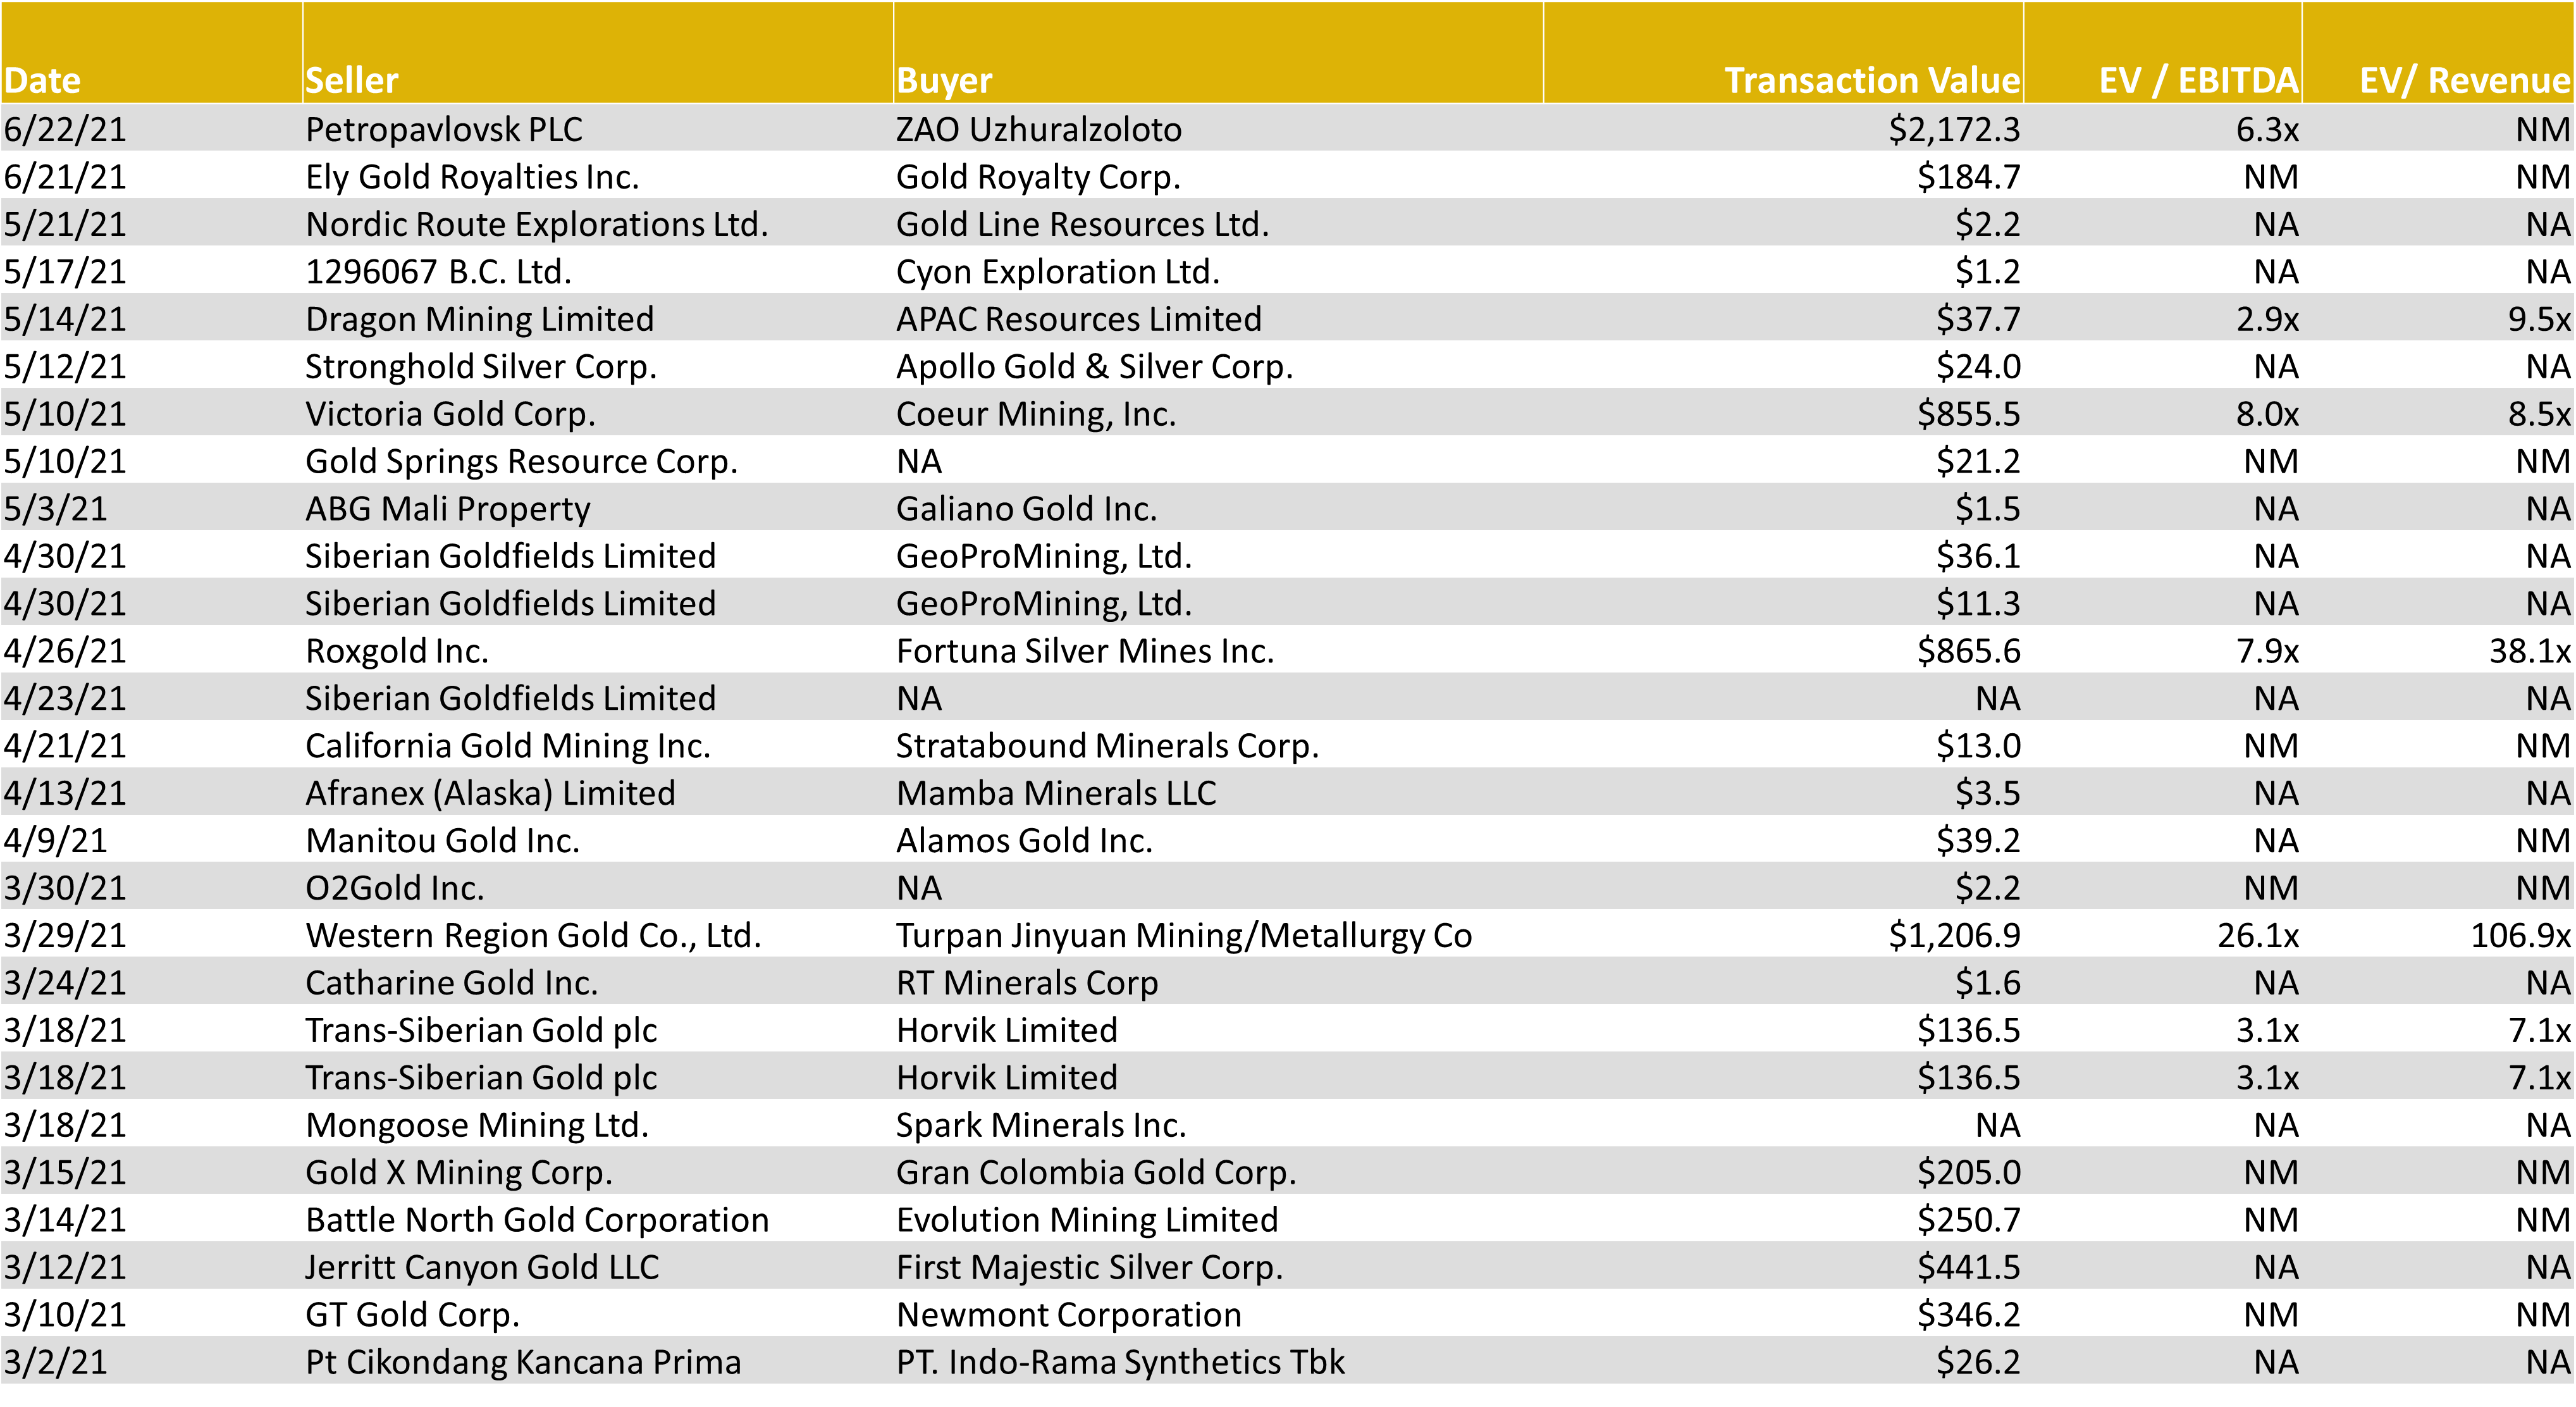
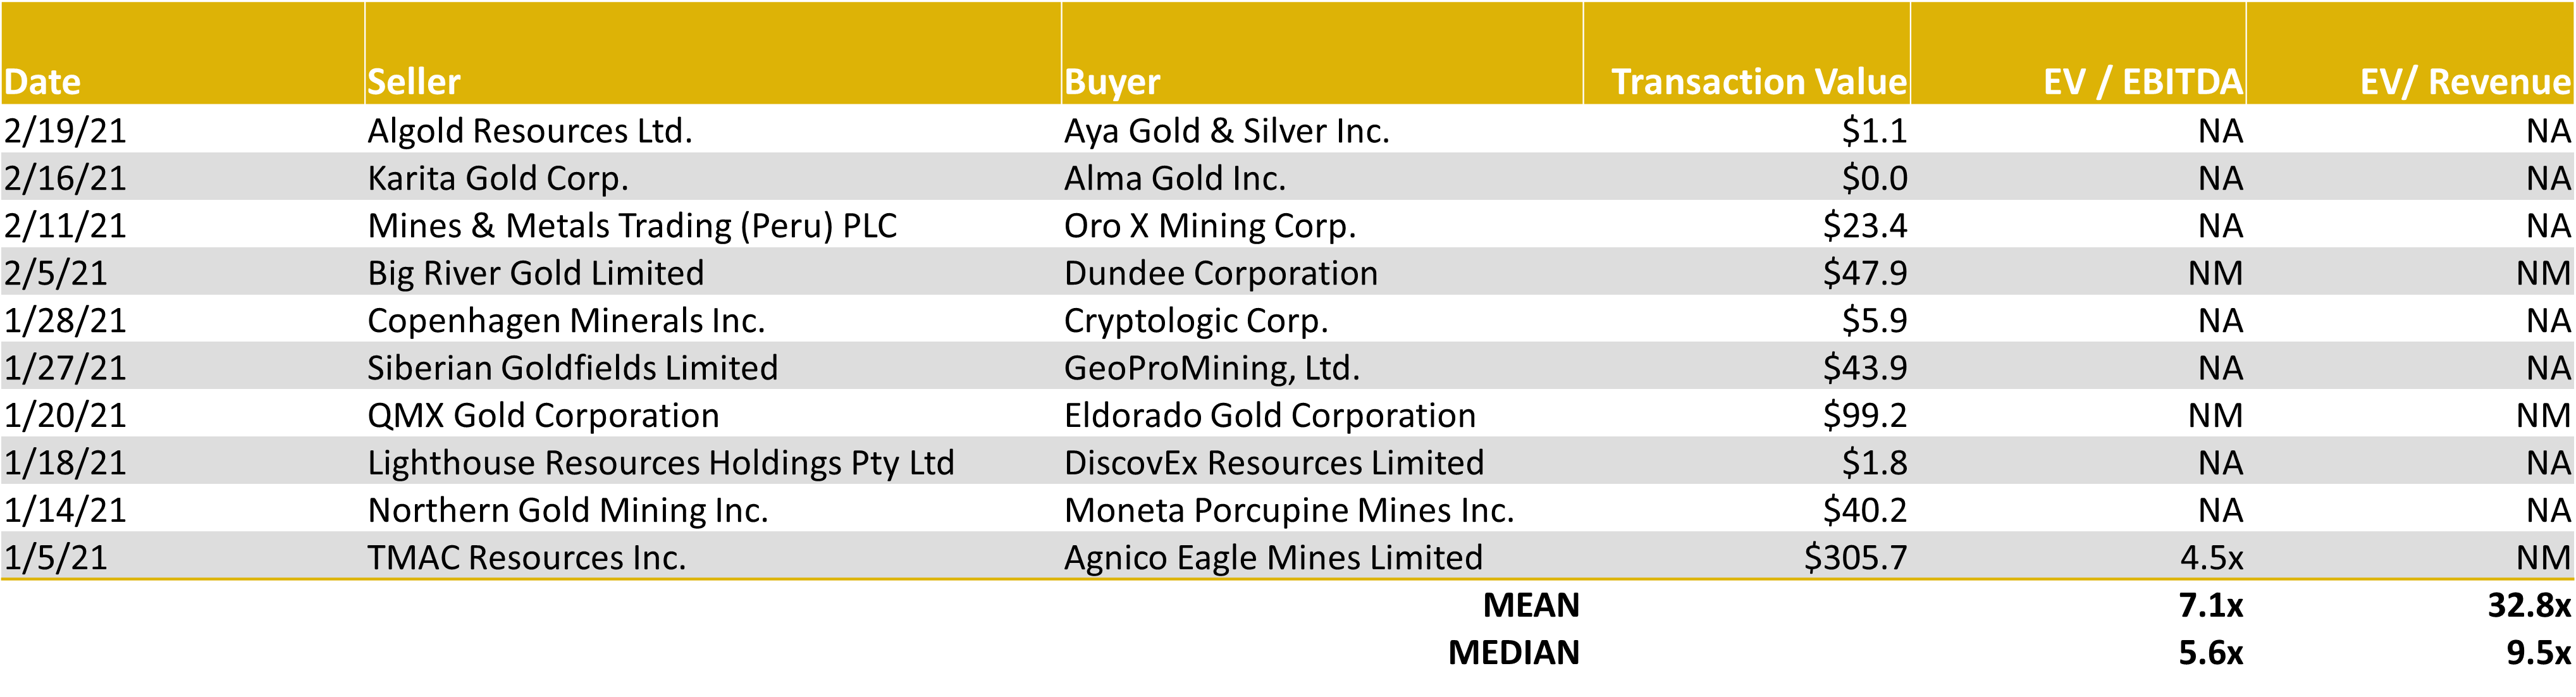
Gold & Silver – LTM Global M&A Activity
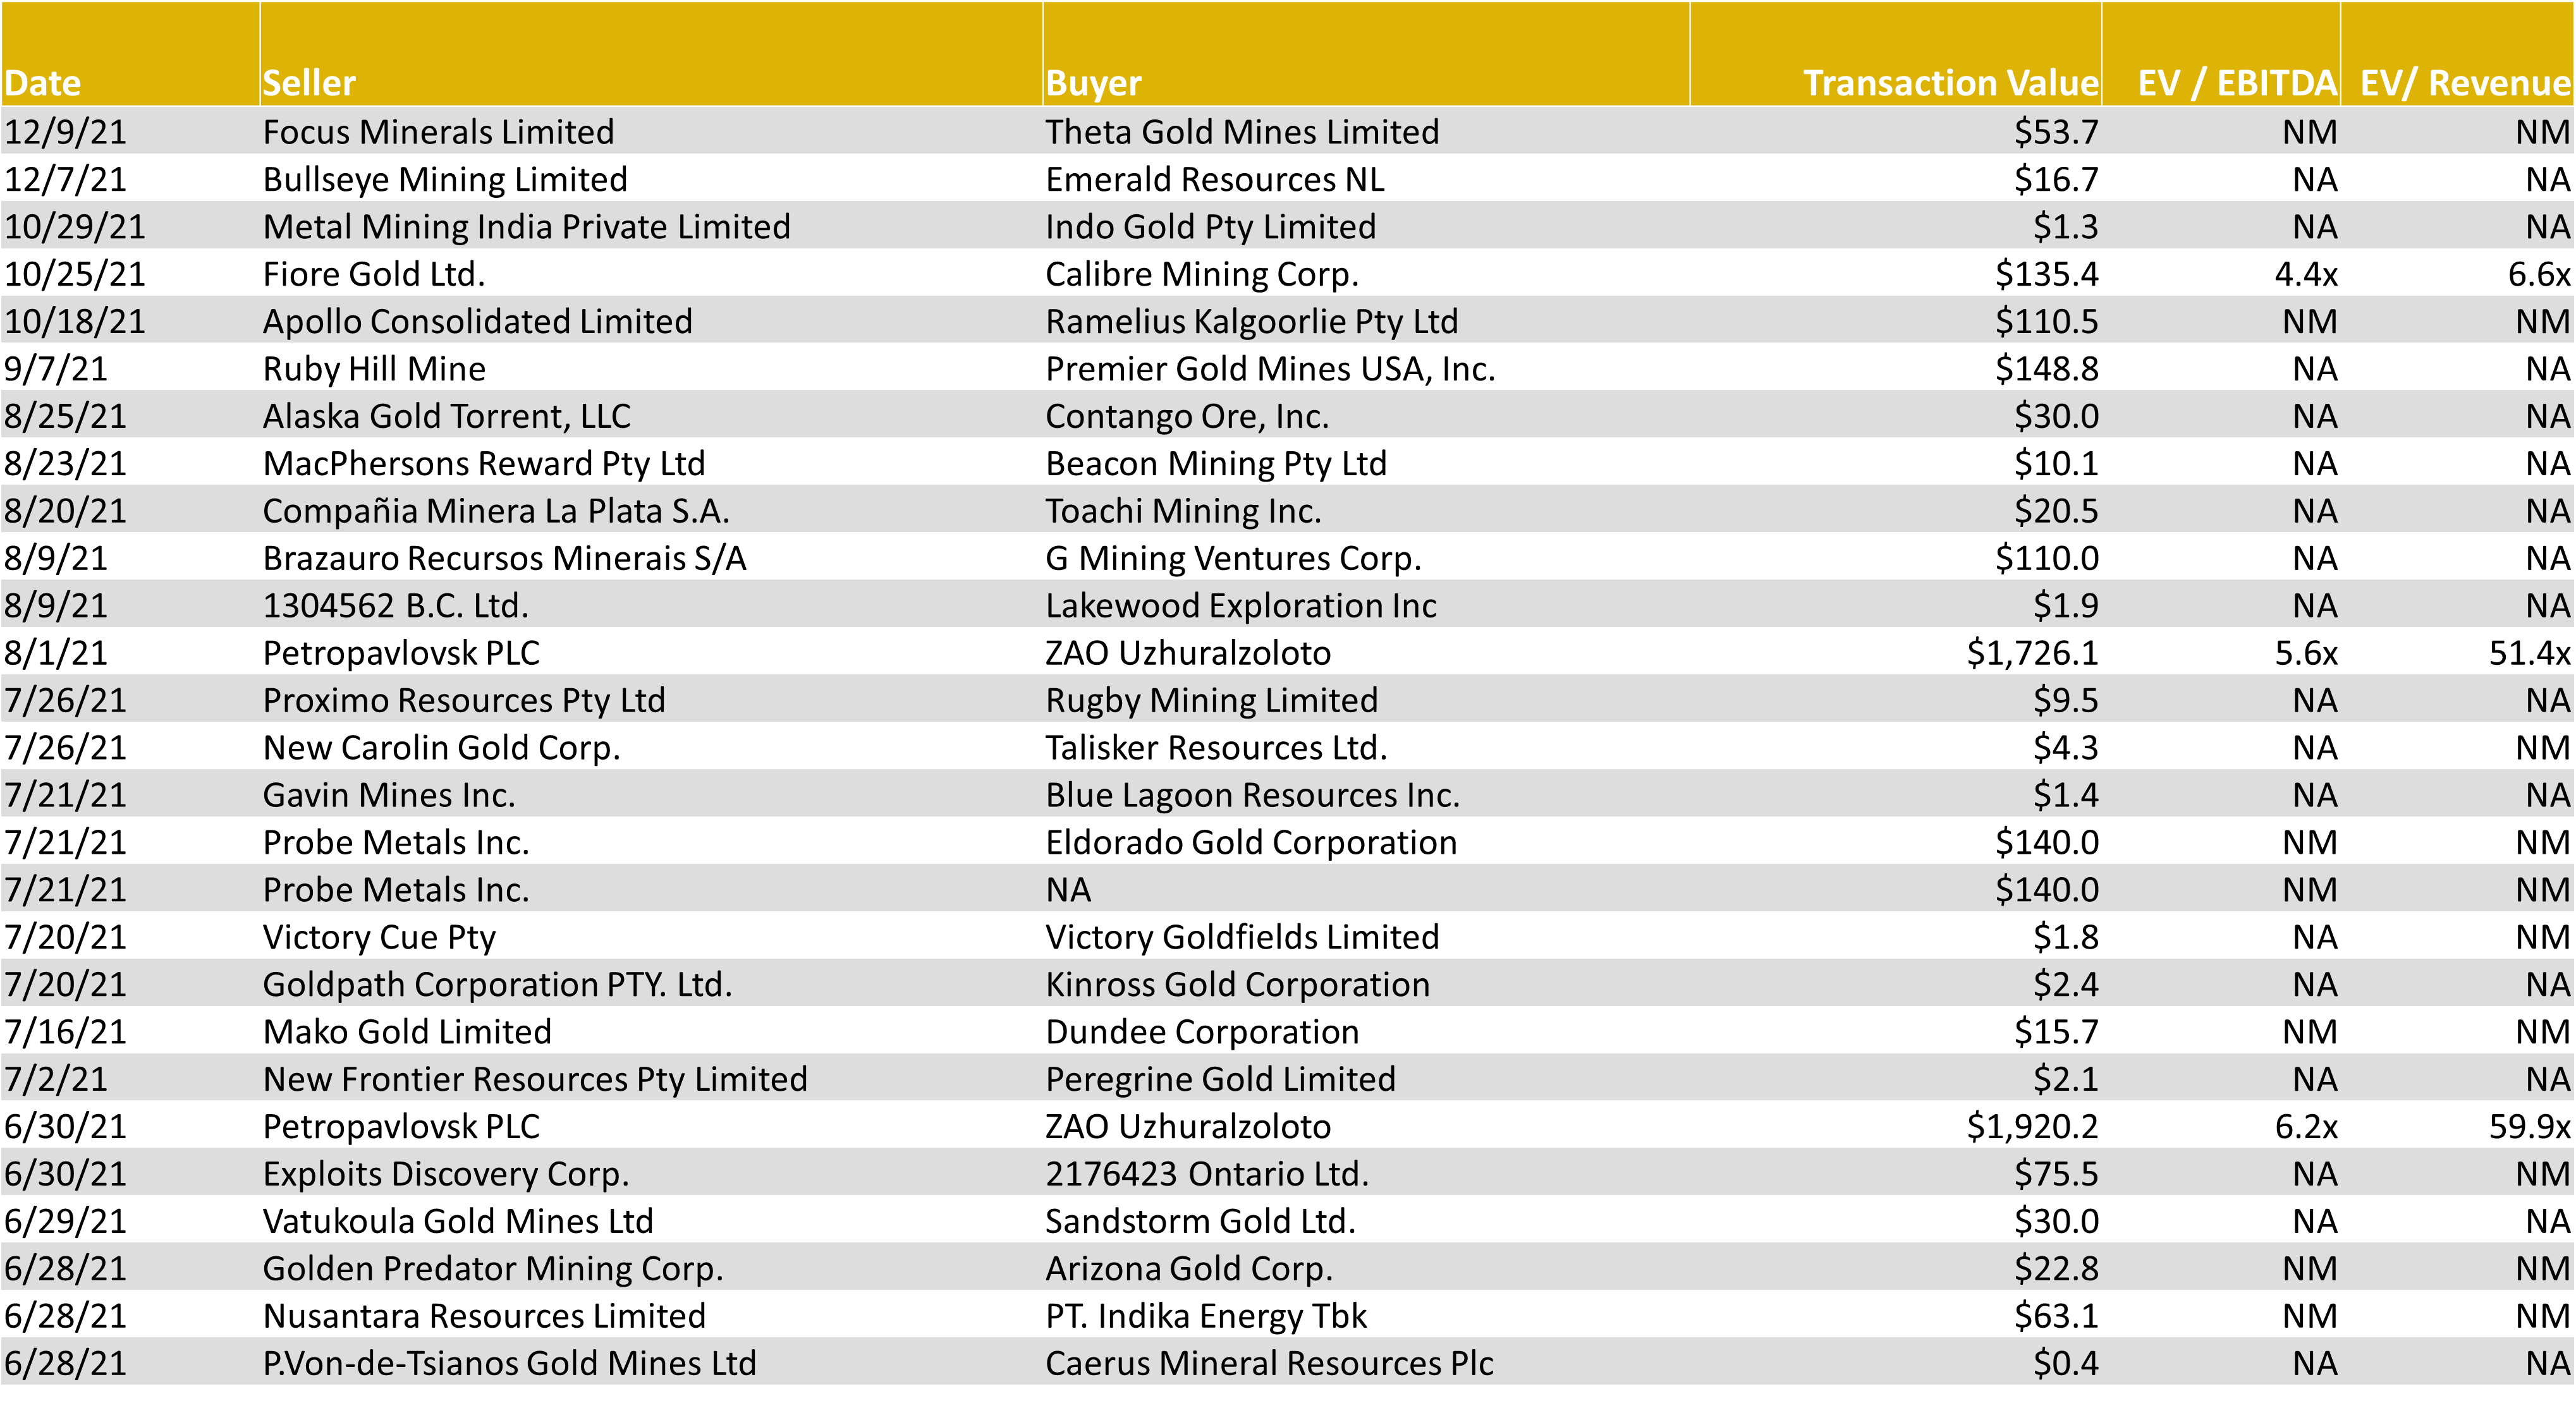
Source: Capital IQ as of 12/31/2021
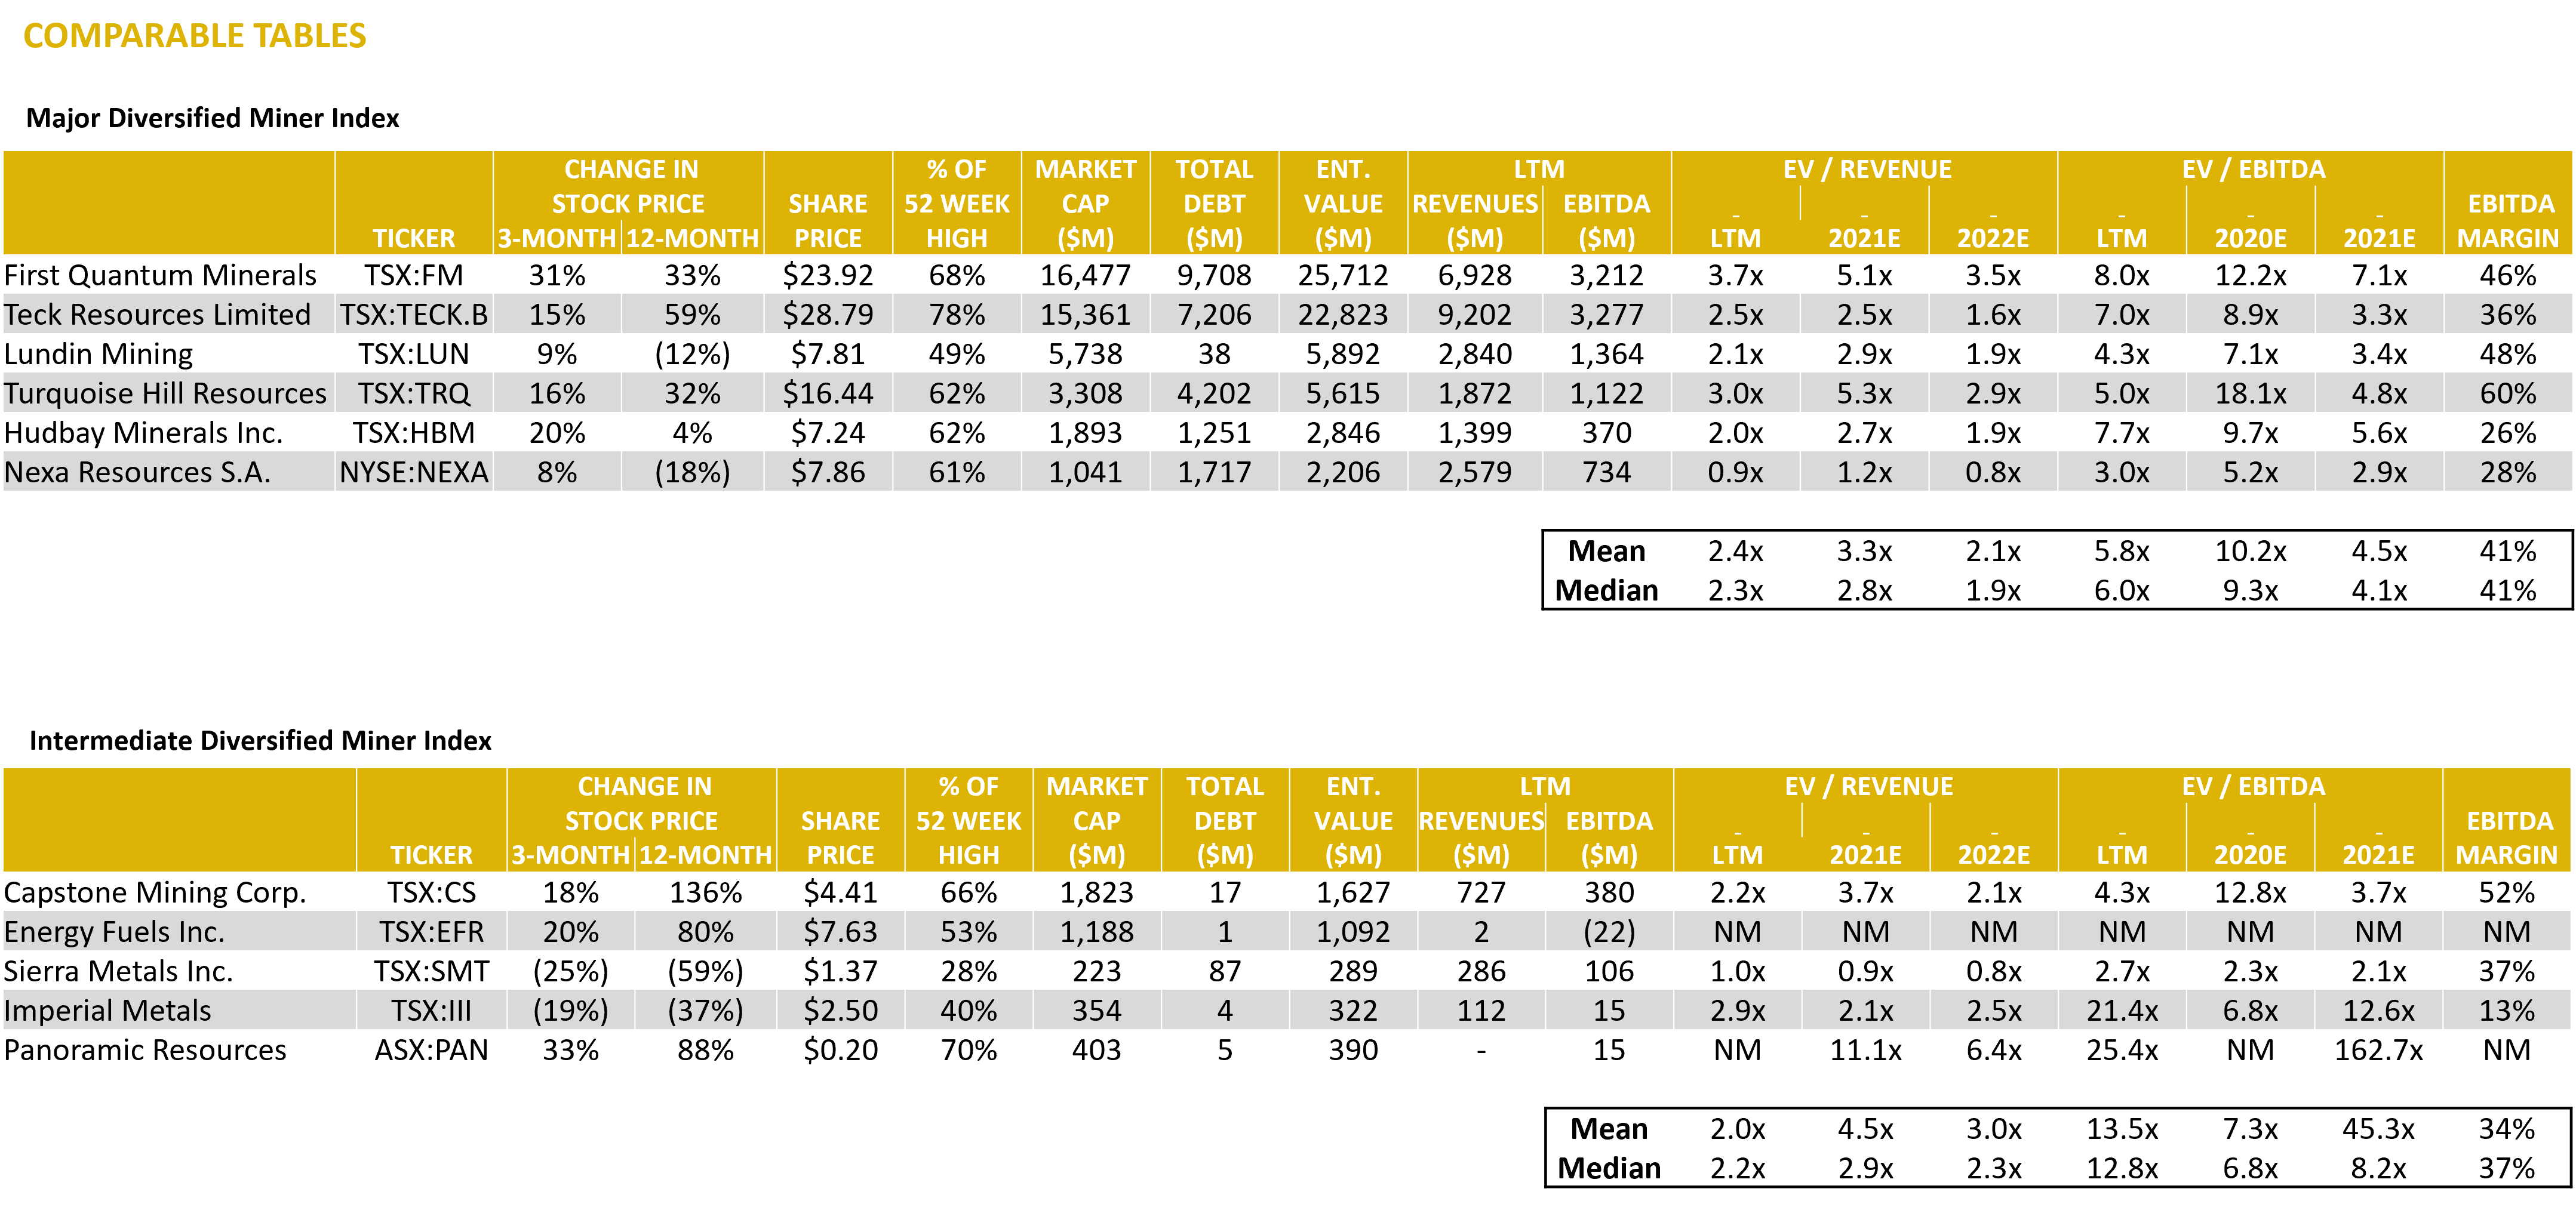
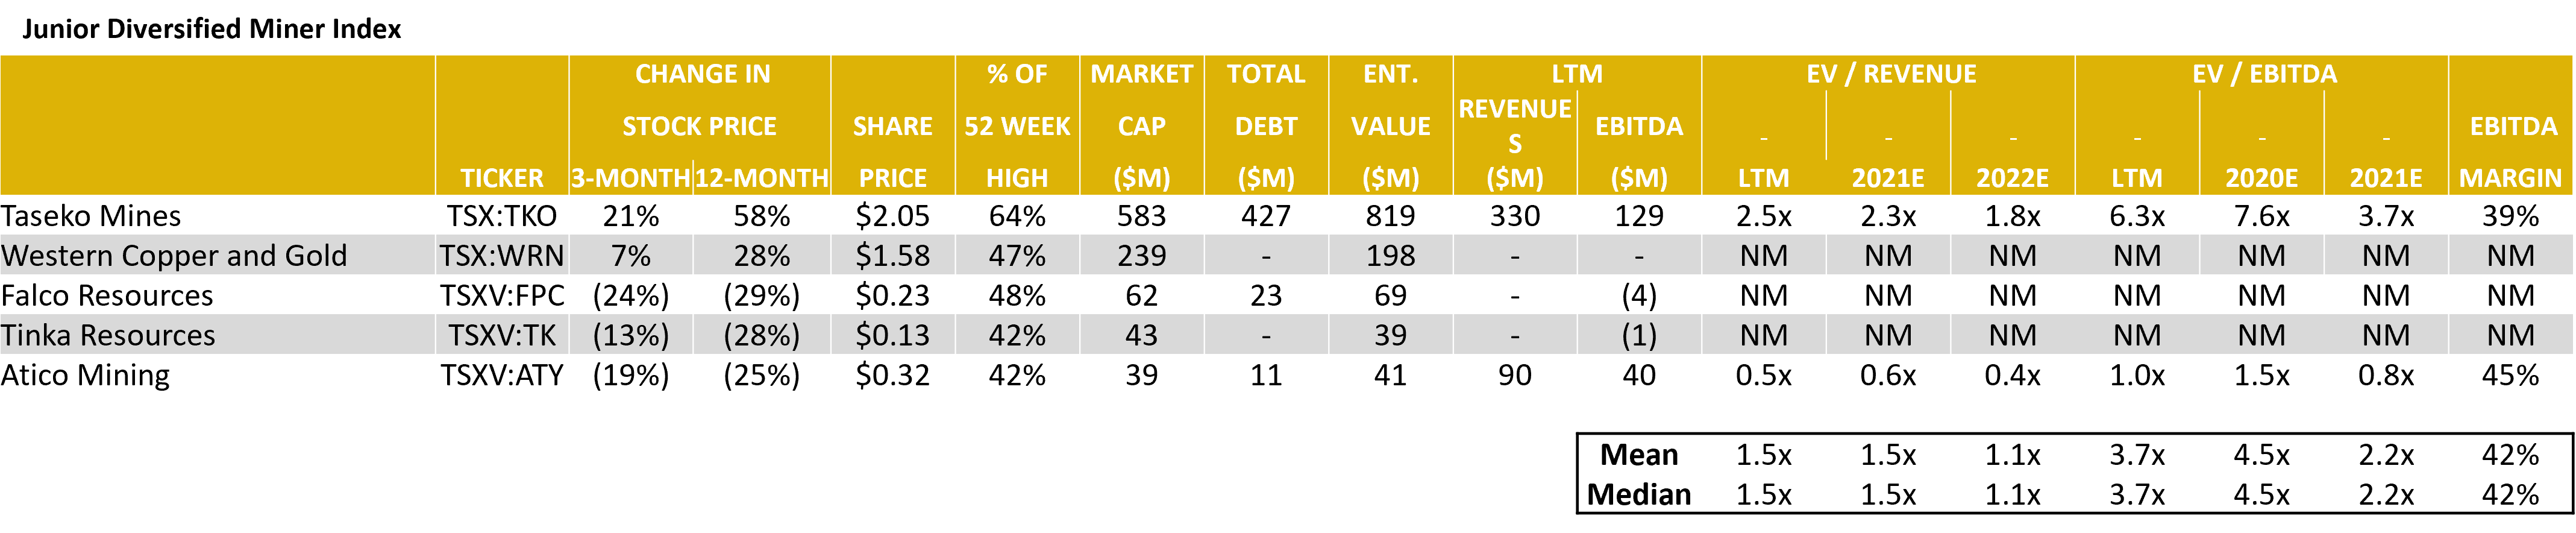
Diversified Mining – Comparable Tables
Source: Capital IQ as of 12/31/2021
Diversified Mining – LTM Equity Performance
Source: Capital IQ as of 12/31/2021
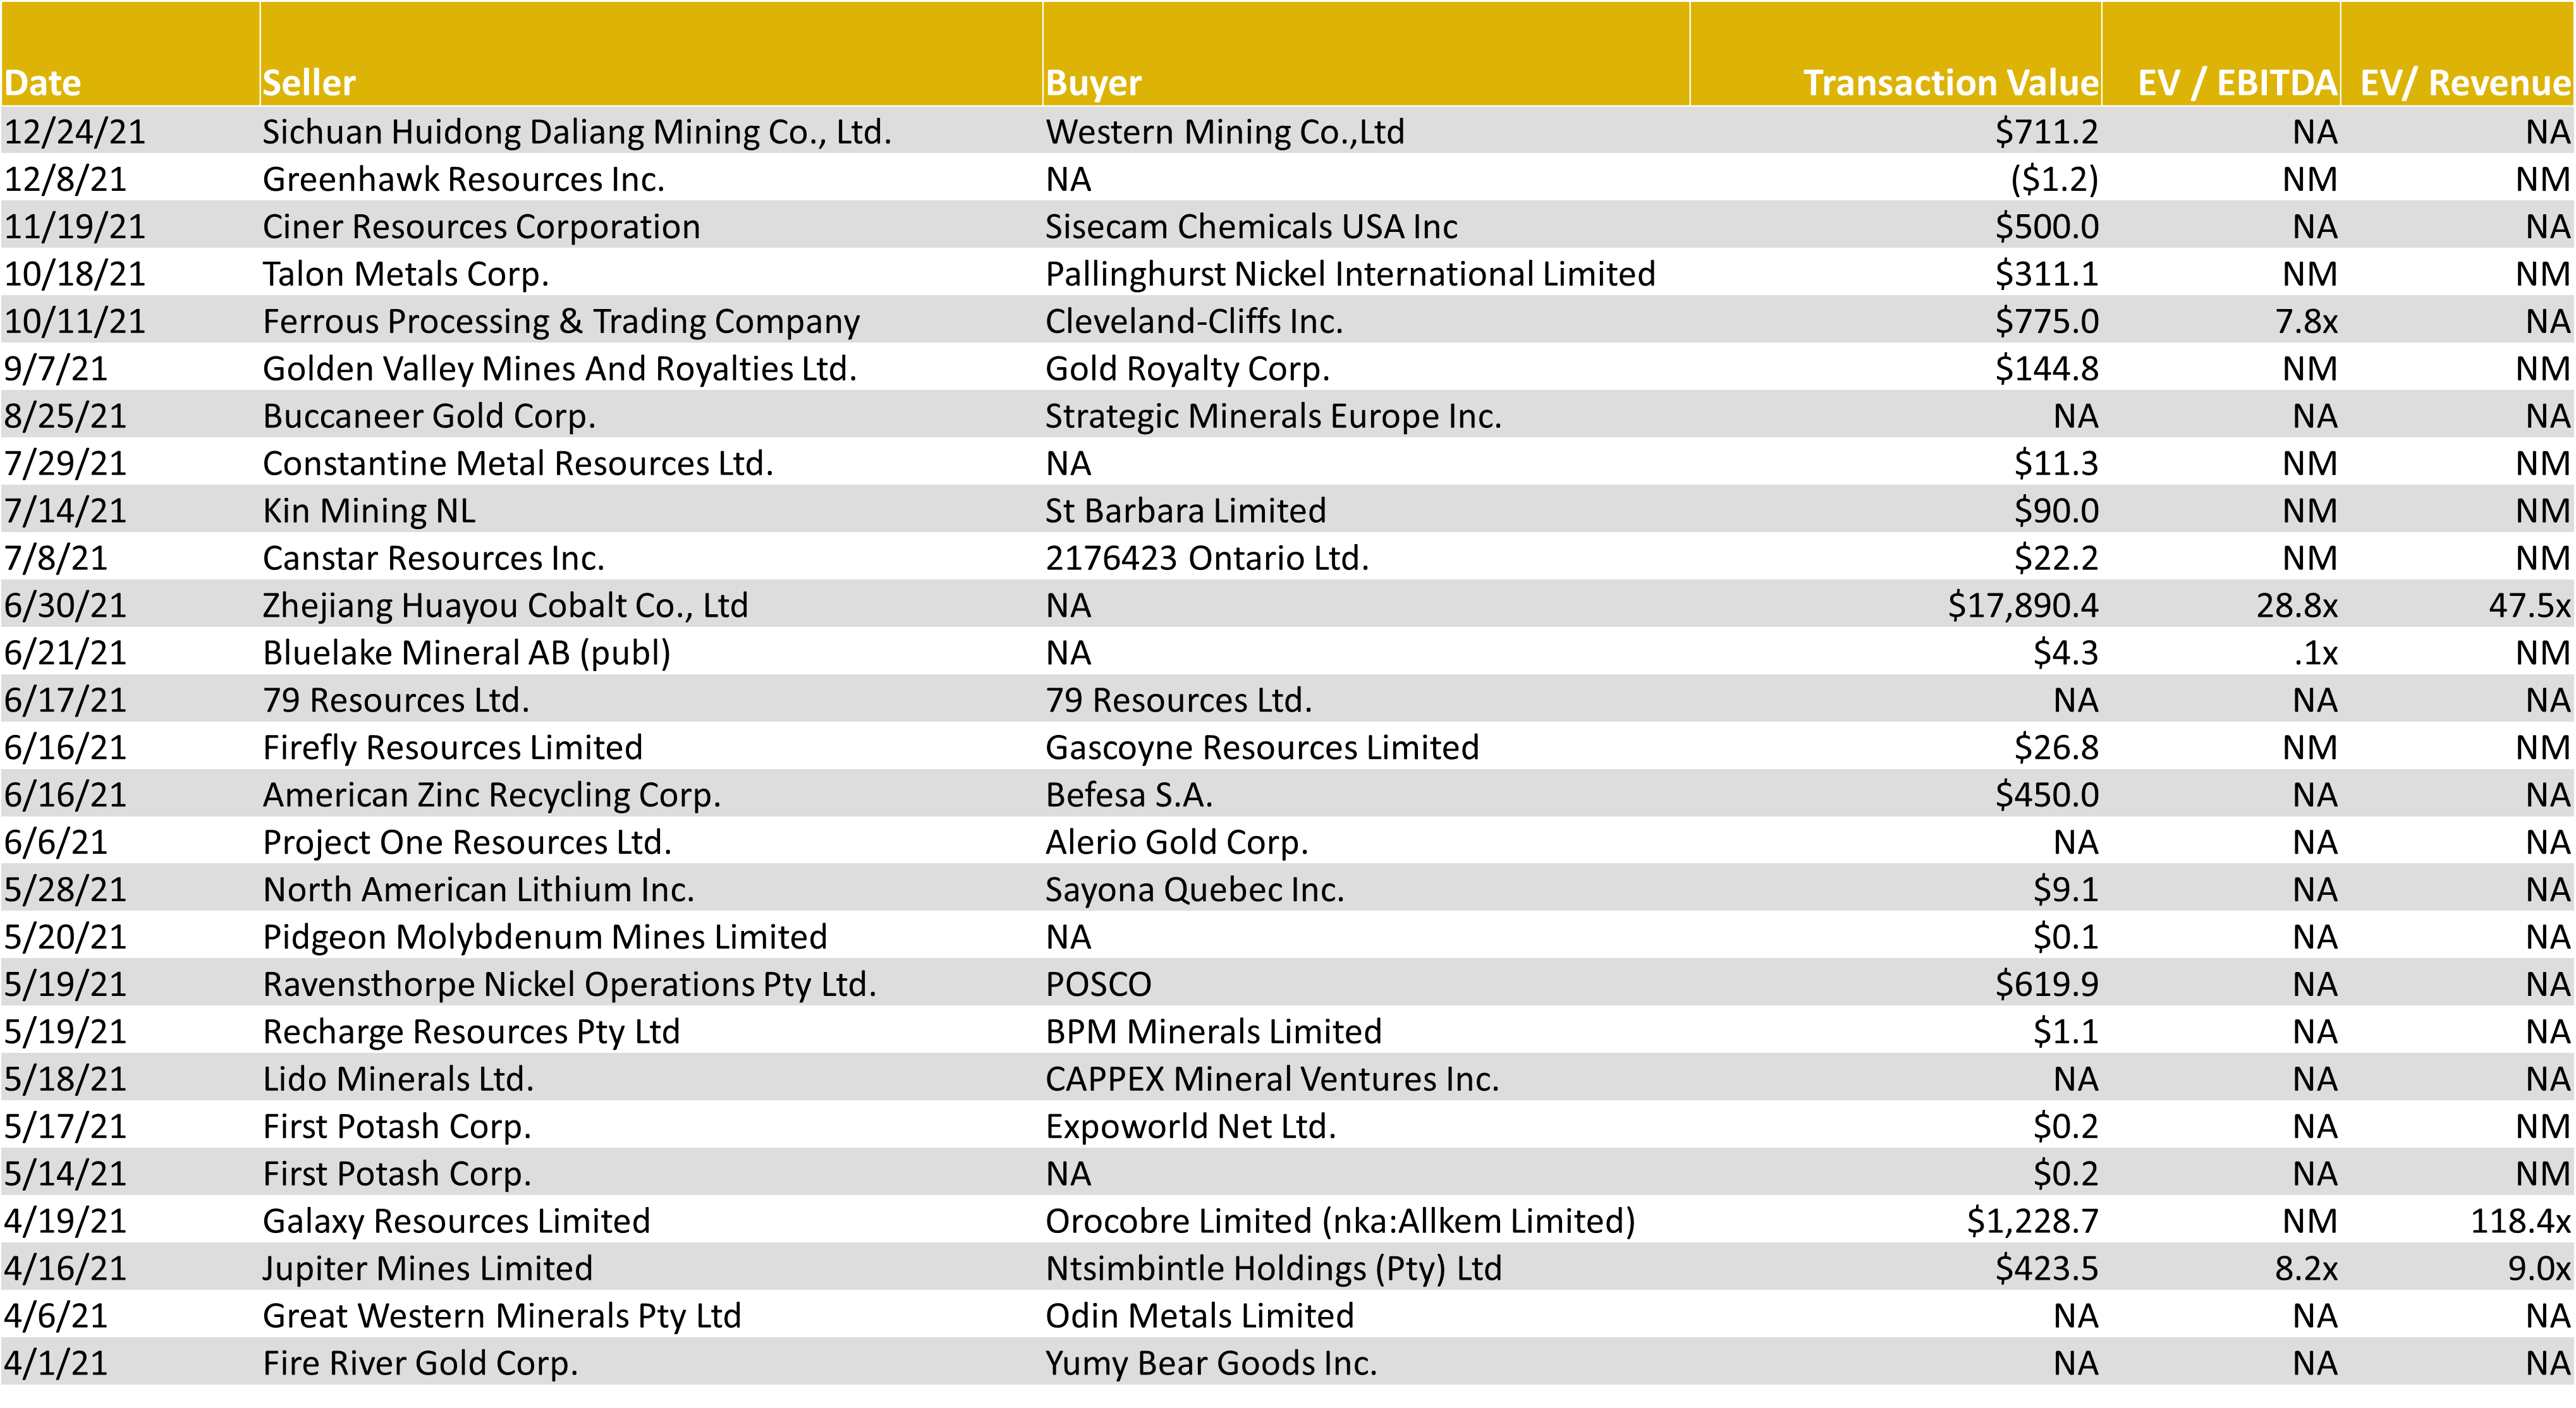
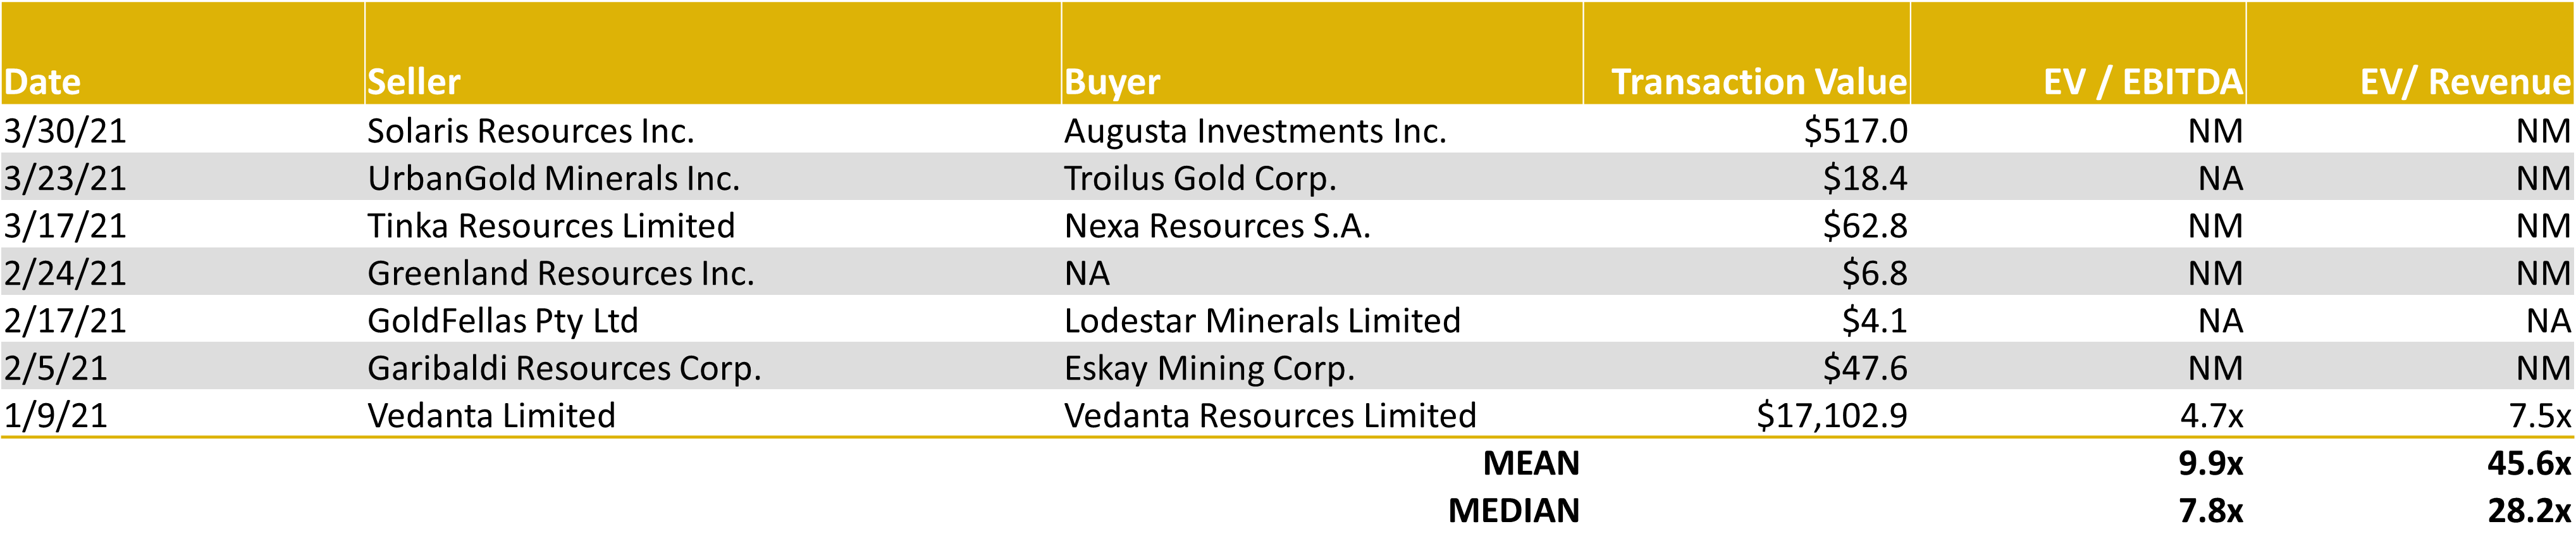
Diversified Mining – LTM Global M&A Activity
Source: Capital IQ as of 12/31/2021
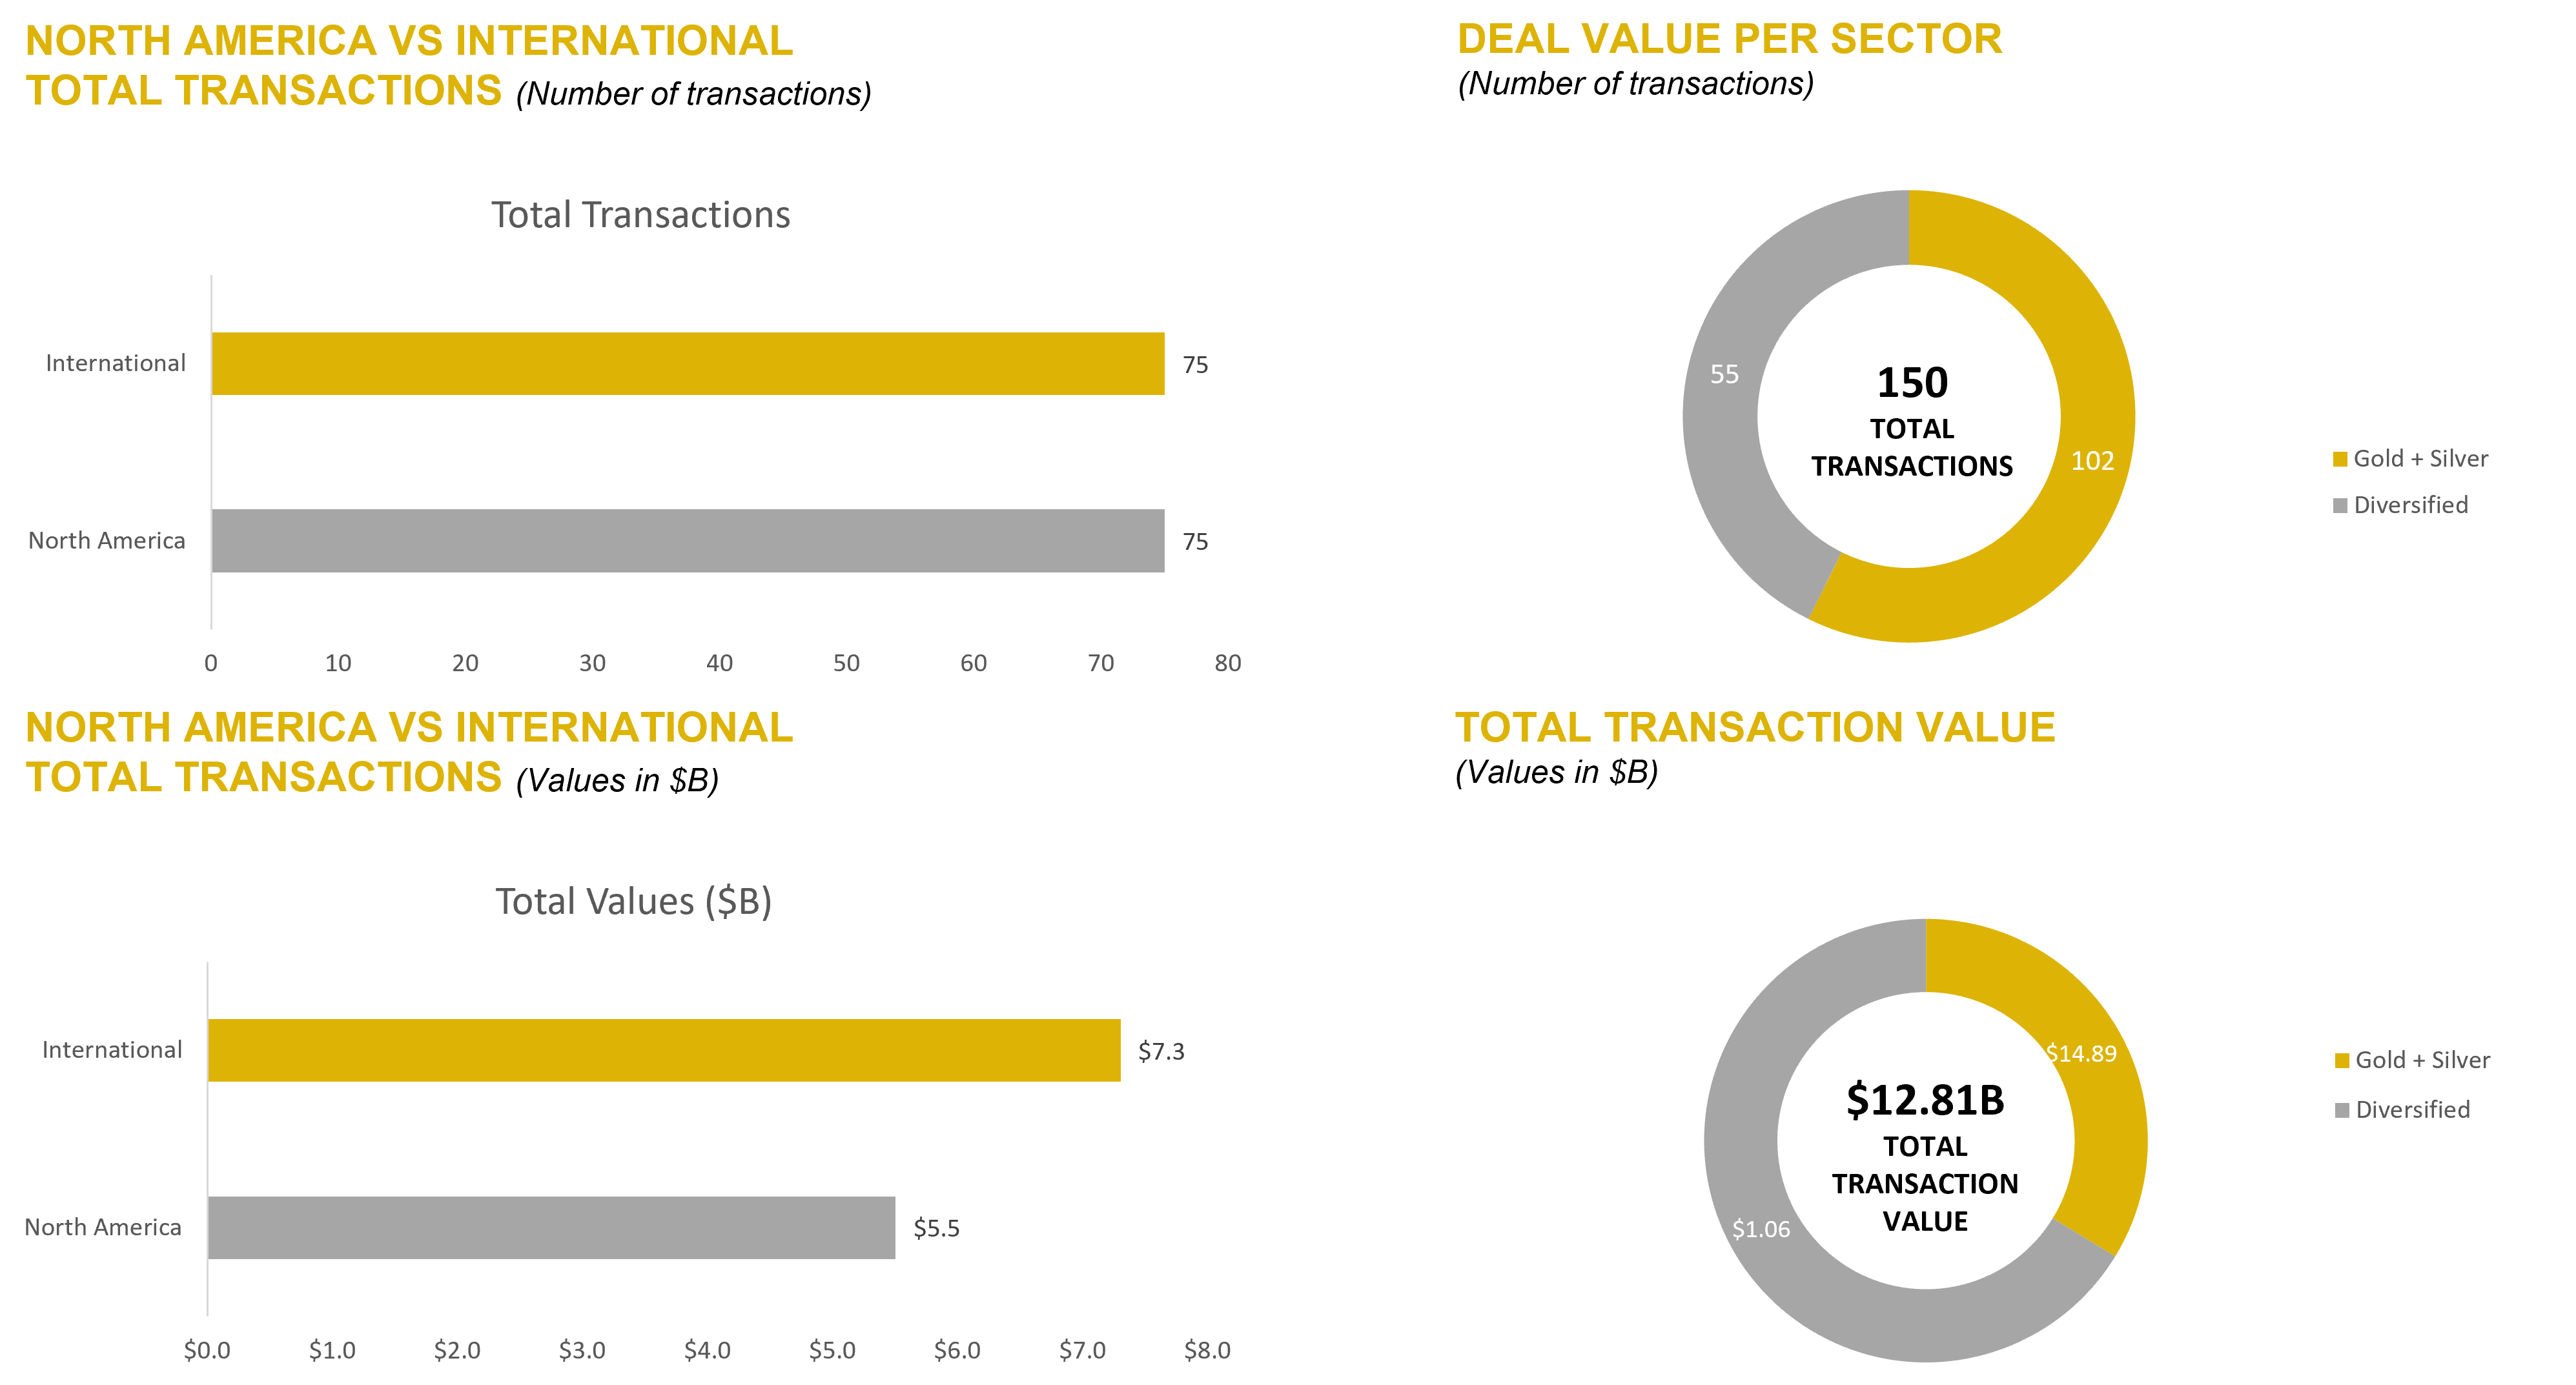
LTM Mining Industry M&A Summary
Source: Capital IQ as of 12/31/2021
NOBLE QUARTERLY HIGHLIGHTS
Brazil Minerals Inc. (OTCPK:BMIX)
Industry: Metals and Mining – Precious gems; Gold
Brazil Minerals, Inc. (OTCQB: BMIX) is a lithium company with projects in other highly strategic minerals such as rare earths, titanium, nickel and cobalt. In addition, Brazil Minerals owns stakes in both Apollo Resources Corporation, a private company developing its first iron mine, and Jupiter Gold Corporation, a publicy-traded company developing a quartzite mine and advancing two large gold projects.
4th Quarter News Highlight:
December 8, 2021: Brazil Minerals announced the addition of a new board member with substantial capital markets expertise. Stephen Petersen, new independent director of the company, has over 40 years of experience in the capital markets and investment management. Since 2013, he has been a Managing Director and member of the Investment Committee at Prio Wealth, an independent investment management firm with over $3 billion in assets under management. Previously, Mr. Petersen served as Senior Vice President, Investments at Fidelity Investments for approximately 32 years.
Summa Silver Corp. (TSXV:SSVR)
Industry: Metals and Mining – Precious metals; Silver
Summa Silver Corp is a Canadian junior mineral exploration company. The Company owns a 100% interest in the Hughes property located in central Nevada and has an option to earn 100% interest in the Mogollon property located in southwestern New Mexico. The Hughes property is host to the high-grade past-producing Belmont Mine, one of the most prolific silver producers in the United States between 1903 and 1929. The mine has remained inactive since commercial production ceased in 1929 due to heavily depressed metal prices and little to no modern exploration work has ever been completed.
4th Quarter News Highlight:
December 14, 2021: The Company announced the intersection of 50-meter vein zone with visible mineralization in first hole at Mogollon, New Mexico. Drilling is still in progress at the property and Summa Silver expects a minimum of 15,000m additional drilling. Galen McNamara, CEO, stated: “Although we don’t expect the entire intersection to carry grade, the wide zone of classic low-sulfidation veining in our first hole attests to the prospectivity of the Queen Vein and the significance of the mineralizing system in general.”
Chakana Copper Corp. (OTCQB:CHKKF)
Industry: Metals and Mining – Diversified metals and mining
Chakana Copper Corp is a Canadian-based minerals exploration company that is currently advancing the Soledad Project located in the Ancash region of Peru, a highly favorable mining jurisdiction with supportive communities. The Soledad Project is notable for the high-grade copper-gold-silver mineralization that is hosted in tourmaline breccia pipes.
4th Quarter News Highlight:
November 18, 2021: The company provided results from the remaining twelve resource definition holes drilled in Bx 5 totaling 2,541m at the Soledad project, Ancash, Peru. This resource drilling is part of the fully funded 26,000m exploration and resource drilling program planned for 2021. These results will further increase confidence in the initial resource estimate, anticipated to be completed by the end of 2021. Gradient-array induced-polarization (IP) surveys have been completed over the entire 12km2 footprint of the Soledad mineral system as well.
Source: Company Press Releases
DOWNLOAD THE FULL REPORT (PDF)
Noble Capital Markets Metals & Mining Newsletter Q4 2021
This newsletter was prepared and provided by Noble Capital Markets, Inc. For any questions and/or requests regarding this newsletter, please contact >Francisco Penafiel
DISCLAIMER
All statements or opinions contained herein that include the words “ we”,“ or “ are solely the responsibility of NOBLE Capital Markets, Inc and do not necessarily reflect statements or opinions expressed by any person or party affiliated with companies mentioned in this report Any opinions expressed herein are subject to change without notice All information provided herein is based on public and non public information believed to be accurate and reliable, but is not necessarily complete and cannot be guaranteed No judgment is hereby expressed or should be implied as to the suitability of any security described herein for any specific investor or any specific investment portfolio The decision to undertake any investment regarding the security mentioned herein should be made by each reader of this publication based on their own appraisal of the implications and risks of such decision This publication is intended for information purposes only and shall not constitute an offer to buy/ sell or the solicitation of an offer to buy/sell any security mentioned in this report, nor shall there be any sale of the security herein in any state or domicile in which said offer, solicitation or sale would be unlawful prior to registration or qualification under the securities laws of any such state or domicile This publication and all information, comments, statements or opinions contained or expressed herein are applicable only as of the date of this publication and subject to change without prior notice Past performance is not indicative of future results.
Please refer to the above PDF for a complete list of disclaimers pertaining to this newsletter


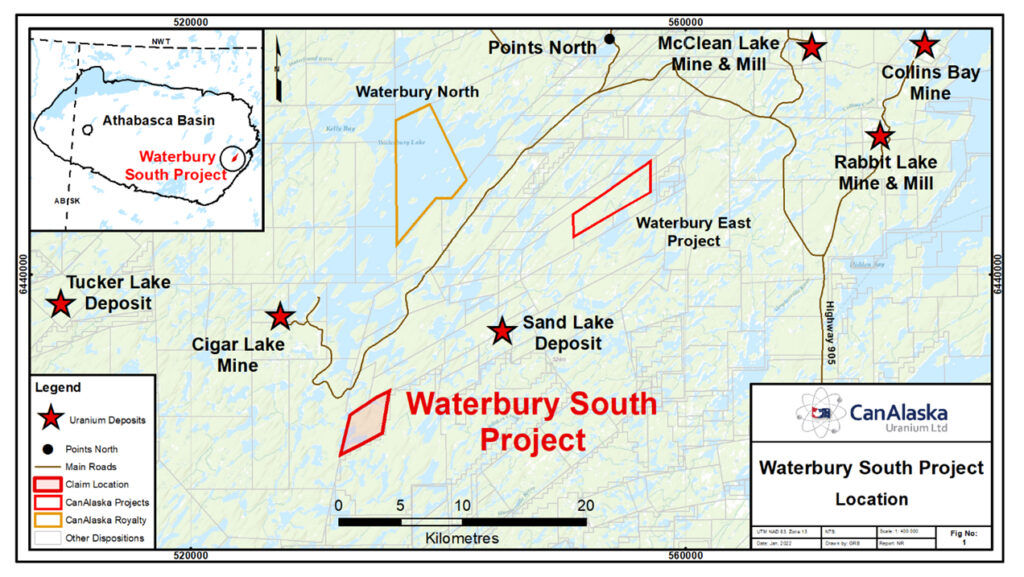
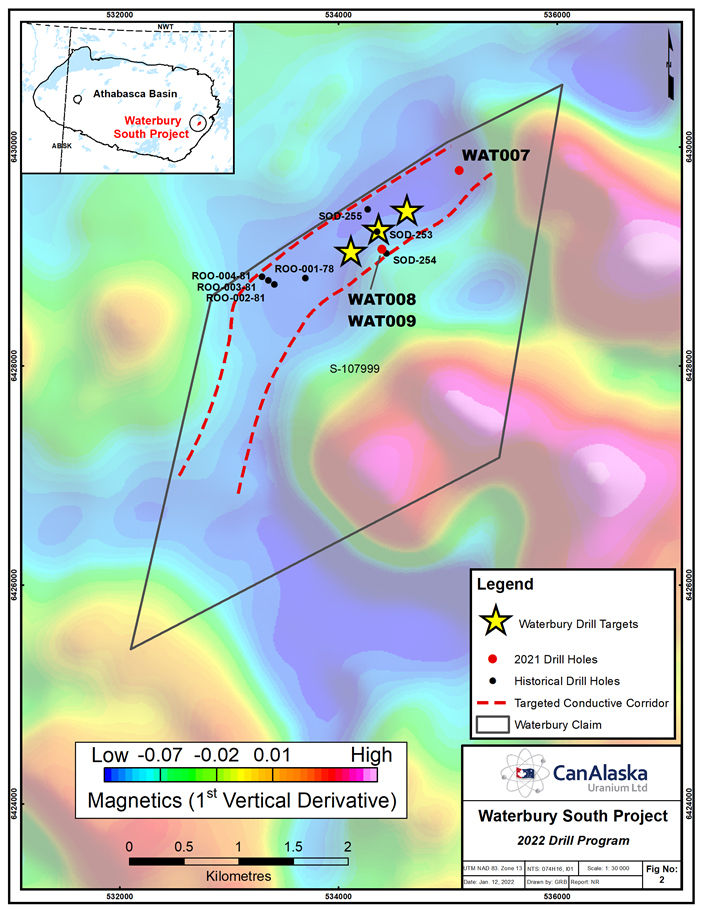 WAT-008 intersected a pyrite-rich zone associated with a fault in the mid-sandstone column well above the unconformity, followed by a thick graphitic unit in the basement which was the target for WAT-009.