
Maple Gold Mines (MGMLF) Corporate Presentation from NobleCon18Research, News and Market Data on Maple Gold MinesNobleCon 18 Complete Rebroadcast
|
Category: Natural Resources
Sierra Metals (SMTS) NobleCon18 Presentation Replay

Vox Royalty Corp (VOXCF) NobleCon18 Presentation Replay

Sierra Metals (SMTS)(SMT:CA) – On Track to Meet First Half Production Guidance; New High-Grade Discovery at Yauricocha


Friday, April 29, 2022
Sierra Metals (SMTS)(SMT:CA)
On Track to Meet First Half Production Guidance; New High-Grade Discovery at Yauricocha
As of April 24, 2020, Noble Capital Markets research on Sierra Metals is published under ticker symbols (SMTS and SMT:CA). The price target is in USD and based on ticker symbol SMTS. Research reports dated prior to April 24, 2020 may not follow these guidelines and could account for a variance in the price target.
Sierra Metals Inc is a precious and base metals producer in Latin America. The company acquires, explores, extracts, and produces mineral concentrates consisting of silver, copper, lead, zinc and gold in Mexico and Peru. Its activity includes the operation of the Yauricocha Mine in Peru, and the Bolivar and Cusi mines in Mexico. Yauricocha is an underground polymetallic mine using the sublevel block caving and cut-and-fill mining methods. Bolivar is a copper-silver-zinc-gold underground mine using room-and-pillar mining method. The majority of the revenue is earned by selling of the mineral concentrates to its customers in Peru.
Mark Reichman, Senior Research Analyst of Natural Resources, Noble Capital Markets, Inc.
Refer to the full report for the price target, fundamental analysis, and rating.
First quarter 2022 production. During the first quarter, Sierra Metals produced 6.3 million pounds of copper, 4.2 million pounds of lead, 10.5 million pounds of zinc, 1.9 thousand ounces of gold, and 734 thousand ounces of silver. Compared with the prior year period, first quarter production of copper, lead, zinc, gold, and silver declined 19.9%, 53.2%, 56.5%, 27.0%, and 23.6%, respectively. On a sequential basis, copper and silver production increased 4.2% and 3.2%, respectively, while lead, zinc, and silver production declined 29.9%, 29.6%, and 8.8%, respectively. In our view, production is on track to reach the company’s first half guidance of 34.0 to 39.5 million copper equivalent pounds.
Estimates are little changed. We are maintaining our first quarter and full year EPS estimates of $0.03 and $0.21, respectively. We forecast full year EBITDA of $100.8 million compared to our prior estimate of $100.9 million. Sierra will report first quarter financial results after the market close on May 11 and will host an investor conference call on May 12 at 11:00 am ET …

This Company Sponsored Research is provided by Noble Capital Markets, Inc., a FINRA and S.E.C. registered broker-dealer (B/D).
*Analyst certification and important disclosures included in the full report. NOTE: investment decisions should not be based upon the content of this research summary. Proper due diligence is required before making any investment decision.
Release – Sierra Metals Announces New High-Grade Zone Discovery at Its Yauricocha Mine in Peru
![]()
Sierra Metals Announces New High-Grade Zone Discovery at Its Yauricocha Mine in Peru
Research, News, and Market Data on Sierra Metals
- Exploration drilling of 8 holes, intercepts high grade sulfide adjacent to existing underground operations at Yauricocha Mine.
- Drilling demonstrates high grade mineralization potential which continues and remains open above the 1120 level.
TORONTO–(BUSINESS WIRE)– Drill hole highlights include:
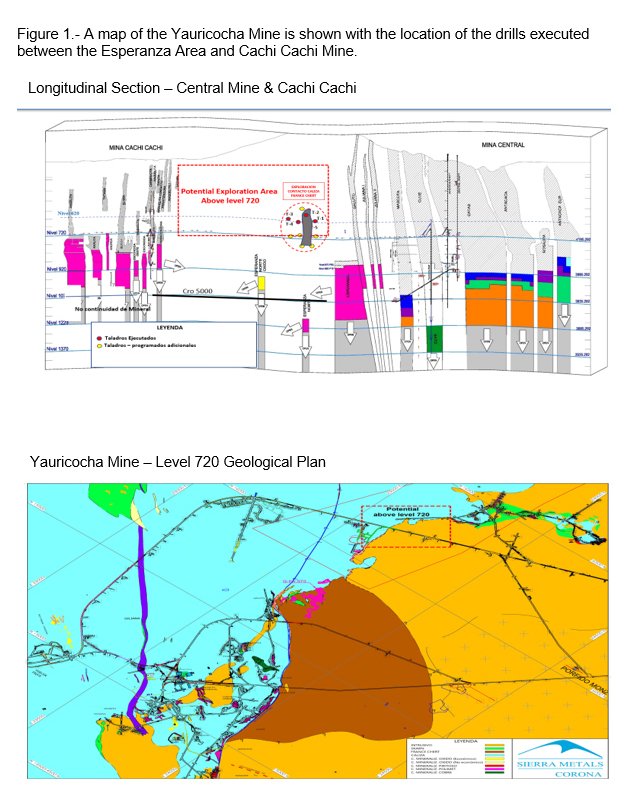
Figure 1.- A map of the Yauricocha Mine is shown with the location of the drills executed between the Esperanza Area and Cachi Cachi Mine. (Graphic: Business Wire)
|
Hole |
Width |
|
Cu |
|
Zn |
|
CuEq |
|
|
ECF 10 22 02 |
2.85 |
|
0.31 |
|
12.94 |
|
6.39 |
|
|
4.90 |
|
0.33 |
|
27.22 |
|
11.86 |
||
|
ECF 10 22 04 |
0.55 |
|
0.20 |
|
12.18 |
|
5.89 |
|
|
ECF 10 22 05 |
4.80 |
|
6.41 |
|
3.51 |
|
9.38 |
|
|
1.40 |
|
0.46 |
|
20.3 |
|
8.89 |
||
|
ECF 10 22 03 A |
1.15 |
|
0.16 |
|
15.15 |
|
6.68 |
|
|
ECF 10 22 04 A |
2.65 |
|
2.06 |
|
8.36 |
|
6.13 |
|
| *True widths have not been determined | ||||||||
Sierra Metals Inc. (TSX: SMT) (BVL: SMT) (“Sierra Metals” or “the Company”) is pleased to announce the discovery of a new high grade ore sulfide zone referred to as the “Fortuna” zone, located adjacent to the current mine operations. The discovery comes as part of an ongoing exploration drilling program at the Yauricocha Mine.
To date, 8 holes have been executed from the 720 level of the Yauricocha Mine within the Yauricocha System. These holes have intercepted mineralization containing high-grade Copper, Zinc and Lead zones. These results demonstrate the potential for high grade mineralization within the reported, and surrounding, areas.
Luis Marchese, CEO of Sierra Metals stated: “Today’s results represent significant progress in our efforts to expand Yauricocha’s ore resource within currently permitted levels of the mine. Mining of this readily accessible new high grade zone will increase expected ore grade for the next couple of years. We are working towards accessing part of the orebody as early as Q3 of 2022 which would have a positive impact on head grades in the second half of 2022.”
Alonso Lujan, Vice President, Exploration of Sierra Metals commented: “The reported results from the Fortuna zone, located laterally, between the Esperanza zone and Cachi Cachi Mine demonstrates the continued resource potential within the Yauricocha Mine.” He added, “The high value ore that has been defined suggests that continued exploration in the area is warranted, to better define its potential.”
Table 1.1 Shows the results of the drilling program
|
Hole Number |
From |
To |
Width** |
Ag |
Pb |
Cu |
Zn |
Au |
CuEq |
|
|
|
|
m |
g/t |
% |
% |
% |
g/t |
% |
|
ECF 10 22 02 |
397.25 |
400.10 |
2.85 |
72 |
3.91 |
0.31 |
12.94 |
0.30 |
6.39 |
|
|
404.65 |
409.55 |
4.90 |
95 |
5.14 |
0.33 |
27.22 |
0.49 |
11.86 |
|
|
417.00 |
418.60 |
1.60 |
19 |
0.50 |
0.10 |
3.70 |
0.16 |
1.72 |
|
|
418.60 |
424.70 |
6.10 |
20 |
0.56 |
0.09 |
1.77 |
0.17 |
1.08 |
|
|
424.70 |
428.70 |
4.00 |
134 |
0.86 |
0.42 |
12.98 |
0.65 |
6.52 |
|
|
|
|
|
|
|
|
|
|
|
|
ECF 10 22 04 |
396.35 |
396.90 |
0.55 |
52 |
4.43 |
0.20 |
12.18 |
0.15 |
5.89 |
|
|
|
|
|
|
|
|
|
|
|
|
ECF 10 22 05 |
366.40 |
371.20 |
4.80 |
126 |
1.76 |
6.41 |
3.51 |
0.58 |
9.38 |
|
|
376.00 |
382.00 |
6.00 |
25 |
0.57 |
0.11 |
5.36 |
0.18 |
2.38 |
|
|
433.50 |
434.90 |
1.40 |
172 |
0.52 |
0.46 |
20.30 |
0.00 |
8.89 |
|
|
446.20 |
449.40 |
3.20 |
15 |
0.43 |
0.12 |
1.63 |
0.00 |
0.89 |
|
|
|
|
|
|
|
|
|
|
|
|
ECF 10 22 01 A |
132.00 |
133.00 |
1.00 |
12 |
0.12 |
0.20 |
1.09 |
0.04 |
0.72 |
|
|
135.00 |
136.00 |
1.00 |
30 |
0.25 |
1.14 |
1.18 |
0.03 |
1.86 |
|
|
139.40 |
148.45 |
8.95 |
38 |
1.52 |
1.19 |
6.08 |
0.45 |
4.19 |
|
|
|
|
|
|
|
|
|
|
|
|
ECF 10 22 02 A |
138.40 |
138.75 |
0.35 |
21 |
0.42 |
0.76 |
2.49 |
0.28 |
2.04 |
|
|
138.75 |
139.70 |
0.95 |
24 |
0.49 |
0.95 |
1.86 |
0.34 |
2.09 |
|
|
139.70 |
140.60 |
0.90 |
46 |
0.54 |
3.31 |
1.73 |
0.68 |
4.81 |
|
|
141.50 |
142.35 |
0.85 |
22 |
0.43 |
0.93 |
1.79 |
0.25 |
1.97 |
|
|
155.20 |
155.50 |
0.30 |
7 |
0.18 |
0.06 |
1.97 |
0.65 |
1.22 |
|
|
|
|
|
|
|
|
|
|
|
|
ECF 10 22 03 A |
175.35 |
176.50 |
1.15 |
68 |
2.31 |
0.16 |
15.15 |
0.44 |
6.68 |
|
|
|
|
|
|
|
|
|
|
|
|
ECF 10 22 04 A |
132.00 |
134.00 |
2.00 |
36 |
0.78 |
0.77 |
3.51 |
0.16 |
2.53 |
|
|
134.00 |
136.65 |
2.65 |
71 |
1.48 |
2.06 |
8.36 |
0.50 |
6.13 |
|
*Prices Consensus Ag 24.05USD/Oz,Au 1806 USD/Oz,Pb 1.0USD/Lb,Zn 1.47USD/Lb,Cu 4.31USD/Lb |
|||||||||
|
**True widths have not been determined |
|||||||||
Method of Analysis
Samples are prepared at the Yauricocha lab facilities at the Chumpe Mill, which is located on site. Drill core samples from the mine are assayed utilizing two procedures. Silver, Lead, Zinc and Copper are assayed by atomic absorption. Gold is fire-assayed with an atomic absorption finish. Diamond drill core samples sent for analysis consist of half NQ size or BQ size drill core which is split on site.
Quality Control
Américo Zuzunaga, FAusIMM CP (Mining Engineer) and Vice President of Corporate Planning, is a Qualified Person under National Instrument 43-101 – Standards of Disclosure for Mineral Projects.
About Sierra Metals
Sierra Metals Inc. is a diversified Canadian mining company with Green Metal exposure including increasing copper production and base metal production with precious metals byproduct credits, focused on the production and development of its Yauricocha Mine in Peru, and Bolivar and Cusi Mines in Mexico. The Company is focused on increasing production volume and growing mineral resources. Sierra Metals has recently had several new key discoveries and still has many more exciting brownfield exploration opportunities at all three Mines in Peru and Mexico that are within close proximity to the existing mines. Additionally, the Company also has large land packages at all three mines with several prospective regional targets providing longer-term exploration upside and mineral resource growth potential.
The Company’s Common Shares trade on the Bolsa de Valores de Lima and on the Toronto Stock Exchange under the symbol “SMT” and on the NYSE American Exchange under the symbol “SMTS”.
For further information regarding Sierra Metals, please visit www.sierrametals.com
Continue to Follow, Like and Watch our progress:
Web: www.sierrametals.com | Twitter: sierrametals | Facebook: SierraMetalsInc | LinkedIn: Sierra Metals Inc | Instagram: sierrametals
Forward-Looking Statements
This press release contains “forward-looking information” and “forward-looking statements” within the meaning of Canadian and U.S. securities laws (collectively, “forward-looking information”). Forward-looking information includes, but is not limited to, statements with respect to the date of the 2020 Shareholders’ Meeting and the anticipated filing of the Compensation Disclosure. Any statements that express or involve discussions with respect to predictions, expectations, beliefs, plans, projections, objectives, assumptions or future events or performance (often, but not always, using words or phrases such as “expects”, “anticipates”, “plans”, “projects”, “estimates”, “assumes”, “intends”, “strategy”, “goals”, “objectives”, “potential” or variations thereof, or stating that certain actions, events or results “may”, “could”, “would”, “might” or “will” be taken, occur or be achieved, or the negative of any of these terms and similar expressions) are not statements of historical fact and may be forward-looking information.
Forward-looking information is subject to a variety of risks and uncertainties, which could cause actual events or results to differ from those reflected in the forward-looking information, including, without limitation, the risks described under the heading “Risk Factors” in the Company’s annual information form dated March 16, 2022 for its fiscal year ended December 31, 2021 and other risks identified in the Company’s filings with Canadian securities regulators and the United States Securities and Exchange Commission, which filings are available at www.sedar.com and www.sec.gov, respectively.
The risk factors referred to above are not an exhaustive list of the factors that may affect any of the Company’s forward-looking information. Forward-looking information includes statements about the future and is inherently uncertain, and the Company’s actual achievements or other future events or conditions may differ materially from those reflected in the forward-looking information due to a variety of risks, uncertainties and other factors. The Company’s statements containing forward-looking information are based on the beliefs, expectations, and opinions of management on the date the statements are made, and the Company does not assume any obligation to update such forward-looking information if circumstances or management’s beliefs, expectations or opinions should change, other than as required by applicable law. For the reasons set forth above, one should not place undue reliance on forward-looking information.
Investor Relations
Sierra Metals Inc.
(416) 366 7777
Email: [email protected]
J.Alonso Lujan
Vice President, Exploration Sierra Metals Inc.
(51) 630 3100
(52) 614 426 0211
Luis Marchese
President & CEO
Sierra Metals Inc.
(416) 366 7777
Source: Sierra Metals Inc.
Defense Metals (DFMTF)(DEFN:CA) – Line of Sight on an Expanded and Upgraded Resource
Thursday, April 28, 2022
Defense Metals (DFMTF)(DEFN:CA)
Line of Sight on an Expanded and Upgraded Resource
Noble Capital Markets research on Defense Metals Corp. is published under ticker symbols DFMTF and DEFN:CA. The price target for DFMTF is in USD and the price target for DEFN:CA is in CAD. Defense Metals Corp. is a mineral exploration and development company focused on the acquisition, exploration and development of mineral deposits containing metals and elements commonly used in the electric power market, defense industry, national security sector and in the production of green energy technologies, such as, rare earths magnets used in wind turbines and in permanent magnet motors for electric vehicles. Defense Metals owns 100% of the Wicheeda Rare Earth Element Property located near Prince George, British Columbia, Canada. Defense Metals Corp. trades in Canada under the symbol “DEFN” on the TSX Venture Exchange, in the United States, under “DFMTF” on the OTCQB and in Germany on the Frankfurt Exchange under “35D”.
Mark Reichman, Senior Research Analyst of Natural Resources, Noble Capital Markets, Inc.
Refer to the full report for the price target, fundamental analysis, and rating.
Fall 2021 drilling program. Defense Metals released results for the final five diamond drill holes, representing 1,079 meters of drilling, associated with the company’s 29-hole, 5,349-meter diamond drill program completed during the Fall of 2021. All 29-holes yielded positive results. Drill holes WI21-57 through WI21-61 were collared from two sites within the eastern area of the Wicheeda Rare Earth Element deposit. A complete listing of drill results may be found in the company’s press release.
Results speak for themselves. Resource definition drill holes WI21-58 and WI21-59 yielded two of the three highest grade and width intercepts of the 2021 drill campaign. WI21-58 averaged 3.09% total rare earth oxide (TREO) over 251 meters, including 3.92% TREO over 80 meters. WI21-59 returned 2.76% TREO over 212 meters, including 3.25% TREO over 90 meters from surface. Infill drill hole WI21-60 …
This Company Sponsored Research is provided by Noble Capital Markets, Inc., a FINRA and S.E.C. registered broker-dealer (B/D).
*Analyst certification and important disclosures included in the full report. NOTE: investment decisions should not be based upon the content of this research summary. Proper due diligence is required before making any investment decision.
Alliance Resource Partners (ARLP) – ARLP Raises 2022 Expectations Increases Cash Distribution 40

Wednesday, April 27, 2022
Alliance Resource Partners (ARLP)
ARLP Raises 2022 Expectations; Increases Cash Distribution 40%
Alliance Resource Partners LP operates as a coal mining company based in the United States. It functions through threesegments; Illinois Basin, Appalachia, and and Minerals. The Illinois Basin activity comprises of underground mining complexes in Illinois, Indiana, Kentucky, Maryland and West Virginia and it makes up for most of the company’s revenue-generating operations. The Appalachia segment, on the other hand, consists of multiple operating segments, including the Mettiki mining complex, the Tunnel Ridge mining complex and the MC Mining mining complex. The Minerals segment includes oil & gas mineral interests held by AR Midland and AllDale I & II.
Mark Reichman, Senior Research Analyst of Natural Resources, Noble Capital Markets, Inc.
Refer to the full report for the price target, fundamental analysis, and rating.
Full year 2022 guidance. While Alliance tempered first quarter expectations due to coal shipment delays and a one-time conversion of its oil & gas business to a corporate taxable entity, Alliance now expects full year 2022 coal sales tonnage in the range of 35.5 to 37.0 million short tons compared to prior expectations of 35.2 to 36.7 million tons. Coal sales price per ton sold is expected to be in the range of $54.00 to $63.00 versus prior guidance of $49.05 to $51.25. While expectations for coal royalty tons sold is unchanged, pricing expectations have increased. Alliance also raised expectations for oil & gas royalty volumes.
Updating estimates. While we have lowered our adjusted first quarter EPS to $0.60 from $0.62 due to lower coal shipments which will be delivered later in the year, we have increased our full year estimate to $3.25 from $2.75. We have increased our 2022 EBITDA estimate to $716.1 million from $650.8 million. While the company expects to report GAAP first quarter net income of $35.0 to $37.0 million …
This Company Sponsored Research is provided by Noble Capital Markets, Inc., a FINRA and S.E.C. registered broker-dealer (B/D).
*Analyst certification and important disclosures included in the full report. NOTE: investment decisions should not be based upon the content of this research summary. Proper due diligence is required before making any investment decision.
Release – Alliance Resource Partners L.P. Increases Quarterly Cash Distribution
![]()
Alliance Resource Partners, L.P. Increases Quarterly Cash Distribution 40% to $0.35 Per Unit; Provides Preliminary View of Results for the Quarter Ended March 31, 2022; and Increases Guidance
Research, News, and Market Data on Alliance Resource Partners
TULSA, Okla.–(BUSINESS WIRE)– Alliance Resource Partners, L.P. (NASDAQ: ARLP) today announced that the Board of Directors of ARLP’s general partner approved an increased cash distribution to its unitholders for the quarter ended March 31, 2022 (the “2022 Quarter”).
ARLP unitholders will receive a cash distribution for the 2022 Quarter of $0.35 per unit (an annualized rate of $1.40 per unit), payable on May 13, 2022, to all unitholders of record as of the close of trading on May 6, 2022. The announced distribution represents a 250.0% increase over the cash distribution of $0.10 per unit for the quarter ended March 31, 2021 (the “2021 Quarter”) and a 40.0% increase over the cash distribution of $0.25 per unit for the quarter ended December 31, 2021.
Preliminary Results for 2022 Quarter
ARLP is providing a preliminary view of the current quarter, which includes the impact of coal shipment delays and oil & gas royalty income tax elections on operating and financial results for the 2022 Quarter.
Shipment delays due to seasonal barge lock maintenance, high river levels and ongoing rail transportation challenges impacted ARLP’s ability to ship approximately 1.1 million tons of contracted tonnage during the 2022 Quarter. These delayed coal shipments are expected to be delivered throughout the balance of the year. The financial impact in the 2022 Quarter reduced ARLP’s previously anticipated coal revenues, net income and EBITDA by approximately $72.0 million, $27.0 million, or $0.21 per basic and diluted limited partner unit, and $31.0 million, respectively. (Unless otherwise noted in this release, “net income” refers to “net income attributable to ARLP.” EBITDA is defined as net income attributable to ARLP before net interest expense, income taxes and depreciation, depletion and amortization.)
Consolidated financial results for the 2022 Quarter will also reflect ARLP’s recent election to convert Alliance Minerals, LLC, the holding company for ARLP’s oil & gas royalty activities, from a partnership pass-through entity taxable at the individual unitholder level to that of a corporate taxable entity for federal and state income tax purposes. This election effectively reduces the total income tax burden on our oil & gas royalties, as ARLP will pay entity level taxes at corporate tax rates that are well below the individual tax rates that would otherwise be paid by our unitholders. As a result, for the 2022 Quarter ARLP will record a one-time non-cash deferred income tax expense and liability of approximately $37.0 million related to the election in addition to a current income tax expense of approximately $5.0 million, which collectively are expected to reduce net income by approximately $42.0 million or $0.33 per basic and diluted limited partner unit.
Reflecting the impacts discussed above, ARLP currently anticipates net income for the 2022 Quarter to be in a range of $35.0 ? $37.0 million or $0.27 ? $0.28 per basic and diluted limited partner unit, compared to net income of $24.7 million or $0.19 per unit for the 2021 Quarter.
Increased Guidance for Full Year 2022
Commenting on current energy markets, Joseph W. Craft III, Chairman, President and Chief Executive Officer, said, “Favorable market conditions for oil, natural gas and coal that developed during the second half of last year soared during the 2022 Quarter. Since we provided initial full-year 2022 guidance for ARLP on January 31, 2022, worldwide commodity prices skyrocketed. We expect energy markets should remain favorable for the next several years, allowing ARLP to capture price realizations well above our previous expectations. As a result, we currently anticipate 2022 coal sales volumes to be approximately 500,000 tons above our initial guidance ranges and that coal sales price per ton sold should exceed our previous expectations by 10.0% ? 22.0%. Segment Adjusted EBITDA Expense per ton sold is also expected to increase slightly above initial estimates as our mining operations continue to effectively manage inflationary pressures and supply chain challenges at our coal mines.”
Mr. Craft continued, “We also anticipate our royalty businesses will benefit from these robust energy markets. Significantly higher oil & gas prices have spurred operators to increase production, leading to anticipated increases in ARLP’s oil & gas royalty volumes this year. The performance of our coal royalty business is also expected to benefit from higher revenue per royalty ton sold. As a result, we currently anticipate ARLP’s 2022 full-year financial and operating results will surpass our initial expectations, despite the short-term effects of transportation challenges on performance during the first half of the year.”
Reflecting the expected benefits of favorable market conditions and increased commodity prices, ARLP is updating its previous guidance as outlined below:
|
2022 Full Year Guidance |
|||||
|
|
|
|
|
|
|
|
Coal Operations |
|
|
|
|
|
|
Volumes (Million Short Tons) |
|
|
|
|
|
|
Illinois Basin Sales Tons |
|
|
|
|
25.2 — 26.0 |
|
Appalachia Sales Tons |
|
|
|
|
10.3 — 11.0 |
|
Total Sales Tons |
|
|
|
|
35.5 — 37.0 |
|
|
|
|
|
|
|
|
Committed & Priced Sales Tons |
|
|
|
|
|
|
2022 — Domestic/Export/Total |
|
|
|
|
30.1/4.1/34.2 |
|
2023 — Domestic/Export/Total |
|
|
|
|
17.9/2.0/19.9 |
|
|
|
|
|
|
|
|
Per Ton Estimates |
|
|
|
|
|
|
Coal Sales Price per ton sold (1) |
|
|
|
|
$54.00 — $63.00 |
|
Segment Adjusted EBITDA Expense per ton sold (2) |
|
|
|
|
$33.50 — $35.50 |
|
|
|
|
|
|
|
|
Royalties |
|
|
|
|
|
|
Oil & Gas Royalties |
|
|
|
|
|
|
Oil (000 Barrels) |
|
|
|
|
885 – 935 |
|
Natural gas (000 MCF) |
|
|
|
|
3,000 – 3,400 |
|
Liquids (000 Barrels) |
|
|
|
|
350 – 380 |
|
Segment Adjusted EBITDA Expense (% of Oil & Gas Royalties Revenue) |
|
|
|
|
~ 12.0% |
|
|
|
|
|
|
|
|
Coal Royalties |
|
|
|
|
|
|
Royalty tons sold (Million Short Tons) |
|
|
|
|
21.5 — 22.0 |
|
Revenue per royalty ton sold |
|
|
|
|
$3.10 — $3.20 |
|
Segment Adjusted EBITDA Expense per royalty ton sold |
|
|
|
|
$1.10 — $1.20 |
|
|
|
|
|
|
|
|
Consolidated (Millions) |
|
|
|
|
|
|
Depreciation, depletion and amortization |
|
|
|
|
$260 — $270 |
|
General and administrative |
|
|
|
|
$82 — $84 |
|
Net interest expense |
|
|
|
|
$37 — $38 |
|
Income tax expense |
|
|
|
|
$53 — $55 |
|
Capital expenditures |
|
|
|
|
$220 — $240 |
| _________________________ | |||||
|
(1) Sales price per ton is defined as total coal sales revenue divided by total tons sold. |
|||||
|
(2) Segment Adjusted EBITDA Expense is defined as operating expenses, coal purchases and other expense. |
|||||
This announcement is intended to be a qualified notice under Treasury Regulation Section 1.1446-4(b), with 100% of the partnership’s distributions to foreign investors attributable to gross income, gain or loss that is effectively connected with a United States trade or business. Accordingly, ARLP’s distributions to foreign investors are subject to federal income tax withholding at the highest applicable tax rate.
A conference call regarding ARLP’s 2022 Quarter financial results is scheduled for Monday, May 2, 2022 at 10:00 a.m. Eastern. To participate in the conference call, dial (877) 407-0784 and request to be connected to the Alliance Resource Partners, L.P. earnings conference call. International callers should dial (201) 689-8560 and request to be connected to the same call. Investors may also listen to the call via the “investor information” section of ARLP’s website at http://www.arlp.com.
An audio replay of the conference call will be available for approximately one week. To access the audio replay, dial U.S. Toll Free (844) 512-2921; International Toll (412) 317-6671 and request to be connected to replay using access code 13729024.
About Alliance Resource Partners, L.P.
ARLP is a diversified natural resource company that generates operating and royalty income from coal produced by its mining complexes and royalty income from mineral interests it owns in strategic oil & gas producing regions in the United States, primarily the Permian, Anadarko and Williston basins.
ARLP currently produces coal from seven mining complexes its subsidiaries operate in Illinois, Indiana, Kentucky, Maryland and West Virginia. ARLP also operates a coal loading terminal on the Ohio River at Mount Vernon, Indiana. ARLP markets its coal production to major domestic and international utilities and industrial users and is currently the second largest coal producer in the eastern United States.
In addition, ARLP is positioning itself as an energy provider for the future by leveraging its core technology and operating competencies to make strategic investments in the fast growing energy and infrastructure transition.
News, unit prices and additional information about ARLP, including filings with the Securities and Exchange Commission, are available at http://www.arlp.com. For more information, contact the investor relations department of ARLP at (918) 295-7674 or via e-mail at [email protected].
The statements and projections used throughout this release are based on current expectations. These statements and projections are forward-looking, and actual results may differ materially. These projections do not include the potential impact of any mergers, acquisitions or other business combinations that may occur after the date of this release. We have included more information below regarding business risks that could affect our results.
FORWARD-LOOKING STATEMENTS: With the exception of historical matters, any matters discussed in this press release are forward-looking statements that involve risks and uncertainties that could cause actual results to differ materially from projected results. Those forward-looking statements include expectations with respect to coal and oil & gas consumption and expected future prices, optimizing cash flows, reducing operating and capital expenditures, preserving liquidity and maintaining financial flexibility, among others. These risks to our ability to achieve these outcomes include, but are not limited to, the following: the severity, magnitude, and duration of the COVID-19 pandemic and the emergence of new virus variants, including impacts of the pandemic and of businesses’ and governments’ responses to the pandemic, including actions to mitigate its impact and the development of treatments and vaccines, on our operations and personnel, and on demand for coal, oil, and natural gas, the financial condition of our customers and suppliers, available liquidity and capital sources and broader economic disruptions; changes in macroeconomic and market conditions and market volatility arising from the COVID-19 pandemic or otherwise, including inflation, changes in coal, oil, natural gas, and natural gas liquids prices, and the impact of such changes and volatility on our financial position; decline in the coal industry’s share of electricity generation, including as a result of environmental concerns related to coal mining and combustion and the cost and perceived benefits of other sources of electricity and fuels, such as oil & gas, nuclear energy, and renewable fuels; changes in global economic and geo-political conditions or in industries in which our customers operate; changes in coal prices and/or oil & gas prices, demand and availability which could affect our operating results and cash flows; actions of the major oil-producing countries with respect to oil production volumes and prices could have direct and indirect impacts over the near and long term on oil & gas exploration and production operations at the properties in which we hold mineral interests; changes in competition in domestic and international coal markets and our ability to respond to such changes; potential shut-ins of production by operators of the properties in which we hold mineral interests due to low oil, natural gas, and natural gas liquid prices or the lack of downstream demand or storage capacity; risks associated with the expansion of our operations and properties; our ability to identify and complete acquisitions; dependence on significant customer contracts, including renewing existing contracts upon expiration; adjustments made in price, volume, or terms to existing coal supply agreements; the effects of and changes in trade, monetary and fiscal policies and laws, including the interest rate policies of the Federal Reserve Board; the effects of and changes in taxes or tariffs and other trade measures adopted by the United States and foreign governments; legislation, regulations, and court decisions and interpretations thereof, both domestic and foreign, including those relating to the environment and the release of greenhouse gases, mining, miner health and safety, hydraulic fracturing, and health care; deregulation of the electric utility industry or the effects of any adverse change in the coal industry, electric utility industry, or general economic conditions; investors’ and other stakeholders’ increasing attention to environmental, social, and governance matters; liquidity constraints, including those resulting from any future unavailability of financing; customer bankruptcies, cancellations or breaches to existing contracts, or other failures to perform; customer delays, failure to take coal under contracts or defaults in making payments; our productivity levels and margins earned on our coal sales; disruptions to oil & gas exploration and production operations at the properties in which we hold mineral interests; changes in raw material costs, including due to inflationary pressures; changes in our ability to recruit, hire and maintain labor, including, as a result of, the potential impact of government-imposed vaccine mandates; our ability to maintain satisfactory relations with our employees; increases in labor costs including costs of health insurance and taxes resulting from the Affordable Care Act, adverse changes in work rules, or cash payments or projections associated with workers’ compensation claims; increases in transportation costs and risk of transportation delays or interruptions; operational interruptions due to geologic, permitting, labor, weather or other factors; risks associated with major mine-related accidents, mine fires, mine floods or other interruptions; results of litigation, including claims not yet asserted; foreign currency fluctuations that could adversely affect the competitiveness of our coal abroad; difficulty maintaining our surety bonds for mine reclamation as well as workers’ compensation and black lung benefits; difficulty in making accurate assumptions and projections regarding post-mine reclamation as well as pension, black lung benefits, and other post-retirement benefit liabilities; uncertainties in estimating and replacing our coal mineral reserves and resources; uncertainties in estimating and replacing our oil & gas reserves; uncertainties in the amount of oil & gas production due to the level of drilling and completion activity by the operators of our oil & gas properties; the impact of current and potential changes to federal or state tax rules and regulations, including a loss or reduction of benefits from certain tax deductions and credits; difficulty obtaining commercial property insurance, and risks associated with our participation in the commercial insurance property program; evolving cybersecurity risks, such as those involving unauthorized access, denial-of-service attacks, malicious software, data privacy breaches by employees, insiders or others with authorized access, cyber or phishing-attacks, ransomware, malware, social engineering, physical breaches, or other actions; and difficulty in making accurate assumptions and projections regarding future revenues and costs associated with equity investments in companies we do not control.
Additional information concerning these and other factors can be found in ARLP’s public periodic filings with the SEC, including ARLP’s Annual Report on Form 10-K for the year ended December 31, 2021, filed on February 25, 2022 with the SEC. Except as required by applicable securities laws, ARLP does not intend to update its forward-looking statements.
Brian L. Cantrell
Alliance Resource Partners, L.P.
(918) 295-7673
Source: Alliance Resource Partners, L.P.
Aurania Resources (AUIAF)(ARU:CA) – Exploration Focuses on Three Main Target Areas
Tuesday, April 26, 2022
Aurania Resources (AUIAF)(ARU:CA)
Exploration Focuses on Three Main Target Areas
As of April 24, 2020, Noble Capital Markets research on Aurania Resources is published under ticker symbols (AUIAF and ARU:CA). The price target is in USD and based on ticker symbol AUIAF. Research reports dated prior to April 24, 2020 may not follow these guidelines and could account for a variance in the price target.
Aurania Resources Ltd. is a Canada-based junior mining exploration company engaged in the identification, evaluation, acquisition, and exploration of mineral property interests, with a focus on precious metals and copper. Its flagship asset, The Lost Cities-Cutucu Project, is in southeastern Ecuador in the Province of Morona-Santiago. The company also has several minor projects in Switzerland.
Mark Reichman, Senior Research Analyst of Natural Resources, Noble Capital Markets, Inc.
Refer to the full report for the price target, fundamental analysis, and rating.
Focused exploration strategy. Following an internal review of its projects, target types, and funding strategies, Aurania announced in February that it would focus its resources on the exploration of its core mineral concessions in Ecuador, including epithermal gold and porphyry copper targets. The company is exploring joint ventures and partnerships to advance non-core mineral concessions that include sediment-hosted copper-silver and carbonate replacement silver-zinc-lead targets.
Priorities in 2022. Exploration will support the refinement of drilling plans for the Awacha porphyry copper target, and Kuri-Yawi B1 and Kuripan epithermal gold-silver targets. We anticipate drilling could begin at Awacha in the first quarter of next year. Recall that an access agreement was signed with the communities around the Awacha porphyry copper target area in January. Geophysics work has …
This Company Sponsored Research is provided by Noble Capital Markets, Inc., a FINRA and S.E.C. registered broker-dealer (B/D).
*Analyst certification and important disclosures included in the full report. NOTE: investment decisions should not be based upon the content of this research summary. Proper due diligence is required before making any investment decision.
Metals and Mining Industry Outlook – Noble Capital Markets Natural Resources Sector Review – Q1 2022

Noble Capital Markets Metals and Mining Newsletter – Q1 2022
Source: Capital IQ as of 03/31/2022
Source: Capital IQ as of 03/31/2022; Company Filings
METALS AND MINING INDUSTRY OUTLOOK
Metals & Mining First Quarter 2022 Review and Outlook
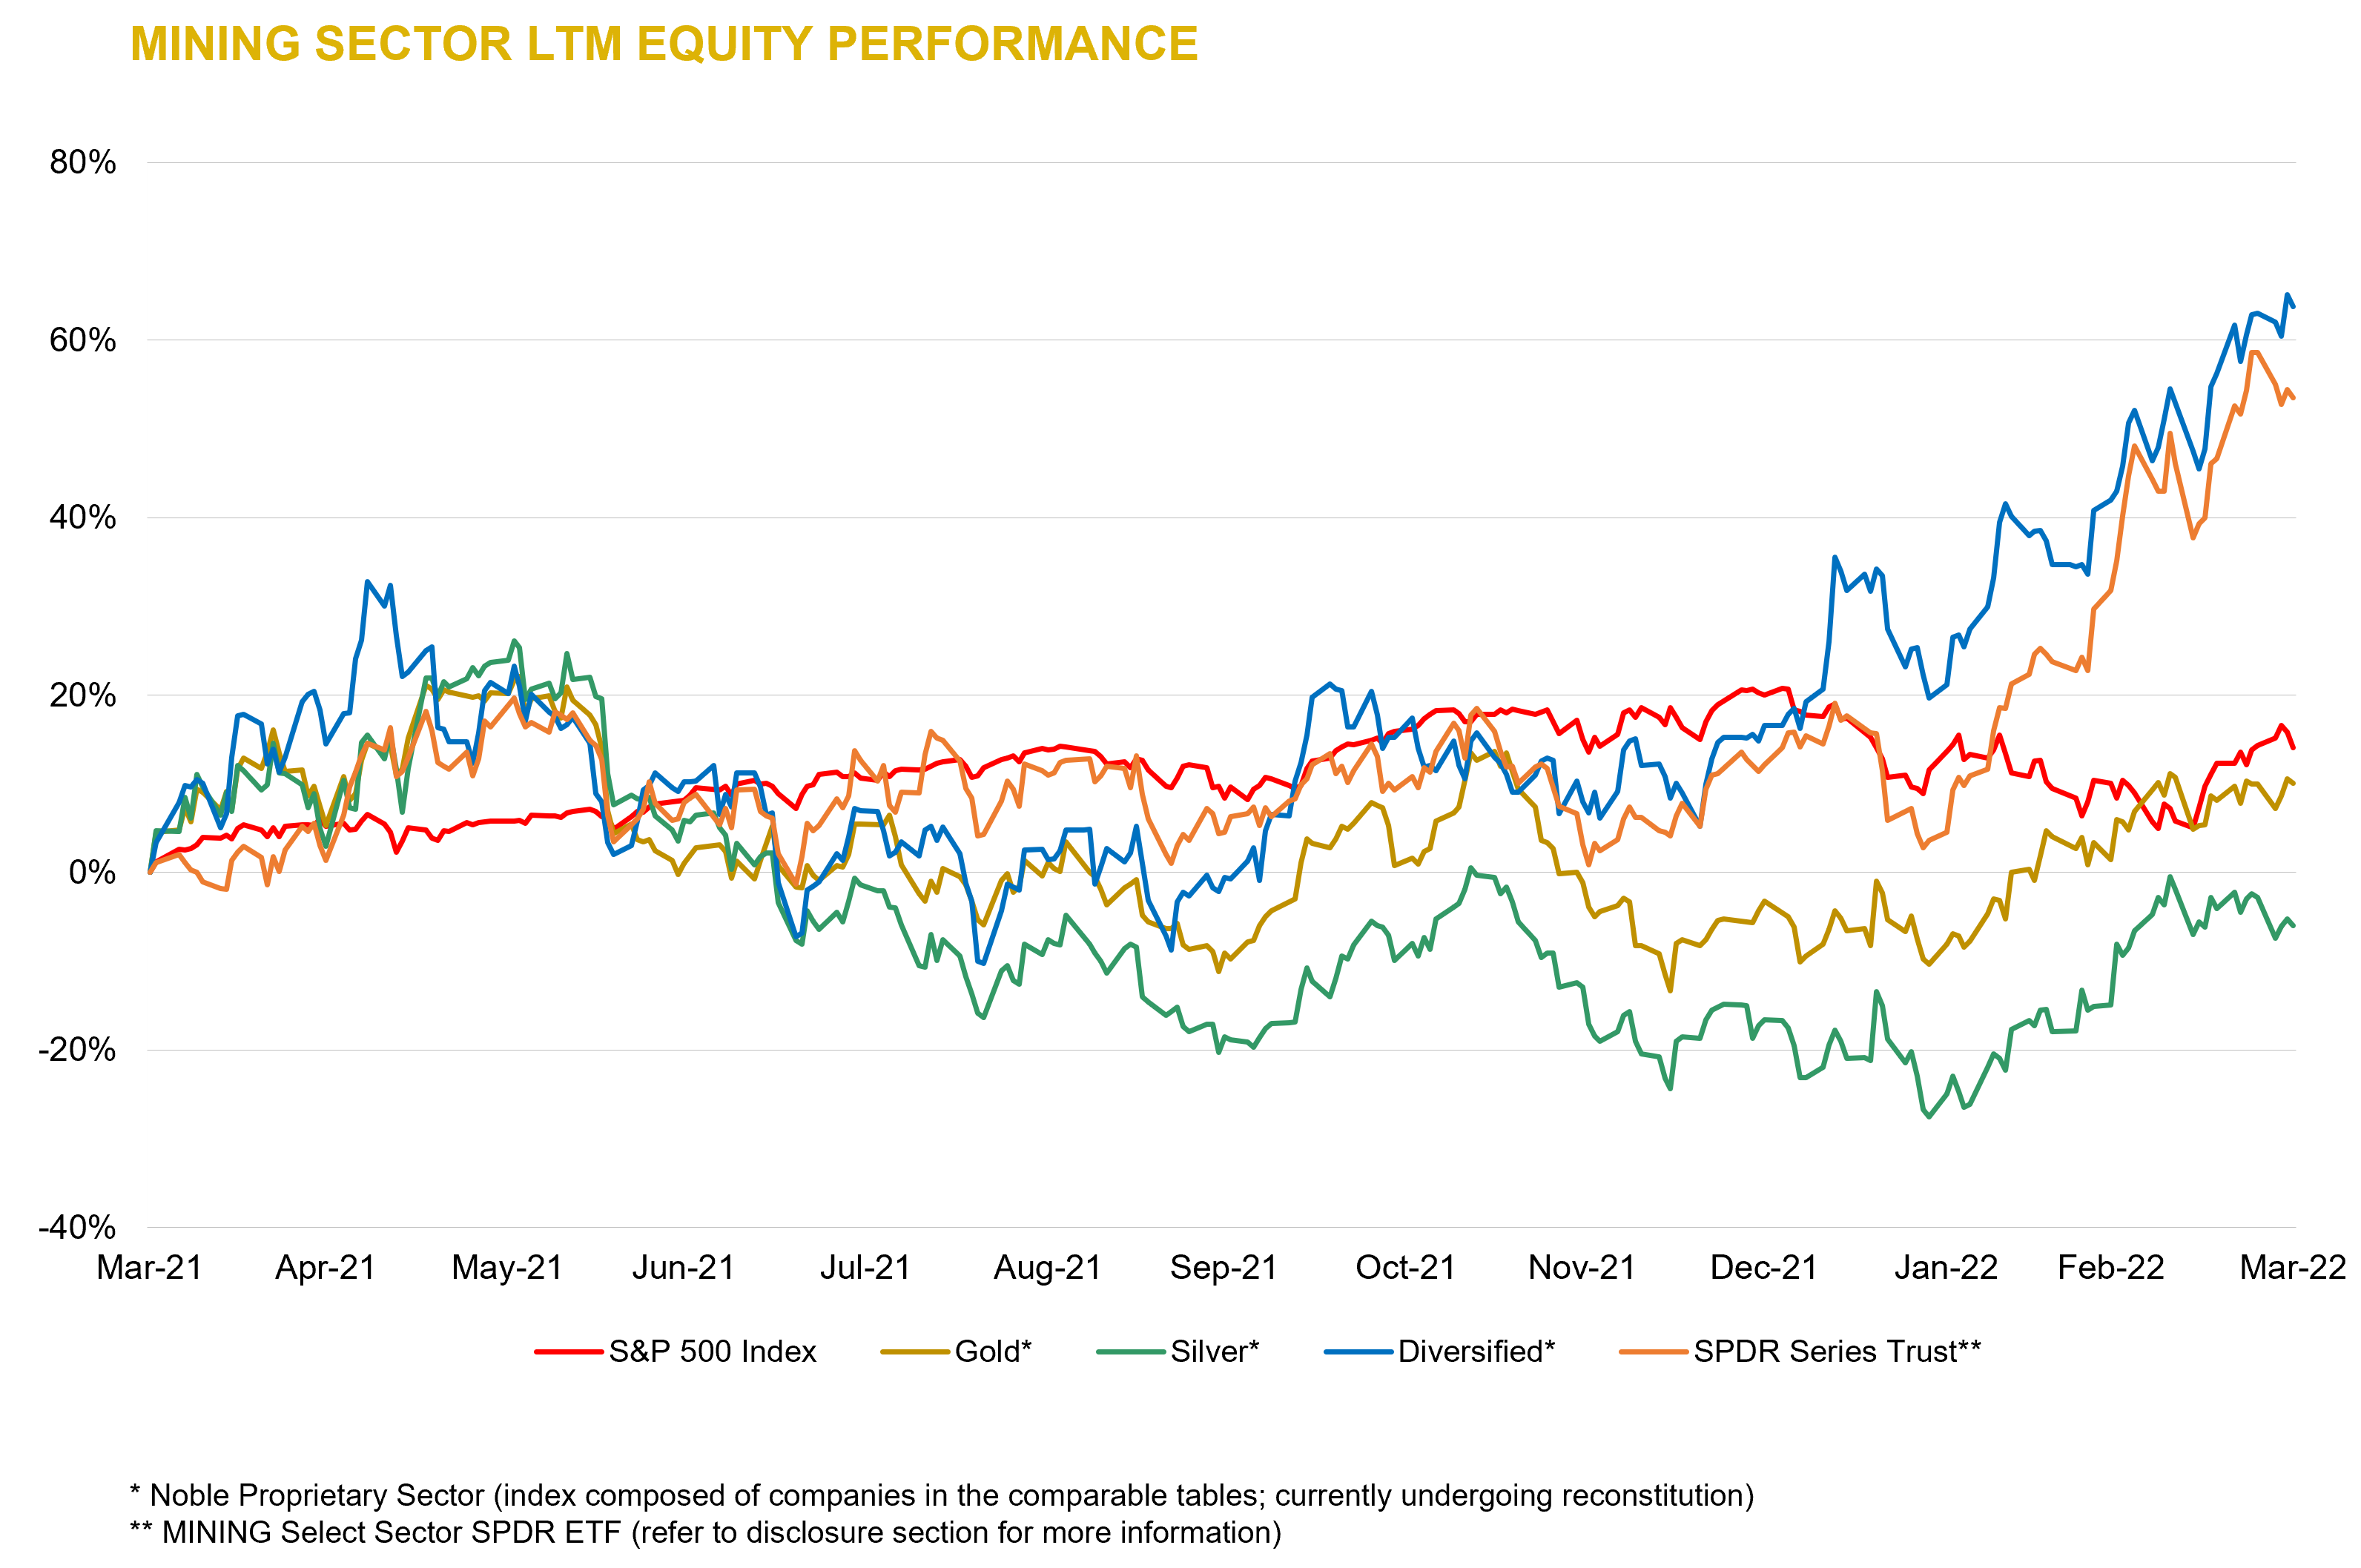
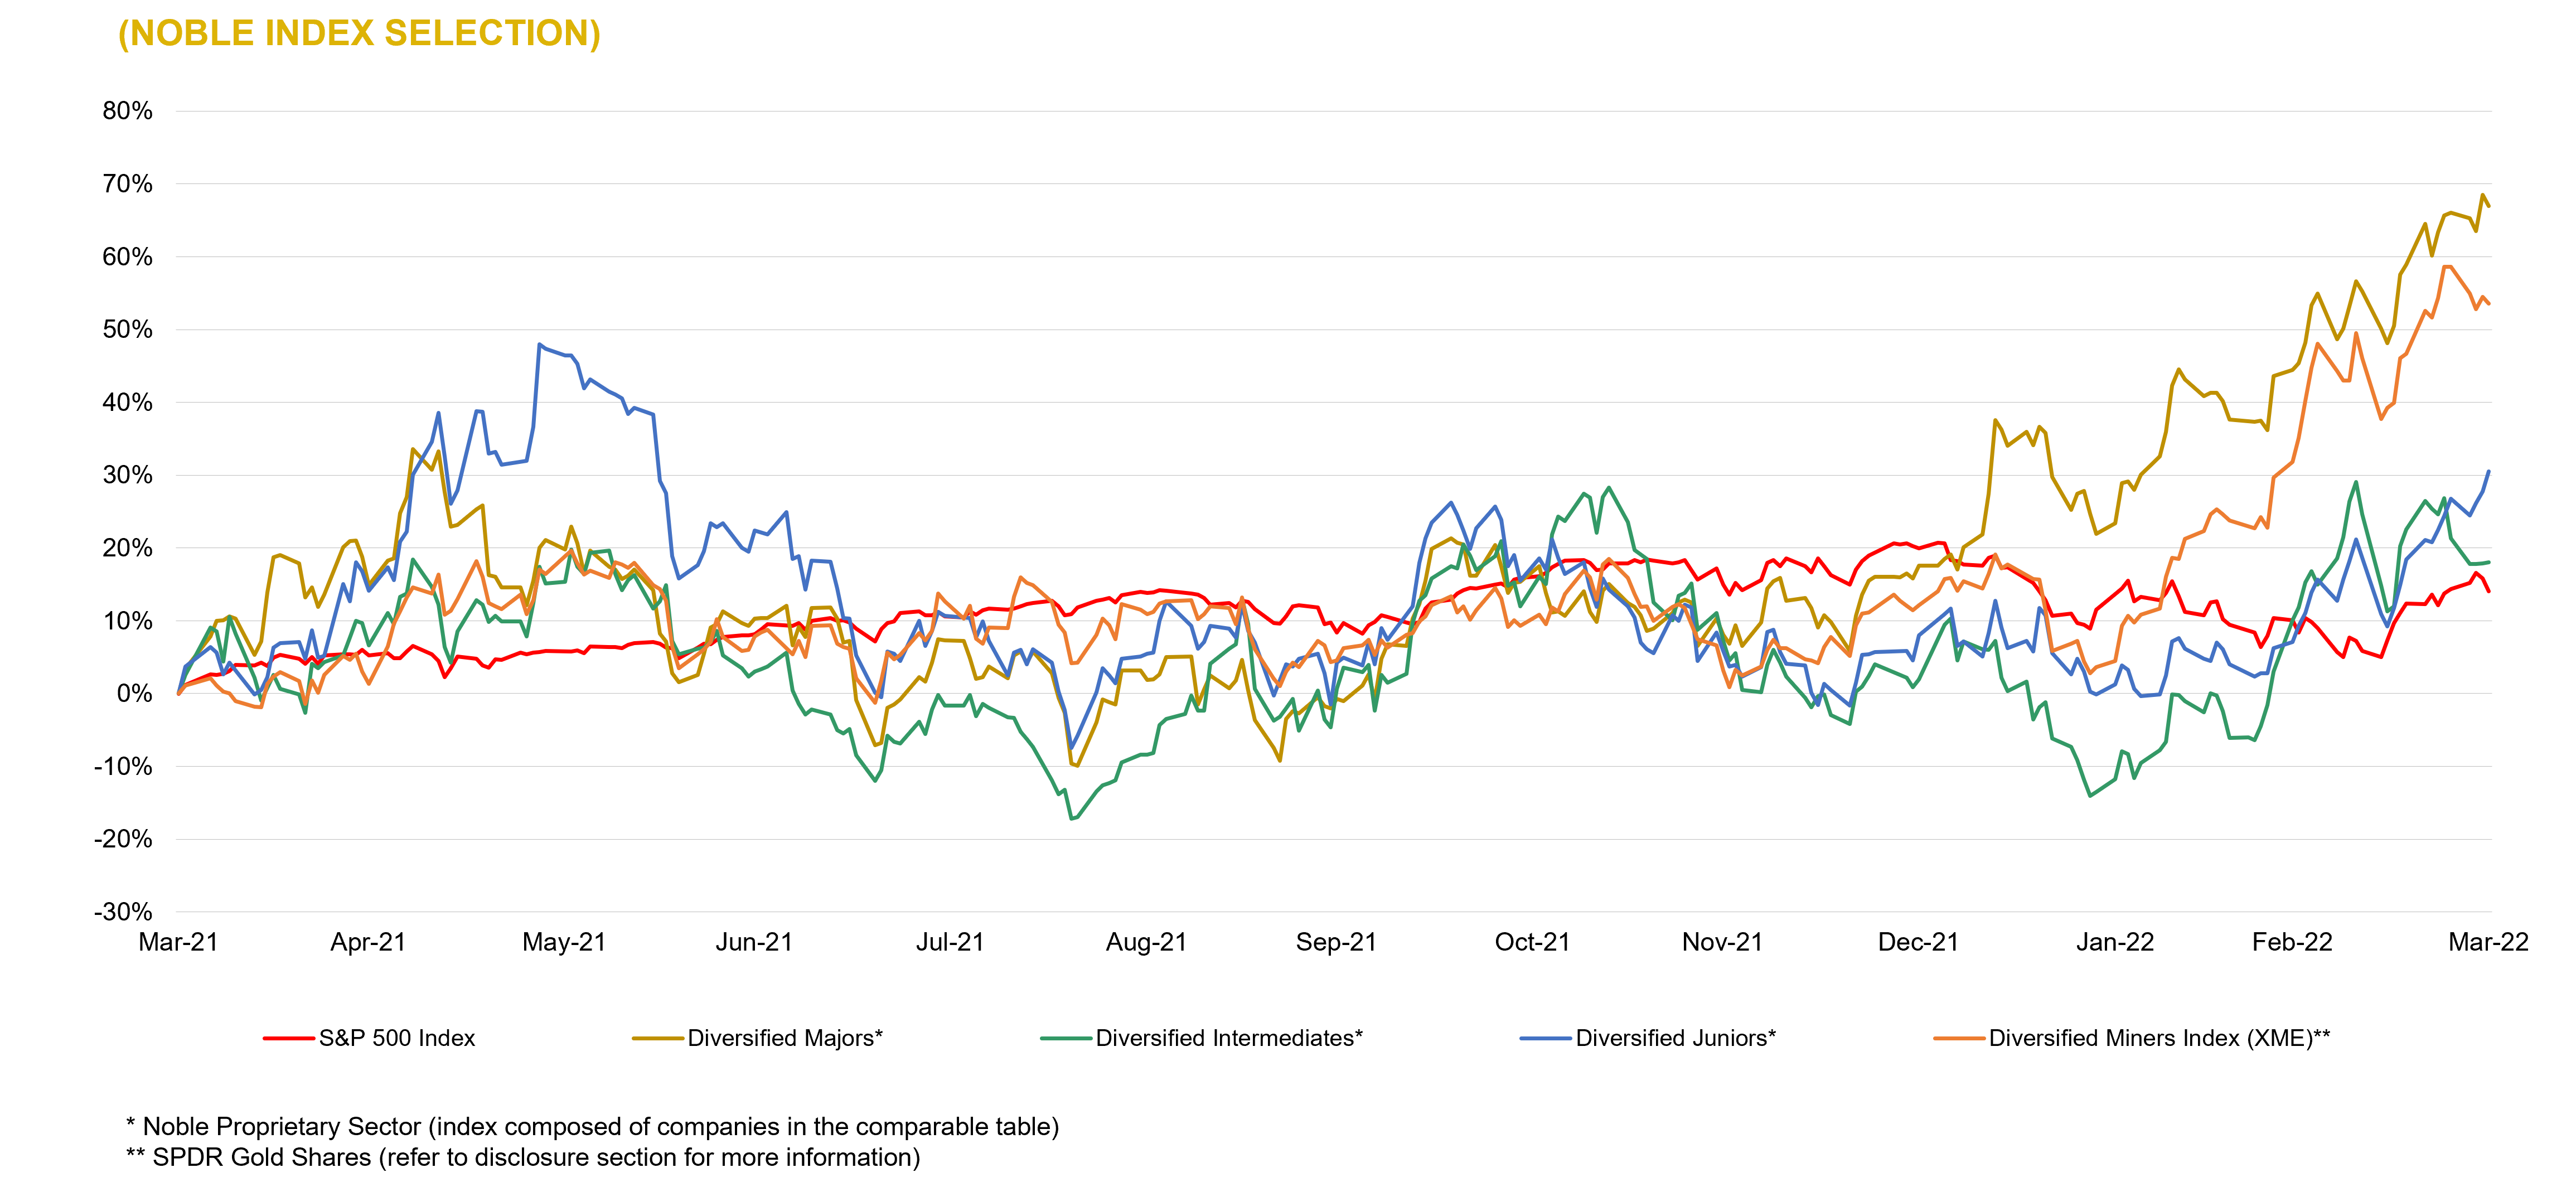
Mining companies outperform broader market.
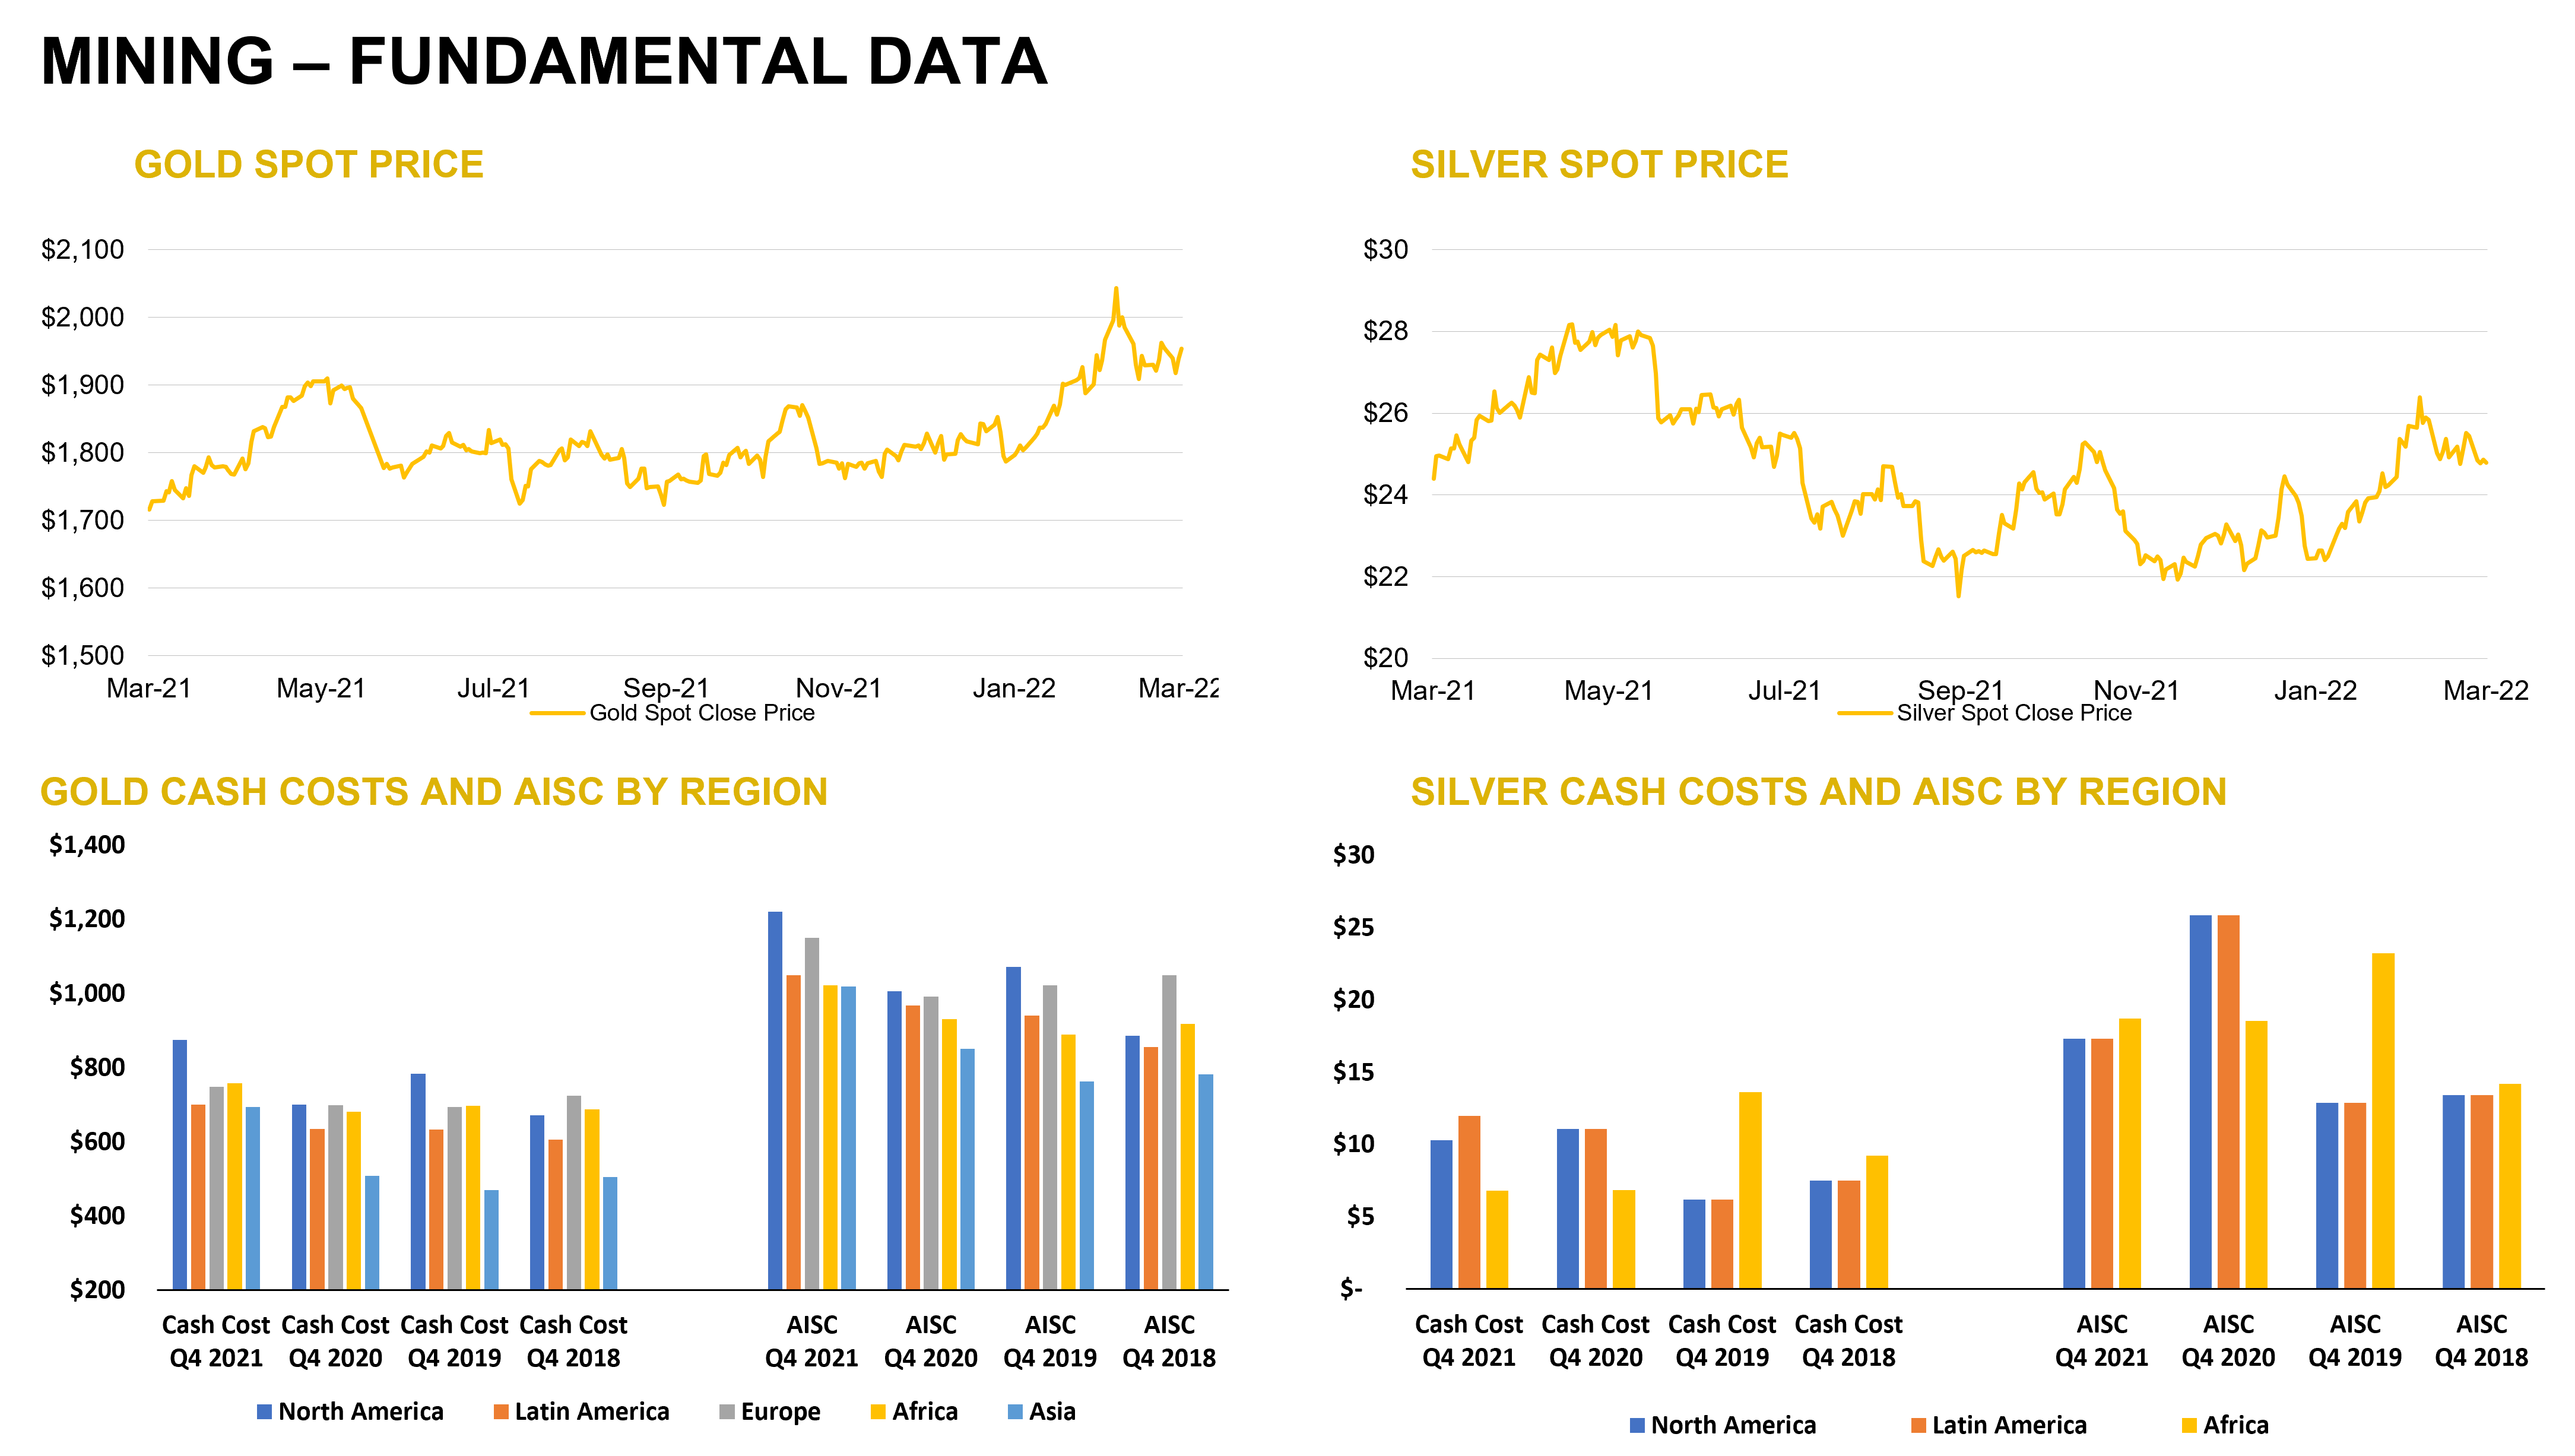
During the first quarter, mining companies (as measured by the XME) appreciated 36.9% compared to a loss of 4.9% for the S&P 500 index. The VanEck Vectors Gold Miners (GDX) and Junior Gold Miners (GDXJ) ETFs were up 19.7% and 11.8%, respectively. Gold, silver, copper, and zinc futures prices rose 6.5%, 7.5%, 6.7%, and 20.9%, respectively, while lead was down 0.3%. The war in Ukraine has constrained supplies of commodities, everything from fertilizer, grain, oil, natural gas, and metals, and magnified inflationary trends. How long this will continue is uncertain.
Outlook for precious metals.
The U.S. Dollar Index rose 2.4% during the first quarter, while the yield on a 10-year treasury note rose to 2.33% from 1.51% at year-end 2020. With the U.S. Federal Reserve signaling more aggressive action to combat inflation, further gains for gold may be challenged for the remainder of the year in the face of higher rates and a stronger dollar. However, with consumer and core inflation at 7.9% and 6.4% through February, respectively, real interest rates remain negative and enhance gold’s appeal as a store of value. Moreover, precious metals may be viewed as insurance against expected market volatility and economic uncertainty.
Risk of slowing economic growth may impact industrial metals.
With the Federal Reserve behind the curve on inflation and an unanticipated war stressing commodity markets, choking back demand and growth may be an obvious choice to combat inflation and supply shortages. A key worry is the risk of recession in the U.S. and abroad versus a softer landing. However, improving supply chains, inventory re-stocking, and greater capital spending could be supportive of pricing, and we believe the long-term investment case for owning industrial metals mining companies remains favorable. However, industrial metals may also be challenged to post further gains into the latter part of the year.
Putting it all together.
While much uncertainty remains, including the trajectory of the war in Ukraine, the U.S. Federal Reserve will likely achieve its goal of tamping down inflation. Despite a cautious near-term outlook, precious and industrial metals prices could hold up relatively well despite near-term headwinds. As a means of portfolio diversification, exposure to the mining sector is beneficial and investors may want to consider junior mining companies due to more attractive valuations relative to larger cap peers and the potential for increased M&A and industry consolidation.
Source: Capital IQ as of 03/31/2022
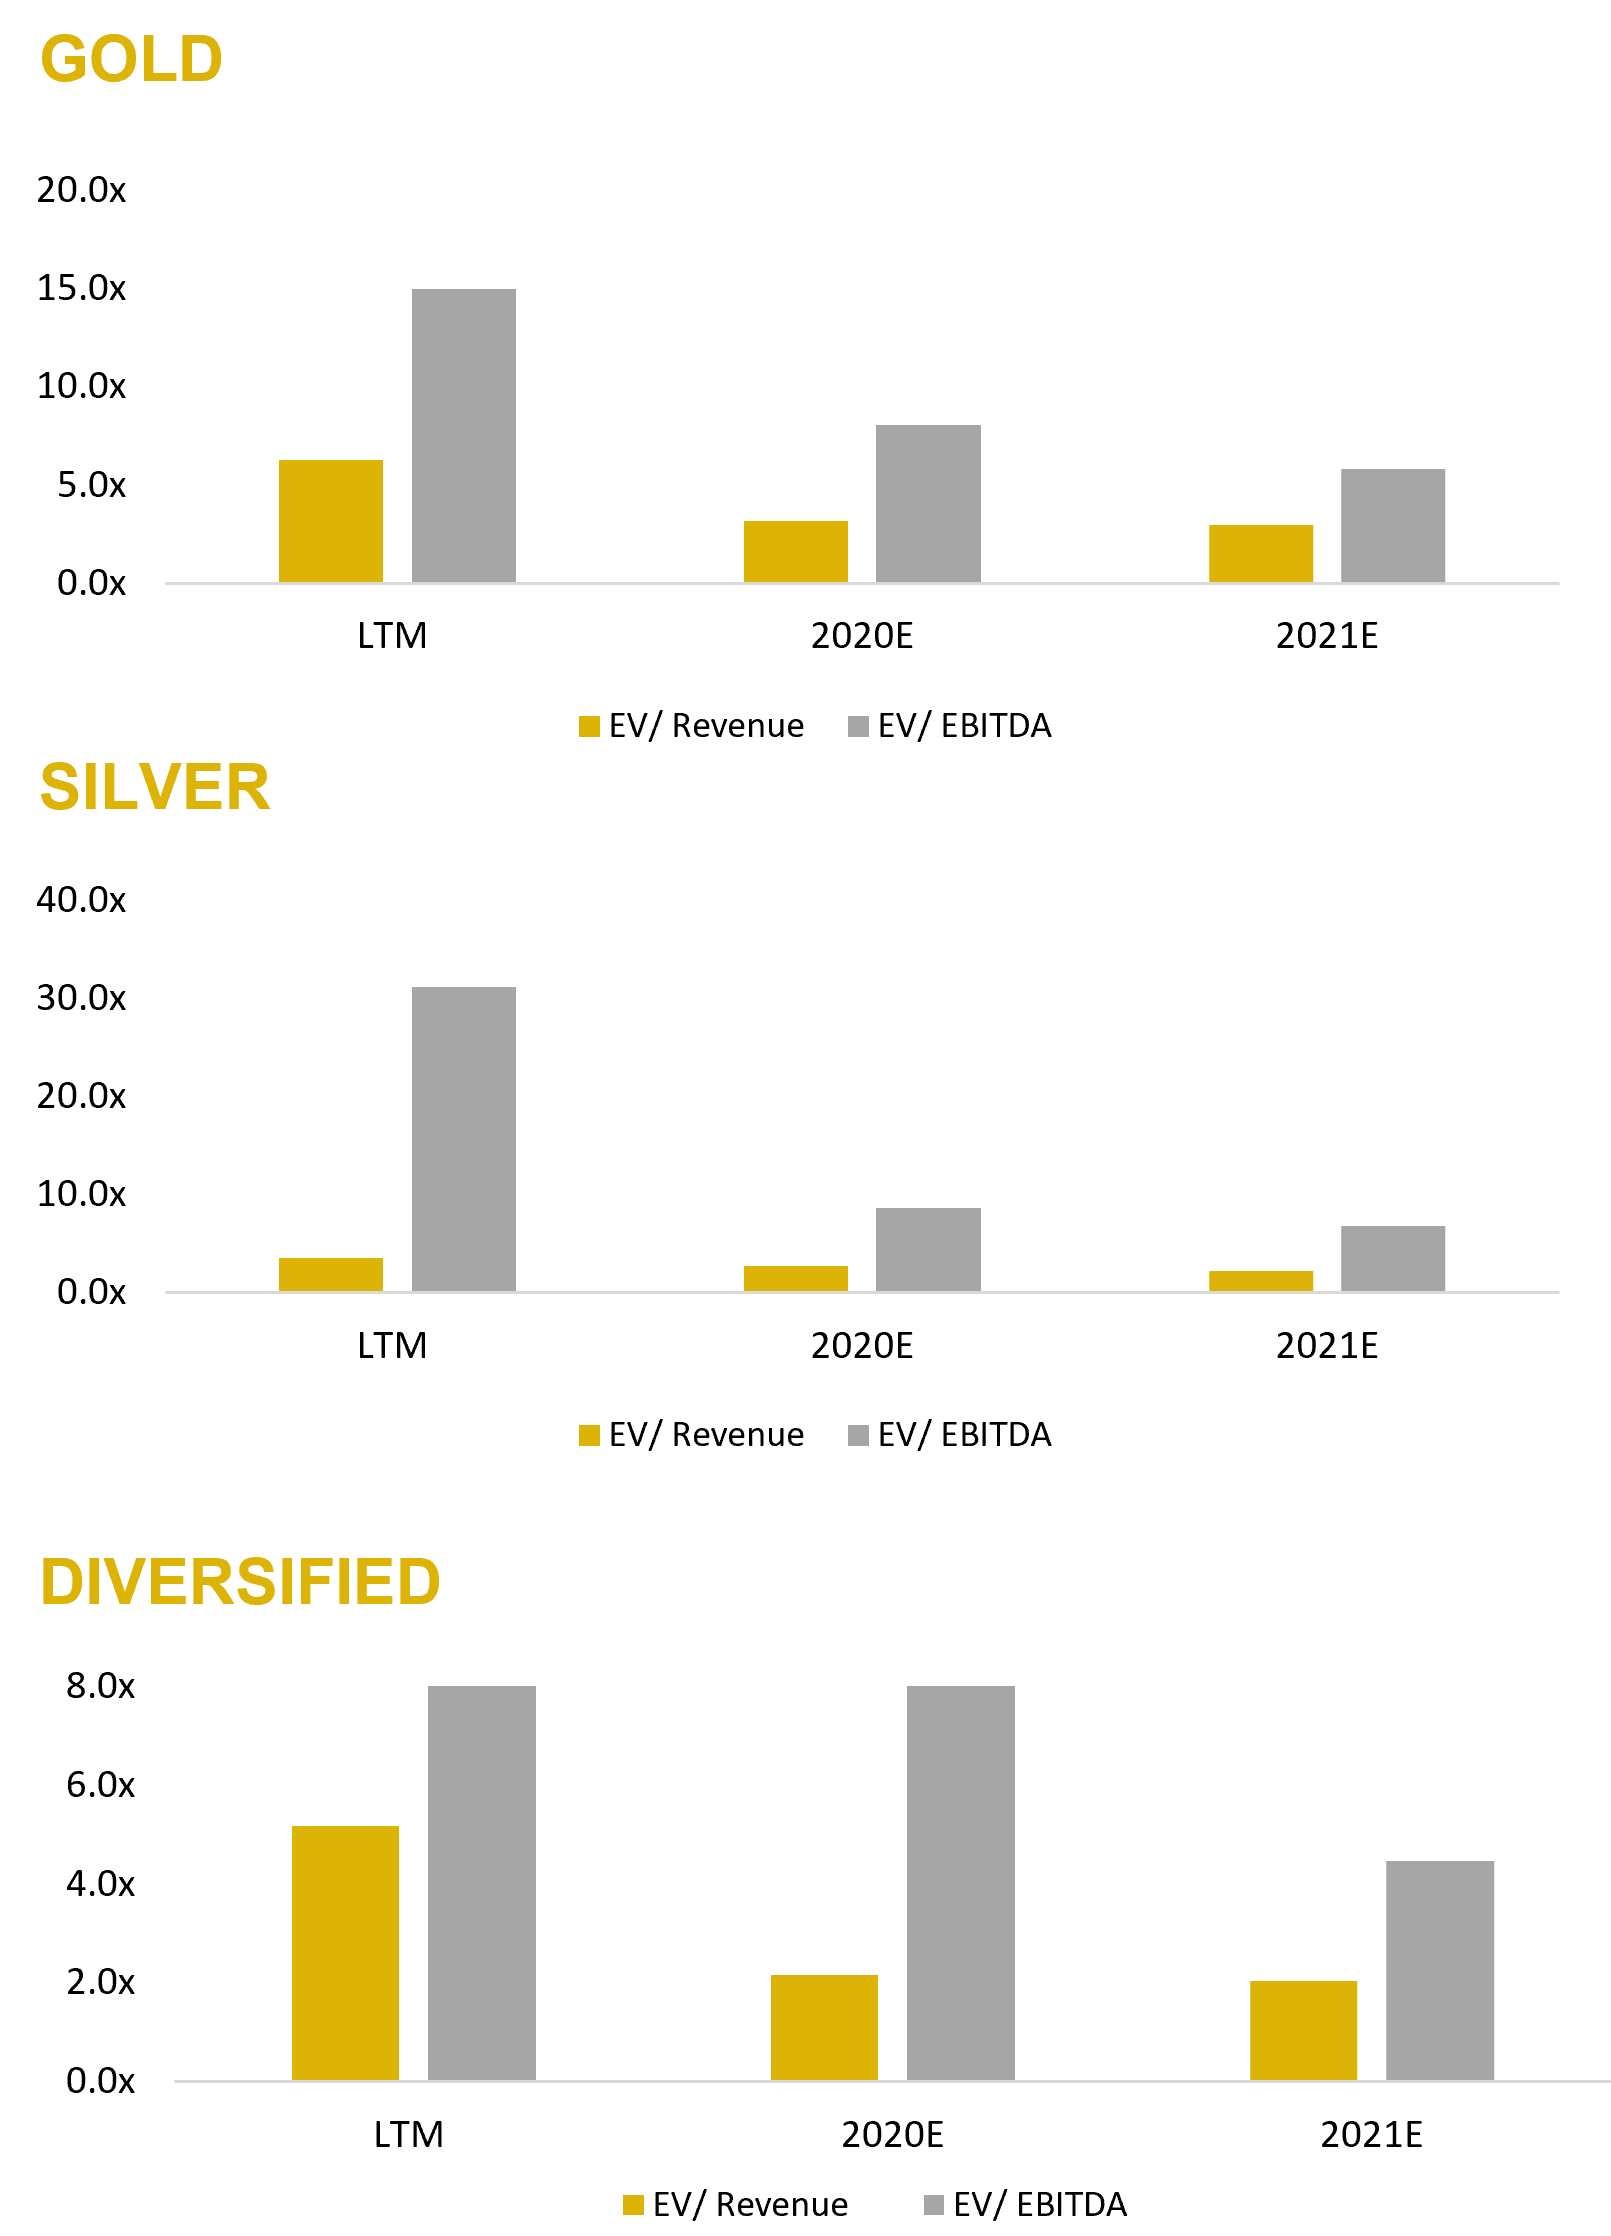
Gold Mining – Comparable Tables
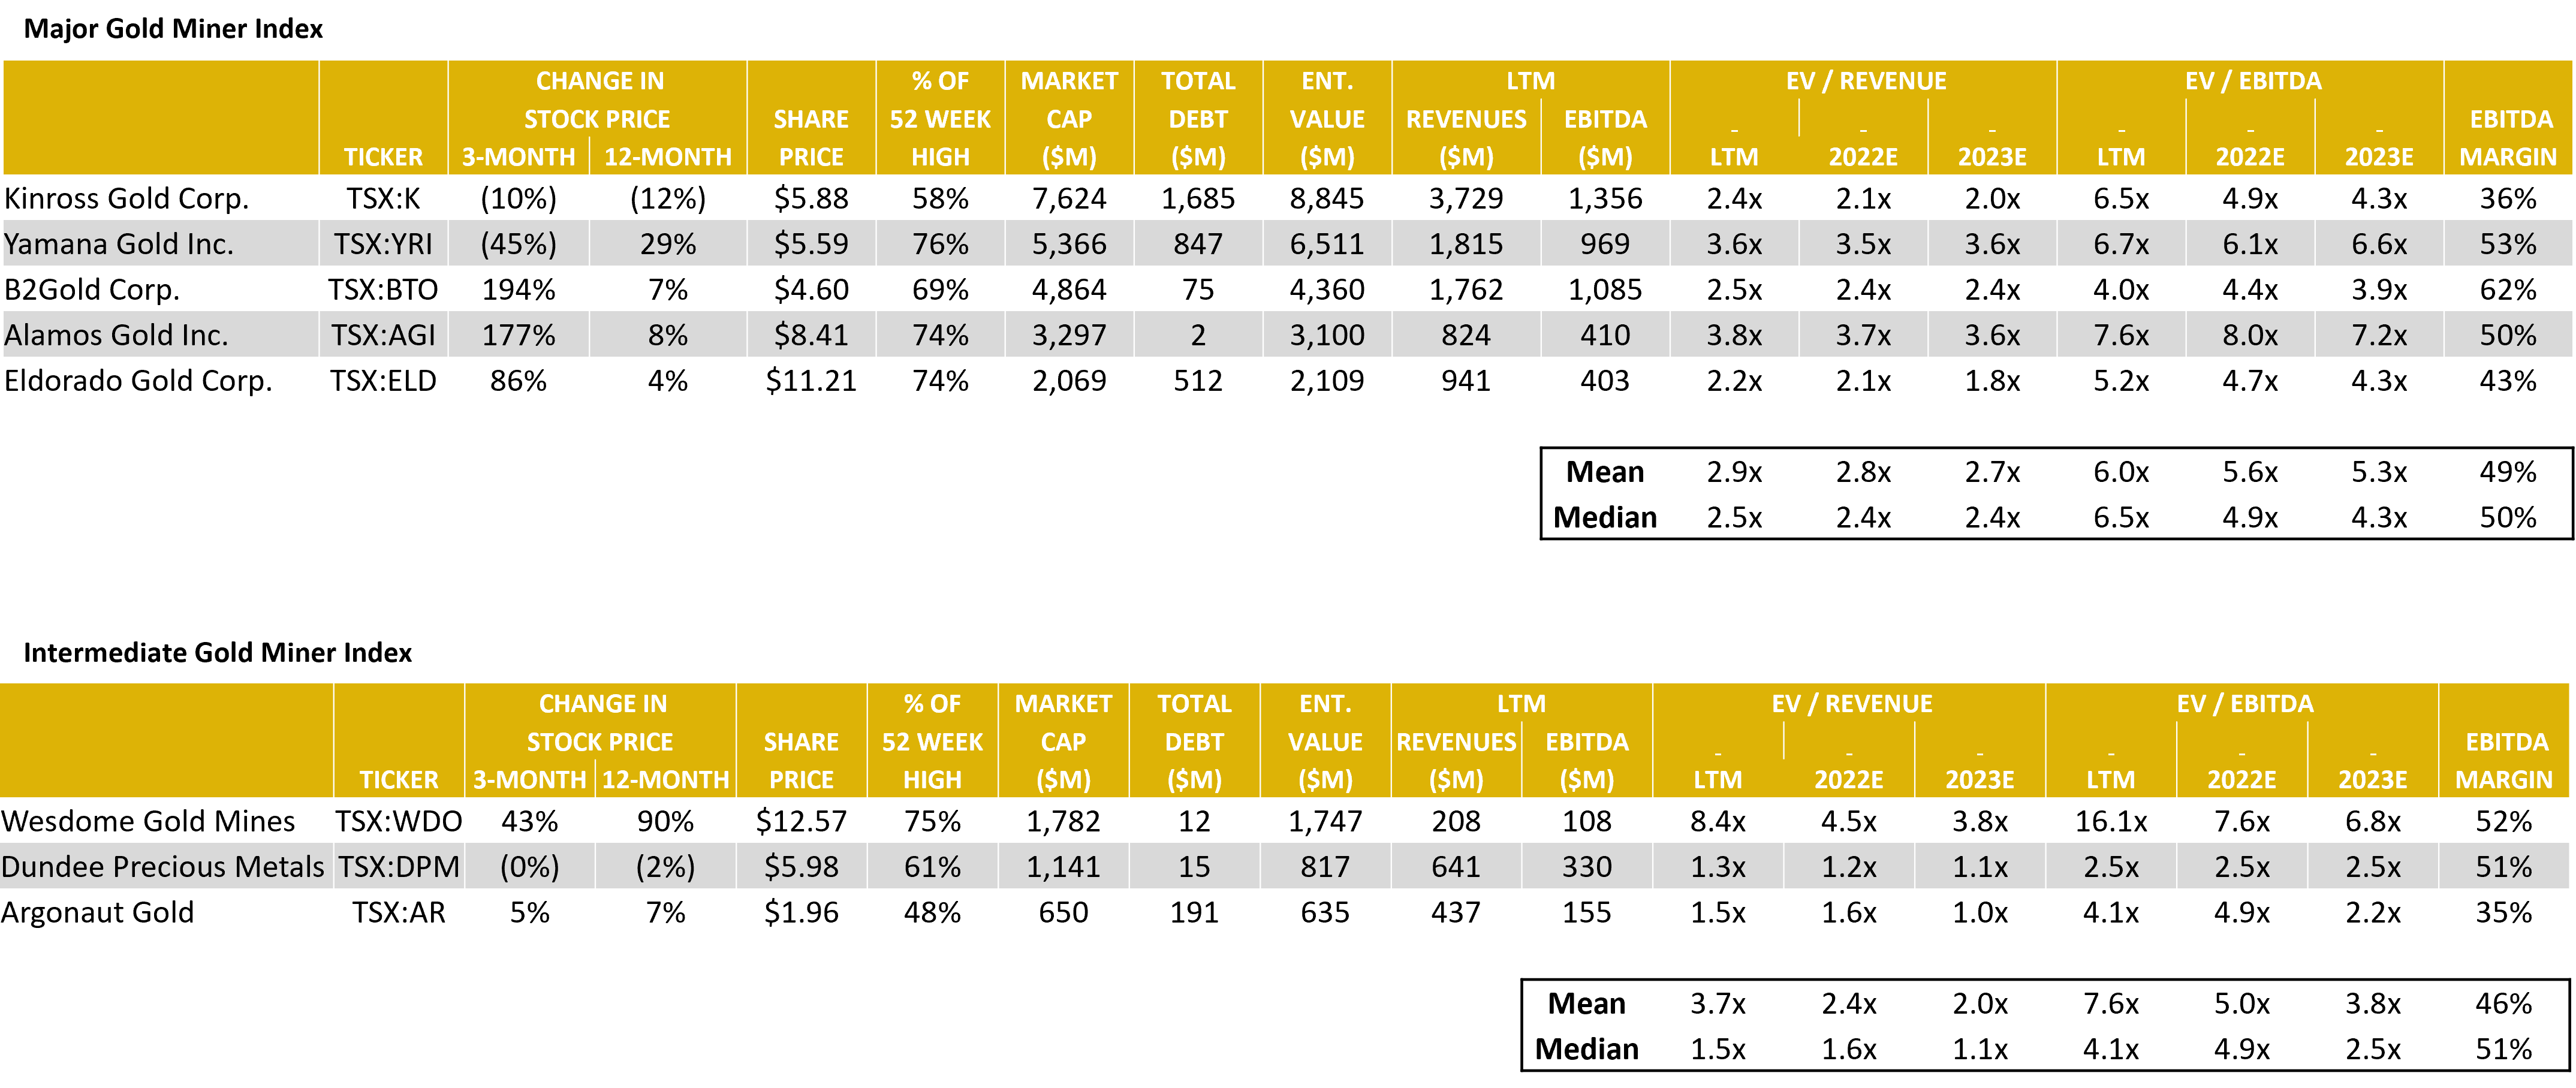
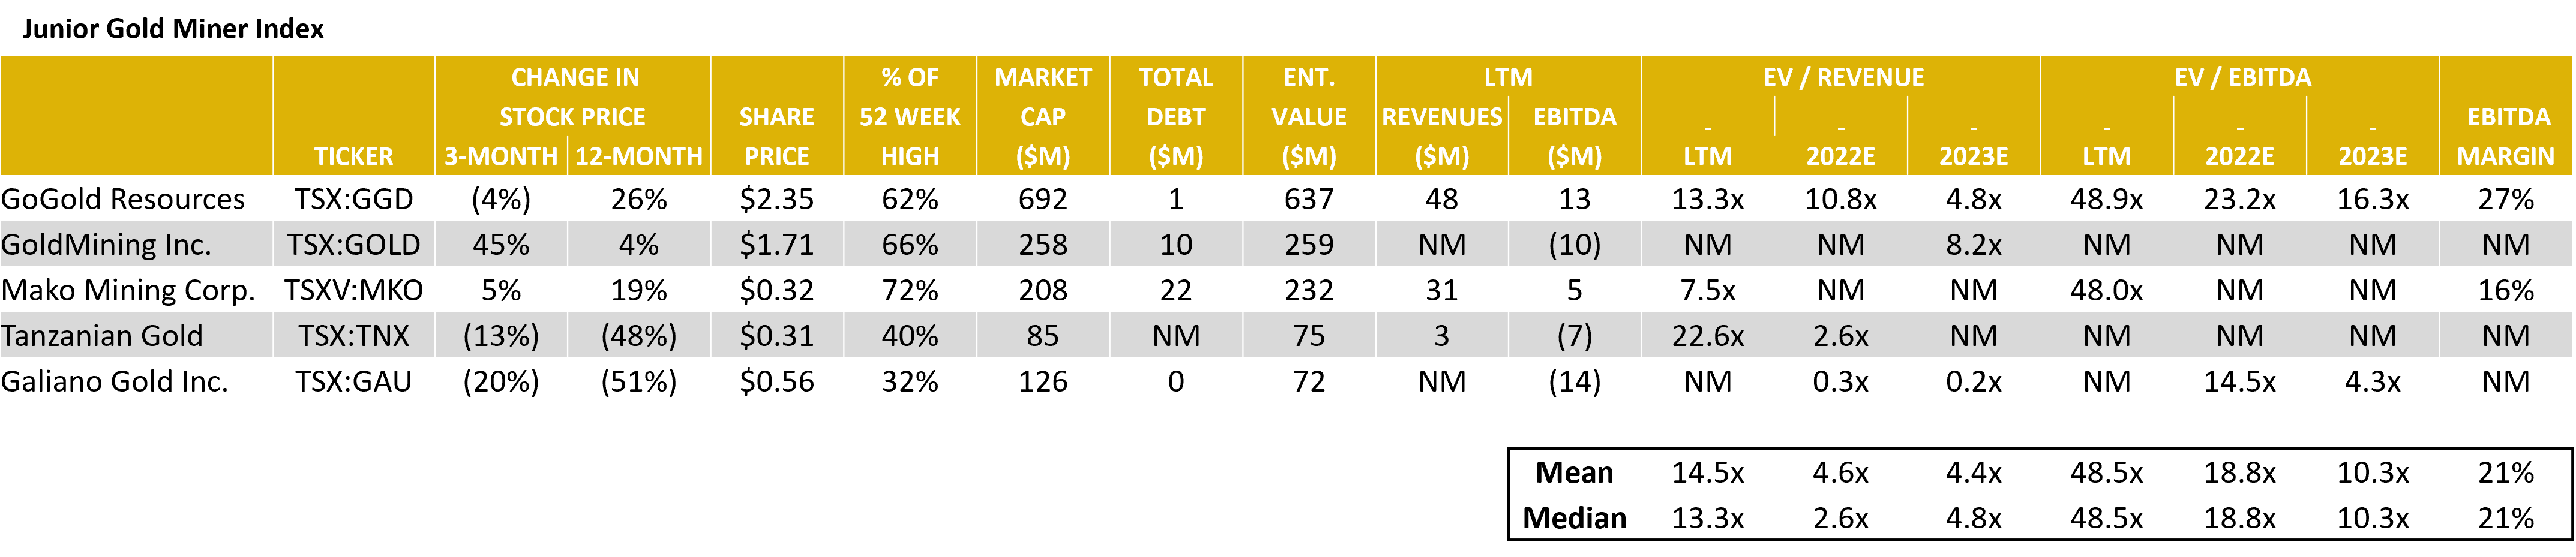
Source: Capital IQ as of 03/31/2022
Gold Mining – LTM Equity Performance
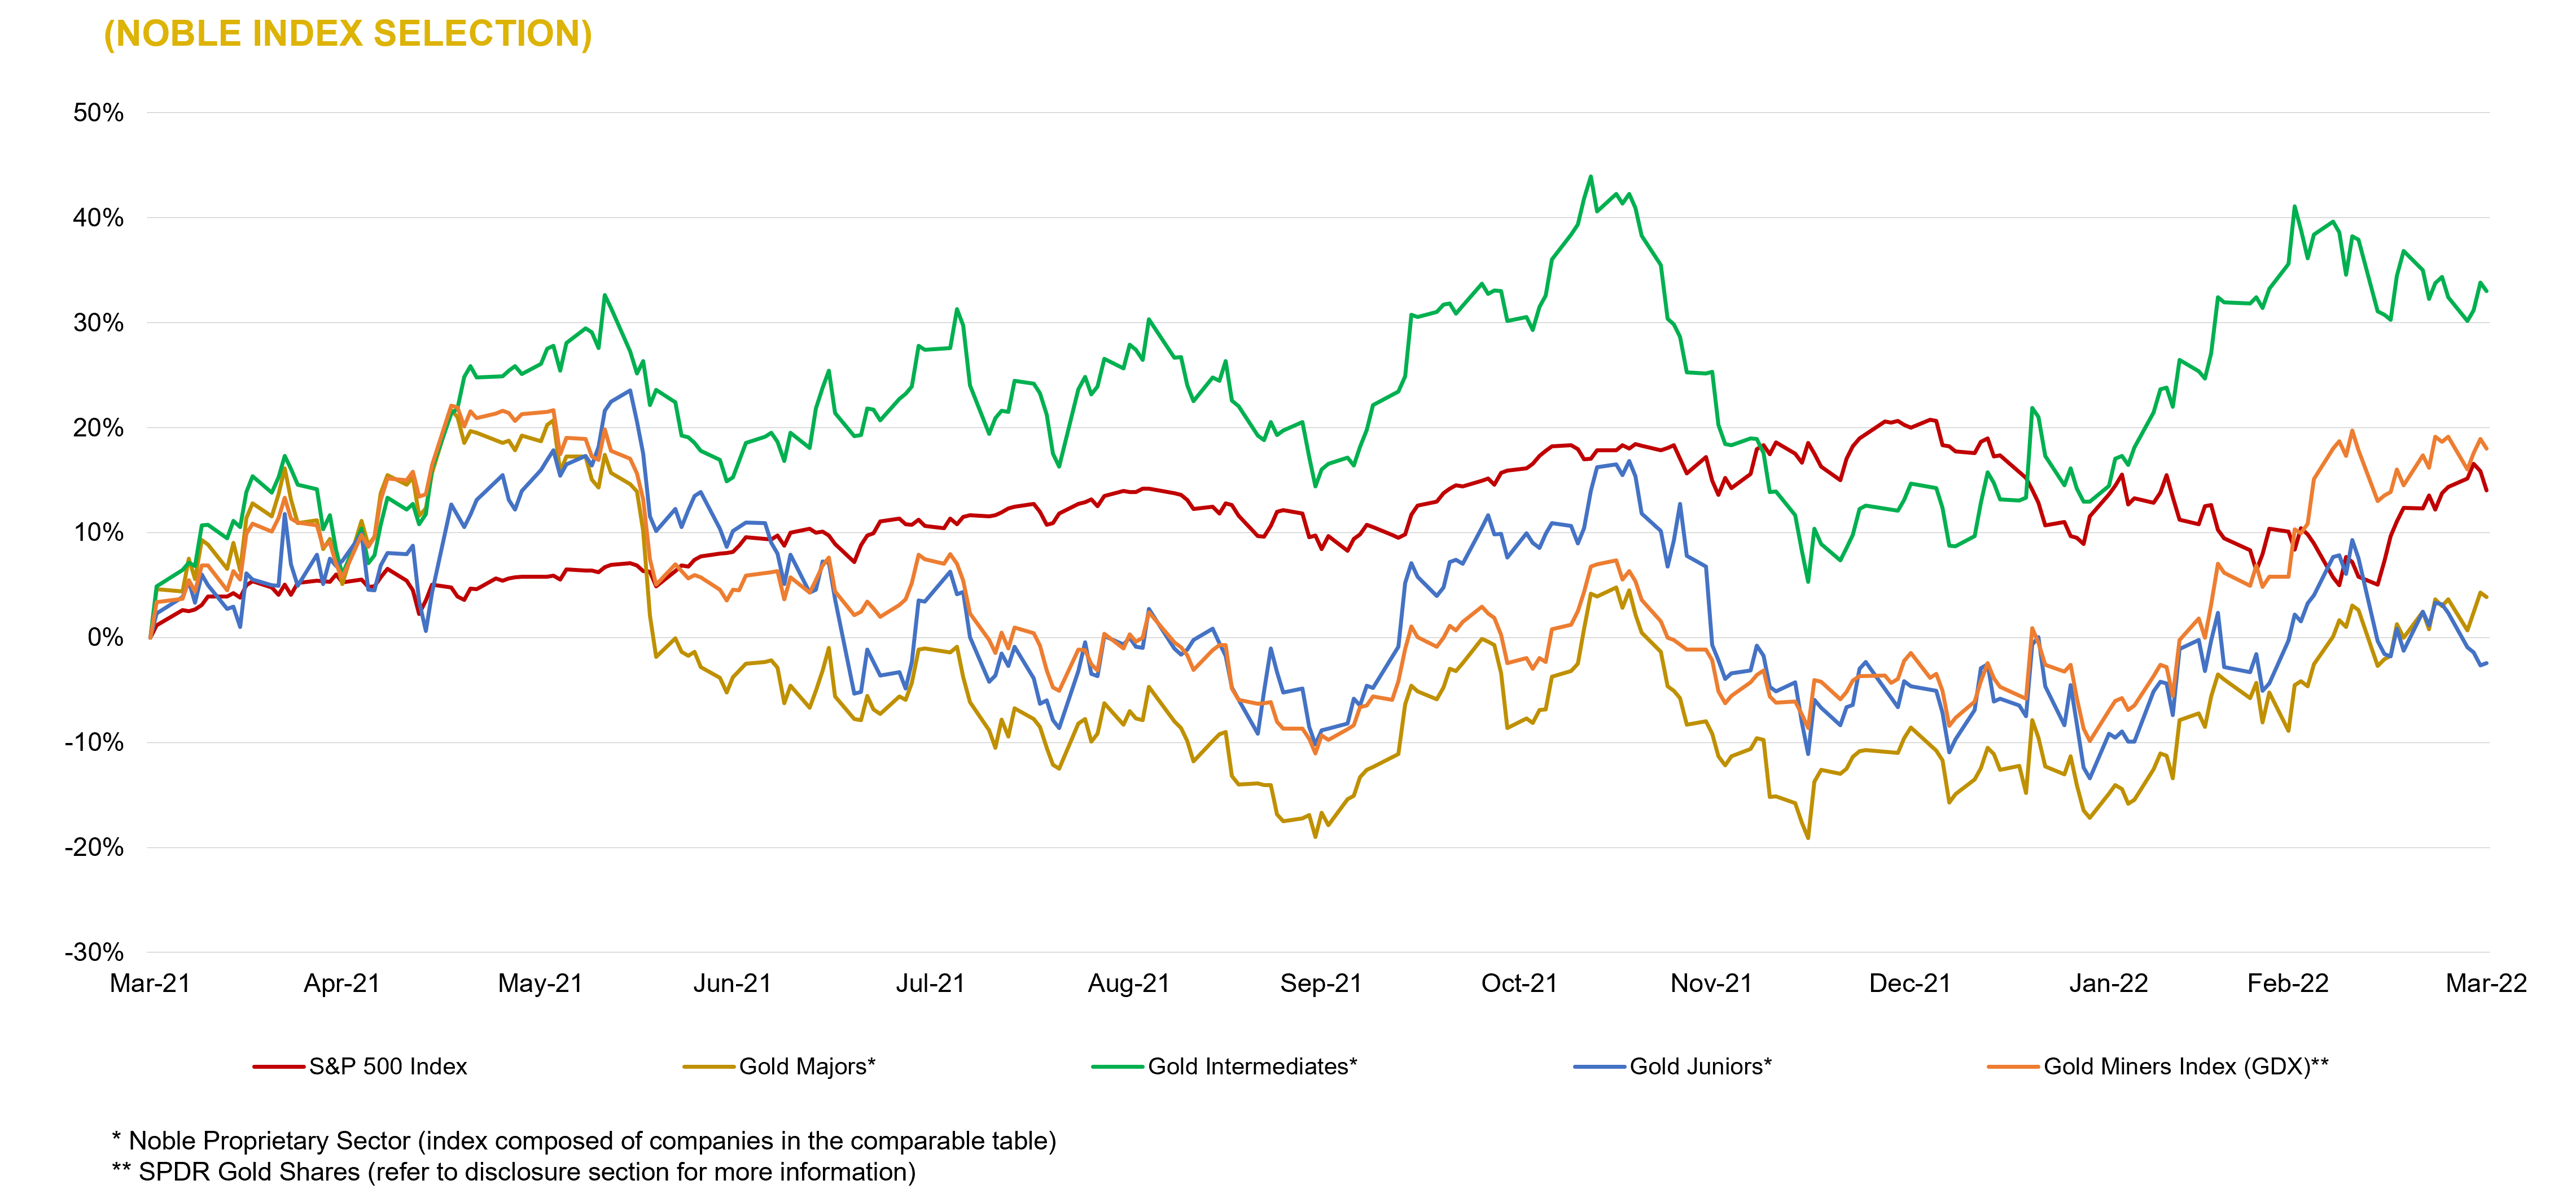
Source: Capital IQ as of 03/31/2022
Silver Mining – Comparable Tables
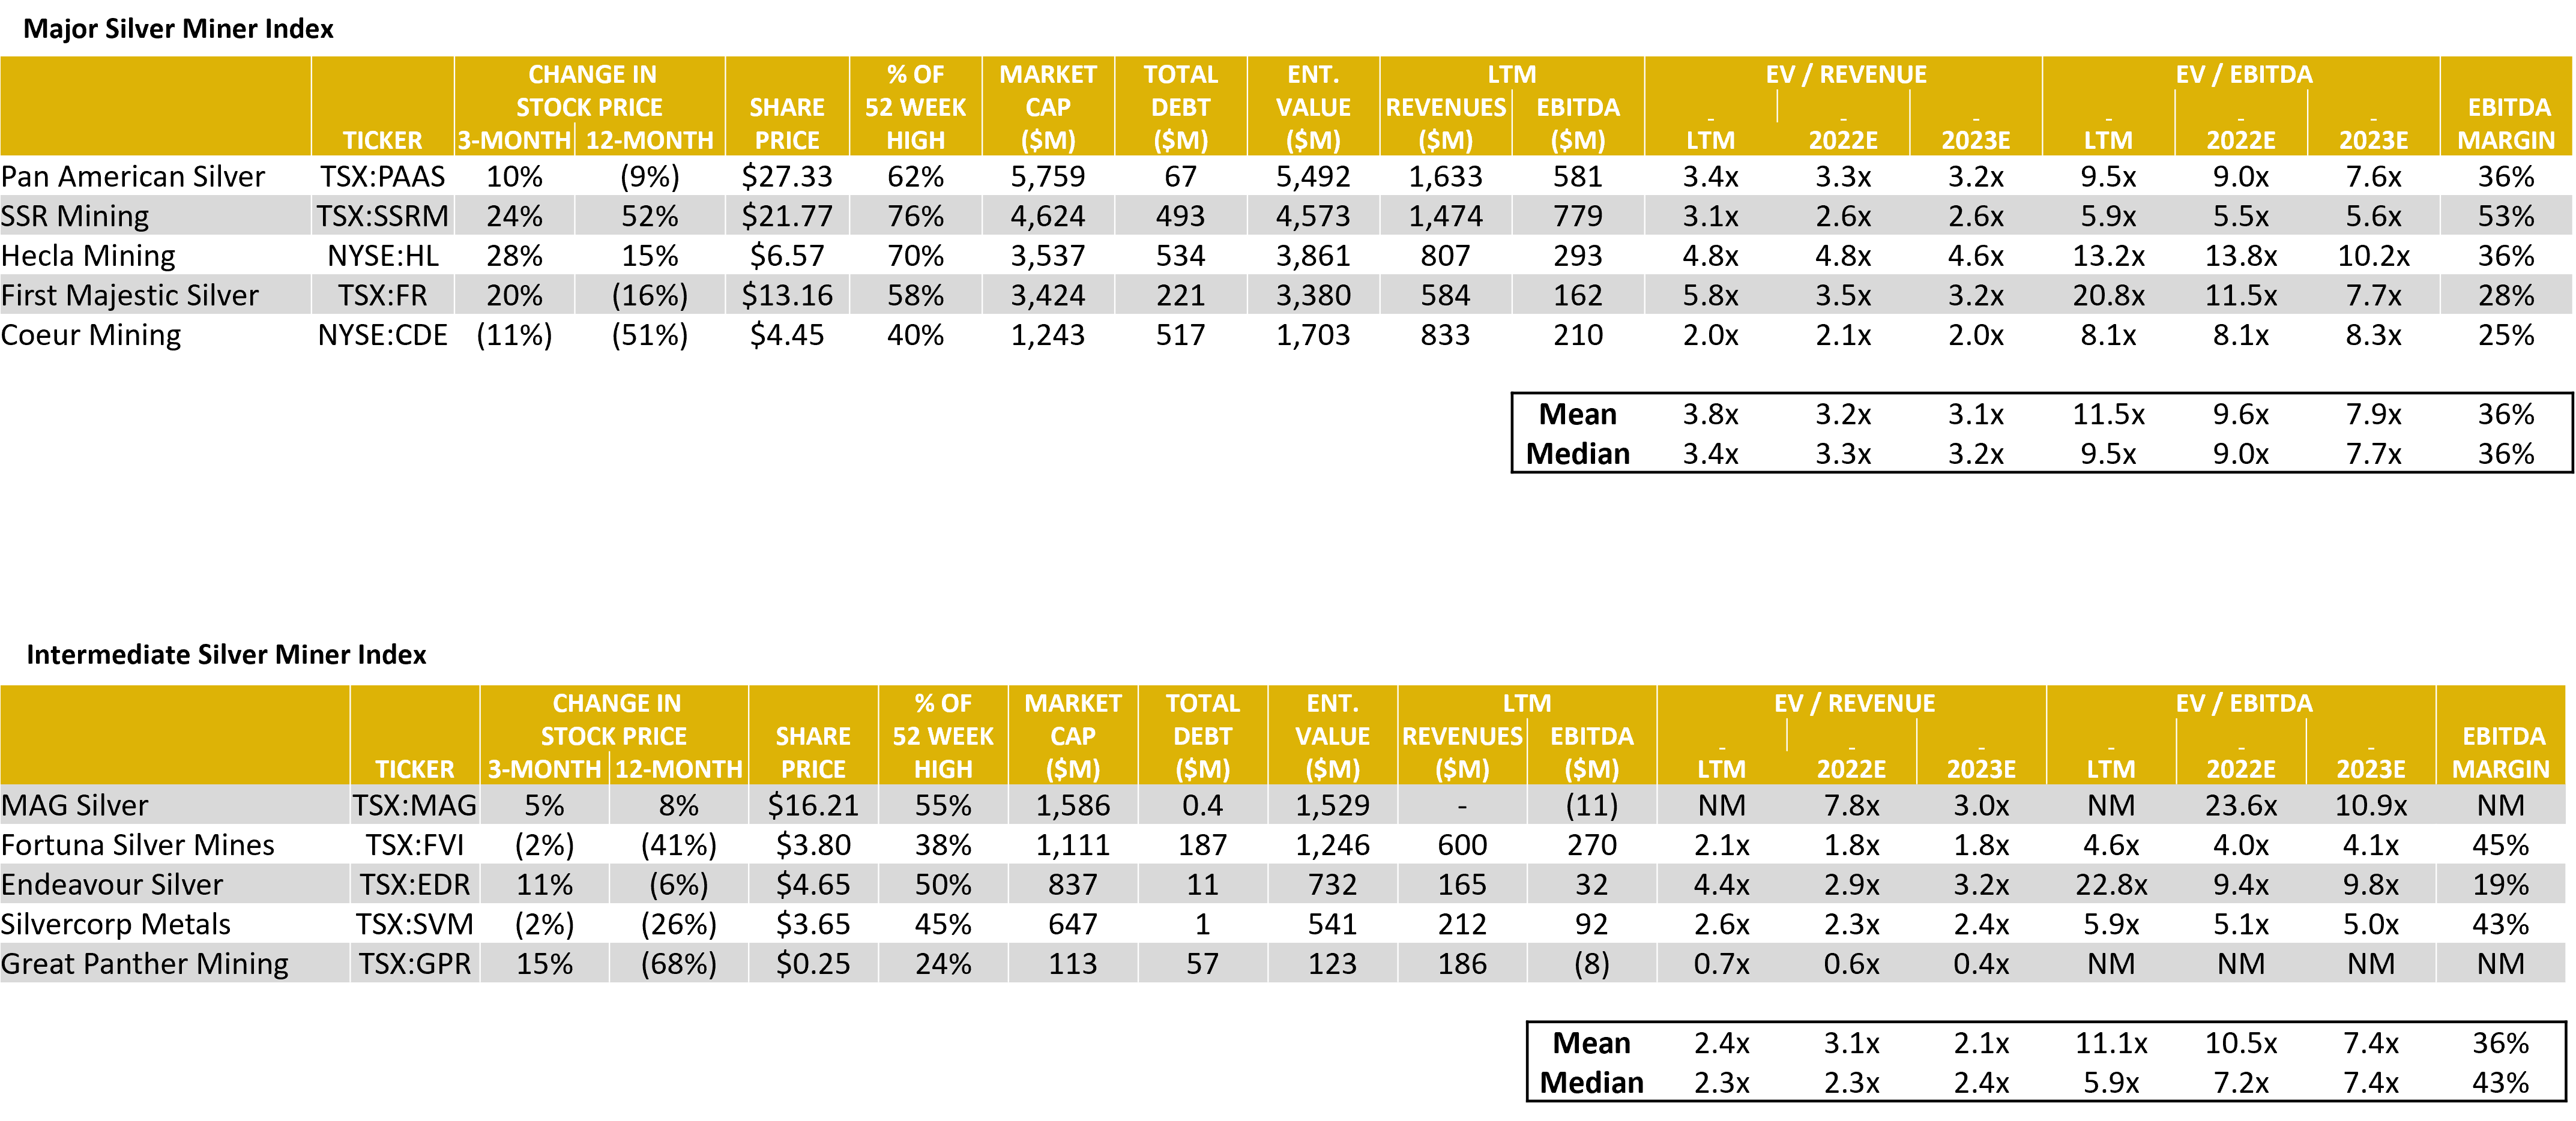
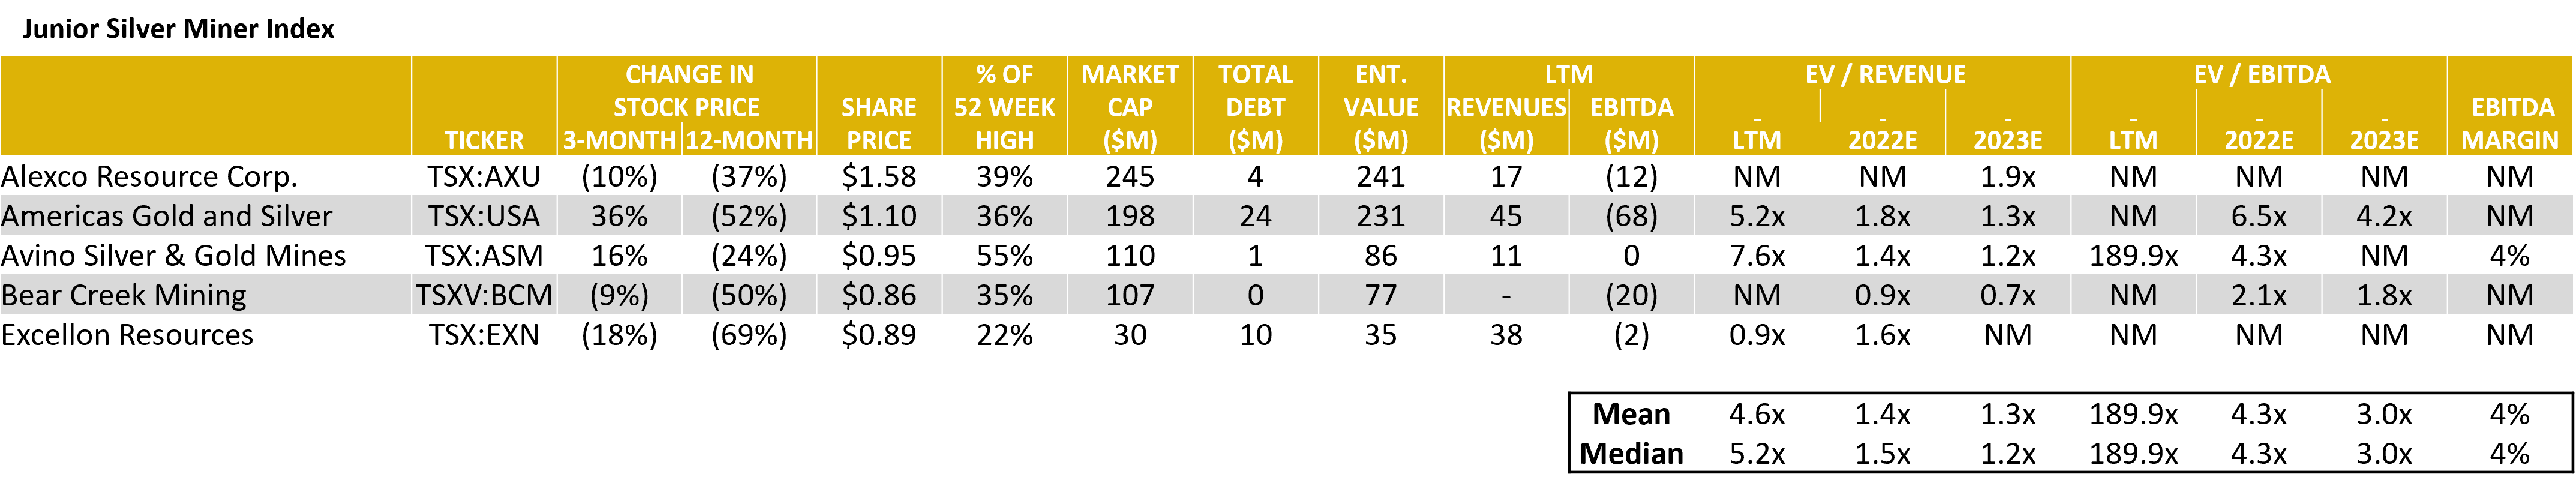
Source: Capital IQ as of 03/31/2022
Silver Mining – LTM Equity Performance
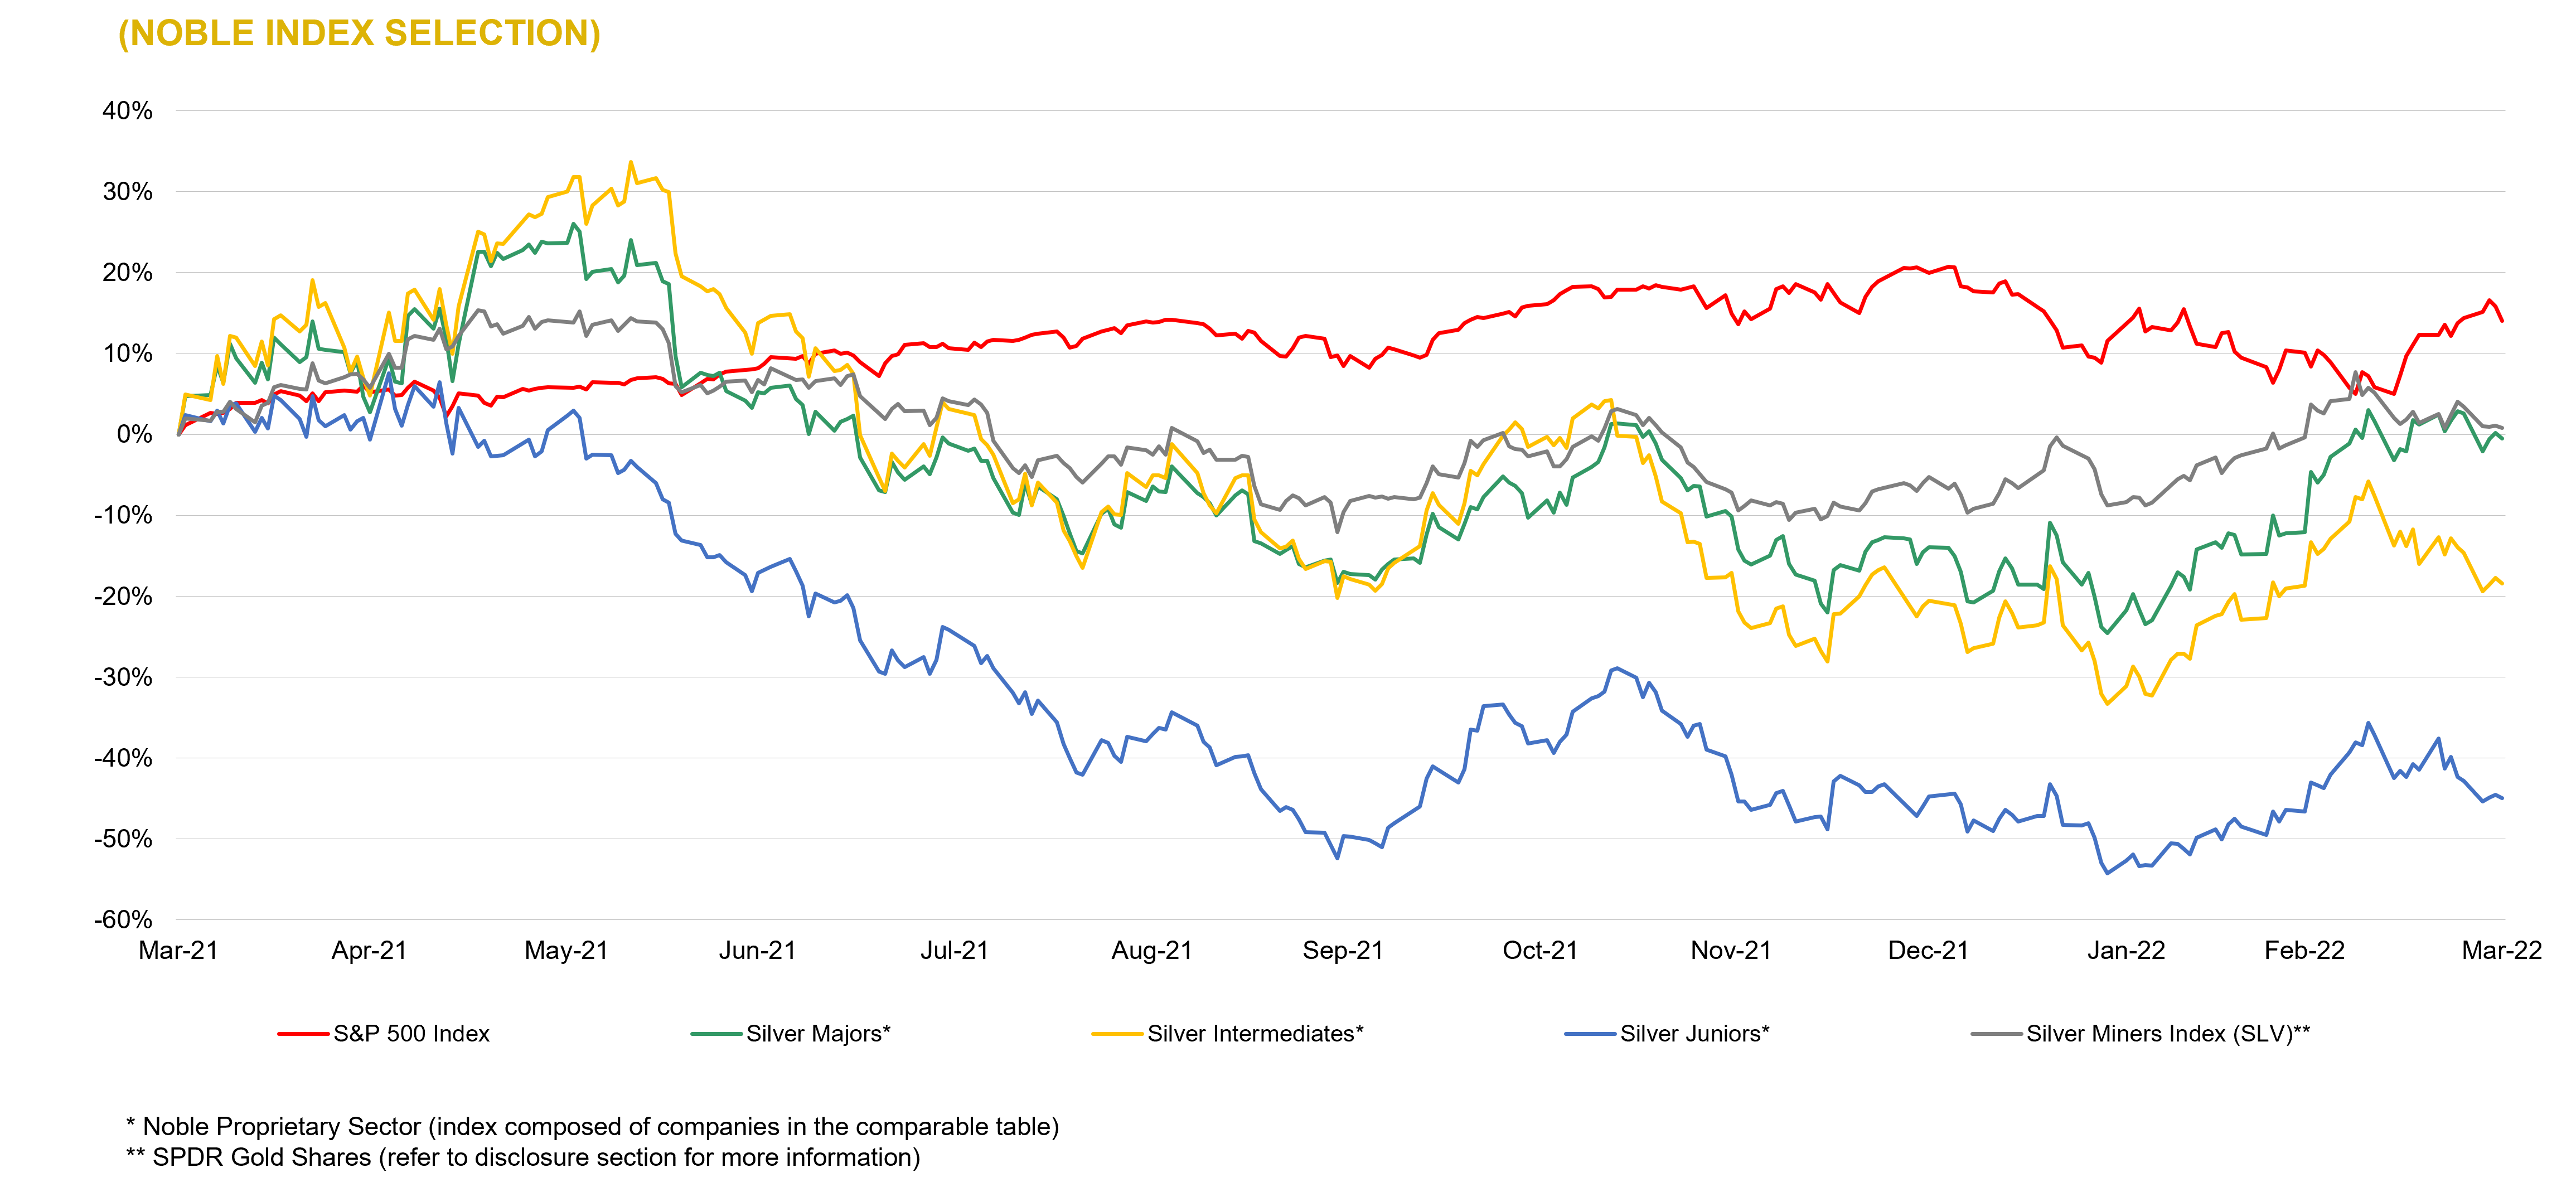
Source: Capital IQ as of 03/31/2022
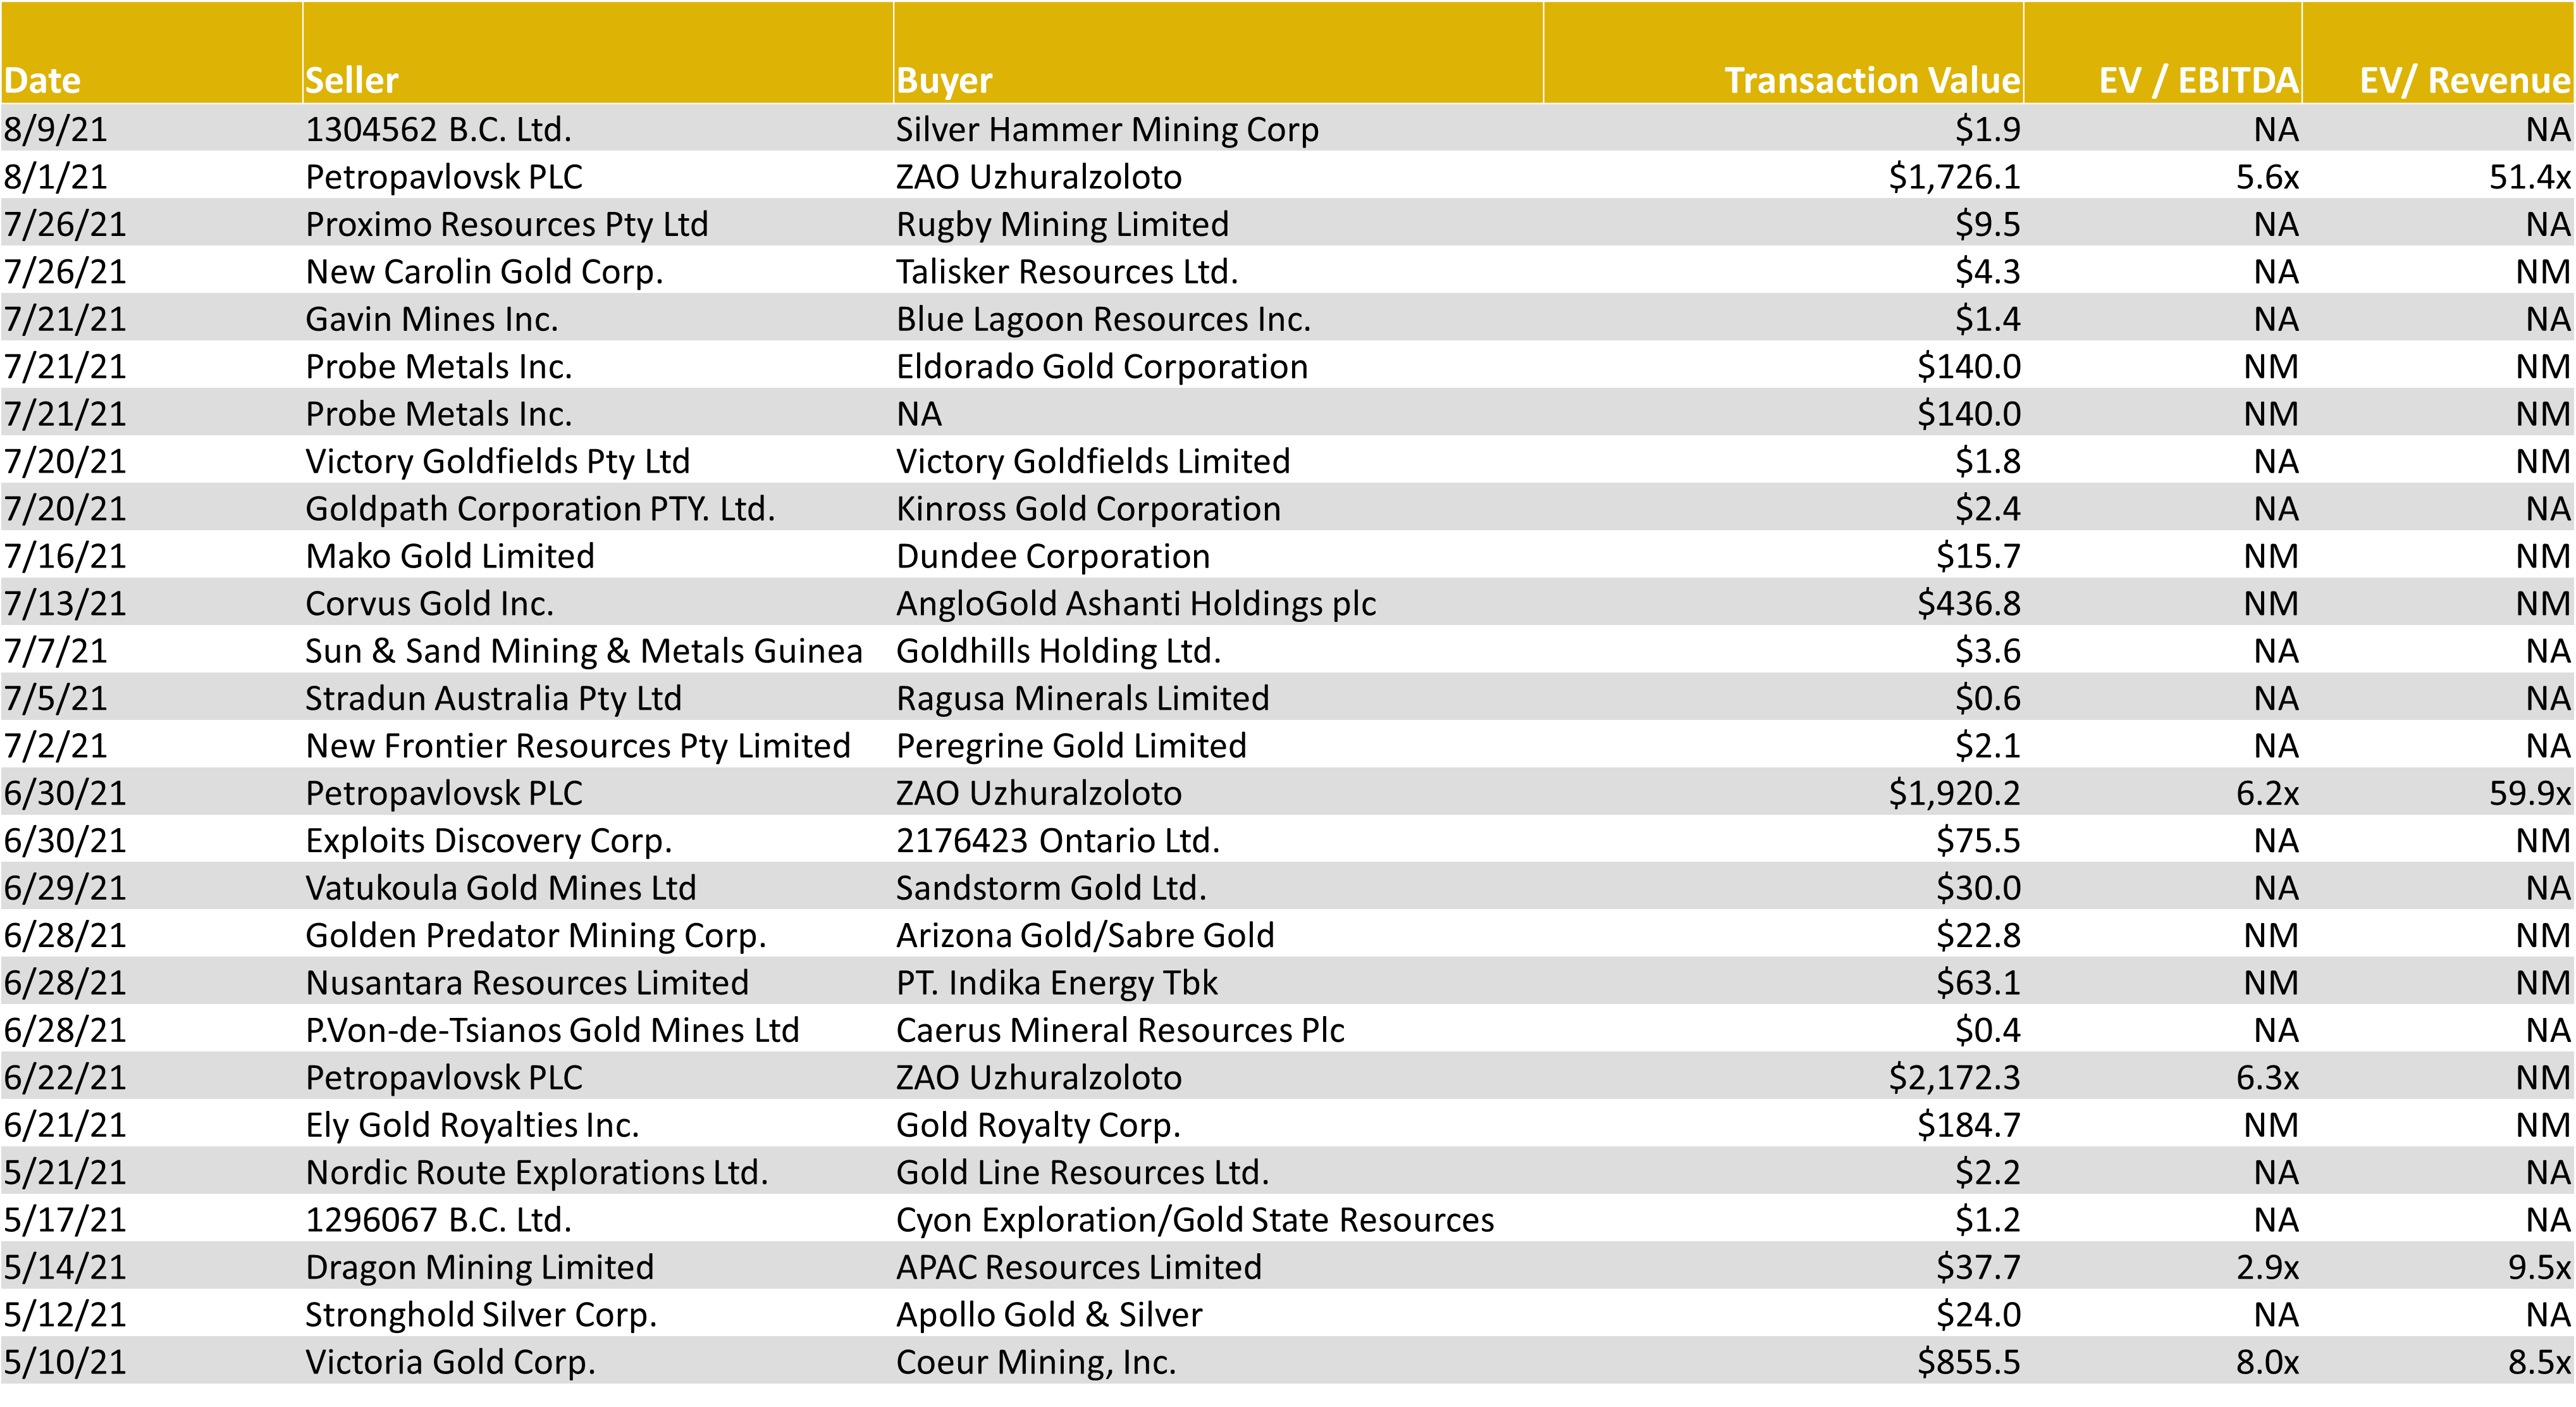
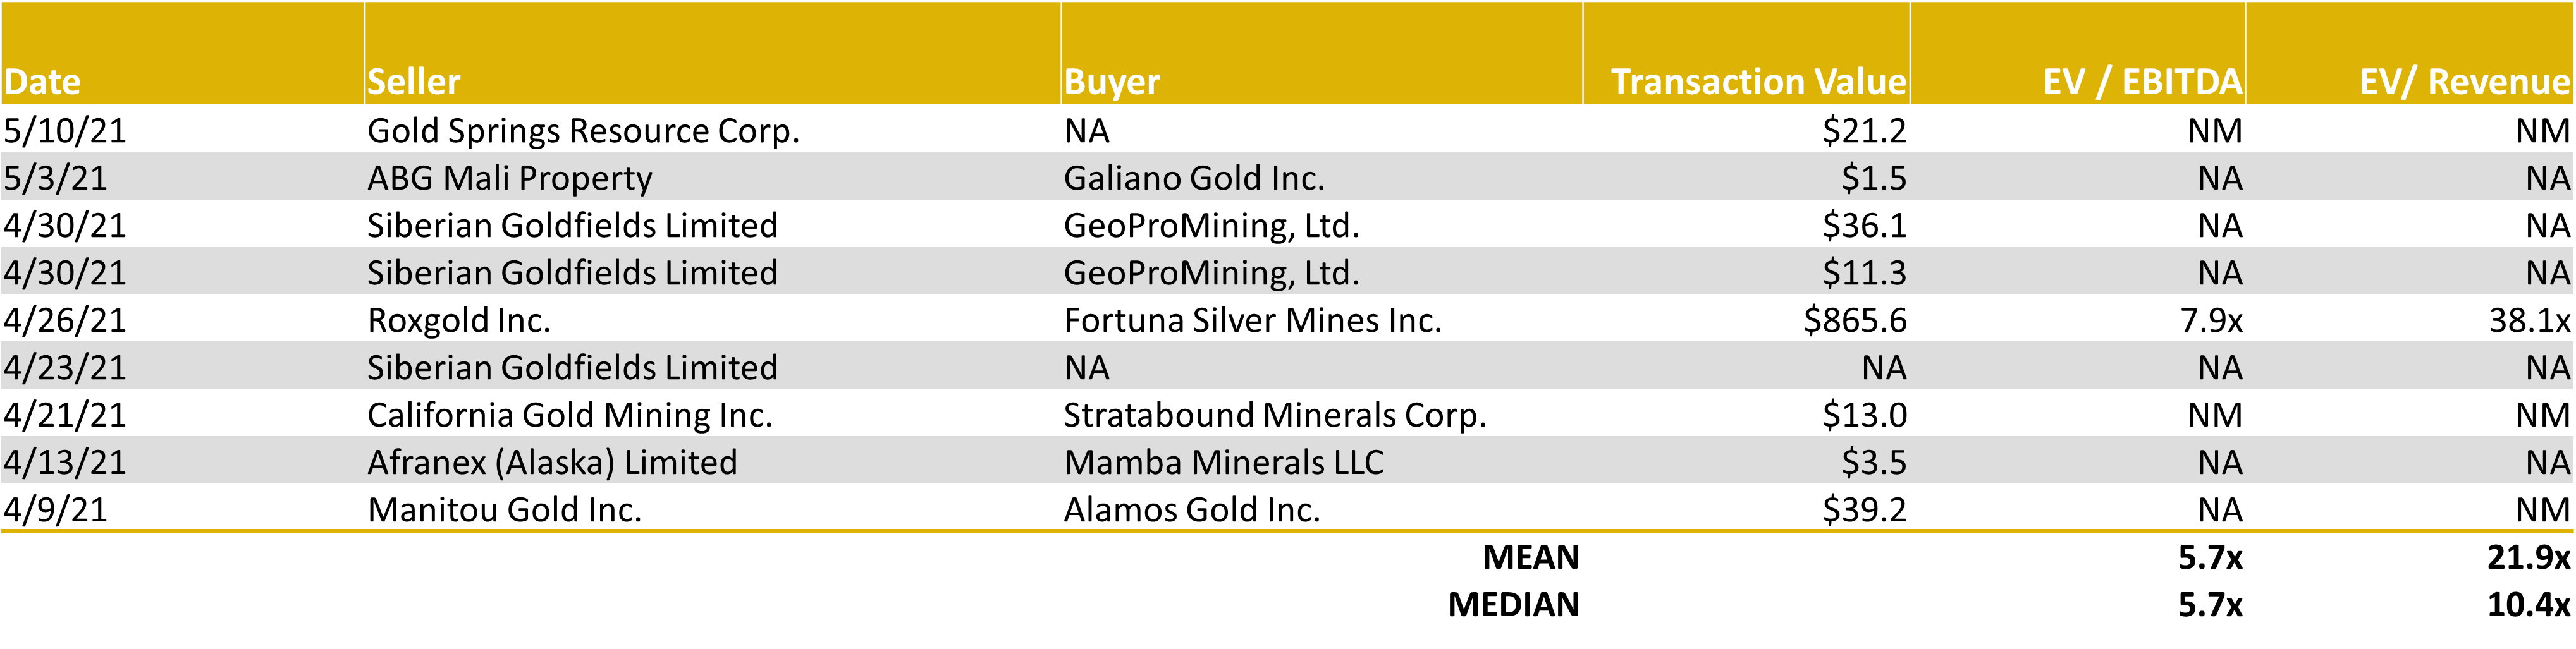
Gold & Silver – LTM Global M&A Activity
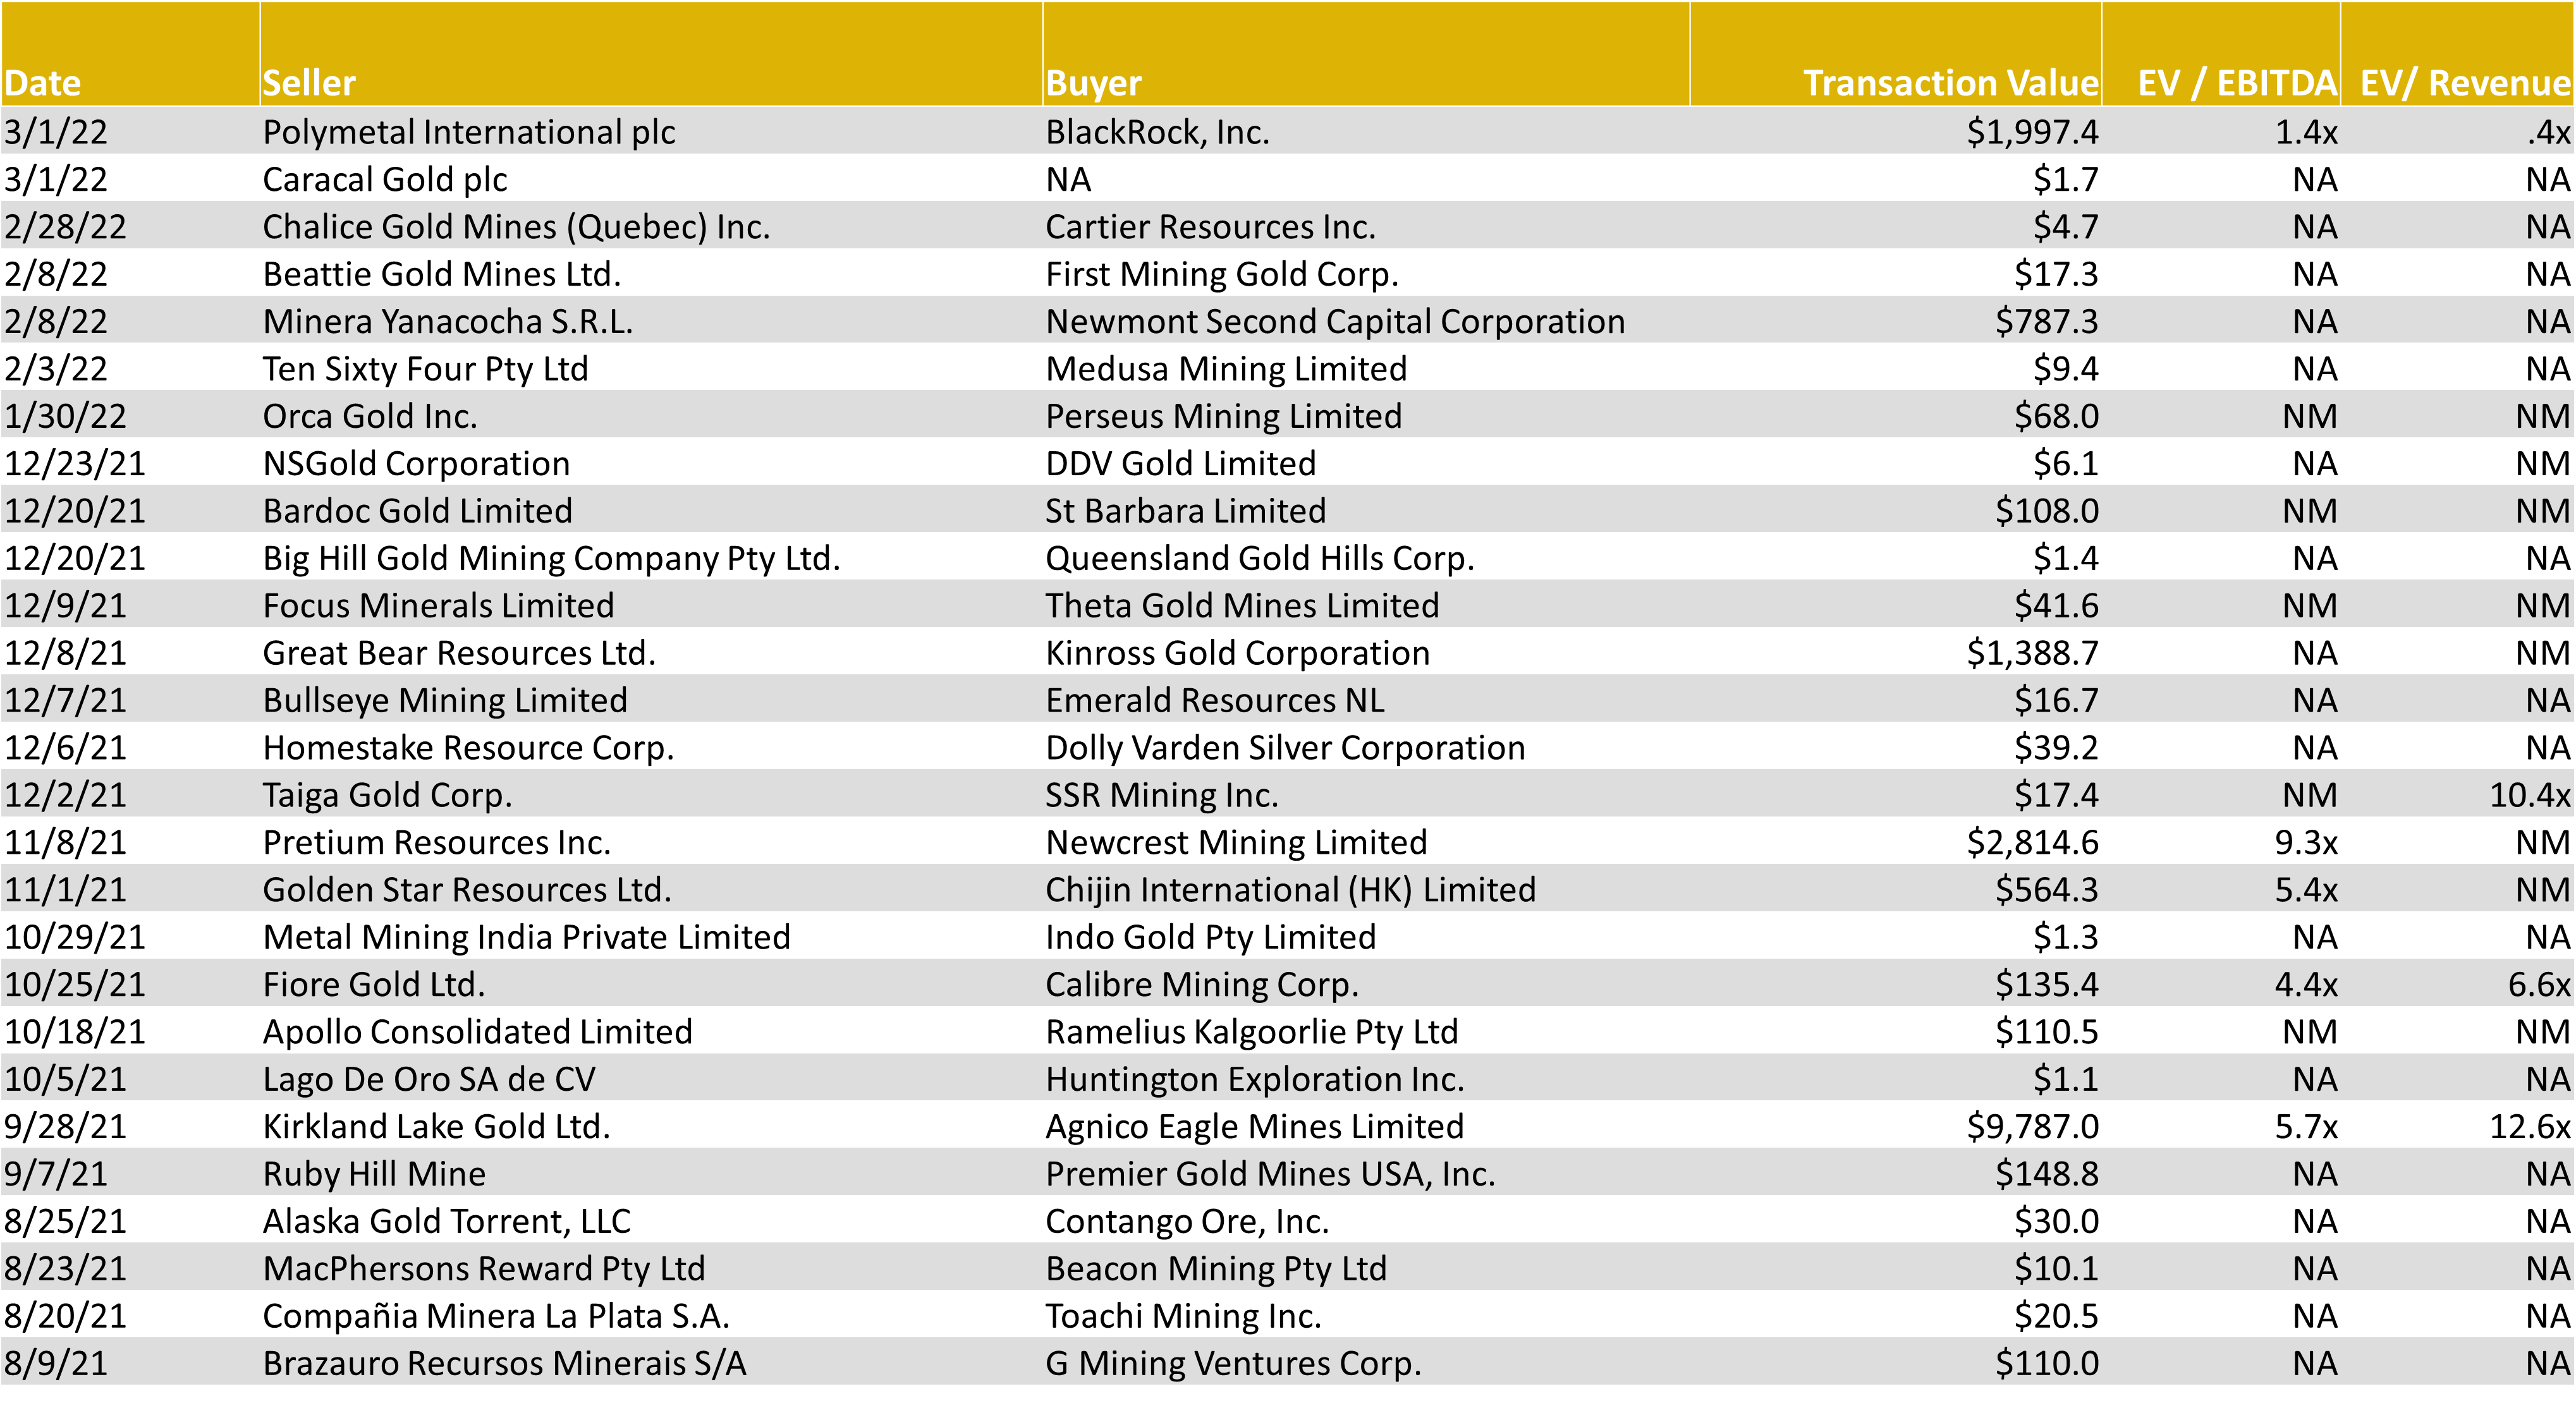
Source: Capital IQ as of 03/31/2022
Diversified Mining – Comparable Tables
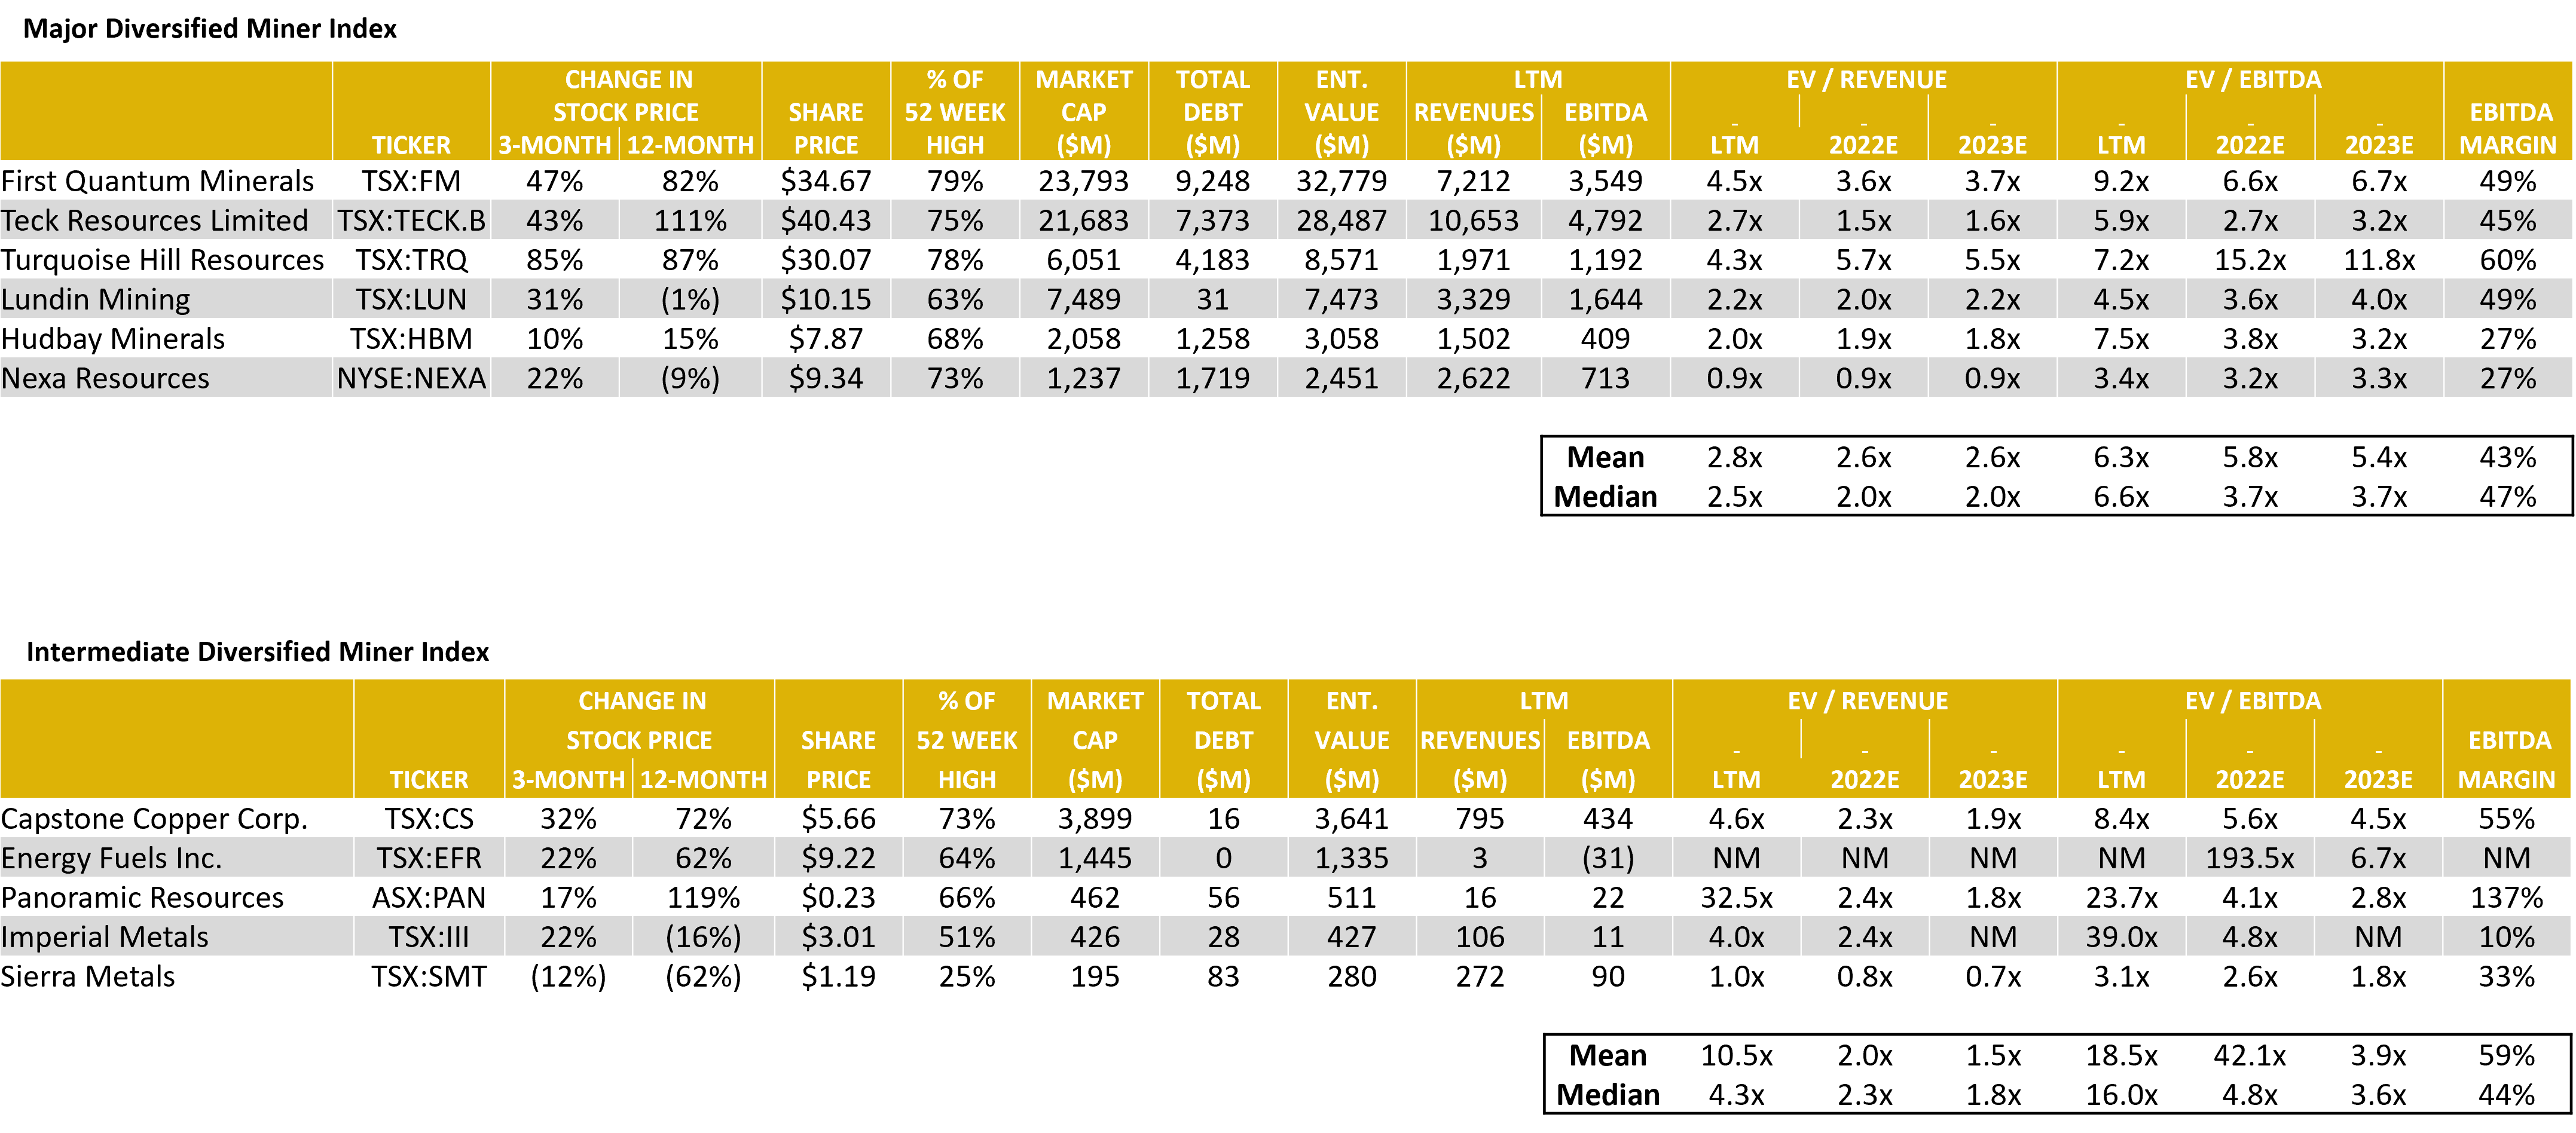
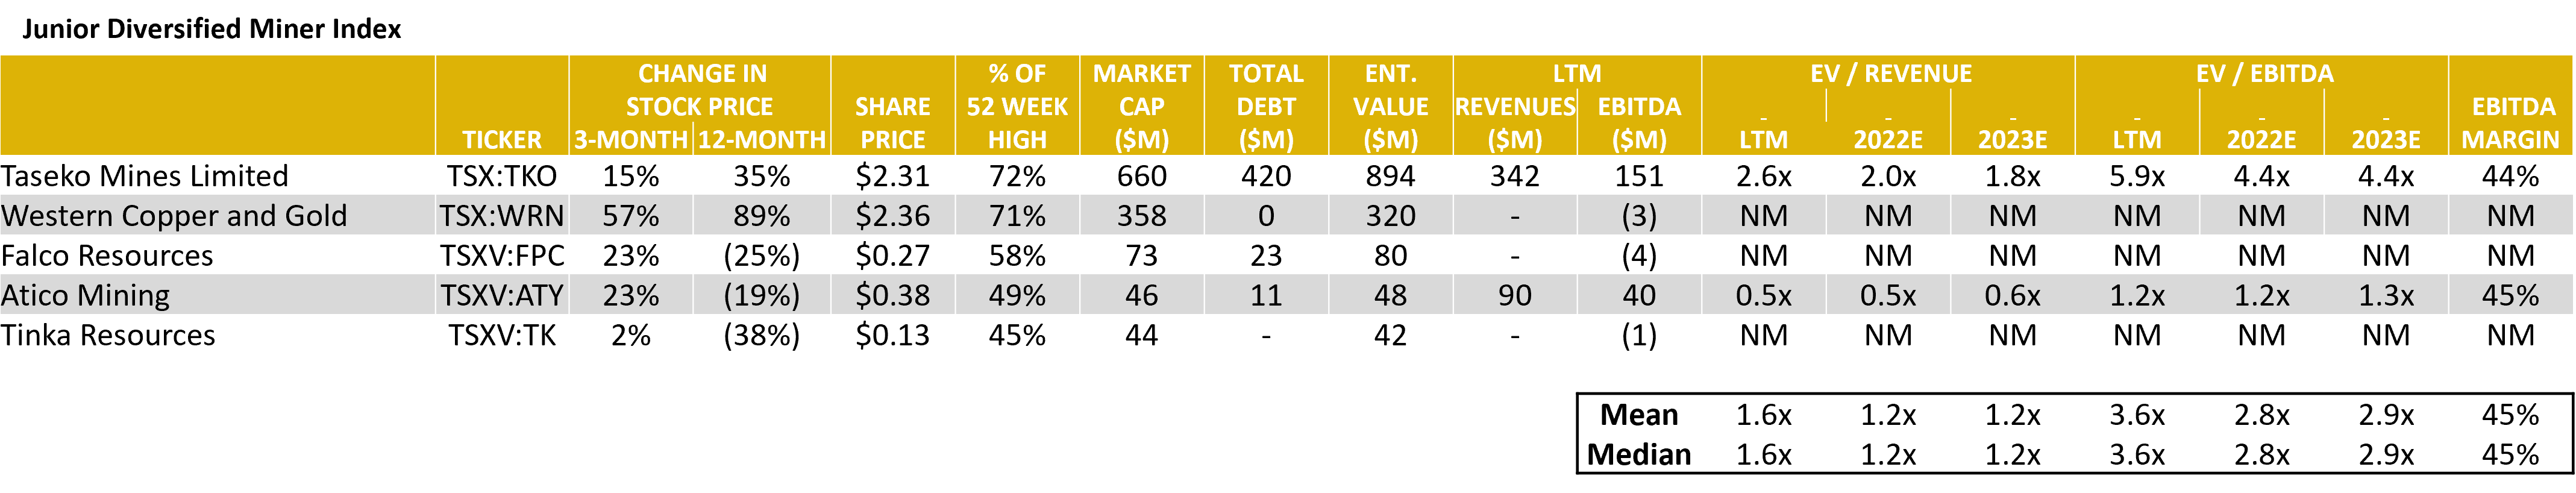
Source: Capital IQ as of 03/31/2022
Diversified Mining – LTM Equity Performance
Source: Capital IQ as of 03/31/2022
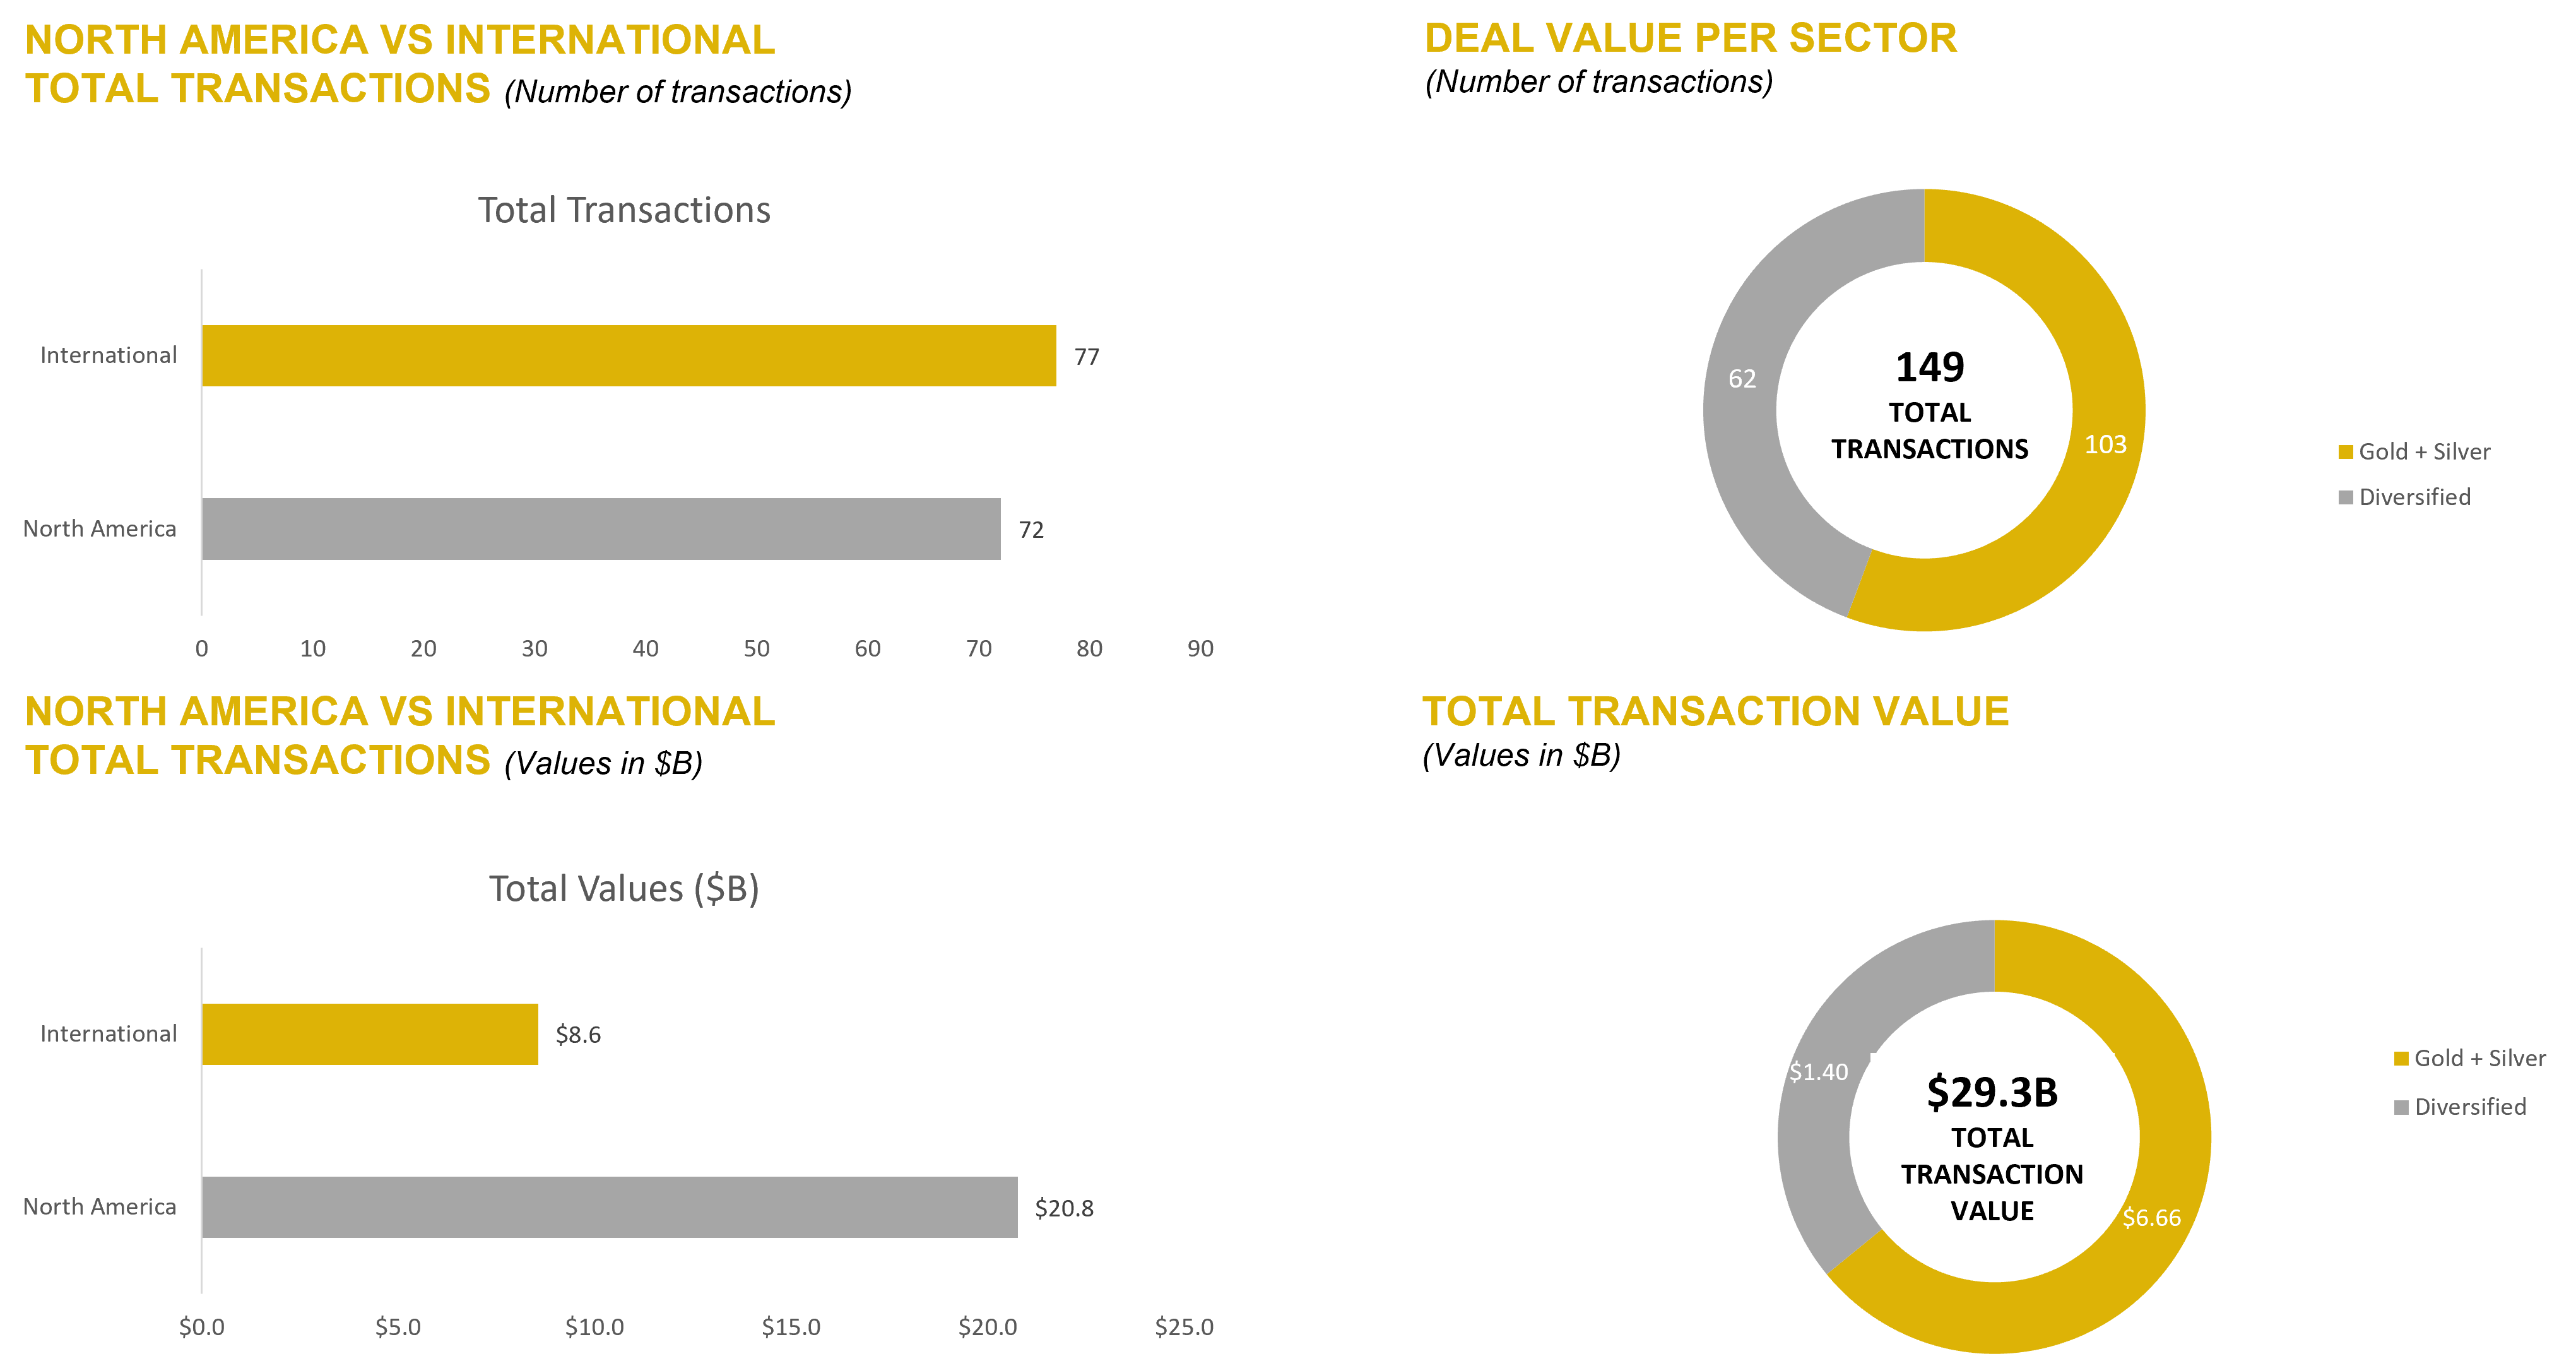
Diversified Mining – LTM Global M&A Activity
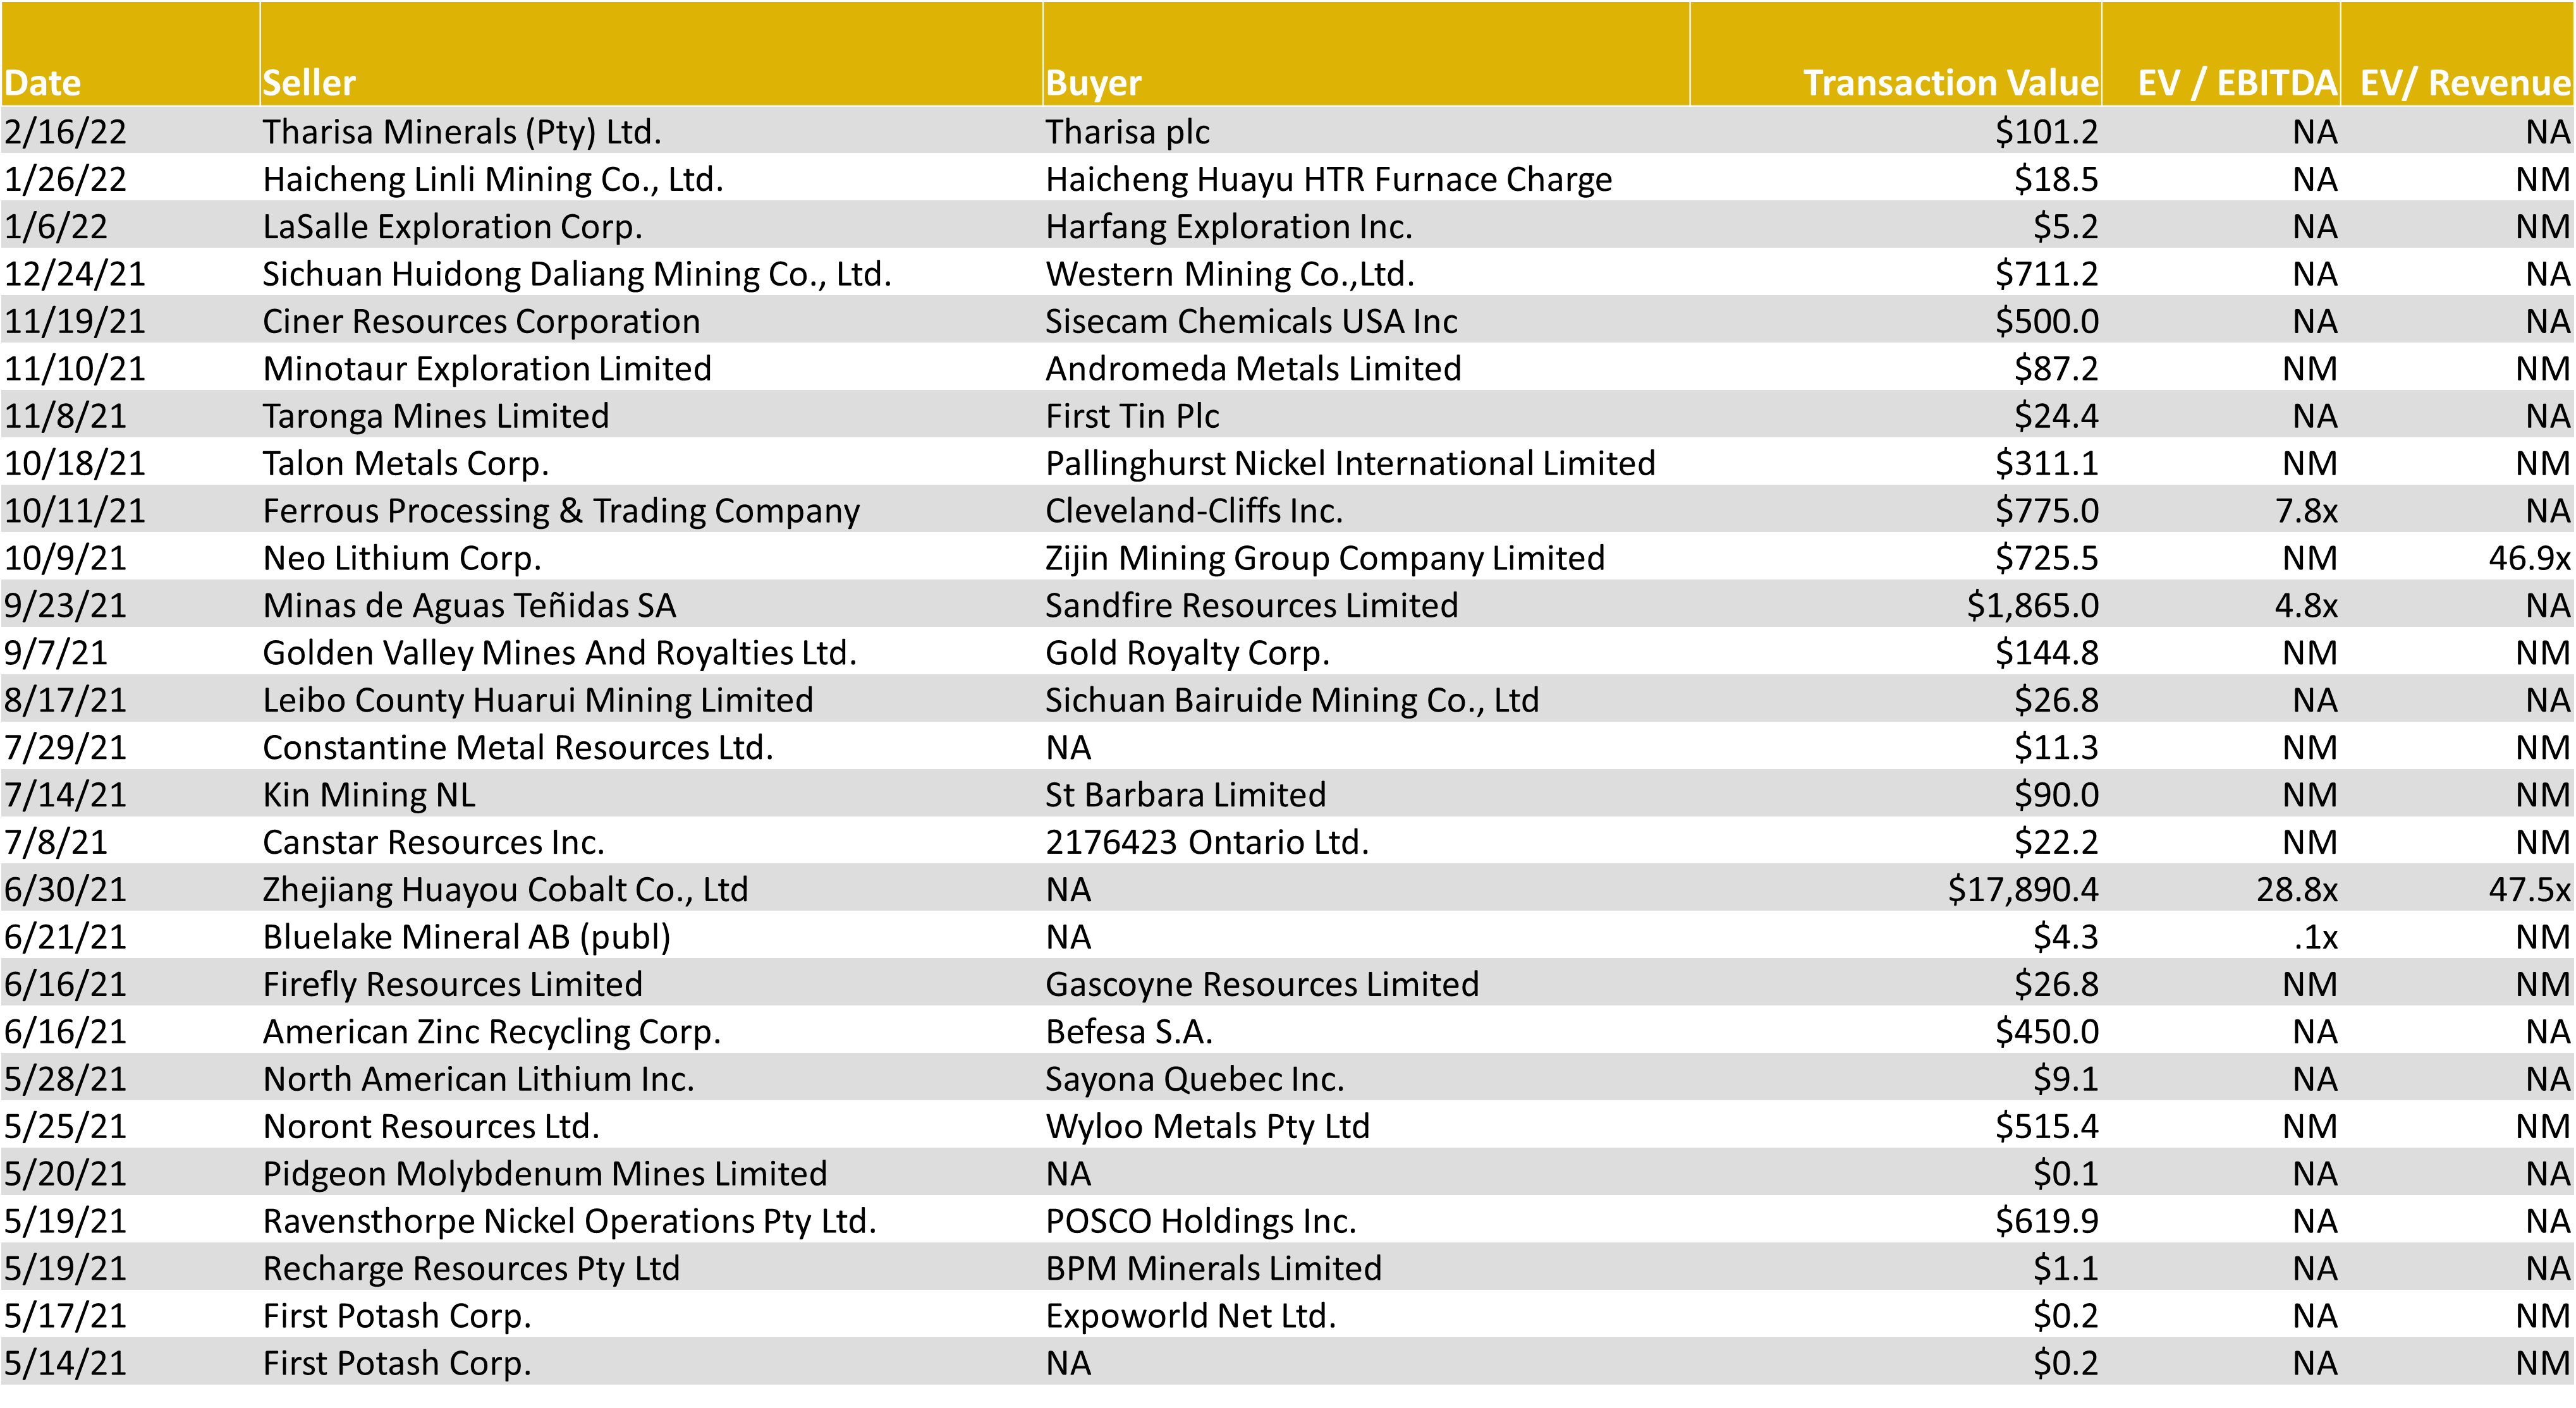
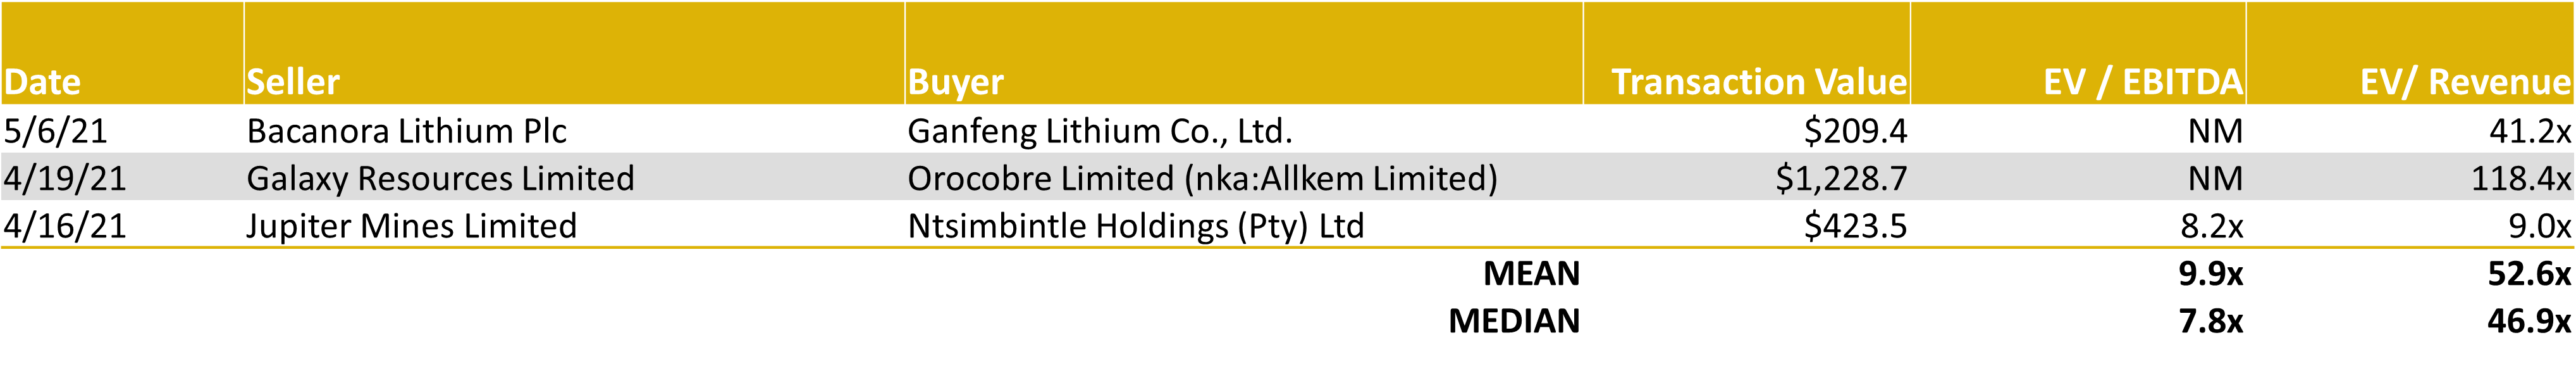
Source: Capital IQ as of 03/31/2022
LTM Mining Industry M&A Summary
Source: Capital IQ as of 03/31/2022
NOBLE QUARTERLY HIGHLIGHTS
Cypress Development Corp. (TSXV:CYP, OCTQB:CYDVF)
Industry: Metals and Mining – Diversified Metals and Mining
Cypress Development Corp. is a Canadian based advanced stage lithium exploration company, focused on developing its 100%-owned Clayton Valley Lithium Project in Nevada, USA. Work completed by Cypress led to the discovery of a world-class resource of lithium-bearing claystone adjacent to the Albemarle Silver Peak mine, North America’s only lithium brine operation. Cypress is advancing its Clayton Valley Lithium Project in Nevada towards the production of high-purity lithium hydroxide suitable for tier one battery usage.
1st Quarter News Highlight:
February 4, 2022: Cypress Development Completes Over-Subscribed $18.1 million bought deal financing. Pursuant to the Offering, the Company issued a total of 9,058,000 units of the Company (“Units”) at a price of $2.00 per Unit and 142,000 Warrants (as defined below) at a price of $0.1598 per Warrant, for aggregate gross proceeds of $18,138,720. Each Warrant entitles the holder to acquire one common share of the Company at a price of $2.65 with a Warrant expiry date of February 4, 2024. The net proceeds from the Offering are expected to be used by the Company to fund ongoing work, development and permitting activities at its Clayton Valley Lithium Project in Nevada and for working capital and general corporate purposes.
Maple Gold Mines Ltd. (TSXV:MGM, OCTQB:MGMLF)
Industry: Metals and Mining – Gold
Maple Gold Mines Ltd. is a Canadian advanced exploration company in a 50/50 joint venture with Agnico Eagle Mines Limited to jointly advance the district-scale Douay and Joutel gold projects located in Quebec’s prolific Abitibi Greenstone Gold Belt. The projects benefit from exceptional infrastructure access and boast ~400 km2 of highly prospective ground including an established gold resource at Douay (SLR 2022) that holds significant expansion potential as well as the past-producing Eagle, Telbel and Eagle West mines at Joutel.
1st Quarter News Highlight:
March 17, 2022: The Company reported a substantial resource increase in the Douay property after an updated Mineral Resource Estimate performed during the first quarter. Indicated resources increased by 21% to 511,000 OZ AU, and inferred resources increased by 7% to 2,525,000 OZ AU. Matthew Hornor – President and CEO – commented: “Looking ahead, the Company is targeting larger step-out and deeper drilling along the full extent of the Douay resource area.”
Allegiant Gold Ltd. (OTCQX:AUXXF)
Industry: Metals and Mining – Gold
Allegiant owns 100% of ten highly-prospective gold projects in the United States, seven of which are in the mining-friendly jurisdiction of Nevada. Three of Allegiant’s projects are farmed-out, providing for cost reductions and cash-flow. Allegiant’s flagship, district-scale Eastside project hosts a large and expanding gold resource and is in an area of excellent infrastructure.
1st Quarter News Highlight:
March 17. 2022: The company announced the completion of its previously announced $4,014,414 financing and strategic investment by Kinross Gold Corporation for the exploration and development of the Eastside property in Nevada. As a result, Kinross now owns 9.9% of the issued and outstanding shares of Allegiant. The strategic investment by Kinross calls for the formation of a four-person Technical Advisory Committee comprised of two members from each company. The Technical Advisory Committee will provide advice and guidance on the upcoming core-drilling program at the HGZ within the Original Pit Zone at Eastside.
Source: Company Press Releases
DOWNLOAD THE FULL REPORT (PDF)
Noble Capital Markets Metals & Mining Newsletter Q1 2022
![]()
This newsletter was prepared and provided by Noble Capital Markets, Inc. For any questions and/or requests regarding this newsletter, please contact >Francisco Penafiel
DISCLAIMER
All statements or opinions contained herein that include the words “ we”,“ or “ are solely the responsibility of NOBLE Capital Markets, Inc and do not necessarily reflect statements or opinions expressed by any person or party affiliated with companies mentioned in this report Any opinions expressed herein are subject to change without notice All information provided herein is based on public and non public information believed to be accurate and reliable, but is not necessarily complete and cannot be guaranteed No judgment is hereby expressed or should be implied as to the suitability of any security described herein for any specific investor or any specific investment portfolio The decision to undertake any investment regarding the security mentioned herein should be made by each reader of this publication based on their own appraisal of the implications and risks of such decision This publication is intended for information purposes only and shall not constitute an offer to buy/ sell or the solicitation of an offer to buy/sell any security mentioned in this report, nor shall there be any sale of the security herein in any state or domicile in which said offer, solicitation or sale would be unlawful prior to registration or qualification under the securities laws of any such state or domicile This publication and all information, comments, statements or opinions contained or expressed herein are applicable only as of the date of this publication and subject to change without prior notice Past performance is not indicative of future results.
Please refer to the above PDF for a complete list of disclaimers pertaining to this newsletter
Rumors of Fossil Fuels Death are Quite Premature
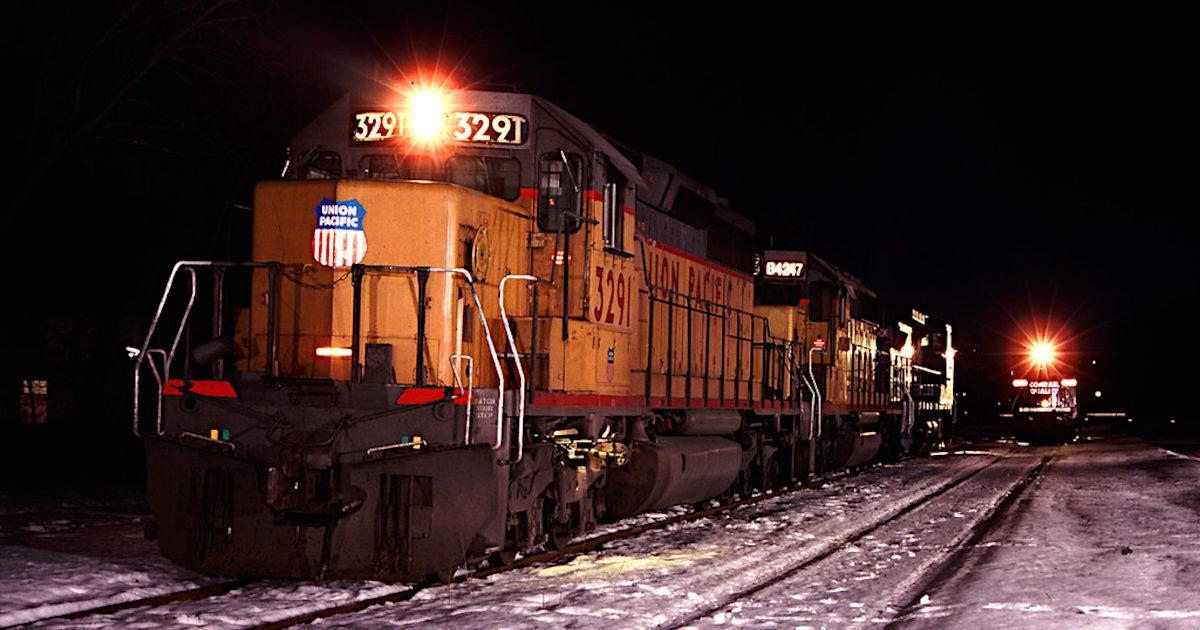
Image Credit: Bruce Fingerhood (Flickr)

While Many Investors are Shunning Coal as Yesterday’s Energy, the Industry May Have Just Entered a Supercycle
Investor conferences are full of companies helping investors better understand newer industries and then showcasing individual company business models and “value propositions.” The annual NobleCon Investor conference showcases growth companies, arguably, better than any other event. While attending this year’s NobleCon, I sat in on a presentation by a company up 277% YoY and trending higher. The industry dates back to the 1700s in the US, and the product had recently been rumored to have outlived its usefulness. Yet scheduled in between small companies doing groundbreaking work in life sciences, electronic games, and high-tech trading systems was a company still breaking ground mining coal and extracting other fossil fuels. The company’s stock market returns are staggering, and the presentation (video
available here) pointed to a positive outlook both for the company and the industry.
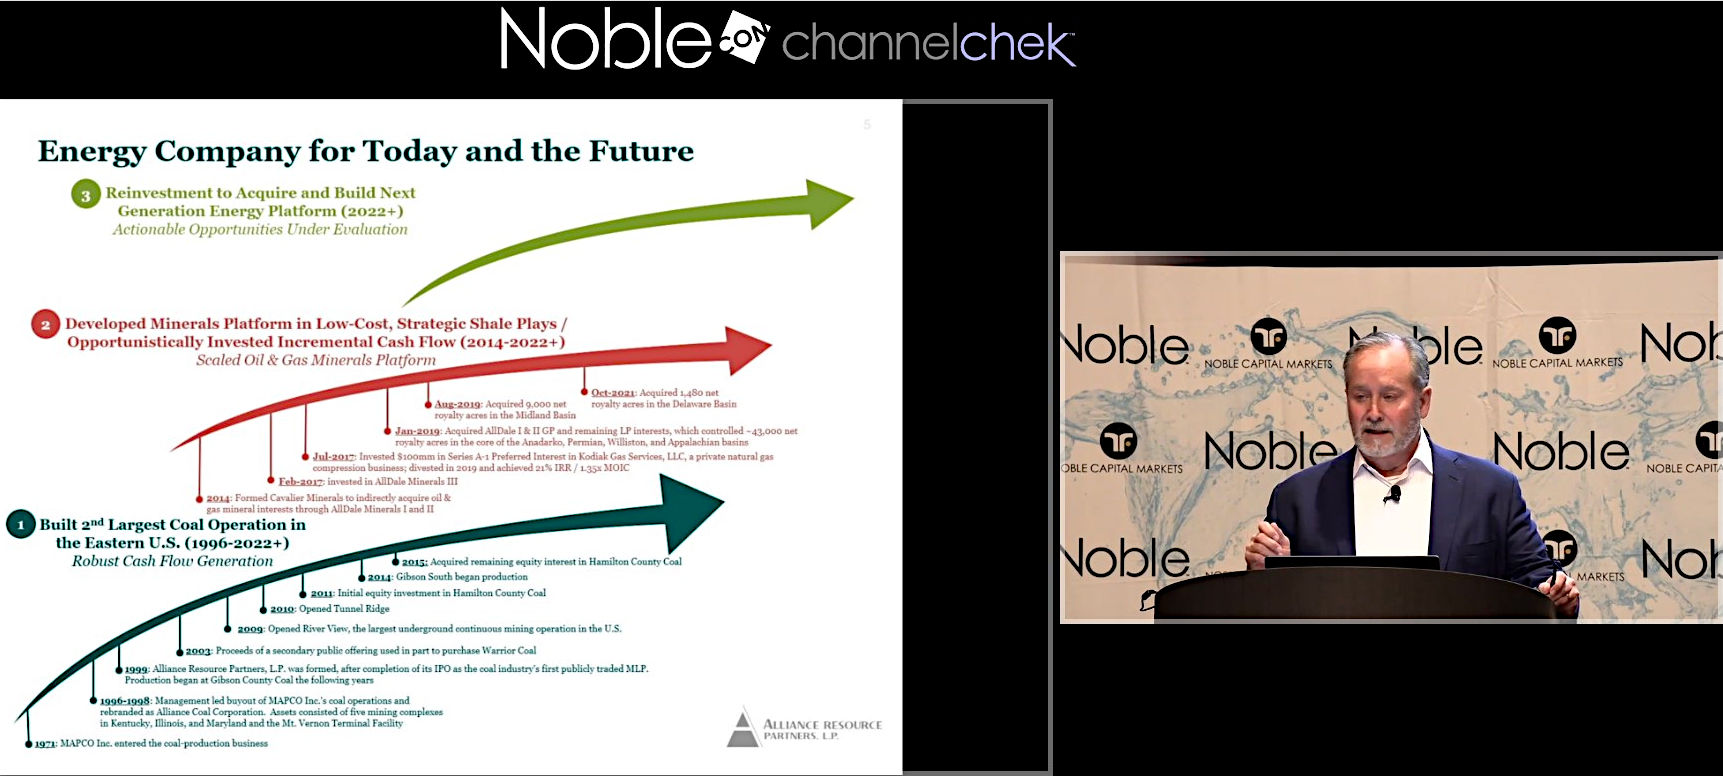
Image: Brian Cantrell, SVP and CFO of Alliance Resource Partners, discusses the future of his company at NobleCon18
About the Company and Fossil Fuels
Alliance Resource Partners (ticker: ARLP), is the second-largest coal producer in the eastern US. Alliance markets its coal production to major domestic and international utilities and industrial users. The company derives income from coal production and oil & gas mineral interests located in seven strategic mining bases across the eastern states. The company has a market cap of $1,953m and is trading at $15.36 (April 26) up from $5.48 one year earlier.

Brian Cantrell, the CFO of ARLP, led the investor-facing presentation that highlighted his company’s challenges through the pandemic and the current stature and strength since mid-2021. The CFO explained that the price for natural gas began to rise last year, which fueled demand for less expensive coal. This was followed by what he called the “unfortunate situation in Ukraine” which is benefitting the price of fossil fuels as international consumers are weaning themselves off Russian natural gas. It’s far cheaper now to power from coal than natural gas.
Feeding into this perfect storm for coal prices has been an unwillingness of capital to support any fossil fuel projects. This has slowed any recovery from the supply shock. Also feeding into longer-term elevated prices is that fuel stockpiles had been very low where needed. There was a presumption that production could automatically respond, Cantrell explained that while it varies by unit and utility, end-users like to have 45 days’ worth on hand as a buffer to manage demand.
Today the fossil fuel industry has its own version of supply chain problems as fuel buyers are having difficulty finding producers with enough capacity to refill their buffer, which has in many cases been critically shortened. Internationally the US has been the swing producer, filling gaps outside of North America when needed with short-term, vessel-by-vessel, or quarter-by-quarter contracts. This demand has stressed the capacity to produce. Alliance has introduced artificial intelligence into its operation to create efficiencies for mining and extraction and to improve safety and productivity.
The
Future of the Industry
During the Alliance Resource Partners presentation, it was asked if current supply/demand fundamentals, because of lack of capital support, are forcing companies to live within their cash flows? Increased output may not come quick within the industry as it’s not in a position to leverage up while prices are under upward pressure; the presenter pointed out that ESG pressures are real. This could place this sector within a new supercycle.
Take-Away
Investment ideas are not limited to whatever the latest invention is. Often there is so much buzz around the “hot” “disruptive” industry that other opportunities have the potential to be overlooked.
Coal producers may be worth paying attention to for some time. Alliance’s CFO mentioned that he believes coal will continue to be an important part of power generation in the US and internationally.
Managing Editor, Channelchek
Suggested Reading
 No Punches Pulled at NobleCon18 Panel Discussion
|
 EV Inflation Outpacing Traditional Cars
|
 Evaluating Gold Royalty Companies to Gain Exposure to Precious Metals
|
 Metals & Mining First Quarter 2022 Review and Outlook
|
Sources
NobleCon18 Investor Presentation,
Alliance Resources (Replay Video)
https://www.arlp.com/investor-relations/investor-overview/corporate-profile/default.aspx
Stay up to date. Follow us:

|
Release – Comstock Announces First Quarter 2022 Webcast
![]()
Comstock Announces First Quarter 2022 Webcast
Research, News, and Market Data on Comstock Mining
VIRGINIA CITY, NEVADA, APRIL 25, 2022 – Comstock Mining Inc. (NYSE: LODE) (“Comstock” and the “Company”) today announced that it will host a conference call on Tuesday, May 3, 2022, at 8:00 a.m. Pacific Daylight Time (11:00 a.m. Eastern Daylight Time) to report its First Quarter 2022 results and business updates. The webcast will include a moderated question and answer session after the Company’s prepared remarks. Please click the link below to register in advance and please join the event at least 10 minutes prior to the scheduled start time.
Once registered, you will receive a confirmation email containing information about joining the Webcast.
May 3, 2022, 08:00 AM Pacific Daylight Time / 11:00 AM Eastern Daylight Time (US and Canada)
Topic: Comstock’s Q1 2022 Results and Business Update
Please click here to register in advance for this webcast.
About Comstock
Comstock (NYSE: LODE) innovates technologies that enable systemic decarbonization and circularity by efficiently converting under-utilized wasted and other natural resources into renewable fuels and electrification products that contribute to balancing global uses and emissions of carbon. To learn more, please visit www.comstock.inc.
Forward-Looking Statements
This press release and any related calls or discussions may include forward-looking statements within the meaning of Section 27A of the Securities Act of 1933, as amended, and Section 21E of the Securities Exchange Act of 1934, as amended. All statements, other than statements of historical facts, are forward-looking statements. The words “believe,” “expect,” “anticipate,” “estimate,” “project,” “plan,” “should,” “intend,” “may,” “will,” “would,” “potential” and similar expressions identify forward-looking statements, but are not the exclusive means of doing so. Forward-looking statements include statements about matters such as: future industry market conditions; future explorations or acquisitions; future changes in our exploration activities; future changes in our research and development; and future prices and sales of, and demand for, our products and services. Except as may be required by securities or other law, we undertake no obligation to publicly update or revise any forward-looking statements, whether as a result of new information, future events, or otherwise.
Neither this press release nor any related call or discussion constitutes an offer to sell, the solicitation of an offer to buy or a recommendation with respect to any securities of the Company, the fund or any other issuer.
| Contact information: | ||
| Comstock Mining Inc. P.O. Box 1118 Virginia City, NV 89440 ComstockMining.com |
Corrado De Gasperis Executive Chairman & CEO Tel (775) 847-4755 [email protected] |
Zach Spencer Director of External Relations Tel (775) 847-5272 Ext.151 [email protected] |
Release – Palladium One Announces Mineral Resource Estimate for the LK PGE-Cu-Ni Project
![]()
Palladium One Announces Mineral Resource Estimate for the LK PGE-Cu-Ni Project
Research, News, and Market Data on Palladium One Mining
1.1 Million Ounces Total Precious Metals, 111 Million Pounds Copper, 92 Million Pounds Nickel and 5 Million Pounds Cobalt in Indicated AND 1.1 million Ounces Total Precious Metals, 173 Million Pounds Copper, 152 Million Pounds Nickel and 8 Million Pounds Cobalt in Inferred
Toronto, Ontario–(Newsfile Corp. – April 25, 2022) – Palladium One Mining Inc. (TSXV: PDM) (OTCQB: NKORF) (FSE: 7N11) (the “Company” or “Palladium One“) is pleased to announce an updated Indicated and Inferred Mineral Resource Estimate (“MRE”) prepared the Company under the supervision of SLR Consulting (Canada) Ltd. (formerly Roscoe, Postle Associates Inc.) disclosed in accordance with National Instrument 43-101 (“NI43-101”) for the 100%-owned Läntinen Koillismaa (“LK”) Project in north-central Finland (Figure 1).
“We are pleased to report important milestones that measurably de-risk our LK PGE-Cu-Ni Project in Finland. Namely, a) a maiden Mineral Resource Estimate at Kaukua South and Murtolampi which increases the Kaukua Area’s indicated resources tonnes by approximately 250%; b) advanced metallurgical testing conducted by SGS (Lakefield) which demonstrates consistently repeatable metallurgical recoveries; and c) the ability to produce both a high-value copper and nickel concentrate using a conventional flotation recovery process.
“These milestones substantially improve the economic potential by confirming scale and by delivering clarity of recovery rates for various rock types.
“With a grade of 30% copper in the copper concentrate and a value of approximately US$4,200 per tonne for the nickel concentrate, both are highly marketable, which bodes well for future concentrate marketing negotiations.
“While continued exploration in 2022 to increase the size of LK is ongoing, we have accelerated baseline environmental studies and plan to advance a Preliminary Economic Assessment (“PEA”).
“The bulk of 2022’s exploration efforts are expected to be in Canada and directed to the award winning Tyko Ni-Cu Project. Once drill permits are received, we plan to drill test several multi-line VTEM anomalies where highly anomalous soil sample values of copper nickel and cobalt were discovered in 2021. To date, additional drill permits have not been received,” commented Derrick Weyrauch, President and CEO.
Highlights
In addition to the Mineral Resource Estimate (“MRE”) which used US$1,700/oz palladium (Table 1a, 2b), a sensitivity analysis was completed with seven optimized open-pit constrained resource estimates, with palladium prices ranging from US$900/oz to US$2,500/oz (Table 2a, 2b).
Mineral Resource Estimate
- 1.1 million ounces Total Precious Metals (Pd+Pt+Au) (“TMP”) (0.89 g/t), 111 Million Pounds Copper (0.13%), 92 Million Pounds Nickel (0.11%) and 5 million Pounds Cobalt (65 g/t) are classified as Indicated, contained in 38.2 million tonnes (see Table 1b).
- 1.1 million ounces TMP (0.68 g/t), 173 Million Pounds Copper (0.16%), 152 Million Pounds Nickel (0.14%) and 8 million Pounds Cobalt (74 g/t) are classified as Inferred, contained in 49.7 million tonnes (see Table 1b).
- 248% increase in Indicated tonnes and a 14% increase in Inferred tonnes.
- 44% of the MRE is in the Indicated category.
- A waste to ore ratio (“Strip Ratio”) of 1.48:1 in the Kaukua Area (including Murtolampi) and a 0.58:1 Strip Ratio at Haukiaho.
- The MRE assumes a Net Smelter Return (“NSR”) cut-off of US$12.50 per tonne, based on a 20,000 tonne per day milling rate.
- Includes three open-pits in the Kaukua Area (including Murtolampi) and one at Haukiaho, 10-kilometers to the south of Kaukua.
- Recovered, and payable metal assumptions are based on the 2022 Phase II Metallurgical Testing Program, and preliminary indicative copper and nickel smelter quotes.
Future Resource Expansion
- LK remains open for additional resource expansion both along strike and at depth.
- The MRE covers approximately 5 kilometers of the 38-kilometer marginal series contact zone, for which reconnaissance historical drilling indicated mineralization along nearly it’s entire length.
- The Company’s near-term targeting includes two additional open-pit targets in the Kaukua Area and possibly multiple open-pit targets along the 17-kilometer Haukiaho Trend.
- Three areas of Target Potential have been defined for near term resource expansion representing an additional 2.4-kilometer of strike length along the favourable marginal series and could add between 21.6 million and 36.0 million tonnes of resource. Refer to Table 3, Figures 4 & 5.
2022 Phase II Metallurgical Testing Program
- The Phase II Metallurgical Testing Program demonstrates the ability to produce BOTH a high-value copper AND a high-value nickel concentrate (“Con”) utilizing conventional 3-stage flotation.
- The Cons were readily and consistently reproduced.
- Locked Cycle Test results:
- Locked Cycle Bulk Concentrate recoveries: 73.5% Pd, 56.1% Pt, 73.0% Au, 88.6% Cu, 30.3% Ni, and 18.6% Co (Table 5).
- Copper Concentrate: Grades of 30.0% Cu, 1.43% Ni, 0.1% Co, 38.3 g/t Pd, 13.1 g/t Pt, 11.2 g/t Au representing a value of US$6,300 per tonne of concentrate (Table 6).
- Nickel Concentrate: Grades of 4.8% Ni, 3.9% Cu, 0.2% Co, 40.8 g/t Pd, 11.0 g/t Pt, 2.9 g/t Au representing a value of US$4,200 per tonne of concentrate.
- Rhodium values up to 1.7 g/t and 1.0 g/t were reported in both the Nickel and Copper Concentrates respectively, while the MRE does not include rhodium values.
- Fortunately, both Cons are high in iron and sulfur and low in MgO, thereby improving marketability.
- A low mass pull of 1.2% was achieved, thereby suggestive of low transportation charges.
Other
- In aggregate, there is 38 million tonnes of Indicated and 50 million tonnes of inferred in resources, thereby providing the opportunity for a large tonnage long-life mine to be developed.
- The LK project has excellent infrastructure with paved roads, power, skilled labour and is less than 180 kilometers from the port of Oulu, thereby providing the opportunity for reduced initial capital cost estimates.
Mineral Resource Estimate:
Table 1a. 2022 LK MRE
| MINERAL RESOURCE ESTIMATE – April 2022 | |||||||||
| Tonnes & Grade – US$1,700 Pd per oz | |||||||||
| Strip Ratio | Tonnes (Mt) | Pd | Pt | Au | TPM | Cu | Ni | Co | |
| (g/t) | (g/t) | (g/t) | (g/t) | (%) | (%) | (g/t) | |||
| Indicated | |||||||||
| Kaukua Area | 1.50 | 38.2 | 0.61 | 0.22 | 0.07 | 0.89 | 0.13 | 0.11 | 64.56 |
| Inferred | |||||||||
| Kaukua Area +Murtolampi | 1.45 | 30.8 | 0.52 | 0.20 | 0.08 | 0.80 | 0.14 | 0.14 | 86.07 |
| Haukiaho | 0.58 | 18.9 | 0.27 | 0.11 | 0.10 | 0.48 | 0.18 | 0.14 | 54.30 |
| Total Inf. | 1.26 | 49.7 | 0.43 | 0.17 | 0.09 | 0.68 | 0.16 | 0.14 | 73.98 |
Table 1b: 2022 LK MRE In-situ contained metal
| MINERAL RESOURCE ESTIMATE – April 2022 | ||||||||
| Contained Metal – US$1,700 Pd per oz | ||||||||
| Strip | Pd | Pt | Au | TPM | Cu | Ni | Co | |
| Ratio | (M oz) | (M oz) | (M oz) | (M oz) | (M lbs) | (M lbs) | (M lbs) | |
| Indicated | ||||||||
| Kaukua Area | 1.50 | 0.74 | 0.26 | 0.08 | 1.09 | 110.7 | 91.6 | 5.4 |
| Inferred | ||||||||
| Kaukua Area +Murtolampi | 1.45 | 0.52 | 0.20 | 0.07 | 0.79 | 96.5 | 93.9 | 5.8 |
| Haukiaho | 0.58 | 0.16 | 0.07 | 0.06 | 0.29 | 76.4 | 57.5 | 2.3 |
| Total Inf. | 1.26 | 0.68 | 0.26 | 0.14 | 1.08 | 172.9 | 151.5 | 8.1 |
Notes
- CIM (2014) definitions were followed for Mineral Resources.
- The Mineral Resources have been reported above a preliminary open pit constraining surface using a Net Smelter Return (NSR) pit discard cut-off of US$12.5/t (which for comparison purposes equates to an approximately 0.65 g/t Palladium Equivalent in-situ cut-off, based on metal prices only).
- The NSR used for reporting is based on the following:
- Long term metal prices of US$ 1,700/oz Pd, US$ 1,100/oz Pt, US$ 1,800/oz Au, US$ 4.25/lb Cu, US$ 8.50/lb Ni and US$ 25/lb Co.
- Variable metallurgical recoveries for each metal were used at Kaukua and Murtolampi and fixed recoveries of 79.8% Pd, 80.1% Pt, 65% Au, 89% Cu, 64% Ni and 0% Co at Haukiaho.
- Commercial terms for a Cu and Ni concentrate based on indicative quotations from smelters.
- Total Precious Metals (TPM) equals palladium plus platinum plus gold.
- Bulk densities range between 1.8 and 3.23 t/m3.
- Numbers may not add up due to rounding.
- Mineral Resources, which are not Mineral Reserves, do not have demonstrated economic viability. The estimate of mineral resources may be materially affected by environmental, permitting, legal, title, taxation, sociopolitical, marketing, or other relevant issues.
- The quantity and grade of reported inferred resources in this estimation are conceptual in nature and there has been insufficient exploration to define these inferred resources as an indicated or measured mineral resource and it is uncertain if further exploration will result in upgrading them to an indicated or measured mineral resource category.
Palladium Equivalent (PdEq)
Palladium equivalent (“PdEq”) is calculated using US$1,700 per ounce for palladium, US$1,100 per ounce for platinum, US$1,800 per ounce for gold, US$4.25 per pound for copper, US$8.50 per pound for nickel, and $25 per pound cobalt consistent with the calculation used in the Company’s current Mineral Resource Estimate for the LK project. PdEq was used for wireframe construction and metallurgical test work only, and does not include metallurgical recoveries or smelter terms, and was not used for generation of the conceptual pit shells or Mineral Resource reporting. The Mineral Resource tabulation is based on a unit NSR value which includes metal prices, metallurgical recoveries and contract terms for Ni and Cu concentrates.
Mineral Resource Estimation Methodology
The Kaukua/Murtolampti drillhole database comprises 210 drillholes for a total of 44 km drilling. The Haukiaho drillhole database comprises a further 84 drillholes for a total of 13,392.3 m drilling . An updated 3D geological model has been constructed using Leapfrog software version (Figure 4).
Kaukua
For Kaukua, Key lithological units modelled include the basement gabbro and granodiorite as well as the intrusive or Marginal Series pyroxenite, peridotite and gabbronorite units. Major controlling structures have been used to split the deposit into three zones with subsidiary faults, major stratigraphic units, diabase dykes and the overburden modelled within these four zones. Faults outline the Pit, Gap and South Zones (sub-domains of the Kaukua deposit). A topographic surface has been generated using Lidar data.
Grade shells have been modelled at 0.3 g/t and 0.6 g/t PdEq thresholds using the vein system modelling in Leapfrog Geo within the geological constraints as determined.
Capping was completed on assays prior to compositing. A composite length of 6 m has been used, with the composites within each mineralized domain assessed for the need to apply grade caps. Continuity analysis (variography) has been completed on the composited samples within the various mineralization domains with the resultant variograms checked against the mineralization domain to ensure geological consistency.
A block model has been constructed in Hexagon Minesight software using a 6 m (X) by 6 m (Y) by 6 m (Z) block size. No sub-celling or rotation of the block model has been undertaken.
The block model has been coded by lithology and mineralization domain for each element. The later, cross-cutting diabase dykes and overburden have been coded into the block model with the grades for Pd, Pt, Cu, Ni, Co and Au set to background values in the block model.
The estimation of grade has been undertaken in two interpolation passes using ordinary kriging, with the 0.6 g/t PdEq mineralization wireframes used as firm-boundaries during the estimation. Dynamic anisotropy was used to accommodate local changes in dip and strike of the mineralization. Each subsequent interpolation pass has used an increased search ellipse size and a decrease in the minimum number of samples required:
- Pass 1 estimations have been undertaken using a minimum of three and a maximum of 8 composites into a 120 m x 120 m x 60 m search ellipse, with a maximum of 2 composites per drillhole,
- Pass 2 estimations have been undertaken using a minimum of one and a maximum of 8 composites into a 200 m x 200 m x 60 m search ellipse, with a maximum of one composite per drillhole,
Final grade estimates for Pd, Pt, Ni, Cu, Co and Au have been validated by statistical analysis and visual comparison to the input drillhole composite data. The estimated Pd, Pt, Cu, Ni, Co and Au grades validate within acceptable limits to the input declustered composite grades. Therefore, the block model accurately reproduces the input grades at a global scale. Swath plots show that there are negligible local biases. Change of support validation shows that the kriged model grades contain a suitable amount of internal dilution for the anticipated mining selectivity.
Blocks were classified as Indicated and Inferred in accordance with CIM Definition Standards 2014. Blocks were classified to the Inferred category if the block fell within 80 m of a composite. Indicated category blocks were classified using a drill-spacing of 50 x 50 m in the Pit area and 100 x 50 m in the South area.
Murtolampi
A grade shell has been modelled at a 0.3 g/t PdEq threshold using the vein system modelling in Leapfrog Geo within the geological constraints as determined.
Capping was completed on assays prior to compositing. A composite length of 6 m has been used, with the composites within each mineralized domain assessed for the need to apply grade caps. The variogram modelled for Kaukua was used at Murtolampti as there are an insufficient number of composites to model a robust variogram.
A block model has been constructed in Hexagon Mineplan software using a 6 m (X) by 6 m (Y) by 6 m (Z) block size. No sub-celling or rotation of the block model has been undertaken.
The block model has been coded by lithology and mineralization domain for each estimation of grade has been undertaken in two interpolation passes.
The estimation of grade has been undertaken in two interpolation passes using ordinary kriging. Anisotropy directions were selected based on the geometry of the mineralization. Each subsequent interpolation pass has used an increased search ellipse size and a decrease in the minimum number of samples required:
- Pass 1 estimations have been undertaken using a minimum of three and a maximum of 8 composites into a 120 m x 120 m x 60 m search ellipse, with a maximum of 2 composites per drillhole,
- Pass 2 estimations have been undertaken using a minimum of one and a maximum of 8 composites into a 200 m x 200 m x 60 m search ellipse, with a maximum of one composite per drillhole,
Final grade estimates for Pd, Pt, Ni, Cu, Co and Au have been validated by statistical analysis and visual comparison to the input drillhole composite data. The estimated Pd, Pt, Cu, Ni, Co and Au grades validate within acceptable limits to the input declustered composite grades. Therefore, the block model accurately reproduces the input grades at a global scale. Swath plots show that there are negligible local biases.
Haukiaho
Key lithological units modelled include the basement, gabbro/peridotite/pyroxenite and diabase. A fault divides the mineralization into eastern and western blocks. A topographic surface has been generated using Lidar data.
A grade shell has been modelled at a 0.25 g/t PdEq thresholds using the vein system modelling in Leapfrog Geo within the geological constraints as determined.
Capping was completed on assays prior to compositing. Several historic drillholes are missing Au, Pt and Pd assays. Linear regression (RMA) with high correlation coefficients against Cu and Ni assays has been used to assign Au, Pt and Pd grades to these drillholes. A composite length of 5 m has been used, with the composites within each mineralized domain assessed for the need to apply grade caps.
A block model has been constructed in Hexagon Mineplan software using a 10 m (X) by 10 m (Y) by 10 m (Z) block size. No sub-celling or rotation of the block model has been undertaken.
The block model has been coded by lithology and mineralization domain for each element. The later, cross-cutting diabase dykes and overburden have been coded into the block model with the grades for Pd, Pt, Cu, Ni, Co and Au set to background values in the block model.
The estimation of grade has been undertaken using inverse-distance weighting to the power of three in two interpolation passes, with the 0.25 g/t Pd-equivalent mineralization wireframes used as a hard-boundary during the estimation. Dynamic anisotropy was used to accommodate local changes in dip and strike of the mineralization. Each subsequent interpolation pass has used an increased search ellipse size and a decrease in the minimum number of samples required:
- Pass 1 estimations have been undertaken using a minimum of three and a maximum of 8 composites into a 200 m x 200 m x 50 m search ellipse, with a maximum of 2 composites per drillhole,
- Pass 2 estimations have been undertaken using a minimum of two and a maximum of 8 composites into a 300 m x 300 m x 50 m search ellipse, with a maximum of two composites per drillhole,
Final grade estimates for Pd, Pt, Ni, Cu, Co and Au have been validated by statistical analysis and visual comparison to the input drillhole composite data. The estimated Pd, Pt, Cu, Ni, Co and Au grades validate within acceptable limits to the input declustered composite grades. Therefore, the block model accurately reproduces the input grades at a global scale. Swath plots show that there are negligible local biases. Change of support validation shows that the kriged model grades contain a suitable amount of internal dilution for the anticipated mining selectivity.
Blocks were classified as Inferred in accordance with CIM Definition Standards 2014. Blocks were classified to the Inferred category if the block fell within 120 m of a composite.
Table 2a: 2022 LK MRE Sensitivity to Palladium Price – Grade
| SENSITIVITY TO CUTOFF GRADE – Mineral Resource Estimate – March 2022 | ||||||||||
| Pd Price | Strip | Tonnes (Mt) | Pd | Pt | Au | TPM | Cu | Ni | Co | |
| (US$/oz) | Ratio | (g/t) | (g/t) | (g/t) | (g/t) | (%) | (%) | (g/t) | ||
| $ 900 | 1.69 | 26.8 | 0.67 | 0.24 | 0.08 | 0.98 | 0.14 | 0.12 | 67.9 | |
| Total Indicated | $1,400 | 1.54 | 35.2 | 0.62 | 0.22 | 0.07 | 0.91 | 0.13 | 0.11 | 65.2 |
| $1,600 | 1.51 | 37.3 | 0.61 | 0.22 | 0.07 | 0.90 | 0.13 | 0.11 | 64.8 | |
| $1,700 | 1.50 | 38.2 | 0.61 | 0.22 | 0.07 | 0.89 | 0.13 | 0.11 | 64.6 | |
| $1,800 | 1.48 | 39.1 | 0.60 | 0.21 | 0.07 | 0.88 | 0.13 | 0.11 | 64.4 | |
| $2,000 | 1.54 | 46.5 | 0.58 | 0.21 | 0.06 | 0.85 | 0.12 | 0.11 | 65.6 | |
| $2,500 | 1.44 | 55.3 | 0.55 | 0.19 | 0.06 | 0.80 | 0.12 | 0.11 | 66.4 | |
| Total Inferred | $ 900 | 1.39 | 31.2 | 0.47 | 0.18 | 0.10 | 0.75 | 0.18 | 0.15 | 75.2 |
| $1,400 | 1.29 | 43.8 | 0.44 | 0.17 | 0.09 | 0.70 | 0.16 | 0.14 | 74.4 | |
| $1,600 | 1.27 | 47.7 | 0.43 | 0.17 | 0.09 | 0.69 | 0.16 | 0.14 | 74.0 | |
| $1,700 | 1.26 | 49.7 | 0.43 | 0.17 | 0.09 | 0.68 | 0.16 | 0.14 | 74.0 | |
| $1,800 | 1.24 | 51.2 | 0.42 | 0.16 | 0.09 | 0.67 | 0.16 | 0.14 | 73.5 | |
| $2,000 | 1.30 | 56.6 | 0.42 | 0.16 | 0.08 | 0.67 | 0.15 | 0.14 | 73.7 | |
| $2,500 | 1.23 | 68.1 | 0.40 | 0.15 | 0.08 | 0.64 | 0.15 | 0.13 | 73.2 | |
Notes:
- Total Precious Metals (TPM) equals palladium plus platinum plus gold.
- Only the Palladium Price is varied, all other commodity prices remained fixed at the 2022 MRE price deck.
- Each Palladium price point is tabulated using a conceptual pit specific to that price point.
Table 2b: 2020 LK MRE Sensitivity to Palladium Price – contained metals
| RESOURCE SENSITIVITY TO PALLADIUM PRICE (US$ / OZ) | |||||||||
| IN-SITU CONTAINED METAL- Mineral Resource Estimate – March 2022 | |||||||||
| Pd Price | Strip | Pd | Pt | Au | TPM | Cu | Ni | Co | |
| (US$/oz) | Ratio | (M oz) | (M oz) | (M oz) | (M oz) | (M lbs) | (M lbs) | (M lbs) | |
| Total Indicated | $ 900 | 1.69 | 0.58 | 0.21 | 0.07 | 0.85 | 83.3 | 67.9 | 4.0 |
| $1,400 | 1.54 | 0.70 | 0.25 | 0.08 | 1.03 | 104.4 | 85.6 | 5.1 | |
| $1,600 | 1.51 | 0.73 | 0.26 | 0.08 | 1.07 | 108.8 | 89.9 | 5.3 | |
| $1,700 | 1.50 | 0.74 | 0.26 | 0.08 | 1.09 | 110.7 | 91.6 | 5.4 | |
| $1,800 | 1.48 | 0.75 | 0.27 | 0.08 | 1.11 | 112.5 | 93.4 | 5.5 | |
| $2,000 | 1.54 | 0.87 | 0.31 | 0.09 | 1.27 | 127.0 | 112.1 | 6.7 | |
| $2,500 | 1.44 | 0.97 | 0.34 | 0.11 | 1.42 | 143.8 | 133.6 | 8.1 | |
| Total Inferred | $ 900 | 1.39 | 0.47 | 0.19 | 0.10 | 0.75 | 120.6 | 102.8 | 5.2 |
| $1,400 | 1.29 | 0.62 | 0.24 | 0.13 | 0.99 | 158.9 | 137.4 | 7.2 | |
| $1,600 | 1.27 | 0.66 | 0.26 | 0.13 | 1.06 | 169.7 | 147.4 | 7.8 | |
| $1,700 | 1.26 | 0.68 | 0.26 | 0.14 | 1.08 | 172.9 | 151.5 | 8.1 | |
| $1,800 | 1.24 | 0.70 | 0.27 | 0.14 | 1.11 | 179.1 | 156.2 | 8.3 | |
| $2,000 | 1.30 | 0.77 | 0.30 | 0.15 | 1.21 | 192.6 | 170.9 | 9.2 | |
| $2,500 | 1.23 | 0.88 | 0.34 | 0.17 | 1.39 | 220.8 | 200.6 | 11.0 | |
Notes:
- Total Precious Metals (TPM) equals palladium plus platinum plus gold.
- Only the Palladium Price is varied, all other commodity prices remained fixed at the 2022 MRE price deck.
- Each Palladium price point is tabulated using a conceptual pit specific to that price point.
Table 3: 2022 LK Target Potential
| LK Target Potential – April 2022 | ||||||||
| Target Potential | ||||||||
| Tonnes Low (Mt) | Tonnes High (Mt) | TPM Low | TPM High | Cu Low | Cu High | Ni Low | Ni High | |
| (g/t) | (g/t) | (%) | (%) | (%) | (%) | |||
| Kaukua Far East | 8.1 | 13.5 | 0.6 | 0.9 | 0.09 | 0.13 | 0.08 | 0.12 |
| Haukiaho East | 13.5 | 22.5 | 0.4 | 0.6 | 0.12 | 0.19 | 0.09 | 0.15 |
| Total | 21.6 | 36.0 | 0.5 | 0.7 | 0.11 | 0.17 | 0.09 | 0.14 |
Table 4: Commodity Price Assumptions used in the MRE
| COMMODITY PRICES – Mineral Resource Estimate – April 2022 | ||||||
| Unit of Measure | 3-Year Trailing Average (1) | 2-Year Trailing Average (1) | Spot Price (2) | Prices Used in Mineral Resource Estimation | Percentage of Spot Price | |
| Palladium | US$/oz | $ 2,132 | $ 2,305 | $ 2,358 | $ 1,700 | 72% |
| Platinum | US$/oz | $ 964 | $ 1,007 | $ 1,011 | $ 1,100 | 109% |
| Gold | US$/oz | $ 1,713 | $ 1,829 | $ 1,947 | $ 1,800 | 92% |
| Copper | US$/lbs | $ 3.42 | $ 3.82 | $ 4.67 | $ 4.25 | 91% |
| Nickel | US$/lbs | $ 7.73 | $ 8.43 | $ 15.04 | $ 8.50 | 57% |
| Cobalt | US$/lbs | $ 19.39 | $ 21.71 | $ 37.11 | $ 25 | 67% |
(1) Source: As of April 19, 2022. As quoted on the LBMA & LME for precious & base metals, respectively.
(2) Source: S&P Capital IQ. 2026 estimates used as a proxy.
Metallurgical testing (2022 Phase II program) results:
- Variability testing for five main lithologies and a Master Composite of similar grade to the Kaukua resource area was conducted.
- Results:
- Concentration by conventional floatation produces a saleable bulk concentrate with no deleterious elements, irrespective of lithology.
- A clean, high value saleable Copper Concentrate can be produced.
- A clean, high value saleable Nickel-PGE Concentrate can be produced.
A detailed floatation metallurgical program was conducted by the Company on the Kaukua & Kaukua South deposits. Both deposits posses very similar geology and mineralization, and bulk sample of approximately 1 metric tonne from 22 holes comprising both Upper and Lower Zone mineralization was shipped to SGS Lakefield in Canada in summer of 2021. This sample was blended to produce a representative composite sample of the Lower Zone mineralization with grade of 1.66 g/t PdEq (0.63 g/t Pd, 0.22 g/t Pt, 0.10 g/t Au, 0.13% Cu, 0.14% Ni, 88 g/t Co) (Table 5). In additional, ten individual samples (five high and five low grade) consisting of the four dominant rock types that comprise the Lower zone plus a fifth for the Upper zone were analysed for variability testing.
Results from the current metallurgical program have highlighted very consistently reproducible recovery rates form the Kaukua/Kaukua South mineralization. Copper and PGE recovery being only slightly affected by changes in grade, only nickel recovery is significantly affected by grade, as the percentage of silicate nickel increases as grade decreases.
Historical test work in 2011 on the Kaukua deposit was also performed by SGS Lakefield. This earlier composite sample had a similar bulk composition to the current metallurgical sample but was higher grade 2.38 g/t PdEq (0.94 g/t Pd, 0.31 g/t Pt, 0.08 g/t Au, 0.22% Cu, and 0.20% Ni). Results from this earlier test were consistent with result from the current test and further confirm the consistency of the floatation recovery.
In addition to a Bulk Con, a split copper and nickel con were produced. Both of which are highly saleable (Table 6). The Copper Con is particularly high-grade with 30% Cu and high PGEs. The Copper Con represents 30% by weight of the Bulk Con with the Nickel Con comprising 70%. In addition, the Bulk Con had a low 1.2% mass pull, and low deleterious elements including <6% MgO in the nickel concentrate.
The LK project is located 160 north east of the Port City of Oulu, thereby significantly decreasing potential shipping costs. In addition, Finland has domestic copper and nickel smelting capacity further potentially reducing shipping costs.
Table 5: Locked Cycle Test Results for Lower Zone Composite Sample.
| LOCKED CYCLE METALLURGICAL TEST RESULTS – April 2022 | |||||||||||||
| Products | Mass | Assay | % Distribution/Recovery | ||||||||||
| Pull % |
Pd g/t | Pt g/t | Au g/t | Cu % | Ni % | Co % | Pd | Pt | Au | Cu | Ni | Co | |
| Cu Cleaner Con | 0.35 | 38.3 | 13.1 | 11.2 | 30.0 | 1.43 | 0.1 | 21.0 | 18.8 | 45.2 | 67.9 | 3.4 | 2.0 |
| Ni 3rd Cleaner Con | 0.82 | 40.8 | 11.0 | 2.9 | 3.9 | 4.85 | 0.2 | 52.5 | 37.3 | 27.8 | 20.7 | 27.0 | 16.6 |
| Calc. Bulk Con | 1.17 | 40.1 | 11.6 | 5.4 | 11.7 | 3.83 | 0.2 | 73.5 | 56.1 | 73.0 | 88.6 | 30.3 | 18.6 |
| Rougher Con (1) | 13.1 | 3.85 | 1.11 | 0.57 | 1.08 | 0.46 | – | 81.6 | 64.7 | 79.8 | 94.0 | 39.8 | — |
| Sample Head |
100 | 0.63 | 0.24 | 0.09 | 0.15 | 0.15 | 0.01 | 100 | 100 | 100 | 100 | 100 | 100 |
(1) The Rougher Con is from an Open Circuit test for comparison purposes, as Rougher Con results are not available from the Locked Cycle test as it is continuously recirculated.
(2) The Nickel recovery is lower than previous test work in 2011 which used a higher grade (2.38 g/t PdEq) composite sample due to a higher percentage of silicate nickel present in the current more representative lower grade (1.66 g/t PdEq) composite sample.
Concentrate Grades from Locked-Cycle Testwork:
Table 6: Concentrate Grades and Value from Locked Cycle Test
| CONCENTRATE GRADES – April 2022 | |||||||
| Unit of Measure | Bulk Concentrate Grade (1) | Copper Concentrate Grade (2) | Nickel Concentrate Grade (3) | Bulk Concentrate Value (1) | Copper Concentrate Value (2) | Nickel Concentrate Value (3) | |
| Palladium | g/t | 40.1 | 38.3 | 40.8 | $2,189 | $2,093 | $2,230 |
| Platinum | g/t | 11.6 | 13.1 | 11.0 | $411 | $463 | $389 |
| Gold | g/t | 5.4 | 11.2 | 2.9 | $312 | $648 | $170 |
| Copper | % | 11.7 | 30.0 | 3.9 | $1,095 | $2,811 | $365 |
| Nickel | % | 3.83 | 1.43 | 4.85 | $718 | $268 | $909 |
| Cobalt | g/t | 0.2 | 0.1 | 0.2 | $94 | $55 | $110 |
| Rhodium (4) | g/t | 1.5 | 1.0 | 1.7 | $479 | $322 | $547 |
| PdEq (5) | g/t | 88.2 | 116.0 | 76.4 | |||
| $ Value (5) | US$/t | $4,819 | $6,339 | $4,173 | |||
(1) Represents aggregate concentrate produced.
(2) Represents preferential copper segregation form the Bulk Concentrate.
(3) Represents the remaining Bulk concentrate less the Copper Concentrate extracted.
(4) Rhodium was not consistently analyzed for; these values represent select analysis of nickel and copper concentrates; a price of $10,000/oz was used for purpose of this table for information purposes only.
(5) PdEq and Concentrate Value is calculated using metal price only for information purposes, it does not include Rhodium and is calculated using the current resource price deck of $1,700 US oz Pd, $1,100 US oz Pt, $1,800 US oz Au, $4.25 US lb Cu, $8.50 US lb Ni, and $25 US lb Co.
Methodology:
A resource average master composite was created with representative samples from the four lithologies containing both high- and low-grade samples. The flowsheet developed produced separate Cu and Ni concentrates and the results were confirmed in a locked cycle test which simulates plant conditions. The results of the locked cycle test are presented in Table 1.
Indicative quotations were obtained from smelters for the concentrates produced. Using those terms, the overall smelter returns which include payable metal in addition to treatment and refining charges for metal recovered to the concentrates using a split Nickel and Copper Cons were, Cu 80.3%, Ni 41.8%, Pd 85.3%, Pt 77.3% and Au 79.6%.
In addition to the locked cycle test on the master composite, open circuit tests of 10 variability samples representing the four lithologies of the master composite plus a composite for the Upper Zone were conducted utilizing the flowsheet developed. The results from all tests produced quality concentrates with a very consistent rougher recovery relationship of each metal to its feed grade. The relationships established were used to estimate the rougher recovery from the resource. The rougher recovery relationship combined with the locked cycle test cleaner recovery was used to determine the overall metal recovery. The smelter return for each metal was applied to the overall recovery to determine revenue.
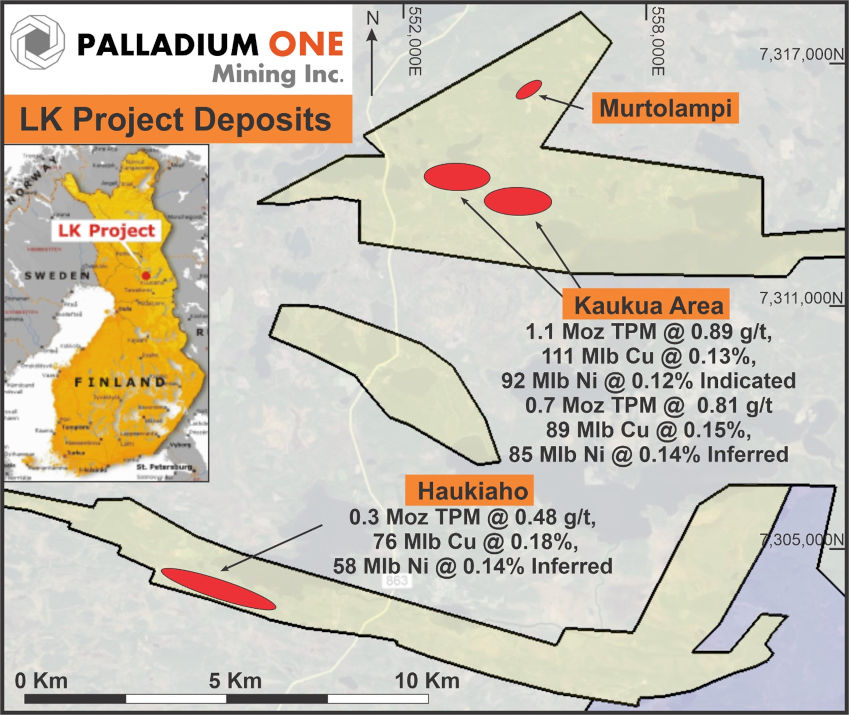
Figure 1 – Location map of LK Project and Open Pit Mineral Resources (red ellipses). The yellow shaded area represents the outer property boundary of the LK Project, and include both Exploration Permits and Permit Applications. The Blue shaded area represents the Company’s adjoining KS Project. TPM represents in-situ Total Precious Metals (Pd + Pt + Au). UTM grid datum is ETRS 35Fin, Zone 35W.
>
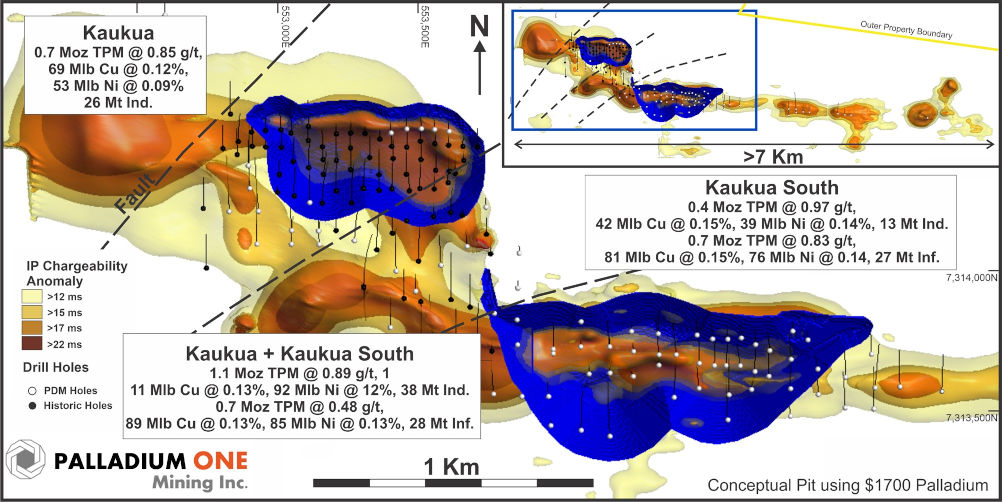
Figure 2 – Kaukua Area showing conceptual open pits superimposed on IP chargeability with both historical and Palladium One drill holes. TPM represents in-situ Total Precious Metals (Pd + Pt + Au).
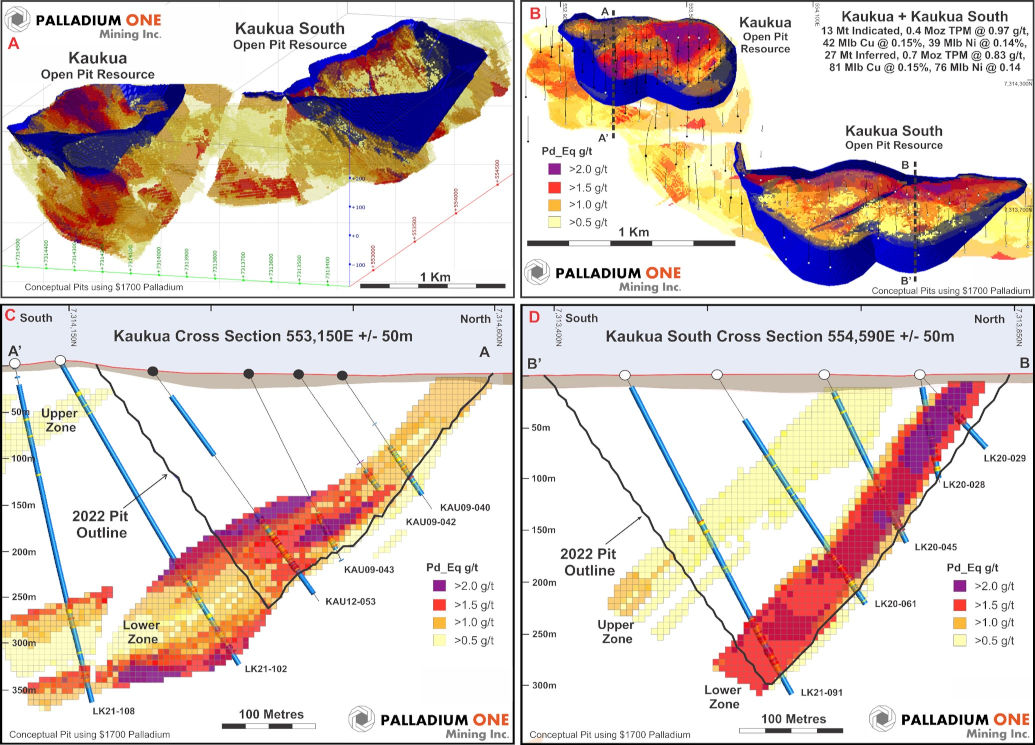
Figure 3 – A Isometric view looking to the northeast, Kaukua Area pits superimposed on the block model. B Plan view of the Kuakua Area pits superimposed on the block model and showing cross section locations. TPM represents in-situ Total Precious Metals (Pd + Pt + Au). C Cross section A-A’ looking west of the Kaukua pit showing drilling and the block model. D Cross section B-B’ looking west of the Kaukua South pit showing drilling and the block model.
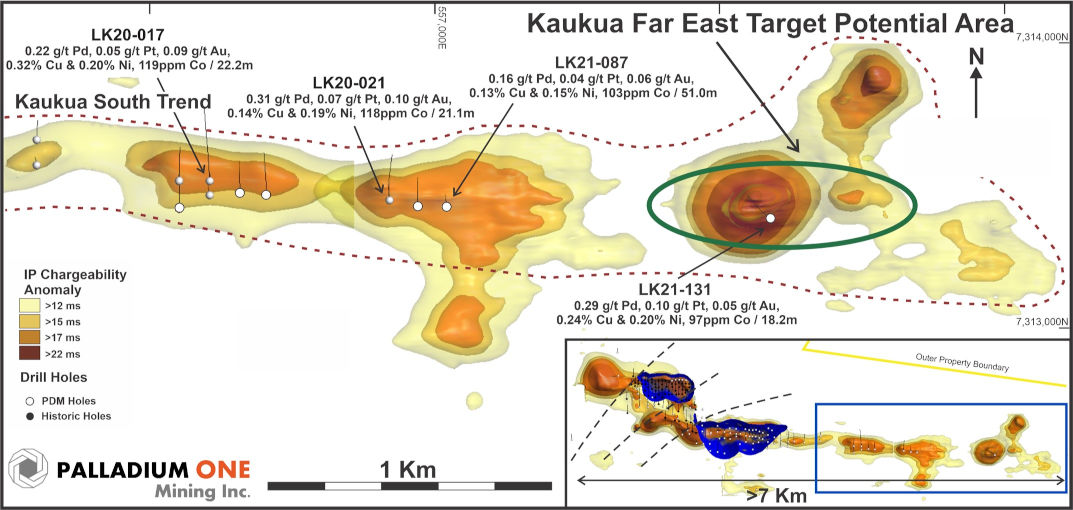
Figure 4. Kaukua Area showing eastern extension of the Kaukua South trend with Target Potential areas outlined in green.
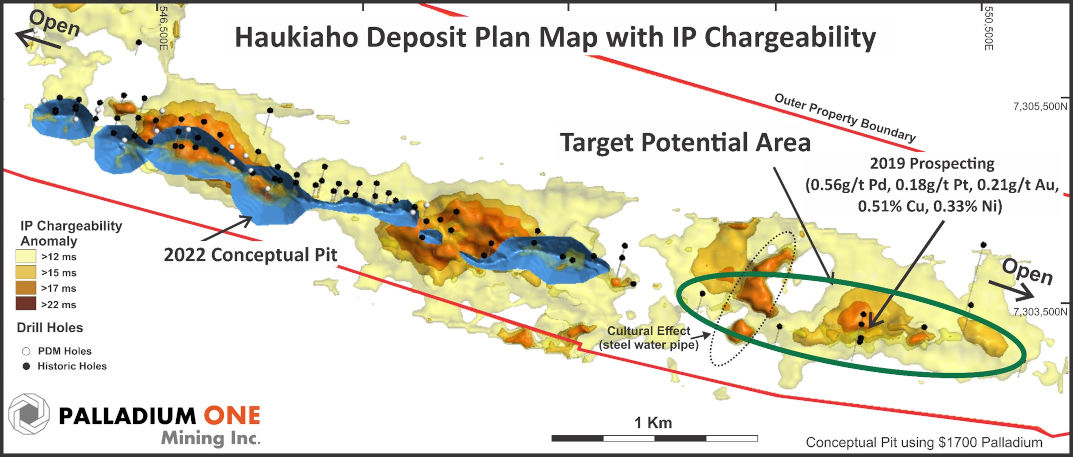
Figure 5. Huakiaho area with current conceptual open pit (blue) and Target Potential areas outlined in green.
Qualified Person
The Mineral Resource Estimate was prepared by the Company under the supervision of Mr. Sean Horan, P.Geo., Technical Manager of Geology at SLR Consulting Ltd., based in Toronto, Ontario, Canada. Mr. Horan is an Independent Qualified Person as defined by NI 43-101. The Mineral Resource Estimate in this news release has been classified in accordance with CIM Definition Standards on Mineral Resources and Mineral Reserves (May 14, 2014). Mr. Horan has read and approved the contents of this news release, as it relates to the disclosed Mineral Resource Estimate.
For the purposes of this news release, Mr. Neil Pettigrew, M.Sc., P. Geo., Vice President of Exploration and a director of the Company is the designated non-Independent Qualified Person and has reviewed and approved the scientific and technical information in this news release.
About Palladium One
Palladium One Mining Inc. (TSXV: PDM) is focused on discovering environmentally and socially conscious Metals for Green Transportation. A Canadian mineral exploration and development company, Palladium One is targeting district scale, platinum-group-element (PGE)-copper-nickel deposits in leading mining jurisdictions. Its flagship project is the Läntinen Koillismaa (LK) Project in north-central Finland, which is ranked by the Fraser Institute as one of the world’s top countries for mineral exploration and development. LK is a PGE-copper-nickel project that has existing Mineral Resources. PDM’s second project is the 2020 Discovery of the Year Award winning Tyko Project, a high-grade sulphide, copper-nickel project located in Canada. Follow Palladium One on LinkedIn, Twitter, and at www.palladiumoneinc.com.
ON BEHALF OF THE BOARD
“Derrick Weyrauch”
President & CEO, Director
For further information contact:
Derrick Weyrauch, President & CEO
Email: [email protected]
Neither the TSX Venture Exchange nor its Market Regulator (as that term is defined in the policies of the TSX Venture Exchange) accepts responsibility for the adequacy or accuracy of this release.
This press release is not an offer or a solicitation of an offer of securities for sale in the United States of America. The common shares of Palladium One Mining Inc. have not been and will not be registered under the U.S. Securities Act of 1933, as amended, and may not be offered or sold in the United States absent registration or an applicable exemption from registration.
Information set forth in this press release may contain forward-looking statements. Forward-looking statements are statements that relate to future, not past events. In this context, forward-looking statements often address a company’s expected future business and financial performance, and often contain words such as “anticipate”, “believe”, “plan”, “estimate”, “expect”, and “intend”, statements that an action or event “may”, “might”, “could”, “should”, or “will” be taken or occur, or other similar expressions. By their nature, forward-looking statements involve known and unknown risks, uncertainties and other factors which may cause our actual results, performance or achievements, or other future events, to be materially different from any future results, performance or achievements expressed or implied by such forward-looking statements. Such factors include, among others, risks associated with project development; the need for additional financing; operational risks associated with mining and mineral processing; fluctuations in palladium and other commodity prices; title matters; environmental liability claims and insurance; reliance on key personnel; the absence of dividends; competition; dilution; the volatility of our common share price and volume; and tax consequences to Canadian and U.S. Shareholders. Forward-looking statements are made based on management’s beliefs, estimates and opinions on the date that statements are made and the Company undertakes no obligation to update forward-looking statements if these beliefs, estimates and opinions or other circumstances should change. Investors are cautioned against attributing undue certainty to forward-looking statements.