![]()
Maple Gold Adds Second Drill Rig to Commence 6,000-Metre Deep Drilling Program at Joutel
Research, News, and Market Data on Maple Gold Mines
Vancouver, British Columbia–(Newsfile Corp. – August 3, 2022) – Maple Gold Mines Ltd. (TSXV: MGM) (OTCQB: MGMLF)
(FSE: M3G) (“Maple Gold” or the “Company“) is pleased to report the mobilization of a second drill rig, while the first drill rig continues Phase II drilling at the 100%-controlled Eagle Project, to commence a 6,000 metre (“m”) deep drilling program at the Joutel Project (“Joutel”) in Quebec, Canada, held by a 50/50 joint venture (“JV”) between the Company and Agnico Eagle Mines Limited. This deep drilling program is expected to include three (3) drill holes in the Telbel mine area (“Telbel”) beneath and adjacent to the historical underground mine workings, which extend to roughly 1,200 m below surface. Past gold production at Telbel focused on a single zone between 500 – 1,050 m; however, data digitization and 3D modeling have identified significant gold intercepts up to approximately 1,400 m below surface that remain open for follow-up exploration.
Deep drilling at Telbel will be funded as part of a previously announced C$4.8-million supplemental Year Two JV exploration budget (see news from May 18, 2022). To control potential drillhole deviation, Aziwell Canada Inc. has been contracted to provide directional drilling support on an as-needed basis during the Telbel deep drilling program.
Fred Speidel, VP Exploration of Maple Gold, stated: “We are excited to commence initial deep
drilling at Telbel, marking the first drilling at Telbel since the early 1990s.
Last year’s digitization and modelling work identified significant higher-grade
(>5 g/t Au) mineralization extending beyond the mined-out stopes and has
supported our drill targeting. The expanded Year Two JV budget provides us with
the financial means to begin testing these compelling targets and near mine
extensions at depth.”
Initial Telbel
Targets and Program Details
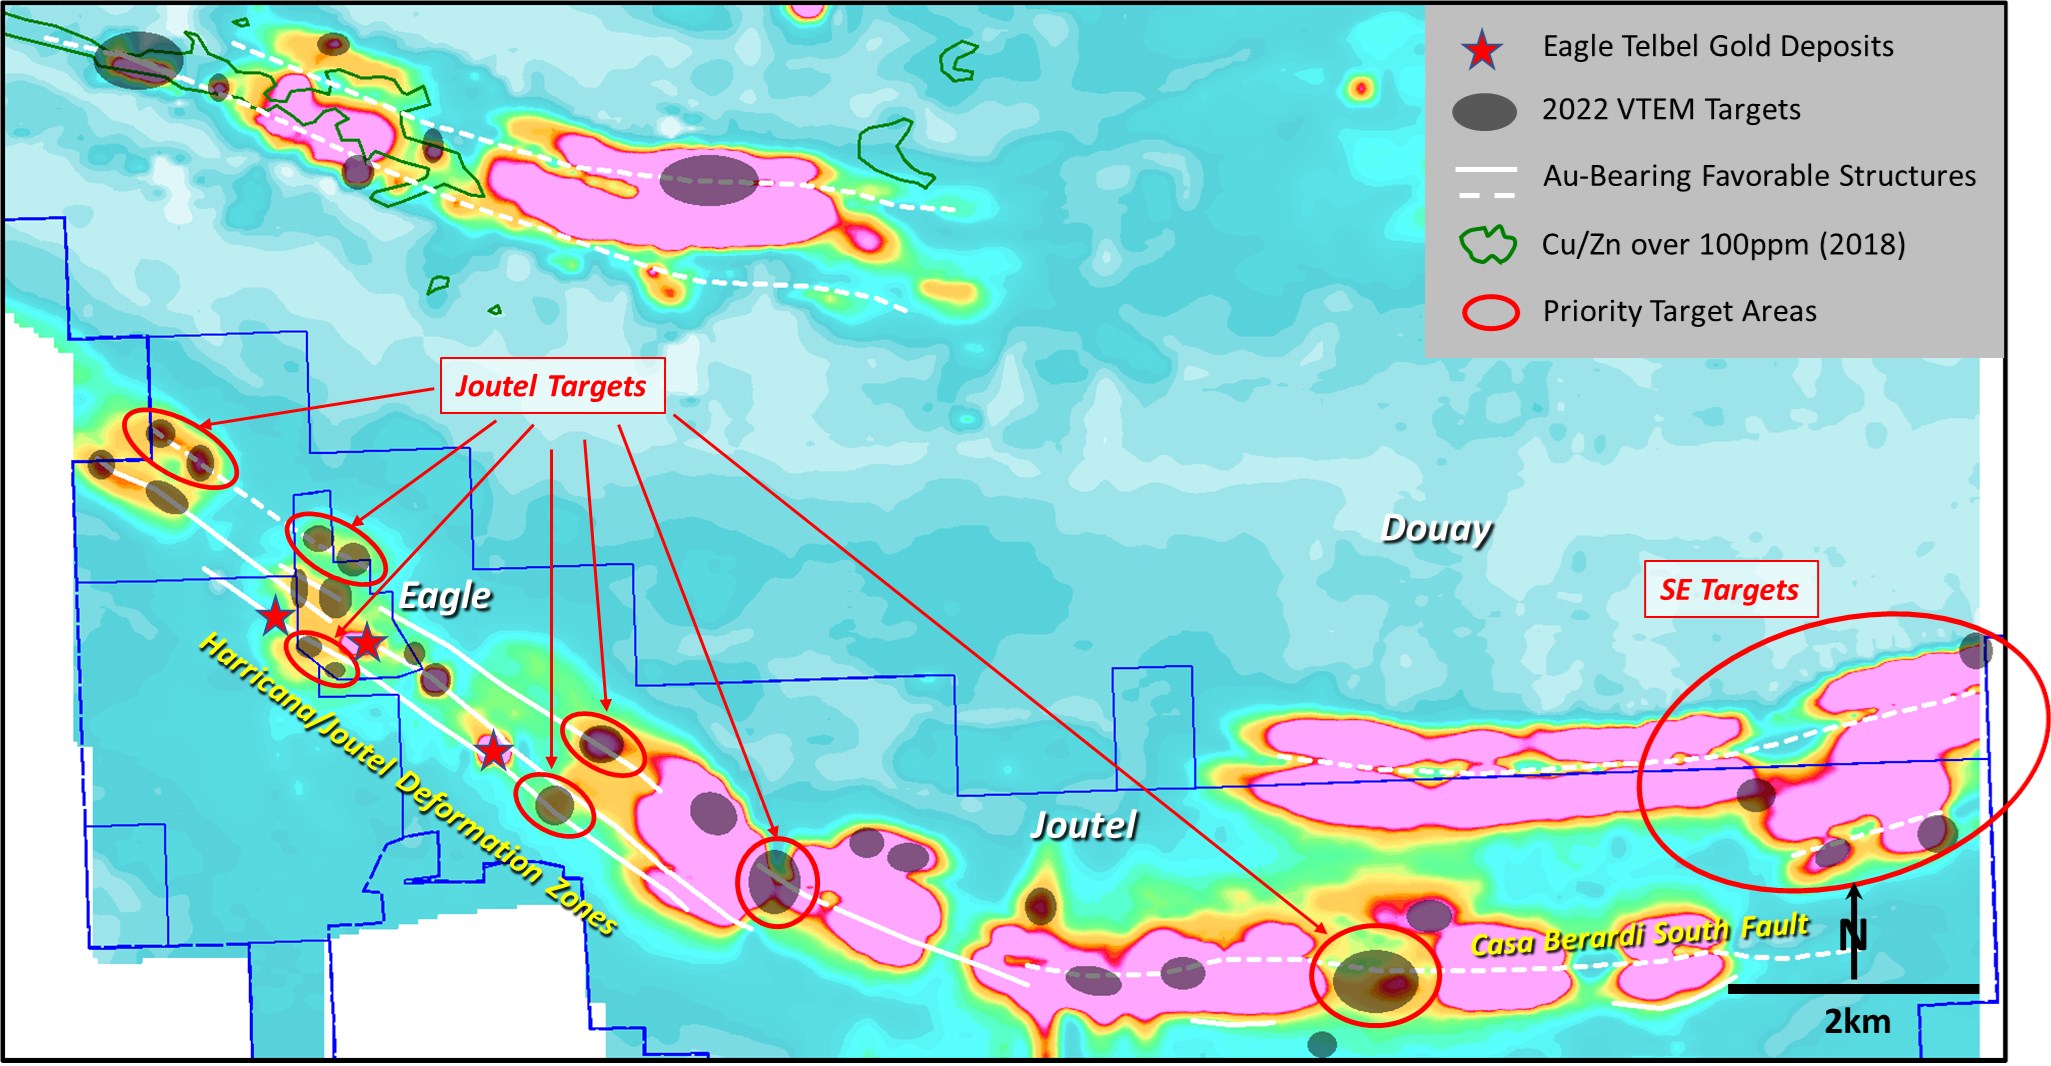
Maple Gold previously reported 3D modelling results for the main mine trend at Telbel after digitizing more than 250,000 metres of historical drill data (see news from August 16, 2021), which highlighted the potential for higher-grade gold mineralization above and below the historical underground mine workings, as well as additional discovery targets at a district scale (see Figure 1 below).
The deep drill program is expected to include one (1) drill hole that will be collared south of the main Telbel mine horizon and drilled to the north (S-N) and two (2) drill holes collared north of the target area and drilled to the south (N-S). This will provide valuable geological information by covering the entire stratigraphy of the mineralized system, and will also serve to test known sub-parallel mineralized zones that have not been fully explored in the past. Deep drilling will investigate mineralized trends with step-outs of over 350 metres from historical information (see Figure 2 below).

Figure 1: District scale Eagle-Telbel long section highlighting open mineralized areas after 3D modelling, 300 m corridor width
To view an enhanced version of Figure 1, please visit:
https://images.newsfilecorp.com/files/3077/132667_7e4e81059434dbb7_001full.jpg

Figure 2: Full width 3D model oblique slice highlighting historical intercepts (blue stars) using a 2.5 g/t Au cut-off and planned deep drillholes at Telbel
To view an enhanced version of Figure 2, please visit:
https://images.newsfilecorp.com/files/3077/132667_7e4e81059434dbb7_002full.jpg
TB-22-001 (S-N) and TB-22-002 (N-S) are designed to test below the deeper plunging local trend observed at Telbel where historical intercepts below the mined-out areas included 57.2 g/t gold (“Au”) over 3 m at 1215 m depth, 53.2 g/t Au over 2 m at 1175 m depth, 19.9 g/t Au over 3.7 m at 1285 m depth, 32.2 g/t Au over 2.3 m at 1130 m depth and 18.3 g/t Au over 2.4 m at 1205 m depth (all approximate vertical depths – see Figure 2 above). Several of these intercepts have lower grade haloes. TB-22-003 (N-S) is designed to test the southeastern continuity of the shallower district-scale Eagle-Telbel trend (blue dashed lines in Figure 1) where an 80.8 g/t gold Au interval over 0.5 m at 1135 m depth was intersected in quartz carbonate veinlets with visible gold from historical drilling. Importantly, this historical drillhole did not reach the main Telbel mine horizon.
Qualified Person
The scientific and technical data contained in this press release was reviewed and prepared under the supervision of Fred Speidel, M. Sc., P. Geo., Vice-President Exploration of Maple Gold. Mr. Speidel is a Qualified Person under National Instrument 43-101 Standards
of Disclosure for Mineral Projects. Mr. Speidel has verified the data related to the exploration information disclosed in this press release through his direct participation in the work.
About Maple Gold
Maple Gold Mines Ltd. is a Canadian advanced exploration company in a 50/50 joint venture with Agnico Eagle Mines Limited to jointly advance the district-scale Douay and Joutel gold projects located in Quebec’s prolific Abitibi Greenstone Gold Belt. The projects benefit from exceptional infrastructure access and boast ~400 km2 of highly prospective ground including an established gold resource at Douay (SLR 2022) that holds significant expansion potential as well as the past-producing Eagle, Telbel and Eagle West mines at Joutel. In addition, the Company holds an exclusive option to acquire 100% of the Eagle Mine Property.
The district-scale property package also hosts a significant number of regional exploration targets along a 55 km strike length of the Casa Berardi Deformation Zone that have yet to be tested through drilling, making the project ripe for new gold and polymetallic discoveries. The Company is well capitalized and is currently focused on carrying out exploration and drill programs to grow resources and make new discoveries to establish an exciting new gold district in the heart of the Abitibi. For more information, please visit
www.maplegoldmines.com.
ON BEHALF OF
MAPLE GOLD MINES LTD.
“Matthew Hornor”
B. Matthew Hornor, President & CEO
For
Further Information Please Contact:
Mr. Joness Lang
Executive Vice-President
Cell: 778.686.6836
Email:
jlang@maplegoldmines.com
Mr. Kiran Patankar
SVP, Growth Strategy
Cell: 604.935.9577
Email:
kpatankar@maplegoldmines.com
NEITHER THE TSX
VENTURE EXCHANGE NOR ITS REGULATION SERVICES PROVIDER (AS THAT TERM IS DEFINED
IN THE POLICIES OF THE TSX VENTURE EXCHANGE) ACCEPTS RESPONSIBILITY FOR THE
ADEQUACY OR ACCURACY OF THIS PRESS RELEASE.
Forward
Looking Statements:
This press release contains “forward-looking information” and “forward-looking statements” (collectively referred to as “forward-looking statements”) within the meaning of applicable Canadian securities legislation in Canada, including statements about exploration work and results from current and future work programs. Forward-looking statements are based on assumptions, uncertainties and management’s best estimate of future events. Actual events or results could differ materially from the Company’s expectations and projections. Investors are cautioned that forward-looking statements involve risks and uncertainties. Accordingly, readers should not place undue reliance on forward-looking statements. For a more detailed discussion of such risks and other factors that could cause actual results to differ materially from those expressed or implied by such forward-looking statements, refer to Maple Gold Mines Ltd.’s filings with Canadian securities regulators available on www.sedar.com or the Company’s website at www.maplegoldmines.com. The Company does not intend, and expressly
disclaims any intention or obligation to, update or revise any forward-looking
statements whether as a result of new information, future events or otherwise,
except as required by law.