Comstock Announces 2020 Achievements; Updates Progress on MCU Ownership, Philippines Deployment and Strategic Objectives
Virginia City, NV (January 7, 2021) Comstock Mining Inc. (the “Company”) (NYSE American: LODE) announced 2020 business achievements, 2021-2023 strategic plan and the Company’s outlook for 2021:
Selected 2020 Strategic Achievements (unaudited)
- Completed corporate realignment, positioning Comstock for precious and strategic metal-based growth;
- Completed first phase of mercury remediation pilot, purchasing 15% of Mercury Clean Up LLC (“MCU”):
- Formed Philippine mercury remediation joint venture, receiving 50% of MCU Philippines Inc. (MCU-P”);
- Acquired 25% of Pelen LLC, 100% owner of the Sutro Tunnel Company mineral properties and royalties;
- Formed Comstock Royalty LLC for aggregating a growing portfolio of gold and silver NSR royalties;
- Completed the sale of the Lucerne mine, recognizing a gain of $18.3 million;
- Completed an airborne geophysical survey over all of the Company’s Comstock District properties;
- Leased the Daney Ranch with an option to sell for $2.7 million
- Reduced annual operating expenses by approximately $4 million per annum, as compared to 2017;
- Monetized $5.6 million in Tonogold common and preferred stock;
- Repaid the remaining $4.8 million portion of the Company’s former senior secured debenture;
- Ended 2020 with 34,980,766 shares outstanding, including 540,000 in restricted directors’ shares; and
- Ended 2020 with approximately $2.4 million in cash and cash equivalents.
Mr. Corrado De Gasperis, Executive Chairman and CEO stated, “We sustained all of our scheduled cost reductions and subsidies, repaid our senior secured debt and implemented our realignment objectives in 2020, positioning ourselves for new, high-growth, activities. The successful sale of Lucerne enabled the repayment of all of our senior secured debt and, together with monetizing non-strategic assets, funds the implementation of our strategic plan.”
Comstock’s Corporate Realignment
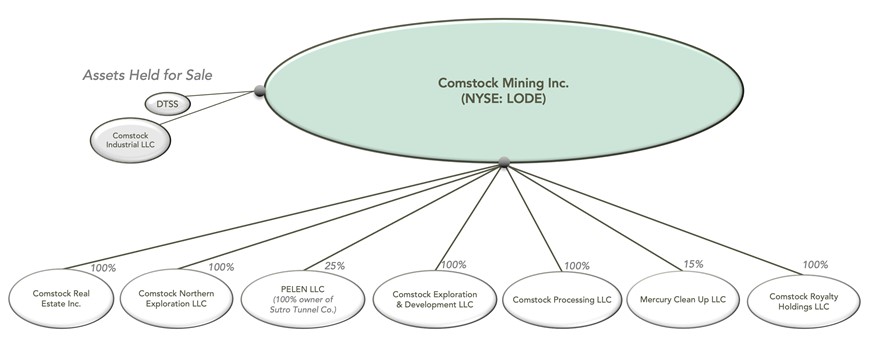
Figure 1 – Comstock’s Corporate Realignment
Strategic Performance Objectives 2021-2023
The Company’s goal is to grow our equity value by commercializing environment-enhancing, precious and strategic-metal-based products and processes that generate a rate of predictable cash flow (throughput) from our metal processing operations and royalties and increase the long-term enterprise value of our mineral properties. The next three years are dedicated to delivering that value by achieving the performance objectives listed below:
Commercialize a global, ESG-compliant, profitable, mercury remediation system:
- Establish the technical efficacy of MCU’s mercury remediation system, and protect the intellectual property;
- Operate the second and third mercury remediation systems internationally, profitability, in the Philippines;
- Identify, evaluate and prioritize a pipeline of potential mercury remediation projects; then deploy the fourth and fifth mercury remediation projects, with the goal of producing significant cash flow returns; and
- Assess and capitalize on value enhancing expansion opportunities.
Establish and grow the value of our mineral properties:
- Establish the Dayton Resource area’s maiden, stand-alone mineral resource estimate;
- Expand the Dayton-Spring Valley Complex through geophysical modelling and exploration drilling;
- Develop the Dayton-Spring Valley Complex toward full economic feasibility, supporting a mine decision;
- Entitle the Dayton-Spring Complex with geotechnical, metallurgical, and environmental permitting; and
- Exploit the Comstock smelter royalty portfolio (e.g., Occidental Lode, Comstock Lode, Lucerne Mine).
Monetize non-strategic assets and build a quality organization:
- Monetize our third-party, junior mining securities responsibly, for $12.5 million or more;
- Monetize our non-mining assets for $12.5 million, excluding the Gold Hill Hotel;
- Grow the value of our Opportunity Zone investments to over $30 million; and
- Deploy a systemic organization, capable of accelerating growth and handling complexity.
On January 4, 2021, the Company granted 1,260,000 performance share units to key employees of the Company. Vesting of the awards is 100% conditioned upon the achievement of strategic performance objectives of the Company described in the Comstock 2020 Equity Incentive Plan, for half of the award, and achieving a per share price of $12 per share or greater, for the other half of the award. If the objectives and the values are not achieved, the shares will not vest and revert back to the Company. The Executive Chairman and CEO of the Company was among the recipients of such performance share units, with a grant of 500,000 of the performance share units.
Mr. De Gasperis continued, “We have sharpened our performance objectives, strengthened our alignment with all stakeholders, with our board taking the substantial majority of their compensation in stock over the next three years and all of our employees participating in a 100% performance-based, stock-based compensation plan. The Company’s leadership is fully aligned with shareholder interests and focused on the goal of delivering over $500 million of value, or at least $12 per share, from the Company’s existing assets and the commercialization of environmentally friendly precious and strategic metal processing technologies, partnerships and ventures.”
Commercialize a Global, ESG-compliant, Mercury Remediation System
On December 4, 2020, the Company’s closed on its first investment objective, purchasing 15% of MCU and adding Mr. De Gasperis to the MCU board, representing the Company’s 15% membership interest. The Company also received its full 50% interest in MCU-P, the Company’s first joint venture project for the commercialization of MCU’s mercury remediation technologies. The Company has committed to fund up to $3 million in secured loans for the Philippine joint venture and receives an additional 10% of MCU when the Company has loaned the initial $2 million to MCU-P (of which, approximately $1.2 million was funded during 2020).
Oro Industries Inc., MCU’s exclusive manufacturing partner, has delivered and MCU has now tested the 25-ton-per-hour mercury recovery plant for its pilot operations on Comstock mineral properties, including a 200 gallon-per-minute dissolved air flotation water treatment plant. These pilot trial operations continued into early December and achieved operating balance for all parts of the system, generally operating at 2-3 tons per hour. Our teams are currently sampling and validating mercury-contaminated materials throughout the Carson River Mercury Superfund Site, using a sampling protocol accepted by environmental regulatory bodies, with the objective of identifying and sourcing mercury-contaminated test materials for the continuance of the pilot program. MCU will resume pilot processing later in the first quarter, and continue throughout 2021, at the Company’s American Flat processing facility. The Company’s goals are to validate and fine-tune the mercury remediation process, with the objective of evaluating its economic feasibility on the Comstock materials and capitalizing on the global growth opportunities.
The first of those opportunities is in the Philippines. MCU-P has already delivered its first international system to the Philippines and has commenced operations, led by Mr. Paul Clift, MCU’s CEO, who is on the ground in the province of Davao D’ Oro. MCU-P is coordinating its efforts with its joint venture partner Clean Ore Solutions, a Philippine company, and the Department of Environment and Natural Resources. This represents the first real international opportunity for large-scale mercury remediation and environmental reclamation and for establishing MCU as a leader in mercury remediation, and in particular, contamination caused by small-scale artisanal miners.
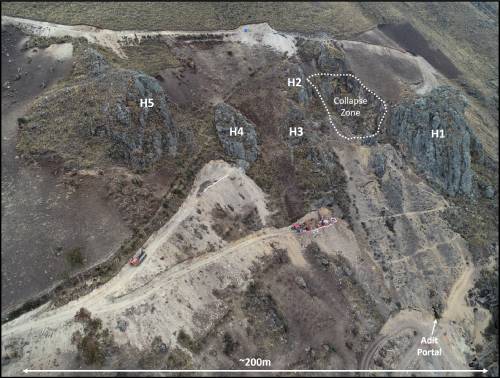
Establish and Grow the Value of Our Mineral Properties
During the third and fourth quarter of 2020, the Company engaged Geotech Ltd (“Geotech”) of Aurora, Canada, to conduct an airborne geophysical survey of the Dayton resource area, Spring Valley exploration targets, and the rest of the Company’s Comstock District properties. The survey included both magnetic and Geotech’s proprietary Versatile Time-Domain Electromagnetic (“VTEM”) surveys. The three-dimensional results have been recently delivered to the Company and its geological team continues to assess a deep trove of geophysical and geological data. The results will greatly increase the Company’s understanding of the Dayton resource area, the Spring Valley resource expansion potential, and the rest of the Company’s Comstock District properties.
During the fourth quarter, the Company’s technical staff also completed a detailed structural interpretation of the Dayton resource area, which provides the framework for a completely new resource model. The detailed interpretation has resulted in a highly prospective drill targets to further define and expand the mineral resource.
The Company’s first performance objective includes establishing the Dayton Resource area’s maiden, stand-alone mineral resource estimate, with plans to initiate a stand-alone S-K 1300 compliant, initial assessment technical report for the Dayton resource area. We expect the new technical report to provide not only a new resource estimate, but also a phased drilling plan for further defining and expanding the resource for sustainable, profitable mining. The Company’s performance objectives will then include expanding the Dayton-Spring Valley Complex through exploration drilling and geophysical modelling, further developing the expanded Dayton-Spring Valley Complex toward full economic feasibility, and ultimately supporting a decision to mine.
Monetize Non-strategic Assets and Outlook
The Company’s most near-term performance objectives includes monetizing our third-party, junior mining securities responsibly, for $12.5 million or more, and monetize our non-strategic assets for $12.5 million, excluding the Gold Hill Hotel. During the third quarter of 2020, the Company began monetizing its investments in Tonogold. During the second half of 2020, the Company received over $5.6 million in cash proceeds from the sale of these shares and still holds over 13 million common shares in shares as of December 31, 2020. The Company also holds approximately $4.5 million, in Tonogold 12% senior secured notes receivable, due on September 20, 2021.
The Company expects to monetize the remainder of these non-strategic assets over the next three to nine months, expecting in excess of $18 million in gross proceeds. This includes closing on the sale of the Silver Springs properties for proceeds of over $10 million, to Sierra Springs Enterprises, Inc., monetizing the remainder of our Tonogold shares for total proceeds of over $4.1 million, and collecting on the Tonogold note of over $4.4 million. The Company will use the proceeds to extinguish over $3.5 million in debt and fund its growth initiatives.
At December 31, 2020, cash and cash equivalents were approximately $2.5 million and total common shares outstanding were 34,980,766 shares, including 540,000 unvested, restricted shares representing board compensation over the next three years, with one-third of such shares vesting on January 1, 2022, 2023 and 2024, respectively.
Mr. De Gasperis concluded, “All of our objectives are designed and aligned toward one goal, for creating over $500 million in value by commercializing environmentally friendly metal processing technologies, like those of MCU, and validating and expanding our mineral resources and royalties. Our monetization objectives allow us to fund and accelerate accretive growth toward our initial goal of $500 million of equity value, or at least $12 per share.”
About Comstock Mining Inc.
Comstock Mining Inc. is a Nevada-based, precious and strategic metal-based exploration, economic resource development, mineral production and metal processing business with a strategic focus on high-value, cash-generating, environmentally friendly, and economically enhancing mining and processing technologies and businesses. The Company has extensive, contiguous property in the historic Comstock and Silver City mining districts (collectively, the “Comstock District”), is an emerging leader in sustainable, responsible mining and processing, and is currently commercializing environment-enhancing, metal-based technologies, products, and processes for precious and strategic metals recovery.
Forward-Looking Statements
This press release and any related calls or discussions may include forward-looking statements within the meaning of Section 27A of the Securities Act of 1933, as amended, and Section 21E of the Securities Exchange Act of 1934, as amended. All statements, other than statements of historical facts, are forward-looking statements. The words “believe,” “expect,” “anticipate,” “estimate,” “project,” “plan,” “should,” “intend,” “may,” “will,” “would,” “potential” and similar expressions identify forward-looking statements, but are not the exclusive means of doing so. Forward-looking statements include statements about matters such as: consummation of all pending transactions; project, asset or Company valuations; future industry market conditions; future explorations, acquisitions, investments and asset sales; future performance of and closings under various agreements; future changes in our exploration activities; future estimated mineral resources; future prices and sales of, and demand for, our products; future impacts of land entitlements and uses; future permitting activities and needs therefor; future production capacity and operations; future operating and overhead costs; future capital expenditures and their impact on us; future impacts of operational and management changes (including changes in the board of directors); future changes in business strategies, planning and tactics and impacts of recent or future changes; future employment and contributions of personnel, including consultants; future land sales, investments, acquisitions, joint ventures, strategic alliances, business combinations, operational, tax, financial and restructuring initiatives; the nature and timing of and accounting for restructuring charges and derivative liabilities and the impact thereof; contingencies; future environmental compliance and changes in the regulatory environment; future offerings of equity or debt securities; asset sales and associated costs; future working capital, costs, revenues, business opportunities, debt levels, cash flows, margins, earnings and growth.
These statements are based on assumptions and assessments made by our management in light of their experience and their perception of historical and current trends, current conditions, possible future developments and other factors they believe to be appropriate. Forward-looking statements are not guarantees, representations or warranties and are subject to risks and uncertainties, many of which are unforeseeable and beyond our control and could cause actual results, developments and business decisions to differ materially from those contemplated by such forward-looking statements. Some of those risks and uncertainties include the risk factors set forth in our filings with the SEC and the following: counterparty risks; capital markets’ valuation and pricing risks; adverse effects of climate changes or natural disasters; global economic and capital market uncertainties; the speculative nature of gold or mineral exploration, including risks of diminishing quantities or grades of qualified resources; operational or technical difficulties in connection with exploration or mining activities; contests over title to properties; potential dilution to our stockholders from our stock issuances and recapitalization and balance sheet restructuring activities; potential inability to comply with applicable government regulations or law; adoption of or changes in legislation or regulations adversely affecting businesses; permitting constraints or delays; decisions regarding business opportunities that may be presented to, or pursued by, us or others; the impact of, or the non-performance by parties under agreements relating to, acquisitions, joint ventures, strategic alliances, business combinations, asset sales, leases, options and investments to which we may be party; changes in the United States or other monetary or fiscal policies or regulations; interruptions in production capabilities due to capital constraints; equipment failures; fluctuation of prices for gold or certain other commodities (such as silver, zinc, cyanide, water, diesel fuel and electricity); changes in generally accepted accounting principles; adverse effects of terrorism and geopolitical events; potential inability to implement business strategies; potential inability to grow revenues; potential inability to attract and retain key personnel; interruptions in delivery of critical supplies, equipment and raw materials due to credit or other limitations imposed by vendors or others; assertion of claims, lawsuits and proceedings; potential inability to satisfy debt and lease obligations; potential inability to maintain an effective system of internal controls over financial reporting; potential inability or failure to timely file periodic reports with the SEC; potential inability to list our securities on any securities exchange or market; inability to maintain the listing of our securities; and work stoppages or other labor difficulties. Occurrence of such events or circumstances could have a material adverse effect on our business, financial condition, results of operations or cash flows or the market price of our securities. All subsequent written and oral forward-looking statements by or attributable to us or persons acting on our behalf are expressly qualified in their entirety by these factors. Except as may be required by securities or other law, we undertake no obligation to publicly update or revise any forward-looking statements, whether as a result of new information, future events, or otherwise.
Neither this press release nor any related calls or discussions constitutes an offer to sell, the solicitation of an offer to buy or a recommendation with respect to any securities of the Company, the fund or any other issuer.
Contact information for
Comstock Mining Inc.
117 American Flat Rd
PO Box 1118
Virginia City, NV 89440
http://www.comstockmining.com
Corrado De Gasperis
Executive Chairman & CEO
Tel (775) 847-4755
degasperis@comstockmining.com
Zach Spencer
Director of External Relations
Tel (775) 847-5272 ext.151
questions@comstockmining.com
Source: Comstock Mining