![]()
Golden Predator Reports Brewery Creek Mine 2020 Drill Results
Significant thicknesses of gold mineralization in 16 of 16 holes
Vancouver, BC, January 25, 2021: Golden Predator Mining Corp. (TSX.V:GPY, OTCQX:NTGSF) (the “Company”) today announces the initial results from 16 of 32 reverse circulation drill holes from the 2020 work program at its licensed 100%-owned Brewery Creek mine project ?located approximately 55 km by road from Dawson City, Yukon.
Drill program highlights include:
- 12.19 m of 1.90 g/t gold from a depth of 76.2 m in drill hole RC20-2683;
- 9.14 m of 2.02 g/t gold from a depth of 6.1 m in drill hole RC20-2687;
- 10.67 m of 1.30 g/t gold from a depth of 4.57m and 15.24 m of 1.63 g/t gold from a depth of 36.58 m in drill hole RC20-2688;
- 21.34 m of 0.83 g/t gold from a depth of 22.86 m in drill hole RC20-2690; and
- 7.62 m of 2.28 g/t gold from a depth of 54.86 m in drill hole RC20-2692
A total of 32 reverse circulation drill holes, totaling 3,706 m, were completed between the Golden and Lucky resource areas in the fall of 2020. The 2020 program was designed to infill within and around two fences of 2019 drilling that encountered mineralization along a 400m gap where there had been no previous drilling between the Golden and Lucky resource areas. The objective was to establish sufficient drill density in this 400m gap to be able to incorporate the Lucky resource into the greater Keg pitshell.
Brewery Creek maps can be viewed at: https://www.goldenpredator.com/_resources/maps/GPY-20-02-Brewery-Creek-2020-Initial-Drill-Results-FINAL.pdf
2020 Brewery Creek Exploration Program – Initial Drill Results
The gold assays for the initial 16 drill holes of the program are reported in this release with significant thicknesses of gold mineralization present in all 16 of the drill holes. The collars of 9 of the drill holes are located outside of the current Golden resource area and the other 7 are located on the eastern margin of the current Golden resource area.
Other significant mineralized intervals include 30.48 m of 0.55 g/t gold from a depth of 77.72 m in drill hole RC20-2682 and multiple intercepts in drill hole RC20-2693 including 21.34 m of 0.32 g/t gold from 25.91 m, 25.91 m of 0.41 g/t gold from 51.82 m, 18.29 m of 0.41 g/t gold from 88.39 m and 9.14 m of 0.41 g/t gold from a depth of 114.3 m.
Gold mineralization is controlled by fractures oriented sub-parallel to the main thrust zone and a series of high angle conjugate fractures developed within main shear zone. Composite mineralized intercepts thicknesses range from 6.10 m to 74.68 m with an average composite mineralized thickness of 31.18 m in these 16 drill holes. Mineralization encountered in these 16 holes consists of sulfide, transitional and lesser amounts of oxide material. Within the area of this drilling the eastern strike extension of the mineralized zone is not yet defined, and the zone remains open at depth down dip. The remaining 16 holes which have in part targeted this eastern extension up to the Lucky resource area will be released when assays are complete.
To view a complete table of results: https://www.goldenpredator.com/_resources/news/BRC-DrillAssays-2020-20210121.pdf.
2020 Exploration Drill Program
The 2020 Brewery Creek drill program consisted of exploration, in-fill, geotechnical, hydrogeologic and metallurgical drilling to advance the Bankable Feasibility Study currently underway and projected for completion in Q1/21. A total of 32 infill reverse circulation drill holes totaling 3,706 m were completed in the gap area between the eastern edge of Golden and western edge of Lucky.
The infill drill program built upon Golden Predator’s successful 2019 program that established continuity of mineralization within the licensed Reserve Trend between the eastern edge of the Canadian-Fosters-Kokanee-Golden pits (Keg pitshell) east to the Lucky pit. The 32 reverse circulation drill holes drilled in 2020 were designed to fill in and expand the gold resource between the eastern Golden zone and western Lucky zone. The targeted mineralization between these zones has been offset by a high-angle normal fault and was previously untested until 2019 when the zone was intersected with multiple drill holes.
Infill drilling within this 400 m gap between the eastern edge of the Fosters to Golden trend and the western edge of the Lucky zone is also to increase the density of drilling to convert Inferred resources to Indicated resources and confirm continuity of mineralization between the two deposits while testing for additional resources. The goal is to establish and confirm continuous mineralization along the Fosters-Canadian-Kokanee-Golden-Lucky zones for mine design now in progress as a part of the Brewery Creek Bankable Feasibility Study (BFS).
Brewery Creek Mine: Resources1
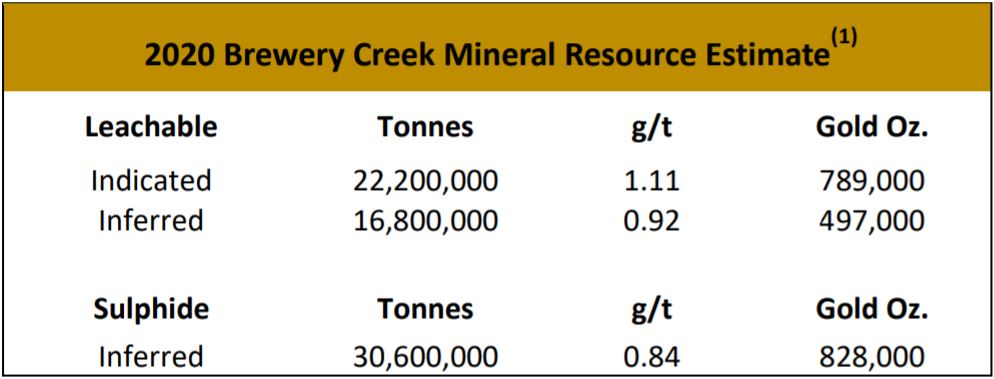
Materials on the heap leach pad were not included in the resource update. Mineral Resources estimates conducted within a pit shell developed at $2,000/oz gold with an internal cut-off grade calculated at $1,500/oz gold was used to report mineral resource inventories
The resource estimate is based on a recovery model created from assay data, bottle and column leach test work and historic recovery analysis instead of a less accurate visual oxide-sulfide boundary developed from geologist drill logs. Sedimentary and intrusive rocks, which have distinct metallurgical characteristics, were estimated separately based on gold-grade distribution analysis.
The current 2020 Mineral Resources Estimate supersedes the 2019 Mineral Resource Estimate. A supporting NI 43-101 Technical Report is filed on SEDAR at www.sedar.com.?
Brewery Creek Mine Work Plan
The Brewery Creek Mine is a licensed brownfields heap leach gold mine that was operated by Viceroy Minerals Corporation from 1996 to 2002. Brewery Creek is authorized to restart mining activities as defined within the Quartz Mining License and Water License. The Company intends to resume mining and processing of licensed deposits when supported by an independent study that outlines technical and economic viability. The 180 km2 property is located 55 km east of Dawson City and is accessible year-round by paved and improved gravel roads. Significant infrastructure remains in place, allowing for a timely restart schedule under existing operating licenses.
A Bankable Feasibility Study (BFS) is being conducted by Kappes Cassiday & Associates of Reno, Nevada which will include a multi-year mine plan for the advancement of the Brewery Creek project. The BFS will include an inventory of the mineralized material remaining on the heap and mine planning (completed by Tetra Tech Inc of Golden, Colorado) for the resumption of the mining of material from leachable resources contained within the licensed area and reported in the Company’s Mineral Resource Estimate. The BFS will include all the key parameters involved in reconstructing or adding necessary infrastructure including a crushing facility, the Adsorption-Desorption-Recovery (“ADR”) plant and assay lab and an implementation schedule, sourcing, and economic cash flow model sufficiently detailed to move directly into procurement, development and construction if economically warranted. Any production decisions would be dependent on the outcome of a study demonstrating positive technical and economic viability.
Sampling Methodology, Quality Control and Assurance
Analyses for drill samples were performed by SGS Canada, Inc., ALS Canada and Bureau Veritas, Canada with sample preparation in Whitehorse, YT and assaying in Burnaby, North Vancouver and Vancouver, BC respectively. Drill samples were analyzed for gold using a 30 gram fire assay with atomic absorption finish (SGS-GO FAA30V10 method, ALS-Au AA-25 method and BV-FA430 method). Quality controls standards include standard reference material, certified blank and field duplicate samples in every sample dispatch.
The technical content of this news release has been reviewed and approved by Jeff Cary, CPG, a Qualified Person as defined by National Instrument 43-101 and a consultant to the Company.
About Golden Predator Mining Corp.
Golden Predator is advancing the past-producing Brewery Creek Mine towards a timely resumption of mining activities, under its Quartz Mining and Water Licenses, in Canada’s Yukon. With established resources grading over 1.0 g/t gold the Company is completing a Bankable Feasibility Study for the restart of heap leach operations. The Brewery Creek Mine project operates with a Socio Economic Accord with the Tr’ondëk Hwëch’in First Nation.
For additional information on Golden Predator Mining Corp.:
Janet Lee-Sheriff
Chief Executive Officer
(604) 260-8435
info@goldenpredator.com
www.goldenpredator.com
Neither TSX Venture Exchange nor its Regulation Services Provider (as that term is defined in policies of the TSX Venture Exchange) accepts responsibility for the adequacy or accuracy of this release. No stock exchange, securities commission or other regulatory authority has approved or disapproved the information contained herein. This press release contains forward-looking information that involve various risks and uncertainties regarding future events. Such forward-looking information can include without limitation statements based on current expectations that the Brewery Creek will advance to an early production decision, or the extent of any additional mineral resource that could result from incorporating 2019 exploration drilling. Actual results and future events could differ materially from those anticipated in such information. These and all subsequent written and oral forward-looking information are based on estimates and opinions of management on the dates they are made and are expressly qualified in their entirety by this notice. Except as required by law, the Company assumes no obligation to update forward-looking information should circumstances or management’s estimates or opinions change.
1. The 2020 Mineral Resource Estimate was conducted in accordance with CIM guidelines and is reported in a NI 43-101 Technical Report which will be filed on SEDAR and the Company’s website within 45 days.
Source: Golden Predator Mining