![]()
Palladium One Drilling at Kaukua South Extends Mineralization Into “Gap Zone”
March 11, 2021 –
Toronto, Ontario – Infill drilling spaced at 100-meter grid spacing has increased continuous mineralization to over 1,300 meters and into the ‘gap zone’, thereby supporting the thesis of potentially more open-pit resources at the Kaukua South zone of the Läntinen Koillismaa (“LK”) PGE-Ni-Cu project in Finland said Palladium One Mining Inc. (“Palladium One” or the “Company”) (TSXV: PDM, FRA: 7N11, OTC: NKORF) today. These interim results are from the 17,500-meter, Phase II Resource Definition drill program at Kaukua South.
Derrick Weyrauch, President and CEO of Palladium One said, “Drilling at Kaukua South has successfully extended known mineralization to the east and west of hole LK20-016 and into the ‘gap zone’ where the Induced Polarization (“IP”) chargeability anomaly was weaker (see – hole LK20-036 and LK20-044 in Figure 1). These results imply that the ‘gap zone’ could host more mineralization than previously thought. Interim results demonstrate continuity now over 1,300 meters. As a result of continued success, we have accelerated our plans and commenced a new 50-line kilometer IP survey to extend the Kaukua South strike length, which we believe has the potential to be over seven kilometers in length.”
Highlights
- Infill drilling continues to
demonstrate continuity of near surface open pit grades and widths. - Core zones up to 9.0 meters grading 3.1 g/t
Palladium equivalent (“Pd_Eq.”) within 32.7 meters grading 2.0 g/t
Pd_Eq. in hole LK21-034. - First drilling in the “gap zone” returns up to 17.0
meters grading 1.38 g/t Pd_Eq. in hole LK21-044 demonstrating continuity of the mineralization in the Kaukua South IP anomaly. - A new IP survey has been initiated to extend the Kaukua South zone from a drill defined four-kilometer strike length to potentially over seven kilometers.
- 34 holes totaling 6,404 meters
have been drilled to date on Kaukua South as part of the 17,500-meter Phase II program.
Kaukua South Infill Drilling
Kaukua South infill drilling continues to demonstrate consistent near surface open pit grades and widths. A total of 13 holes from the Phase II drill program on Kaukua South have now been released with intersections of up to 53 meters at 2.1
g/t Pd_Eq*, and a core interval of up to 25 meters at 2.9 g/t Pd_Eq. in hole LK21-028 (see press release January 18, 2021). These 13 holes cover approximately 1.3 kilometers of the Kaukua South Zone, and have returned very similar widths and grades to those in the Kaukua Open Pit resource. (Figure 1 and 2).
Of particular interested is holes LK20-036 and LK20-044 (Figure 2). These represent the first drill holes drilled in the central area of the Kaukua South chargeability anomaly. This central or “gap zone “is approximately a one-kilometer long zone of lower chargeability. The results from these two holes, plus visual results from three additional holes with assays pending, prove that palladium-rich mineralization does extend into this gap zone, which significant increases the potential size of a future Kaukua South resource.
New IP Survey
IP has proven to be highly successful at outlining palladium-rich disseminated copper-nickel sulphide mineralization on the LK Project, the discovery of Kaukua South in an overburden covered area with no previous drilling was a direct result of the Company’s 2020 IP survey.
The success of the Phase II drill program has prompted to the Company to accelerate plans for an additional 50-line kilometre IP survey and a 640-line kilometer drone magnetic survey. The prime objective is to extend the Kaukua South IP chargeability anomaly at least two kilometers to the east onto the Kaukuanjarvi Permit Application area. Regional airborne magnetic data strongly suggests that favourable Kaukua-style mafic-ultramafic hosts rocks extend into this area.
Additionally, the Company believes there is potential to extend Kaukua South at least one kilometer west of the existing 2020 survey grid. The Company plans to re-survey and expand the historic 2008 IP survey which encountered several technical challenges, resulting in amongst other issues, detecting only half of the mineralization associated with the Kaukua Open Pit Resource (Figure 1).
Taken together these two new IP grids could potentially extend the Kaukua South IP chargeability anomaly to over seven kilometers.
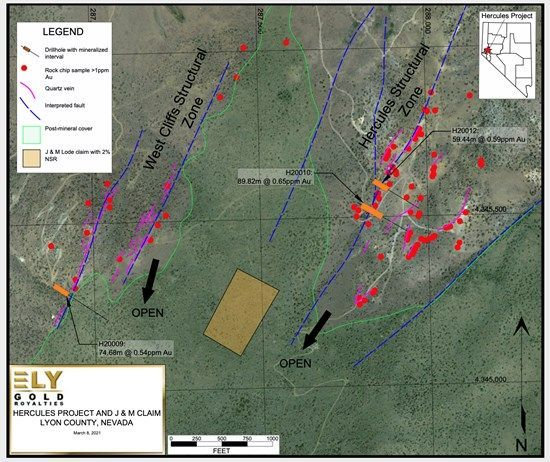
Figure 1. Greater Kaukua area plan map, showingcurrent NI 43-101 Kaukua Deposit conceptual pit outline (dashed yellow), Kaukua South and Murtolampi IP chargeability anomalies, and Palladium One drill hole locations. Holes labels in red form part of this release.
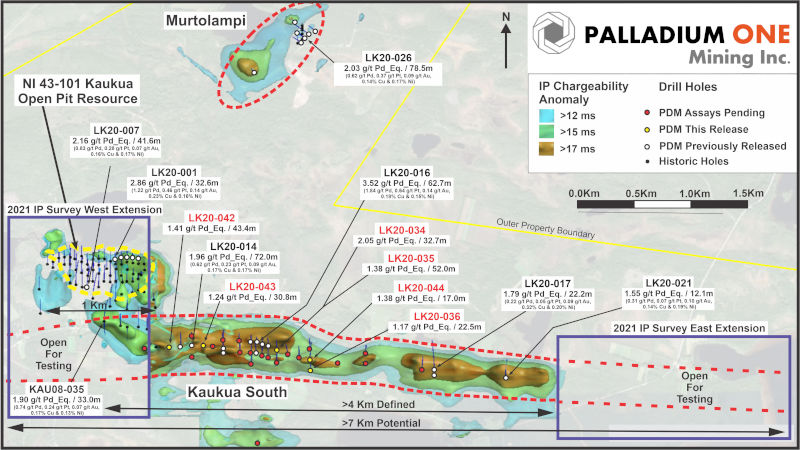
Figure 2. Kaukua South Long section looking north
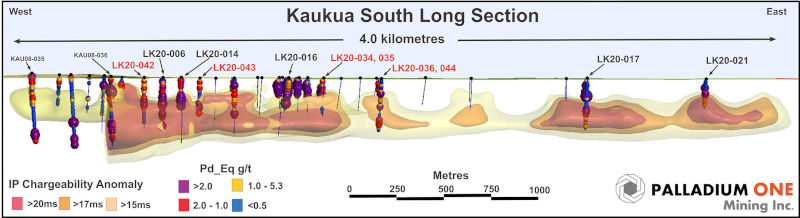
Table 1: Phase II infill drill results to date on Kaukua South
|
Zone |
Hole |
From |
To |
Width |
Pd_Eq |
PGE g/t |
Pd |
Pt |
Au |
Cu |
Ni |
|
Kaukua |
LK20-027 |
103.4 |
155.0 |
51.6 |
1.98 |
1.07 |
0.72 |
0.27 |
0.08 |
0.17 |
0.15 |
|
|
Inc. |
105.6 |
113.0 |
7.4 |
2.58 |
1.34 |
0.90 |
0.31 |
0.13 |
0.26 |
0.18 |
|
|
And |
149.5 |
155.0 |
5.5 |
3.12 |
1.96 |
1.34 |
0.52 |
0.10 |
0.27 |
0.17 |
|
|
Inc. |
153.5 |
155.0 |
1.5 |
6.14 |
4.09 |
2.79 |
1.15 |
0.15 |
0.56 |
0.28 |
|
Kaukua |
LK20-028 |
42.6 |
95.5 |
52.9 |
2.06 |
1.44 |
1.00 |
0.36 |
0.08 |
0.11 |
0.11 |
|
|
Inc. |
46.9 |
72.0 |
25.1 |
2.92 |
2.08 |
1.44 |
0.52 |
0.12 |
0.17 |
0.14 |
|
|
Inc. |
50.5 |
60.0 |
9.5 |
3.56 |
2.52 |
1.75 |
0.61 |
0.16 |
0.23 |
0.16 |
|
Kaukua |
LK20-029 |
37.5 |
62.9 |
25.4 |
2.57 |
1.87 |
1.30 |
0.46 |
0.11 |
0.15 |
0.11 |
|
|
Inc. |
47.0 |
62.0 |
15.0 |
3.16 |
2.36 |
1.65 |
0.58 |
0.13 |
0.17 |
0.13 |
|
|
Inc. |
56.5 |
62.0 |
5.5 |
4.34 |
3.36 |
2.36 |
0.82 |
0.18 |
0.20 |
0.16 |
|
|
Inc |
56.5 |
57.7 |
1.2 |
6.15 |
4.97 |
3.54 |
1.26 |
0.17 |
0.25 |
0.21 |
|
Kaukua |
LK20-030 |
26.4 |
86.5 |
60.1 |
1.88 |
1.00 |
0.68 |
0.24 |
0.07 |
0.17 |
0.14 |
|
|
Inc. |
47.0 |
68.0 |
21.0 |
2.44 |
1.43 |
0.98 |
0.35 |
0.10 |
0.21 |
0.16 |
|
|
Inc. |
53.0 |
54.5 |
1.5 |
3.94 |
2.69 |
1.78 |
0.78 |
0.12 |
0.28 |
0.20 |
|
Kaukua |
LK20-031 |
17.9 |
61.5 |
43.6 |
1.94 |
1.12 |
0.76 |
0.27 |
0.09 |
0.16 |
0.13 |
|
|
Inc. |
17.9 |
55.5 |
37.6 |
2.17 |
1.25 |
0.85 |
0.30 |
0.10 |
0.19 |
0.14 |
|
|
Inc. |
24.5 |
35.0 |
10.5 |
2.81 |
1.60 |
1.09 |
0.39 |
0.11 |
0.27 |
0.18 |
|
Kaukua |
LK20-032 |
60.3 |
108.3 |
48.0 |
1.81 |
0.84 |
0.57 |
0.21 |
0.06 |
0.16 |
0.16 |
|
|
Inc. |
61.4 |
75.0 |
13.7 |
2.12 |
0.90 |
0.58 |
0.23 |
0.09 |
0.22 |
0.20 |
|
Kaukua |
LK20-033 |
41.3 |
85.0 |
43.7 |
1.76 |
0.87 |
0.58 |
0.21 |
0.07 |
0.18 |
0.14 |
|
|
Inc. |
42.7 |
56.3 |
13.7 |
2.33 |
1.21 |
0.83 |
0.28 |
0.10 |
0.21 |
0.18 |
|
Kaukua South |
LK20-034 |
86.9 |
119.5 |
32.7 |
2.05 |
1.16 |
0.81 |
0.26 |
0.09 |
0.16 |
0.15 |
|
|
Inc. |
88.5 |
112.5 |
24.0 |
2.26 |
1.32 |
0.93 |
0.29 |
0.10 |
0.17 |
0.15 |
|
|
Inc. |
88.5 |
97.5 |
9.0 |
3.06 |
1.98 |
1.41 |
0.45 |
0.12 |
0.20 |
0.17 |
|
|
Inc. |
94.5 |
96.0 |
1.5 |
4.20 |
2.94 |
2.15 |
0.66 |
0.14 |
0.25 |
0.20 |
|
Kaukua South |
LK20-035 |
66.0 |
118.0 |
52.0 |
1.32 |
0.63 |
0.44 |
0.15 |
0.04 |
0.11 |
0.11 |
|
|
Inc |
67.5 |
69.0 |
1.5 |
3.49 |
2.44 |
2.10 |
0.27 |
0.07 |
0.23 |
0.15 |
|
|
And |
95.5 |
104.7 |
9.2 |
2.04 |
1.23 |
0.80 |
0.32 |
0.11 |
0.17 |
0.13 |
|
Kaukua South |
LK20-036 |
245.3 |
280.0 |
34.6 |
1.05 |
0.39 |
0.25 |
0.11 |
0.03 |
0.10 |
0.11 |
|
|
Inc. |
257.5 |
280.0 |
22.5 |
1.17 |
0.47 |
0.31 |
0.12 |
0.04 |
0.13 |
0.11 |
|
|
Inc. |
259.0 |
260.5 |
1.5 |
1.72 |
0.86 |
0.62 |
0.16 |
0.07 |
0.15 |
0.14 |
|
Kaukua South |
LK20-042 |
115.5 |
158.9 |
43.4 |
1.41 |
0.77 |
0.53 |
0.19 |
0.05 |
0.09 |
0.12 |
|
|
Inc. |
118.5 |
123.0 |
4.5 |
2.29 |
1.23 |
0.82 |
0.32 |
0.09 |
0.14 |
0.19 |
|
|
And |
133.0 |
146.5 |
13.5 |
1.71 |
1.04 |
0.74 |
0.25 |
0.06 |
0.09 |
0.12 |
|
|
Inc. |
143.5 |
146.5 |
3.0 |
1.97 |
1.47 |
1.13 |
0.28 |
0.06 |
0.08 |
0.09 |
|
Kaukua South |
LK20-043 |
131.5 |
162.3 |
30.8 |
1.24 |
0.55 |
0.36 |
0.15 |
0.04 |
0.11 |
0.12 |
|
|
Inc. |
133.0 |
136.0 |
3.0 |
2.05 |
1.16 |
0.82 |
0.32 |
0.02 |
0.05 |
0.20 |
|
|
And |
187.4 |
188.5 |
1.1 |
2.00 |
1.54 |
1.09 |
0.40 |
0.05 |
0.07 |
0.09 |
|
Kaukua South |
LK20-044 |
156.8 |
173.8 |
17.0 |
1.38 |
0.62 |
0.41 |
0.14 |
0.06 |
0.14 |
0.12 |
|
|
Inc. |
156.8 |
169.5 |
12.7 |
1.58 |
0.71 |
0.48 |
0.17 |
0.07 |
0.16 |
0.14 |
|
|
Inc. |
166.0 |
169.5 |
3.4 |
2.10 |
1.07 |
0.73 |
0.25 |
0.08 |
0.20 |
0.16 |
* Reported widths are “drilled widths” not true widths.
** Orange shaded values previously released (see press release January 18, 2021)
*Palladium Equivalent
Palladium equivalent is calculated using US$1,100 per ounce for palladium, US$950 per ounce for platinum, US$1,300 per ounce for gold, US$6,614 per tonne for copper, and US$15,4332 per tonne for nickel. This calculation is consistent with the calculation in the Company’s September 2019 NI 43-101 Kaukua resource estimate.
QA/QC
The Phase I drilling program was carried out under the supervision of Neil Pettigrew, M.Sc., P. Geo., Vice President of Exploration and a director of the Company.
Drill core samples were split using a rock saw by Company staff, with half retained in the core box and stored indoors in a secure facility, in Taivalkoski, Finland. The drill core samples were transported by courier from the Company’s core handling facility in Taivalkoski, Finland, to ALS Global (“ALS”) laboratory in Outokumpu, Finland. ALS, is an accredited lab and are ISO compliant (ISO 9001:2008, ISO/IEC 17025:2005). PGE analysis was performed using a 30 grams fire assay with an ICP-MS or ICP-AES finish. Multi-element analyses, including copper and nickel were analysed by four acid digestion using 0.25 grams with an ICP-AES finish.
Certified standards, blanks and crushed duplicates are placed in the sample stream at a rate of one QA/QC sample per 10 core samples. Results are analyzed for acceptance at the time of import. All standards associated with the results in this press release were determined to be acceptable within the defined limits of the standard used.
Qualified Person
The technical information in this release has been reviewed and verified by Neil Pettigrew, M.Sc., P. Geo., Vice President of Exploration and a director of the Company and the Qualified Person as defined by National Instrument 43-101.
About Palladium One
Palladium One Mining Inc. is an exploration company targeting district scale, platinum-group-element (PGE)-copper nickel deposits in Finland and Canada. Its flagship project is the Läntinen Koillismaa or LK Project, a palladium dominant platinum group element-copper-nickel project in north-central Finland, ranked by the Fraser Institute as one of the world’s top countries for mineral exploration and development. Exploration at LK is focused on targeting disseminated sulfides along 38 kilometers of favorable basal contact and building on an established NI 43-101 open pit resource.
ON BEHALF OF THE BOARD
“Derrick
Weyrauch”
President & CEO,
Director
For further information contact: Derrick Weyrauch, President
& CEO
Email: info@palladiumoneinc.com
Neither the TSX Venture Exchange nor its Market Regulator (as
that term is defined in the policies of the TSX Venture Exchange) accepts
responsibility for the adequacy or accuracy of this release.
This
press release includes “forward-looking information” that is subject
to a few assumptions, risks and uncertainties, many of which are beyond the
control of the Company. Statements regarding listing of the Company’s common
shares on the TSXV are subject to all of the risks and uncertainties normally
incident to such events. Investors are cautioned that any such statements are
not guarantees of future events and that actual events or developments may
differ materially from those projected in the forward-looking statements. Such
forward-looking statements represent management’s best judgment based on
information currently available. Factors that could cause the actual results to
differ materially from those in forward-looking statements include regulatory actions
and general business conditions. Such forward-looking information reflects the
Company’s views with respect to future events and is subject to risks,
uncertainties and assumptions, including those set out in the Company’s annual
information form dated April 29, 2020 and filed under the Company’s profile on
SEDAR at www.sedar.com.
The Company does not undertake to update forward?looking
statements or forward?looking information,
except as required by law. Investors are cautioned that any such statements are
not guarantees of future performance and actual results or developments may
differ materially from those projected in the forward-looking statements.
Source: Palladium One Mining Inc.